Crypto World
Apple: Earnings Day Above the Activity Zone

On 30 April, after the market close, Apple Inc. will release its financial results for the second quarter of fiscal 2026. The consensus forecast, based on estimates from 31 analysts, points to revenue of around $109.7 billion, with expected EPS of approximately $1.95. The first quarter set a high benchmark: revenue reached a record $143.8 billion, up 16% year-on-year, while EPS came in at $2.84. However, investors are focusing less on the headline figures and more on management’s outlook. The market is looking for confirmation of a strong iPhone cycle, continued growth in services, as well as signals regarding China and the company’s AI strategy. Additional uncertainty stems from trade policy: new Section 301 investigations into Chinese manufacturing continue to weigh on the company’s supply chain, while rising memory costs are increasingly acting as a headwind to growth.
Technical picture

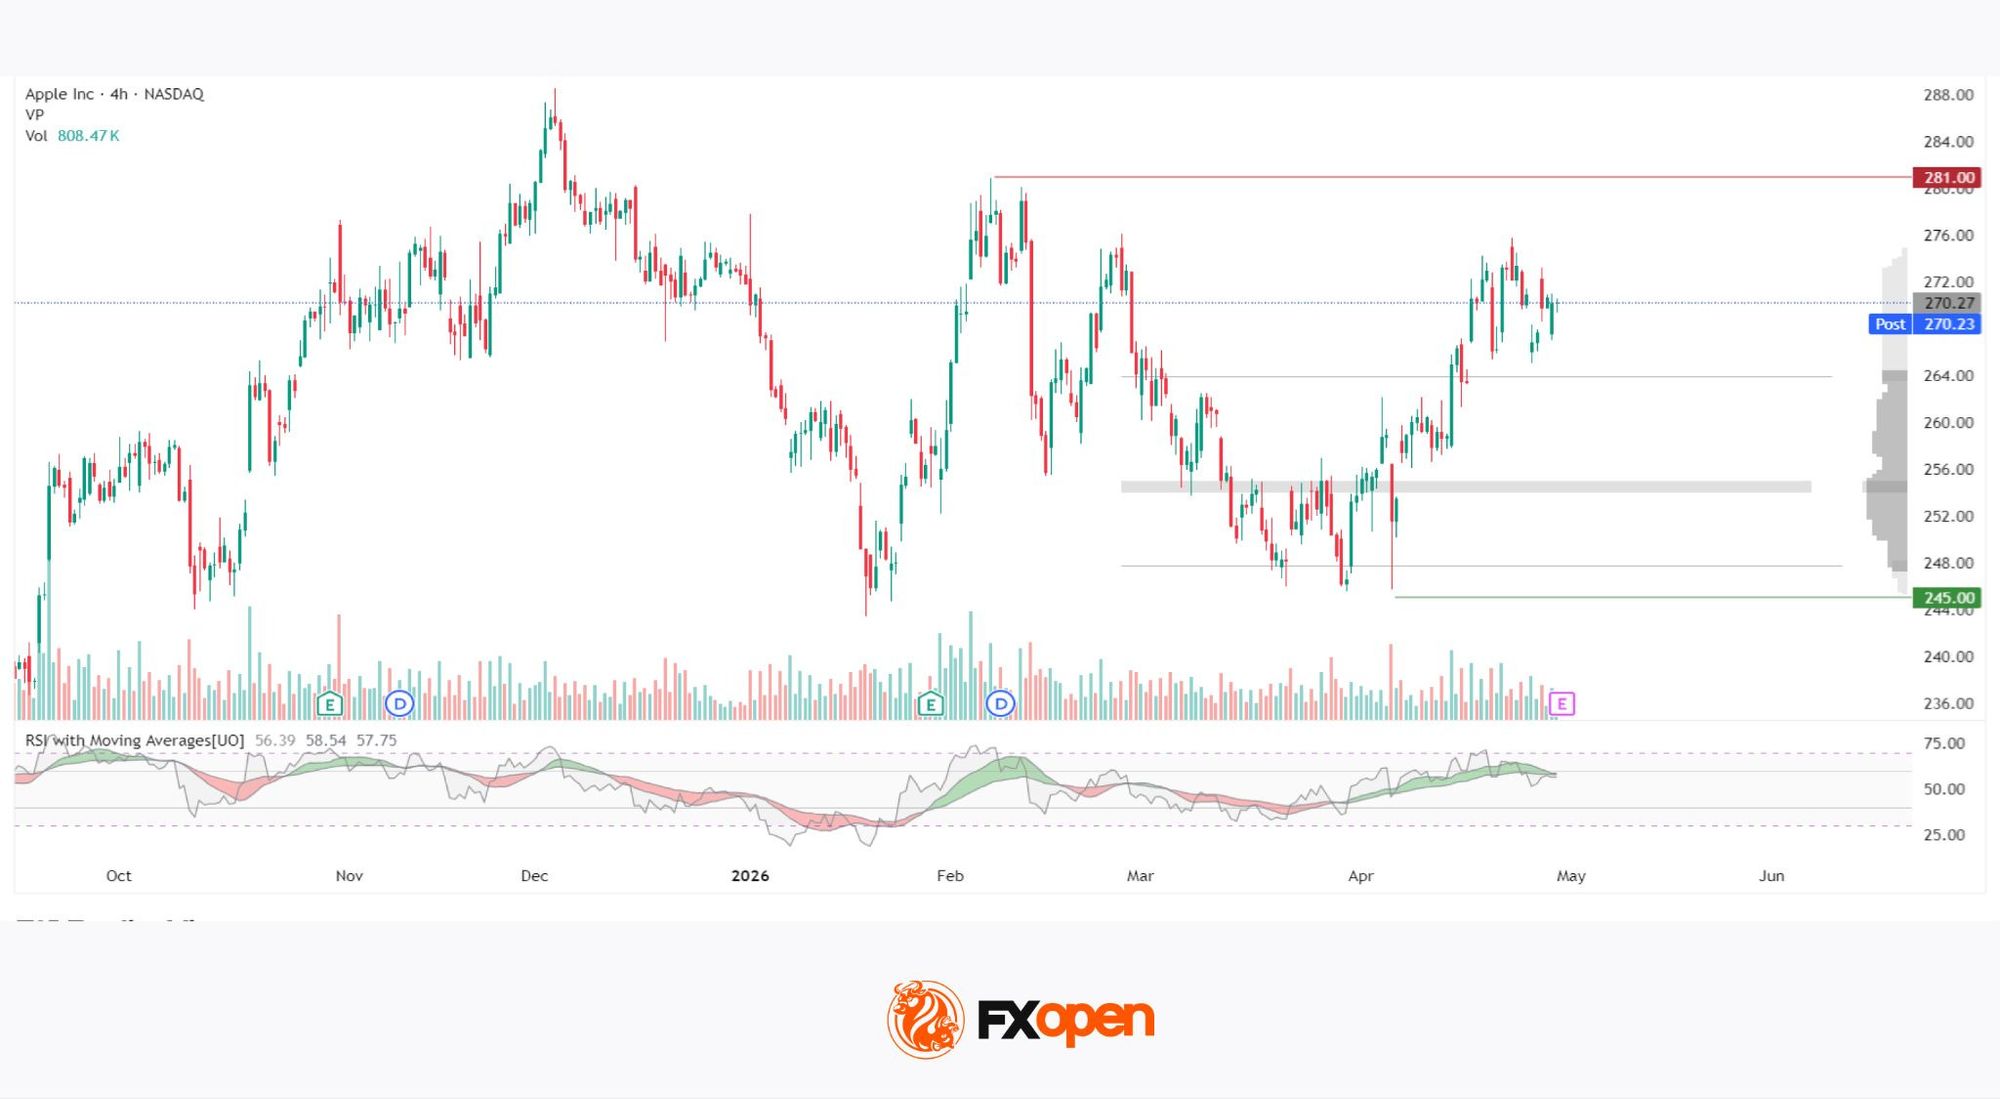
On the 4-hour chart, a broad sideways range has been in place since October last year. Strong resistance within this range is located around $280, which coincides with the February high and has repeatedly capped price advances. The lower boundary is established near $245, a level that has also seen multiple reversals. The horizontal volume balance zone spans $248–$264, with the point of control around $254–$255. The current price, near $270, is trading above this zone — in an area of lower trading activity where price movements tend to be less stable.
The vertical volume on 7 April stands out across the entire profile — this is when the price rebounded from the lower boundary of the range and, following a gap, began its recovery. The RSI + MAs indicator shows readings of 56, 58 and 57: the oscillator is positioned below both moving averages, indicating continued moderate upward pressure without signs of overheating.
Key Takeaways
The stock approaches its earnings release in a technically mixed position: the price has moved beyond the high-volume zone, while a significant gap remains before the $280 resistance level. The tone of management guidance — particularly regarding margins and China — is likely to determine whether the current momentum can be sustained or whether the price returns to the area of higher trading density.
Buy and sell stocks of the world’s biggest publicly-listed companies with CFDs on FXOpen’s trading platform. Open your FXOpen account now or learn more about trading share CFDs with FXOpen.
This article represents the opinion of the Companies operating under the FXOpen brand only. It is not to be construed as an offer, solicitation, or recommendation with respect to products and services provided by the Companies operating under the FXOpen brand, nor is it to be considered financial advice.
You must be logged in to post a comment Login