
Crypto World
As bitcoin (BTC) price extends declines, industry figures say it’s time to buy: Crypto Daybook Americas
By Francisco Rodrigues (All times ET unless indicated otherwise)
Bitcoin dropped for a third straight day after failing to remain above the $70,000 hit during the weekend recovery as spot trading volumes thinned and theCrypto Fear and Greed Index held in “extreme fear” territory.
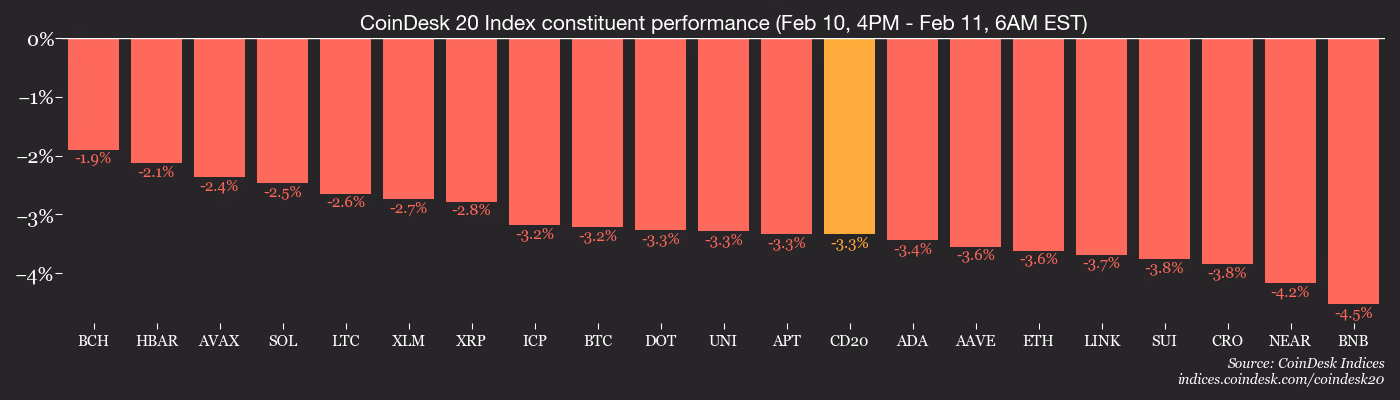
The broader crypto market capitalization has slipped to about $2.28 trillion, with the CoinDesk 20 (CD20) index losing 3.4% over the past 24 hours. Even so, onchain data aggregator Glassnode described the pullback as modest by past standards, with no signs of panic selling seen in prior cycle peaks.
Despite the lower volumes and poor sentiment, inflows to spot bitcoin ETFs have been steady over the past three days, helping absorb some selling pressure. The market is now in a price discovery phase, according to Wintermute.
“With spot volumes still relatively light, leverage is driving short term moves as was illustrated by BTC squeezing back up from the lows last friday on the back of heavily crowded perp shorts,” Wintermute desk strategist Jasper De Maere wrote in an emailed note. “It’s likely the market will continue to whip across this range as its still in price discovery.“
Major figures appear to remain bullish. Speaking at Consensus Hong Kong, Tom Lee, chief investment officer of Fundstrat and chairman of ether treasury firm BitMine Immersion (BMNR), told investors they should look for entry points rather than try to time a bottom.
On CNBC, Michael Saylor, executive chairman of bitcoin treasury firm Strategy (MSTR), reiterated his long-term bet on the cryptocurrency, saying he expects it to outperform traditional equities despite the drawdown.
Weak U.S. retail sales have moderately lifted U.S. interest rate-cut expectations and weighed on the dollar. Now, attention will switch to today’s nonfarm payrolls figures and inflation data, which could further influence risk appetite. Stay alert.
Read more: For analysis of today’s activity in altcoins and derivatives, see Crypto Markets Today
What to Watch
For a more comprehensive list of events this week, see CoinDesk’s “Crypto Week Ahead“.
- Crypto
- Feb. 11: Immutable to complete the merge of Immutable X and Immutable zkEVM.
- Macro
- Feb. 11, 8:30 a.m.: U.S. nonfarm payrolls for January Est. 70K (Prev. 50K)
- Feb. 11, 8:30 a.m.: U.S. unemployment rate for January Est. 4.4%(Prev. 4.4%)
- Feb. 11, 8:30 a.m.: U.S. average hourly earnings for January YoY Est. 3.8% (Prev. 3.6%)
- Earnings (Estimates based on FactSet data)
Token Events
For a more comprehensive list of events this week, see CoinDesk’s “Crypto Week Ahead“.
- Governance votes & calls
- Feb. 11: Ripple to host XRP Community Day on X Spaces discussing XRP adoption, regulated finance and innovation.
- Unlocks
- Token Launches
- Feb. 11: Coinbase to list RaveDAO (RAVE), DeepBook (DEEP), and Walrus (WAL).
Conferences
For a more comprehensive list of events this week, see CoinDesk’s “Crypto Week Ahead“.
Market Movements
- BTC is up 0.25% from 4 p.m. ET Tuesday at $66,868.63 (24hrs: -3.14%)
- ETH is down 2.96% at $1,947.84 (24hrs: -3.25%)
- CoinDesk 20 is down 2.75% at 1,900.89 (24hrs: -3.53%)
- Ether CESR Composite Staking Rate is up 1 bp at 2.83%
- BTC funding rate is at -0.0023% (-2.536% annualized) on Binance

- DXY is down 0.3% at 96.50
- Gold futures are up 1.73% at $5,117.80
- Silver futures are up 6.22% at $85.39
- Nikkei 225 closed up 2.28% at 57,650.54
- Hang Seng closed up 0.31% at 27,266.38
- FTSE is up 0.50% at 10,405.94
- Euro Stoxx 50 is down 0.41% at 6,022.26
- DJIA closed on Tuesday up 0.1% at 50,188.14
- S&P 500 closed down 0.33% at 6,941.81
- Nasdaq Composite closed down 0.59% at 23,102.47
- S&P/TSX Composite closed up 0.71% at 33,256.83
- S&P 40 Latin America closed down 0.57% at 3,746.47
- U.S. 10-Year Treasury rate is down 1 bps at 4.135%
- E-mini S&P 500 futures are unchanged at 6,966.50
- E-mini Nasdaq-100 futures are unchanged at 25,218.00
- E-mini Dow Jones Industrial Average Index futures are up 0.13% at 50,338.00
Bitcoin Stats
- BTC Dominance: 59.12% (-0.29%)
- Ether-bitcoin ratio: 0.02914 (-0.81%)
- Hashrate (seven-day moving average): 1,002 EH/s
- Hashprice (spot): $33.56
- Total fees: 2.6 BTC / $179,640
- CME Futures Open Interest: 120,785 BTC
- BTC priced in gold: 13.1 oz.
- BTC vs gold market cap: 4.46%
Technical Analysis

- BTC/USD is currently hovering below the 200-week exponential moving average, a critical support level that must be reclaimed to prevent further downside.
- The market now awaits the weekly close to confirm whether this breach marks a definitive breakdown or a temporary deviation.
Crypto Equities
- Coinbase Global (COIN): closed on Tuesday at $162.51 (-2.83%), -3.39% at $157.00 in pre-market
- Circle Internet (CRCL): closed at $59.75 (-0.58%), -1.84% at $58.65
- Galaxy Digital (GLXY): closed at $21.19 (+0.19%), -1.75% at $20.82
- Bullish (BLSH): closed at $32.05 (+0.00%), -1.68% at $31.51
- MARA Holdings (MARA): closed at $7.66 (-4.96%), -3.13% at $7.42
- Riot Platforms (RIOT): closed at $14.83 (-0.94%), -2.29% at $14.49
- Core Scientific (CORZ): closed at $18.13 (-2.26%), -2.48% at $17.68
- CleanSpark (CLSK): closed at $10.03 (-1.57%), -2.49% at $9.78
- CoinShares Valkyrie Bitcoin Miners ETF (WGMI): closed at $42.62 (-2.76%)
- Exodus Movement (EXOD): closed at $10.86 (+1.12%)
Crypto Treasury Companies
- Strategy (MSTR): closed at $133.00 (-3.93%), -3.12% at $128.85
- Strive (ASST): closed at $9.18 (-9.51%), -3.27% at $8.88
- SharpLink Gaming (SBET): closed at $6.65 (-6.47%), -0.60% at $6.61
- Upexi (UPXI): closed at $0.98 (-7.14%), +1.96% at $0.99
- Lite Strategy (LITS): closed at $1.03 (-1.90%)
ETF Flows
Spot BTC ETFs
- Daily net flows: $166.5 million
- Cumulative net flows: $54.98 billion
- Total BTC holdings ~1.27 million
Spot ETH ETFs
- Daily net flows: $13.8 million
- Cumulative net flows: $11.91 billion
- Total ETH holdings ~5.84 million
Source: Farside Investors
While You Were Sleeping


Brazil’s main stock exchange B3 will begin offering six new derivatives contracts on April 27 that allow investors to bet on the likelihood of future events, ranging from the price of bitcoin to movements in the dollar and Ibovespa index.
The instruments, called Event Contracts, operate on a framework similar to prediction markets like Kalshi and Polymarket. Prices range up to 100 reals ($19), with each contract’s price reflecting the market’s estimated probability of an outcome.
B3’s contracts are regulated by Brazil’s securities authority (CVM) and designed for professional investors, the exchange said.
The six contracts cover mini futures and spot prices for the Ibovespa index, the U.S. dollar, and bitcoin. They are structured with fixed payouts and known risks from the outset, like crypto price prediction markets on Kalshi and Polymarket.
Traders won’t take delivery of the underlying assets, and settlement is instead cash-based. For now, only investors with more than 10 million reals ($1.9 million) in assets or CVM certification can trade the new products.
B3’s vice president of Products and Clients, Luiz Masagão, said the launch is part of a broader push to modernize derivatives trading in Brazil.
The exchange already offers contracts tied to central bank decisions in several countries and has watched the growth of predictive platforms abroad closely, Masagão added.
The exchange late last year revealed it’s working on its own tokenization platform and stablecoin, both expected to be launched this year.
B3’s launch marks the first federally regulated prediction market in Brazil, though it enters an increasingly crowded field. Platforms like Prévias and Palpitada have been operating domestically in a regulatory gray area, while U.S.-based Kalshi recently partnered with XP International, Brazil’s largest brokerage, to offer event contracts tied to Brazilian economic outcomes.
The move also comes amid a global prediction market boom. Notional volume is now nearing $160 billion, according to a Dune dashboard, while unique users have crossed the 3 million mark.
Polymarket and Kalshi dominate the space globally, accounting for most of the notional volume. Intercontinental Exchange, the owner of the New York Stock Exchange, recently doubled down on Polymarket and bringing its total commitment to nearly $2 billion.
Still, the regulatory landscape remains unsettled on both sides of the equator. In Brazil, legal experts say it’s unclear whether oversight of prediction markets should ultimately fall to the CVM, the Central Bank, or the Ministry of Finance.
[The stream is slated to start at 10:30 a.m. ET. CNBC Television will start the stream when the event begins. Please refresh the page if you do not see a player above.]
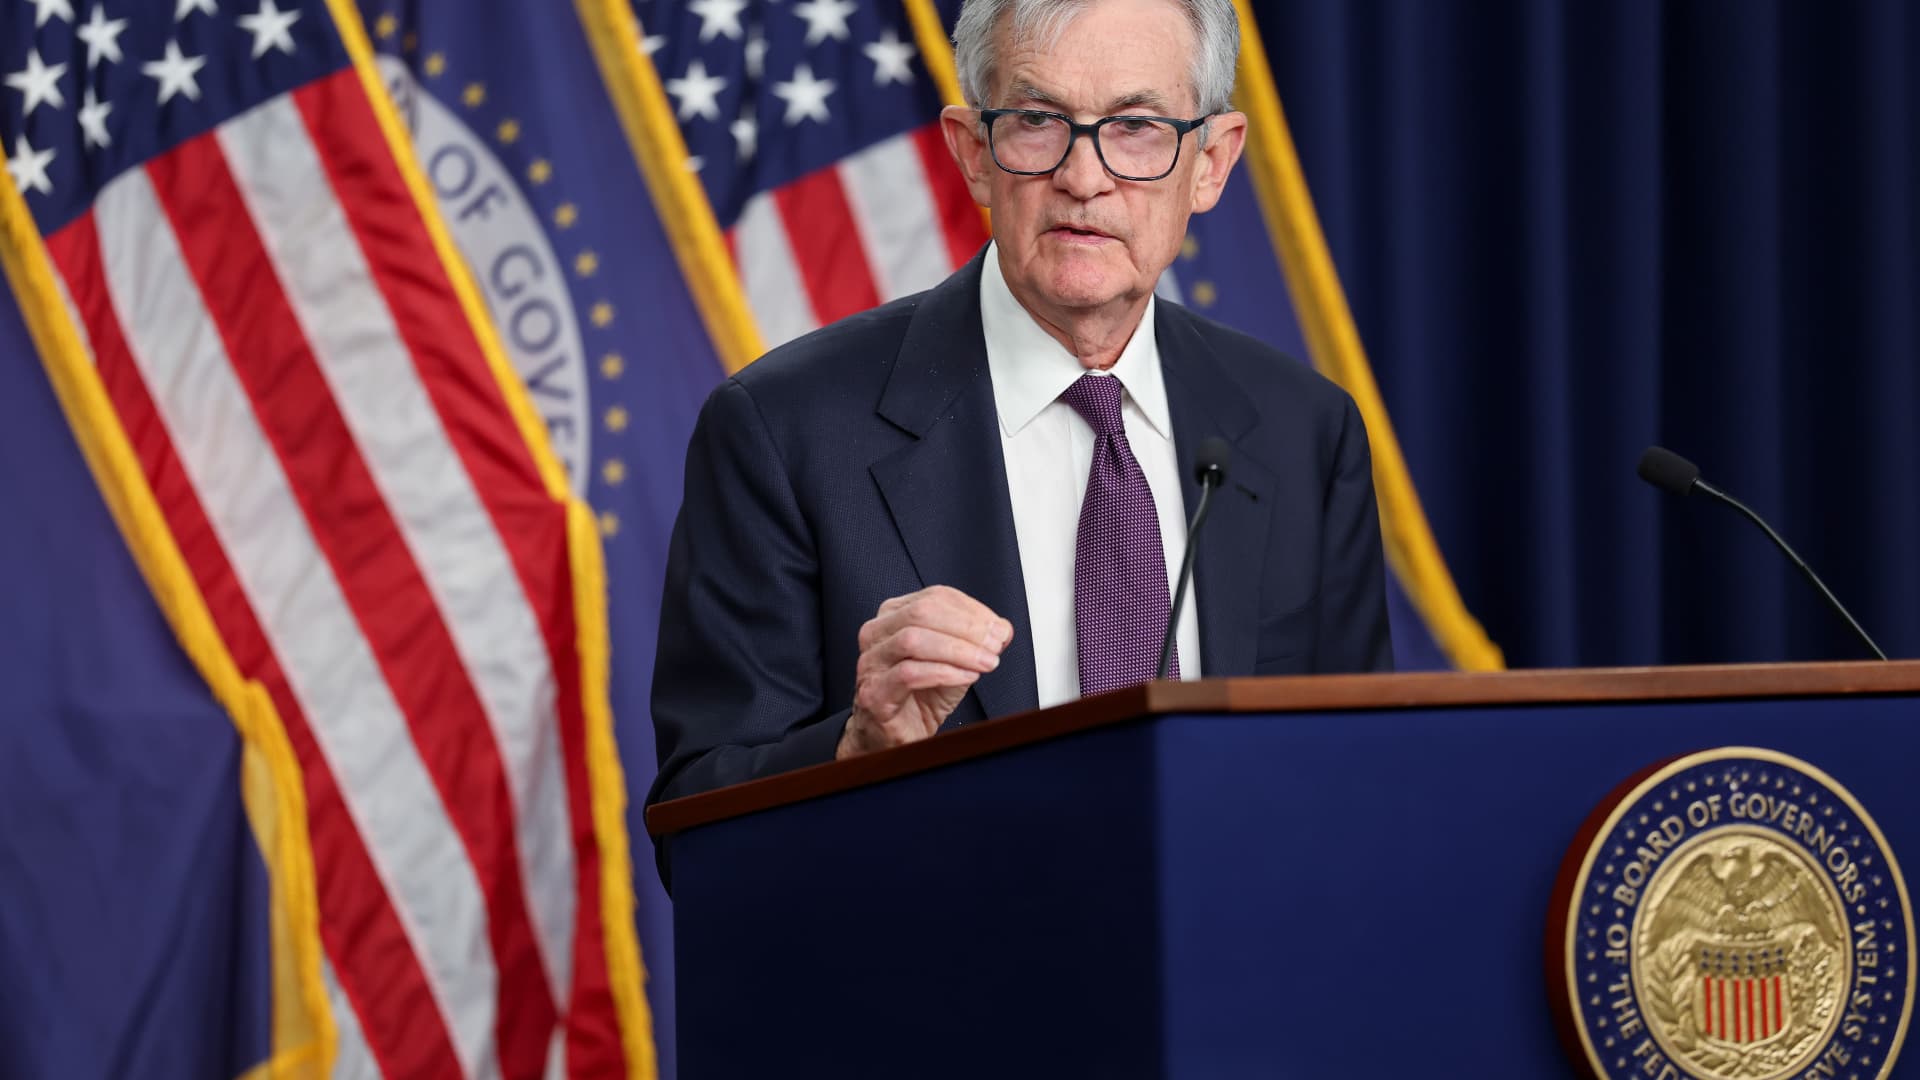
Federal Reserve Chair Jerome Powell speaks Monday to the Harvard University Principles of Economics class.
This will be one of Powell’s final scheduled public appearances before his term ends in May. The discussion comes with markets anticipating the central bank will be on hold regarding interest rates through the end of the year.
In his most recent comments, Powell characterized the economy as growing at “a solid pace” and said he is not concerned with worries of stagflation, low growth with high inflation. However, he noted that policymakers are taking a cautious approach as multiple factors play out this year, including the Iran war, tariffs and a stagnant labor market.
Powell’s term ends officially on May 15, and there is only one more policy meeting between now and then. However, it’s possible he will stay in the position longer if the Senate does not confirm is designated successor, former Governor Kevin Warsh.
The nomination currently is being held up in the Senate Banking Committee as U.S. Attorney Jeanine Pirro continues an investigation into the renovations at the Fed’s headquarters. A judge already has quashed a subpoena Pirro’s office sent to Powell, though she is appealing that decision.
Read more:
Recession odds climb on Wall Street as economy shows cracks beneath the surface
Fed’s Goolsbee says he’s worried about inflation in ‘fraught but intense’ climate
Fed Governor Waller urges caution for now, says rate cuts possible later in the year
Tokenization has become one of crypto’s favorite buzzwords, but Grayscale head of research Zach Pandl said investors should think about it less as a single trade and more as a long roadmap with different winners at different stages.
Speaking at EthCC conference in Cannes, France, Pandl said that the trend is still in its infancy. Tokenized assets — the process of using blockchain rails to settle, transfer and record ownership of all kinds of financial assets such as bonds, funds and equities — is rapidly growing. However, currently at $27 billion, it still represents roughly 0.01%, a tiny fraction, of global capital markets. That’s projected to swell to near $19 trillion by 2033, according to BCG and Ripple.
Big banks and asset managers already understand the opportunity. “The two things that institutions are aware of are stablecoins and tokenization,” Pandl said. But they are still trying to figure out where to allocate capital to actually benefit from these innovations.
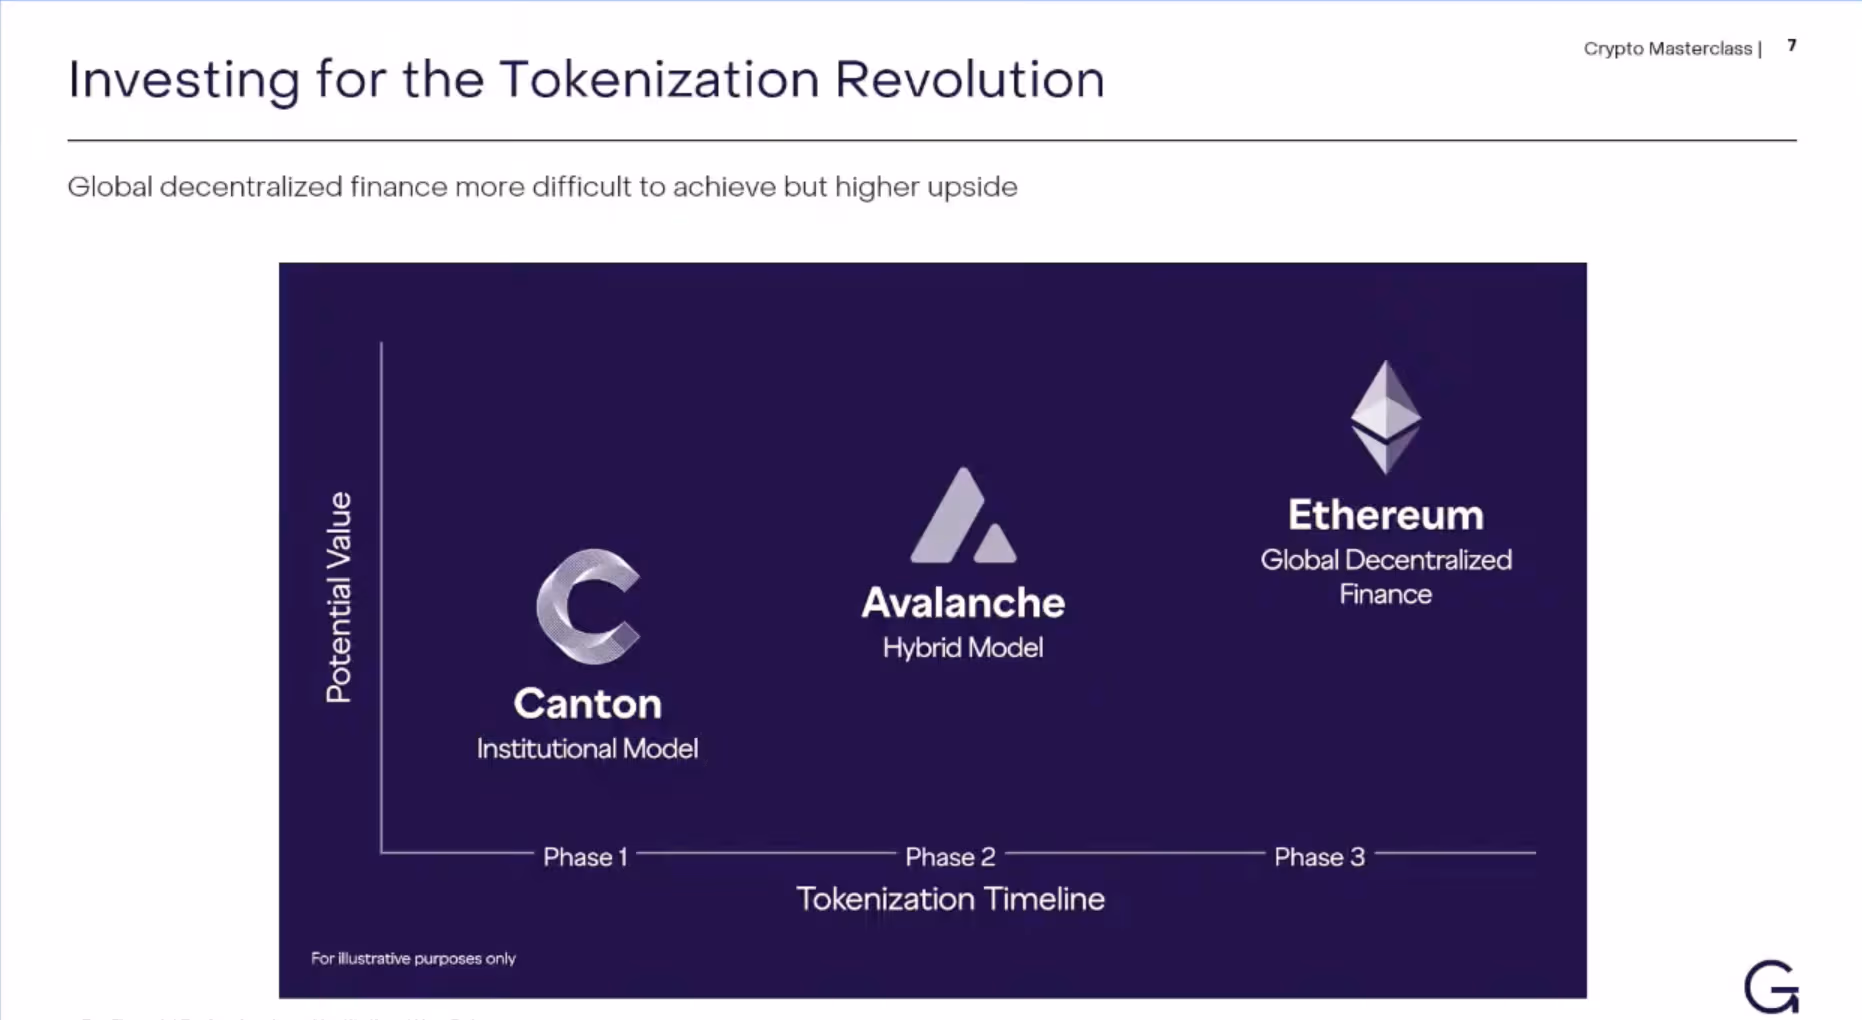
From here, Pandl expects tokenization to unfold in phases, with different types of networks and models capturing value at each stage.
The first winners, he said, may be projects that look more like traditional finance, not less.
“In the early stages of the tokenization process, you will see things that have success that look more similar to how the financial system works today,” he said.
That means institution-centric, permissioned systems that solve practical issues like privacy, identity and control.

Pandl pointed to the Canton Network (CC), backed by Wall Street giants like DRW, TradeWeb, Goldman Sachs and Nasdaq, as a potential winner in this early phase of tokenization.
He said it is “a perfectly reasonable investment” for investors who want nearer-term traction, even if Canton’s approach represents only “a slightly different, slightly upgraded version” of today’s financial system.
The second phase
The second phase of tokenization could be a hybrid model where we have both institution-owned blockchains and a global shared state, with those networks interconnected and speaking to each other. One example for that is Avalanche (AVAX), with hundreds of sovereign, corporate-owned chains (called subnets) live but connected to a primary, layer-1 network.
Ethereum’s ether (ETH), in his view, is the bigger but slower bet. Pandl said he believes the market will eventually move toward “global decentralized finance,” but added that “the tech is not fully ready” and that institutions are not ready either.
That makes ETH the more ambitious investment for those willing to wait for the longer-term shift away from financial intermediaries.
There are also picks-and-shovels plays. Pandl highlighted chain-agnostic service providers such as Chainlink as another way to get exposure, saying they may be “even more compelling” than some blockchains.
Read more: How tokenized assets could become a $400 billion market in 2026


Network News
GOOGLE SAYS BREAKING BITCOIN IS EASIER THAN PREVIOUSLY THOUGHT: Breaking the Bitcoin blockchain with quantum computers may not be as difficult as once thought, and Bitcoin’s Taproot technology, which enables more efficient, private transactions, may be partly to blame, Google’s Quantum AI team said in a blog post and newly published whitepaper. The team said the computing power required to break Bitcoin’s security may be far lower than previously assumed, raising fresh questions about how soon quantum threats could become a reality.In a new whitepaper, researchers found that cracking the cryptography used by Bitcoin and Ethereum could require fewer than 500,000 physical quantum bits, or qubits, well below the “millions” often cited in recent years. Google has previously pointed to 2029 as a potential milestone for useful quantum systems, saying migration needs to come before that, making the paper’s finding that attacks may require less computing power more significant. Quantum computers use qubits instead of traditional bits and can solve certain problems much faster than today’s machines. One of those problems is breaking the type of encryption that protects crypto wallets.Google said it designed two potential attack methods, each requiring roughly 1,200 to 1,450 high-quality qubits. That is a fraction of earlier estimates and suggests the gap between current technology and a viable attack may be smaller than investors think. The research also outlines how such an attack could work in practice. Rather than targeting old wallets, a quantum attacker could go after transactions in real time. When someone sends bitcoin, a piece of data called a public key is briefly revealed. A fast enough quantum computer could use that information to calculate the private key and redirect the funds. — Sam Reynolds Read more.
OPENAI RAISES RECORD $122 BILLION: Artificial intelligence giant OpenAI has closed $122 billion in committed capital at an $852 billion post-money valuation, a round that dwarfs anything raised in private markets and cements the company as the most valuable startup in history by a wide margin. The funding was anchored by Amazon, Nvidia, and SoftBank, with continued participation from Microsoft. SoftBank co-led alongside a16z, D.E. Shaw Ventures, MGX, TPG, and accounts advised by T. Rowe Price. The investor list reads like a who’s who of global capital — BlackRock, Blackstone, Fidelity, Sequoia, Temasek, Coatue, and ARK Invest all participated. For the first time, OpenAI opened participation to individual investors through bank channels, raising over $3 billion from that tranche alone. OpenAI said it is generating $2 billion in revenue per month, up from $1 billion per quarter at the end of 2024. ChatGPT has more than 900 million weekly active users and over 50 million subscribers. The company claims 6x the monthly web visits and mobile sessions of the next largest AI app, and 4x the total time spent of all other AI apps combined. — Shaurya Malwa Read more.
HOW BITCOIN, ETHEREUM, AND SOLANA ARE PREPARING FOR Q-DAY: As quantum computing edges closer to practical reality, the crypto industry is beginning to confront a question it has long deferred: what happens if the cryptography underpinning trillions of dollars in digital assets no longer holds? The answers, so far, are anything but uniform. Across many of the most well-known ecosystems like Bitcoin, Ethereum, and Solana, responses are diverging along familiar lines: what to do on social consensus and technical iteration, and community members are split between caution and acceleration. Quantum computing is a fundamentally different approach to computation that uses the principles of quantum mechanics rather than classical physics. Instead of traditional bits that are either 0 or 1, quantum computers use “qubits,” which can exist in multiple states at once, a property known as superposition, allowing them to process many possibilities simultaneously. Combined with another feature called entanglement, this enables quantum machines to solve certain complex problems far more efficiently than classical computers, particularly tasks like factoring large numbers that underpin modern encryption. How threatening is quantum computing? Consider this: Quantum computers can solve extremely complex problems within seconds, whereas ‘Supercomputers,’ the most powerful computing machines available today, would take thousands of years for the same problems, according to IBM. And that’s why the threats to cryptographic networks stemming from quantum computing are concerning. And even Google, developer of Willow, a quantum supercomputer, is setting a 2029 deadline to migrate its authentication services to post-quantum cryptography, citing progress in the technology. — Margaux Nijkerk Read more.
BASE TEAM RELEASES 2026 ROADMAP: Base, the layer-2 network from Coinbase (COIN), is doubling down on its push to build what it calls a “global onchain economy,” outlining a 2026 strategy centered on markets, payments and developers. Base is one of the most widely used layer-2 networks in the Ethereum ecosystem, having opened to public use in August 2023. It was initially built using Optimism’s OP Stack as part of the broader “Superchain” ecosystem, though the project has since signaled plans to differentiate its infrastructure as it scales. In February, the Coinbase team said the chain will increasingly rely on its own, in-house code. Layer-2 blockchains are built on top of Ethereum and aim to increase speed and lower costs by processing transactions themselves, while still relying on Ethereum for security. The model has become a key part of Ethereum’s scaling strategy, enabling cheaper and faster transactions without moving activity entirely off the network. More recently, however, some Ethereum leaders, including co-founder Vitalik Buterin, have signaled a shift in focus toward scaling the base layer itself, leaving open questions about how layer-2 networks will fit into Ethereum’s evolving roadmap. For 2026, Base said it will focus on three areas: expanding onchain markets, scaling stablecoin-based payments and growing its developer ecosystem — a push that comes as onchain trading venues and stablecoins see rising adoption among institutional players. — Margaux Nijkerk Read more.
In Other News
- Bitcoin’s reputation has historically been built on extreme boom-and-bust cycles, with steep drawdowns of up to 90% following all-time highs. This cycle, however, the decline has been closer to 50%, a shift that analysts said reflects the maturation of BTC as an asset class. “Bitcoin’s drawdowns compressing to about 50% is a sign of a maturing market structure,” AdLunam co-founder and market analyst Jason Fernandes told CoinDesk. “As liquidity deepens and institutional participation increases, volatility naturally compresses on both the upside and the downside,” he added, saying that “at that point, the narrative shifts from questioning its legitimacy to optimizing allocation.” Fernandes’ comments are in response to Fidelity Digital Assets analyst Zack Wainwright’s X post Tuesday, in which he noted growth is becoming “less impulsive,” with a reduced probability of extreme downside events as bitcoin matures. — Olivier Acuna Read more.
- In Jack Dorsey’s view of the world, the job most at risk from the AI revolution is the middle manager. Dorsey argues in a new essay, “From Hierarchy to Intelligence,” published with Roelof Botha, Sequoia Capital’s managing partner, an investor in Block, that his company’s decision to cut approximately 4,000 of its more than 10,000 employees was not a cost reduction but a permanent restructuring to replace middle managers with AI. Corporate hierarchy, the essay argues, has always existed to solve one problem: routing information through organizations too large for any single person to oversee. Managers aggregate context from below, act as messengers from above, and maintain alignment across teams. AI can now perform those functions continuously and at scale, the authors argue, making the messenger redundant. In place of management layers, Dorsey and Botha proposes two AI-driven “world models.” One aggregates internal data from code, decisions, workflows, and performance metrics to create a continuously updated picture of company operations, replacing the context that managers traditionally carried. The other maps customer and merchant behavior using transaction data from Cash App and Square. — Sam Reynolds Read more.
Regulatory and Policy
- Australia passed legislation creating its first comprehensive regulatory framework for digital assets that requires crypto exchanges and custody providers to obtain financial services licenses. The Corporations Amendment (Digital Assets Framework) Bill 2025 cleared both houses on April 1, bringing firms that hold digital assets on behalf of customers into the existing Australian Financial Services Licence regime. Australia’s bill creates two new regulated categories under the Corporations Act: digital asset platforms, which hold crypto on behalf of users, and tokenized custody platforms, which hold real-world assets and issue a corresponding digital tokens. Operators of both must obtain an Australian Financial Services License from ASIC, bringing them under the same core rules as brokers or fund managers, including requirements to safeguard client assets, provide standardized disclosures, avoid misleading conduct, and maintain dispute resolution and compensation systems. Instead of regulating crypto itself, the law targets the companies in the middle that control customer funds, aiming to reduce risks like commingling, insolvency, and misuse of assets that have caused losses in past crypto failures. — Sam Reynolds Read more.
- Hong Kong has missed its own March timeline for HKD stablecoin licensing, with the Hong Kong Monetary Authority (HKMA) yet to approve any issuers despite public signals that the rollout would begin last month. At Consensus Hong Kong in February, Financial Secretary Paul Chan Mo-po said licenses would begin to be issued in March as part of the city’s push to position itself as a regulated hub for stablecoins and tokenized finance. The lack of approvals so far pushes that timeline into April and raises questions about how quickly the framework will move from policy to implementation. “In giving our licenses, we ensure that licensees have novel use cases, a credible and sustainable business model and strong regulatory compliance capabilities,” he said at CoinDesk’s Hong Kong conference.— Sam Reynolds Read more.
Calendar
- Mar. 30-Apr. 2, 2026: EthCC, Cannes
- Apr.15-16, 2026: Paris Blockchain Week, Paris
- May 5-7, 2026: Consensus, Miami
- Sept. 29-Oct.1, 2026: Korea Blockchain Week, Seoul
- Oct. 7-8, 2026: Token2049, Singapore
- Nov. 3-6, 2026: Devcon, Mumbai
- Nov. 15-17, 2026: Solana Breakpoint, London


JPMorgan (JPM) CEO Jamie Dimon said the bank is considering entering the prediction markets space, signaling growing interest from major financial institutions in a sector that has expanded rapidly in recent months, including among crypto-native companies.
“It’s possible one day we’ll do something like that,” Dimon said on CBS on Tuesday, though ruled out offering markets in sport or politics.
“There’s a bunch of stuff we won’t do. And obviously, we have strict rules around insider information.”
Goldman Sachs (GS) has expressed similar ambitions. CEO David Solomon said during the bank’s January earnings call that the firm is actively exploring the space. “I personally met with the two big prediction companies and their leadership in the last two weeks and spent a couple of hours with each to learn more about that,” he said/ “We have a team of people here that are spending time with them and are looking at it.”
The comments highlight how quickly the sector has evolved. Not long ago, prediction markets were a niche corner of finance dominated by just two credible players: Polymarket and Kalshi. Today, competition is intensifying at a rapid pace.
Several crypto-native platforms, including Coinbase (COIN) and Robinhood (HOOD), have integrated prediction market trading into their offerings, expanding access to retail users and increasing overall market activity.
At the same time, the early leaders continue to grow. Polymarket has secured major partnerships and investments, including ties with Intercontinental Exchange, the parent company of the New York Stock Exchange. The company is believed to be valued at around $20 billion. Rival platform Kalshi recently reached a $22 billion valuation following a funding round led by Coatue Management.
The two platforms take different technological approaches. Polymarket operates on blockchain infrastructure, using networks like Polygon (POL) to record trades and settle positions through smart contracts. Users deposit stablecoins, place bets on event outcomes and receive automated payouts based on verified results.
Kalshi does not use blockchain technology, instead operating more like a traditional exchange, offering event contracts under a regulated framework with centralized order matching and settlement.
It remains unclear how JPMorgan or Goldman Sachs would structure their own offerings, particularly whether they would adopt blockchain-based systems or stick to traditional infrastructure.
Regulation remains a key uncertainty. The legal status of prediction markets in the U.S. is still evolving, especially around what types of events can be offered and how contracts are classified. Major banks are likely to wait for clearer guidance before launching products.
Earlier this month, the Commodity Futures Trading Commission (CFTC) took two significant steps toward building a regulatory framework for prediction markets, signaling that oversight of the sector is beginning to take shape.


Cango (CANG) is at risk of losing its NYSE listing after its shares traded below $1 on average for 30 consecutive days, triggering a compliance notice from the exchange and giving the bitcoin miner a six-month window to recover, the company said in a press release Wednesday.
The New York Stock Exchange flagged the company on March 10, warning that failure to lift its share price back above the $1 threshold by the end of the cure period could lead to suspension and delisting proceedings. Cango said it plans to monitor market conditions and explore options to regain compliance, while its shares continue trading in the interim.
Against that backdrop, the company is shoring up its balance sheet with fresh capital.
In a separate announcement, Cango said it has entered into a $10 million convertible note agreement with Hong Kong-listed DL Holdings, alongside issuing warrants to purchase shares at $2.70 apiece. The financing is paired with a non-binding cooperation framework that could see the two firms pursue additional joint investments tied to crypto mining and AI infrastructure.
Proceeds from the note are earmarked for upstream acquisitions and expanding Cango’s push into computing infrastructure, part of a broader pivot beyond bitcoin mining.
Cango’s recent fundraising comes as the company pivots beyond its roots in bitcoin mining toward a broader strategy centered on energy and AI compute infrastructure. The firm has been positioning its global mining footprint as a foundation for high-performance computing, aiming to repurpose or expand its power capacity to support data-intensive AI workloads, a shift that mirrors a wider industry trend of miners seeking more stable, higher-margin revenue streams.
The convertible issuance follows the closing of a $65 million strategic investment round led by entities controlled by chairman Xin Jin and director Chang-Wei Chiu. The deal, settled in USDT and completed March 31, saw the company issue more than 49 million Class A shares.
Together, the transactions underscore management’s effort to stabilize the company financially while betting on longer-term growth in energy and AI-linked compute, even as it faces near-term pressure to keep its NYSE listing intact.
Cango’s shares have slumped sharply this year, highlighting the urgency behind its latest capital raise. The stock is down more than 70% year to date, recently trading around $0.39 after starting January above $1.40, with sustained selling pressure pushing it below the NYSE’s $1 minimum listing threshold.
Read more: Cango is selling off its bitcoin stash to pay down debt and fund an AI makeover

Ripple is moving digital assets from the periphery of corporate finance into the heart of treasury operations. The company announced an update to its treasury management platform that adds native digital asset capabilities, enabling finance teams to hold, track and manage cryptocurrencies alongside traditional fiat balances within a single system.
The upgrade introduces Digital Asset Accounts and a unified dashboard that aggregates balances across bank accounts, custody providers and on-chain wallets. The result is real-time visibility into both cash and digital assets, all reconciled within Ripple’s treasury interface, according to the company. The platform supports XRP and Ripple USD (RLUSD), with balances updated in real time and recorded alongside fiat transactions. APIs connect external custodians and sync activity back into the platform.
Ripple emphasizes that embedding digital asset functionality directly into its treasury system reduces the need for separate crypto tools, potentially cutting manual reconciliation and fragmented reporting across banking and custody systems. “The shift is about making digital assets a core part of treasury operations,” said Mark Johnson, Ripple’s chief product officer, noting use cases such as stablecoin settlement and yield on idle cash.
The rollout follows Ripple’s October acquisition of GTreasury for $1 billion, a deal that signaled a strategic push into enterprise treasury software. The company described the product as live for customers in beta ahead of a broader rollout, with availability varying by jurisdiction depending on regulatory requirements and geography.
Key takeaways
- Ripple adds native digital asset accounts and a unified dashboard to its treasury platform, enabling real-time visibility of fiat and crypto balances in one system.
- The platform supports XRP and RLUSD, with live balance updates and on-chain activity reconciled alongside traditional transactions.
- Digital asset functionality is embedded directly into treasury operations, potentially reducing reliance on separate crypto tools.
- The feature is in beta with phased rollout by jurisdiction, following Ripple’s GTreasury acquisition for $1 billion.
Ripple’s crypto-enabled treasury in practice
The integration of digital assets into treasury workflows is designed to streamline how enterprises manage liquidity, settlement, and treasury operations. By presenting XRP and RLUSD side by side with cash balances, treasurers can execute cross-asset transactions and approval workflows without leaving the platform. The real-time updates ensure that treasury teams see the latest asset positions, while the unified reporting helps reduce fragmentation across banking partners, custody providers and on-chain wallets.
In describing the move, Ripple’s Mark Johnson framed it as a natural evolution of treasury infrastructure. “Making digital assets a core part of treasury operations allows companies to manage them alongside traditional balances while enabling practical use cases such as stablecoin settlement and yield on idle cash,” he told Cointelegraph.
Strategic momentum behind the GTreasury tie-in
The product’s release aligns with Ripple’s broader enterprise strategy following its October purchase of GTreasury for $1 billion. Ripple said the treasury product is already accessible to select customers in beta, with broader availability contingent on regulatory considerations and geography.
The enterprise focus fits a wider pattern in the financial sector, where institutions are pushing to bring digital assets into mainstream financial infrastructure rather than keeping them siloed in crypto-native systems. The shift toward integrated asset classes mirrors a wave of institutional activity across payments and capital markets, as practitioners explore how tokenized representations can streamline settlement and custody.
Wider industry context: digital assets becoming part of financial infrastructure
A Ripple-published survey conducted in March found that 72% of more than 1,000 global finance leaders believe companies must offer digital asset solutions to stay competitive, signaling a move from mere experimentation to integration. The findings underscore growing emphasis on custody, security and robust infrastructure as institutions seek end-to-end visibility over crypto and fiat in a single platform.
In parallel, cross-industry moves illustrate the broader trend toward tokenized money and on-chain settlement. In July, Visa expanded its settlement platform to support additional stablecoins and blockchain networks, building on its early use of USDC for settlement in 2021. JPMorgan expanded access to its JPM Coin deposit token in November, enabling real-time settlement for institutional clients on blockchain rails. Meanwhile, Securitize and BNY Mellon announced plans to bring tokenized assets such as collateralized loan obligations on-chain. These developments collectively reflect a growing push to embed digital assets within traditional financial infrastructure rather than treating them as a standalone playground.
As the industry advances, the pace and scope of adoption will hinge on regulatory clarity and the ability of platforms to deliver secure, auditable, and scalable treasury workflows that can operate across jurisdictions.
Readers should monitor how quickly this integrated approach gains traction across sectors and geographies, and how regulators shape the rules for cross-border asset management and settlement in the enterprise space.

Federal Reserve Governor Michael Barr invoked a “long and painful history of private money created with insufficient safeguards” in remarks Tuesday, making the most pointed Fed case yet for aggressive stablecoin oversight under the newly enacted GENIUS Act.
The comments land directly on the two largest issuers in a $200 billion market – Tether and Circle – and signal that the Fed’s implementation posture will be harder-edged than the legislation’s passage suggested.
Barr addressed the GENIUS Act specifically, acknowledging that Congress’s stablecoin framework could accelerate development – then spending the bulk of his remarks cataloguing the risks that framework must contain. That sequencing was deliberate.
It tells markets that the regulatory rulemaking phase, now underway at the Fed and FDIC, will define what the GENIUS Act actually means in practice.
Key Takeaways:
- Barr’s Position: The Fed governor warned that stablecoins will only remain stable if they can be redeemed at par under stress conditions – including during Treasury market volatility and issuer-specific strain.
- Legislative Context: The GENIUS Act, signed into law in July 2025, established the first federal stablecoin framework; Barr’s March 31 remarks focus on implementation gaps that federal agencies must now fill through rulemaking.
- Reserve Risk: Barr flagged issuer incentives to maximize returns on reserve assets as a structural vulnerability – a direct warning applicable to Tether’s reserve composition history.
- Issuer Implications: The GENIUS Act mandates monthly reserve reporting and restricts backing assets to high-quality liquid instruments like U.S. Treasuries; Barr’s remarks signal strict Fed enforcement of those limits.
- Broader Regulatory Landscape: Stablecoin friction is already blocking progress on the Clarity Act, a separate digital asset bill – meaning Barr’s warnings have downstream effects beyond stablecoins alone.
Discover: Top Crypto Presales to Watch Before They Launch
What Barr Actually Said – and Why the Framing Matters
The phrase “long and painful history” is not rhetorical decoration. Barr is pointing at a specific lineage – the 19th-century free banking era when private bank notes traded at discounts and collapses wiped out depositors, money market fund runs in 2008 and 2020, and the 2022 TerraUSD collapse that erased $40 billion in weeks.
That history matters because it tells us exactly how Barr conceptualizes stablecoin risk: as a monetary problem, not just a consumer protection problem.
His core warning was precise: “Stablecoins will be stable only if they can be reliably and promptly redeemed at par in a wide range of conditions, including during stress in the market that can put pressure on the value of otherwise liquid government debt and during episodes of strain on the individual issuer or its related entities.”

That framing matters because it directly challenges the assumption that Treasury-backed reserves are automatically safe – even U.S. Treasuries face liquidity pressure during acute market stress, as March 2020 demonstrated.
Barr also named the incentive problem explicitly: issuers profit from stretching reserve asset quality, and that pressure intensifies as the market grows.
His formulation – “stretching the boundaries of permissible reserve assets can increase profits in good times but risks a crack in confidence during inevitable bouts of market stress” – is a pre-emptive argument against any industry lobbying to broaden the GENIUS Act’s permitted asset list during rulemaking.
Congress and regulators now have a Fed governor on record with a specific structural critique. The question is whether that critique shapes the rulemaking text or gets absorbed as boilerplate.
Explore: Best Crypto Projects With High Growth Potential in 2026
What the GENIUS Act Actually Covers – and Where the Fed’s Position Creates Friction
The GENIUS Act sounds clean on paper, but what matters now is how it actually gets enforced, because the rules it set are pretty strict.
Stablecoin issuers have to show their reserves every month, keep those reserves in safe and liquid assets like short term U.S. Treasuries, make it clear there is no FDIC protection, and follow real banking style rules around capital, liquidity, and AML.
Barr is now pushing the next phase, and his focus is very direct. He wants tight control over what counts as safe reserves, especially under stress, stronger rules to stop companies from escaping into weaker jurisdictions, and capital requirements that actually match real redemption risk. On top of that, he is doubling down on AML and limiting what stablecoin firms can do outside of issuing, to reduce spillover risk.
But the real story is not the law itself, it is the rulemaking that comes next, because that is where things either stay strict or get loosened. The big question is how narrow regulators define “safe assets,” since that decides how flexible issuers can be, and right now Barr is clearly leaning toward a tighter definition.
That tension is already spilling into other legislation, with negotiations slowing as regulators push a more cautious stance, so what we are seeing is not just policy being written, but a broader shift in how seriously the system wants to control crypto going forward.
Explore: Best Crypto Projects With High Growth Potential in 2026
The post Fed’s Barr Calls for Strong Stablecoin Oversight, Citing ‘Long and Painful’ History appeared first on Cryptonews.


Aave V4 is live on Ethereum with a hub-and-spoke design that keeps liquidity pooled while routing credit to bespoke RWA and structured credit markets for institutions.
Summary
- Aave has launched V4 on Ethereum mainnet, introducing a “hub-and-spoke” architecture aimed at real‑world asset (RWA) collateral and institutional structured credit markets.news.
- The protocol, which secures more than $24 billion in total value locked (TVL), is positioning V4 as core infrastructure for regulated RWA pipelines and on‑chain credit products rather than purely speculative leverage.
- V4 debuts with three liquidity hubs—Core, Prime and Plus—that route credit to specialized “spokes,” allowing bespoke risk policies without fragmenting Aave’s pooled liquidity.governance.
Aave (AAVE) has used EthCC 2026 in Cannes as the launchpad for its long‑anticipated V4 upgrade, activating a new “hub‑and‑spoke” architecture on Ethereum (ETH) mainnet that is explicitly designed to serve real‑world assets and institutional credit strategies. The decentralized lending protocol, which Phemex notes already holds more than $24 billion in TVL, is betting that its next phase of growth will come from RWA‑backed lending and structured products, not just yield‑farming loops.
In The Block, V4 is described as a system in which a central liquidity “Hub” extends credit lines to multiple lending markets, with Aave establishing three main hubs—Prime, Core and Plus—to segregate assets and use cases by risk level. Governance documentation on the Aave forum explains that “V4 allows each Spoke to define its own risk appetite, collateral policies, and liquidation rules while drawing on shared Hub liquidity,” likening the model to “a supranational bank allocating capital to regional facilities, each operating under its own mandate.” In practice, that means RWAs, fixed‑rate lending and more complex credit structures can sit in their own spokes, with conservative caps and isolation mechanisms, without splintering Aave’s overall liquidity or forcing users to choose between entirely separate pools.governance.
Coverage from Bitcoin.com and Me3 frames Aave V4 as a fundamental redesign rather than a minor version bump, highlighting that the new architecture “supports new market types like fixed‑rate lending and tokenized real‑world asset collateral” and “enables institutional borrowing against RWAs without fragmenting the protocol’s existing liquidity pool.” Those capabilities tie directly into Aave’s 2026 “master plan,” where founder Stani Kulechov outlined three pillars: the V4 upgrade, Horizon—an RWA platform tailored to institutions—and a new front‑end app aimed at onboarding mainstream users. Horizon is already focused on regulated, compliance‑aligned lending, targeting tokenized treasuries, real estate and private credit, with Kulechov’s goal to grow that platform beyond $1 billion in assets and deepen partnerships with firms like Circle, Ripple, Franklin Templeton and VanEck.
Those ambitions are underpinned by scale that is unusual even within DeFi. According to figures shared by Aave and cited by MEXC, the protocol has processed more than $3.33 trillion in total deposits since launch and issued close to $1 trillion in loans, generating around $885 million in fee revenue and capturing roughly 59% of the decentralized lending market. In that context, the decision to anchor V4’s debut to EthCC—amid a broader institutional turn at the conference—signals that Aave sees itself less as a pure crypto‑native money market and more as a candidate backbone for an on‑chain credit system that can handle both degen leverage and Basel‑sensitive collateral flows.
The launch comes after months of governance work and a sizeable funding push. In March, Aave Labs submitted the “Aave Will Win” framework, asking the DAO for $25 million in stablecoins and 75,000 AAVE tokens—about $42.5 million in total—to finance V4 development, a new independent foundation and growth initiatives targeting fintechs and institutions. A separate governance proposal set out the V4 activation path and initial asset range on Ethereum, with Kulechov telling the community on X that V4 is a “full redesign of the protocol’s structure” aimed at moving “the next trillion dollars in assets” on‑chain.
For users, the immediate changes include a more modular risk framework and the prospect of borrowing against a broader set of tokenized assets while still benefiting from Aave’s deep, shared liquidity. For the broader DeFi market, the upgrade cements a narrative shift: as more protocols chase RWA flows and institutional capital, flagship money markets like Aave are quietly turning into on‑chain credit utilities, with EthCC now serving as the stage where that transition is announced.

Key Takeaways
- Bernstein elevated Western Digital to Outperform from Market Perform, raising its price target from $170 to $340.
- A sharp 21% decline followed concerns about Google’s TurboQuant compression technology — which Bernstein argues poses zero threat to hard drive demand.
- The firm projects Western Digital and Seagate will achieve combined revenue growth of 24% CAGR between fiscal 2025 and 2030.
- Western Digital announced an extended timeline for its ePMR technology, potentially indicating a delayed shift to HAMR drives.
- Seagate remains Bernstein’s preferred stock in the segment, with its price target elevated to $620.
Despite recent volatility, Western Digital maintains a year-to-date gain of approximately 57%, showcasing resilience even through the latest correction.
Western Digital Corporation, WDC
The stock plunge was triggered when Google Research introduced TurboQuant — an advanced compression method designed to optimize KV cache during AI inference operations. Market participants worried this innovation could reduce storage hardware demand.
Bernstein’s Mark Newman firmly rejected this narrative. “There is zero impact to HDD demand,” Newman stated in his research note. He emphasized that TurboQuant’s influence on NAND flash storage, utilized solely for offloading inactive caches, is minimal at best.
According to Bernstein, the market reaction was excessive and unwarranted. Western Digital had tumbled 21% from its recent peak before the analyst’s upgrade. Related companies including Seagate and Sandisk experienced similar pressure.
Upgraded Revenue Projections for Storage Industry
Bernstein has adopted a more constructive stance on the broader storage industry. The research firm now forecasts that Western Digital and Seagate will achieve a combined revenue compound annual growth rate of 24% spanning fiscal years 2025 through 2030.
This represents a substantial upgrade from earlier projections that anticipated 18.7% bits growth accompanied by 3.6% annual price erosion. The updated model incorporates 24% bits expansion with pricing holding steady.
Newman pointed to several structural growth drivers: expanding AI computational workloads, increasingly sophisticated content production, extended data retention requirements, and strengthening data sovereignty regulations that support both volume growth and pricing power.
Regarding product developments, Western Digital’s 2026 Innovation Day revealed plans to extend its ePMR technology roadmap. The company essentially prolonged the lifecycle of its existing drive architecture by one to two additional years beyond prior expectations.
Questions About HAMR Rollout Timeline
The upgrade contains an important qualification. Newman interprets Western Digital’s continued emphasis on ePMR as an implicit indication that the company’s migration to heat-assisted magnetic recording — commonly referred to as HAMR — might be progressing slower than initially anticipated.
Bernstein’s financial model anticipates Western Digital will begin scaling HAMR production in 2027, representing approximately 5% of nearline exabyte shipments during that year.
This contrasts sharply with Seagate’s trajectory, where Bernstein projects roughly 70% of nearline volume will utilize HAMR technology by 2027. Seagate continues as the firm’s preferred investment, with its price target increased to $620 from $500.
Western Digital shares climbed approximately 2.3% during Wednesday’s premarket session following the upgrade before accelerating gains throughout regular trading hours.


#money #millionairemindsetunlimited #motivation #motivation #millionairevibes #millionaire

David Skaith hits back at council criticism over North Yorks bus plan

At Close of Business podcast April 1 2026


-

 News Videos7 days ago
Parliament publishes latest register of MPs’ financial interests
-

 Business6 days ago
Instagram, YouTube Found Responsible for Teen’s Mental Health Struggle in Historic Ruling
-
 Tech6 days ago
Intercom’s new post-trained Fin Apex 1.0 beats GPT-5.4 and Claude Sonnet 4.6 at customer service resolutions
-

 NewsBeat5 days ago
The Story hosts event on Durham’s historic registers
-

 Sports5 days ago
Sweet Sixteen Game Thread: Tide vs Michigan
-
Entertainment2 days ago
Fans slam 'heartbreaking' Barbie Dream Fest convention debacle with 'cardboard cutout' experience
-
 Entertainment4 days ago
Lana Del Rey Celebrates Her Husband’s 51st Birthday In New Post
-
Crypto World1 day ago
Dems press CFTC, ethics board on prediction-market insider trades
-

 Sports24 hours ago
Tallest college basketball player ever, standing at 7-foot-9, entering transfer portal
-

 Tech3 days ago
The Pixel 10a doesn’t have a camera bump, and it’s great
-

 Entertainment7 days ago
HBO’s Harry Potter Series Will Definitely Fail For One Big Reason, And It’s Not J.K. Rowling Or Snape
-

 Crypto World2 days ago
U.S. rule change may open trillions in 401(k) funds to crypto
-

 Fashion6 days ago
En Vogue in Brown Leather and Tailored Neutrals by Atelier Savoir, Styled by J Bolin
-

 Tech1 day ago
EE TV is using AI to help you find something to watch
-

 Tech1 day ago
How to back up your iPhone & iPad to your Mac before something goes wrong
-

 Fashion6 days ago
What Are Your Favorite T-Shirts for the Weekend?
-

 Fashion5 days ago
Weekly News Update, 3.27.26 – Corporette.com
-

 Politics2 days ago
Should Trump Be Scared Strait?
-

 Fashion4 days ago
Amazon Sundays: Soft Spring Layers
-

 Tech3 days ago
Elon Musk’s last co-founder reportedly leaves xAI
You must be logged in to post a comment Login