

Crypto World
Avalanche (AVAX) Gains 2% as Index Trades Flat
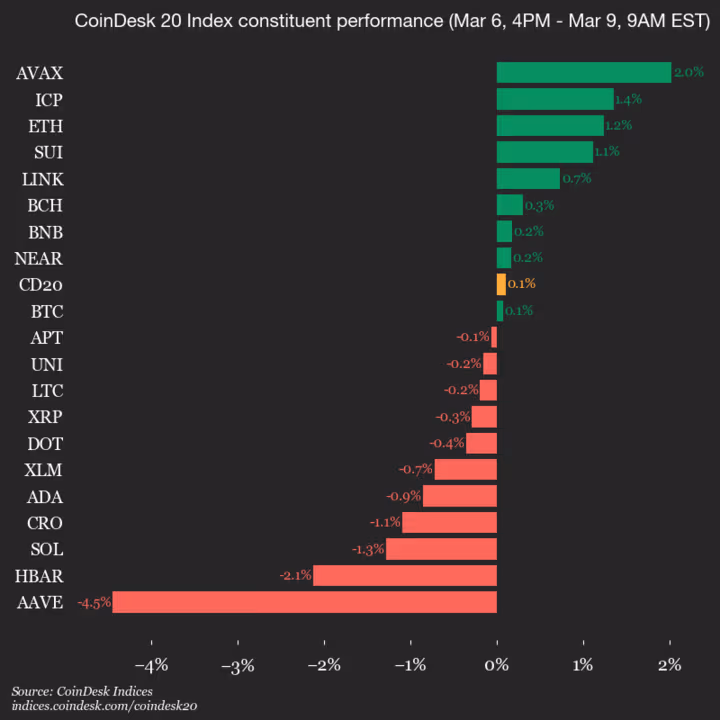
CoinDesk Indices presents its daily market update, highlighting the performance of leaders and laggards in the CoinDesk 20 Index.
The CoinDesk 20 is currently trading at 1948.46, up 0.1% (+2.05) since 4 p.m. ET on Friday.
Nine of the 20 assets are trading higher.

Leaders: AVAX (+2.0%) and ICP (+1.4%).
Laggards: AAVE (-4.5%) and HBAR (-2.1%).
The CoinDesk 20 is a broad-based index traded on multiple platforms in several regions globally.


Short-term holders are currently facing about 24% unrealized losses.
Bitcoin’s short-term holders have continued to realize losses, as on-chain data found sustained selling pressure across most of the past week.
According to the latest analysis by Axel Adler Jr., the Short-Term Holder Spent Output Profit Ratio (STH SOPR), a metric that measures whether coins held for less than 155 days are being sold at a profit or loss, remained below the neutral level of 1.0 for seven of the last eight days between March 2 and March 9.
A reading below 1.0 indicates that the cohort is selling at prices lower than their acquisition cost.
Bitcoin’s Weak Hands Are Selling
As of March 9, the intraday average STH SOPR stood at 0.987, and only six out of 35 observed blocks, or about 17%, closed above the 1.0 threshold. The 7-day moving average for the metric remained near 0.992, which further supports the view that loss realization among short-term holders has persisted for several consecutive days rather than appearing as a single isolated event.
During the same period, the metric crossed above 1.0 only once, on March 4, when the price of Bitcoin briefly reached $74,000 before returning to loss-selling territory. The lowest weekly reading occurred on March 6 at 0.979, while March 8 registered 0.991. Both of these instances confirm that most transactions from this cohort were executed below cost basis.
Adler explained that the first clear signal of a change in market conditions would be STH SOPR closing above 1.0 for several consecutive days alongside rising prices.
Capitulation
In addition to the profitability metric, Adler examined changes in terms of the overall supply held by short-term investors. Over the past two weeks, the total volume of coins within the short-term holder cohort declined from approximately 6.06 million BTC to about 5.92 million BTC. This essentially indicated that roughly 140,000 BTC left the cohort.
You may also like:
Such a reduction reflects either capitulation through realized losses or the natural aging of coins into long-term holder status after surpassing the 155-day holding threshold. At the same time, the cohort’s realized price remained around $89,028, while the market price traded near $67,000 during the period analyzed.
The difference represents an unrealized loss of roughly 24% for the average short-term holder. Adler observed that this gap between the realized price and the current market value creates a structural supply overhang in the market. As prices recover, some short-term investors who purchased at higher levels may use rallies as opportunities to exit positions without losses, and would potentially add supply and reduce the strength of upward moves.
The combination of the two indicators points to an ongoing “cohort cleansing,” in which the more price-sensitive segment of the market is gradually exiting through selling pressure rather than through a recovery in profitability.
Binance Free $600 (CryptoPotato Exclusive): Use this link to register a new account and receive $600 exclusive welcome offer on Binance (full details).
LIMITED OFFER for CryptoPotato readers at Bybit: Use this link to register and open a $500 FREE position on any coin!


U.S. Bitcoin, Ethereum, and Solana ETFs saw rare same‑day outflows on March 9, but positive weekly flows and steady spot prices point to rotation, not capitulation.
Summary
- Bitcoin, Ethereum, and Solana ETFs all booked one‑day net outflows, signaling a sharp but concentrated de‑risking across major U.S. spot products.
- Weekly flows remain positive for BTC, ETH, and SOL, suggesting ETF desks are rotating risk within crypto rather than exiting the asset class.
- Despite red ETF prints, Bitcoin trades in the high‑$60K band, Ethereum near $2,000, and Solana just under $90, underscoring a resilient spot tape.
U.S. crypto ETFs flashed a rare warning signal on March 9 as spot products for Bitcoin, Ethereum, and Solana all recorded simultaneous net outflows, even as underlying prices held firm near recent ranges.
ETF flows: risk-on, but defensive
On-chain analytics firm Lookonchain reported that U.S. Bitcoin ETFs saw a one-day net outflow of 5,409 BTC, while Ethereum ETFs shed 36,599 ETH and Solana products lost 68,933 SOL, underscoring a sharp but concentrated bout of de-risking across majors. A separate summary of the same dataset framed the move as a short-term shock inside a still-positive weekly trend, noting that “Bitcoin ETFs experienced a one-day net outflow of 5,409 BTC… however, the seven-day net inflow stood at a positive 8,154 BTC,” with Ethereum and Solana showing similar one-day outflows but net inflows over seven days.
In that analysis, Solana stood out as the most volatile leg of the trade: “Solana ETFs displayed the most dramatic shifts… with a one-day net outflow of 68,933 SOL… Contrarily, the seven-day net inflow reached +266,247 SOL,” a pattern more consistent with fast money rotation than structural capitulation.
Macro structure: liquidity, not faith
The flows come against a macro backdrop where crypto still trades as a high‑beta expression of global liquidity rather than a simple tech proxy.
As one ETF strategist put it in the Lookonchain-linked commentary, recent moves “could influence trading strategies, as traders monitor whether these outflows represent profit-taking or a shift in investor confidence amid broader market volatility,” highlighting that desks are treating ETF flows as a real‑time barometer of positioning, not a referendum on the asset class itself.
Price action: resilient tape
Despite the ETF outflows, majors held up. Bitcoin recently traded around the high‑$60K band, with multiple spot dashboards placing it near $68K–$69K and up roughly 1–3% over the last 24 hours at press time.
Ethereum changed hands near $2,000–$2,050, gaining about 3–4% on the day, while Solana hovered around $85.20, up 3.69% in 24 hours as it continued to “grind sideways just under $90.”
For traders, the message is blunt: ETF red prints are back, but as long as weekly flows stay positive and spot refuses to break, the underlying market structure still looks like rotation within a risk bucket rather than an exit from it.
Key points:
-
Rising oil prices have not hurt crypto sentiment as buyers attempt to push Bitcoin above $69,000
-
Buyers are attempting to propel several major altcoins above their overhead resistance levels, indicating demand at lower levels.
A sharp rally in oil prices failed to deter cryptocurrency buyers who pushed Bitcoin (BTC) above $69,000 on Monday. Although the spot BTC exchange-traded funds witnessed outflows on Thursday and Friday, the week saw net inflows of $568.45 million per SoSoValue data. That was the second successive week of net inflows, a first in five months.
While some analysts believe that BTC may have bottomed out, on-chain analyst Willy Woo said in a post on X that BTC was solidly in the middle of a bear market from a long-range liquidity perspective and was forming a bull trap.

Usually, when negative news fails to sink the price to a new low in a bearish trend, it suggests that the selling may be drying up. That doesn’t guarantee a sharp rally in the near term, as markets tend to consolidate in a range for a while before starting the next leg higher.
Could buyers push BTC and major altcoins above their resistance levels? Let’s analyze the charts of the top 10 cryptocurrencies to find out.
S&P 500 Index price prediction
The S&P 500 Index (SPX) closed below the 6,775 level on Friday, indicating that the bears are attempting to take charge.

The moving averages have completed a bearish crossover, and the relative strength index (RSI) has dipped into the negative territory, indicating the path of least resistance is to the downside. The next crucial support to watch out for on the downside is 6,550. If the level cracks, the correction may deepen to 6,147.
Buyers will have to drive the price above the moving averages to signal strength. That improves the prospects of a rally to the 7,290 level.
US Dollar Index price prediction
The US Dollar Index (DXY) is facing resistance near the 99.50 level, but the bulls have kept up the pressure.

The upsloping 20-day exponential moving average (98.17) and the RSI above the 63 level suggest that the bulls are in command. If the price closes above the 99.50 level, the index may retest the critical overhead resistance at the 100.54 level. A close above the 100.54 resistance suggests the start of a new up move.
Sellers will have to tug the price below the moving averages to retain the index inside the 95.50 to 100.54 range.
Bitcoin price prediction
BTC fell below the 20-day EMA ($68,553) on Friday, but the bears could not sink the price below the support line. That suggests demand at lower levels.

If the price maintains above the 20-day EMA, the likelihood of a break above the $74,508 resistance increases. Such a move suggests that the BTC/USDT pair may have bottomed out in the short term. The Bitcoin price may then soar to $84,000, where the bears are expected to mount a strong defense.
This positive view will be invalidated in the near term if the price turns down and breaks below the support line. The pair may then drop to the vital support at $60,000.
Ether price prediction
Ether (ETH) broke below the 20-day EMA ($2,018) on Friday, but the bears could not sink the price to the $1,750 level.

That suggests selling dries up at lower levels. The bulls are attempting to push the price back above the 20-day EMA. If they manage to do that, the ETH/USDT pair may climb to the 50-day SMA ($2,249). Sellers will attempt to halt the relief rally at the 50-day SMA, but if the bulls prevail, the pair may jump to $2,600.
Contrary to this assumption, if the Ether price turns down from the $2,111 level and breaks below $1,916, it signals that the pair may remain inside the range for a while longer.
BNB price prediction
BNB (BNB) fell below the 20-day EMA ($633) on Friday, but the bears could not pull the price to the $570 level.

That attracted buyers who are trying to push the price back above the 20-day EMA. If they succeed, the BNB/USDT pair may retest the overhead resistance at $670. Sellers are expected to fiercely defend the $670 level, as a close above it opens the doors for a rally to $730 and then $790.
Instead, if the BNB price turns down from the current level or the $670 resistance, it suggests that the range-bound action may continue for a few more days. Sellers will have to yank the pair below the $570 level to start the next leg of the downtrend toward $500.
XRP price prediction
XRP (XRP) has been trading just below the 20-day EMA ($1.39) for several days, indicating that the bulls continue to exert pressure.

A close above the 20-day EMA will be the first sign of strength. The XRP/USDT pair may then rally to the $1.61 level and subsequently to the downtrend line of the descending channel pattern. Buyers will have to break and sustain the XRP price above the downtrend line to signal a short-term trend change.
Conversely, if the price turns down from the 20-day EMA and breaks below $1.27, it suggests that the bulls have given up. That may sink the pair to the support line, which is likely to attract buyers.
Solana price prediction
Solana (SOL) has been consolidating between $76 and $95 for several days, indicating a balance between supply and demand.

The flattish 20-day EMA ($85) and the RSI just below the midpoint do not give a clear advantage either to the bulls or the bears.
The next trending move is expected to begin on a close above $95 or below $76. If buyers drive the Solana price above $95, the rally may reach $117. Alternatively, a break and close below $76 suggests that the bears have overpowered the bulls. The SOL/USDT pair may then slump to the Feb. 6 low of $67.
Related: Bitcoin at $67K despite oil shock is ‘strongest indicator’ bottom may be in
Dogecoin price prediction
Dogecoin (DOGE) fell below the $0.09 support on Sunday, but the bears could not sustain the lower levels. The bulls bought the dip and are attempting to reclaim the level.

If the relief rally turns down from the 20-day EMA ($0.09), it suggests that the bears remain in control. That heightens the risk of a drop to Feb. 6 low of $0.08.
Buyers are likely to have other plans. They will attempt to push the Dogecoin price above the moving averages. If they can pull it off, the DOGE/USDT pair may surge to the breakdown level of $0.12. Buyers will have to achieve a close above the $0.12 resistance to suggest that the pair may have bottomed out at $0.08.
Cardano price prediction
Cardano (ADA) slipped below the $0.25 support on Sunday, but the bears are struggling to sustain the lower levels.

The bulls will attempt a recovery, which is expected to face selling at the 20-day EMA ($0.27). If the price turns down sharply from the 20-day EMA, the bears will strive to sink the ADA/USDT pair to the support line of the descending channel pattern. If the Cardano price rebounds off the support line with strength, it suggests that the pair may remain inside the channel for some more time.
The bulls will have to drive and maintain the price above the downtrend line to signal a potential short-term trend change.
Bitcoin Cash price prediction
Bitcoin Cash (BCH) has been witnessing a tough battle between the bulls and the bears at the $443 level.

The bulls are attempting a relief rally, but the bears are likely to halt any recovery attempt at the 20-day EMA ($478). If the Bitcoin Cash price turns down sharply from the 20-day EMA, it increases the likelihood of a break below the $443 level.
If that happens, the BCH/USDT pair will complete a bearish head-and-shoulder pattern. That may start a downward move to $375.
Contrarily, a close above the 20-day EMA suggests that the selling pressure is reducing. The pair may then rally to the 50-day SMA ($525).
This article does not contain investment advice or recommendations. Every investment and trading move involves risk, and readers should conduct their own research when making a decision. While we strive to provide accurate and timely information, Cointelegraph does not guarantee the accuracy, completeness, or reliability of any information in this article. This article may contain forward-looking statements that are subject to risks and uncertainties. Cointelegraph will not be liable for any loss or damage arising from your reliance on this information.

- Zcash gained 9% to above $215 but faces resistance and could dump hard.
- The altcoin rose amid Bitcoin’s rebound to above $69,000 on Monday.
- Privacy coin narrative and venture funding have helped ignite ZEC’s uptick.
Zcash (ZEC) rose nearly 9% after bouncing from recent lows, placing the token among the top gainers among the 100 largest cryptocurrencies by market capitalisation.
The privacy-focused coin retested resistance above $215 as altcoins broadly posted modest gains over the past 24 hours.
Sentiment improved after Bitcoin climbed above $69,000, helping lift the wider market.
ZEC advanced alongside other privacy-oriented tokens, including Tornado Cash, Oasis Network, and Dash.
Monero (XMR) also recorded gains, with the token rising nearly 3% over the past 24 hours.
What could help Zcash price higher?
While the broader market rebound has supported Zcash (ZEC), other factors may also be contributing to the token’s recent bounce.
ZEC appears to be drawing momentum from a new report by the United States Department of the Treasury, which acknowledged that crypto privacy tools such as token mixers can serve legitimate purposes.
The report states that such tools may be used for “legitimate financial privacy purposes,” marking a shift in tone from previous official positions regarding mixers and other privacy-focused technologies.
“Lawful users of digital assets may leverage mixers to enable financial privacy when transacting through public blockchains,” the Treasury said in its report to Congress.
The token has also benefited from ecosystem developments.
The team behind a new Zcash-powered mobile wallet recently secured $25 million in a funding round backed by several venture capital firms active in the digital asset sector.
Zcash Open Development Lab (ZODL) has secured over $25 million in funding from a16z, Paradigm, Winklevoss Capital, Coinbase Ventures, Cypherpunk Technologies, Maelstrom (family office of Arthur Hayes), Chapter One, David Friedberg, Haseeb Qureshi, Mert, Balaji and others.
If you… https://t.co/yeTadbUCR5 pic.twitter.com/PyisPQLWVJ
— Josh Swihart 🛡 (@jswihart) March 9, 2026
According to ZODL, the backing “signals strong investor confidence” in shielded ZEC transactions.
Players that participated in the funding include Paradigm, a16z crypto, Winklevoss Capital, and Coinbase Ventures.
Others were Cypherpunk Technologies and Arthur Hayes’ family office, Maelstrom.
Josh Swihart, the former CEO of Zcash developer Electric Coin Company (ECC), founded Zodl (formerly Zashi) in 2024.
Zcash price: breakout or dump below $175?
Zcash (ZEC) was among the standout performers in the privacy-focused segment of the crypto market in 2025.
The token rallied from lows near $50 in September to a peak of about $700 by mid-November.
However, the gains proved difficult to sustain as the broader market turned lower.
As Bitcoin declined and the wider crypto market followed, ZEC retraced sharply, slipping to below $220.
The token fell further to around $184 on February 5, 2026, during a broader market sell-off that coincided with the departure of core developers from Electric Coin Company (ECC).
Following the sharp downturn, ZEC is currently down about 58% on a year-to-date basis.

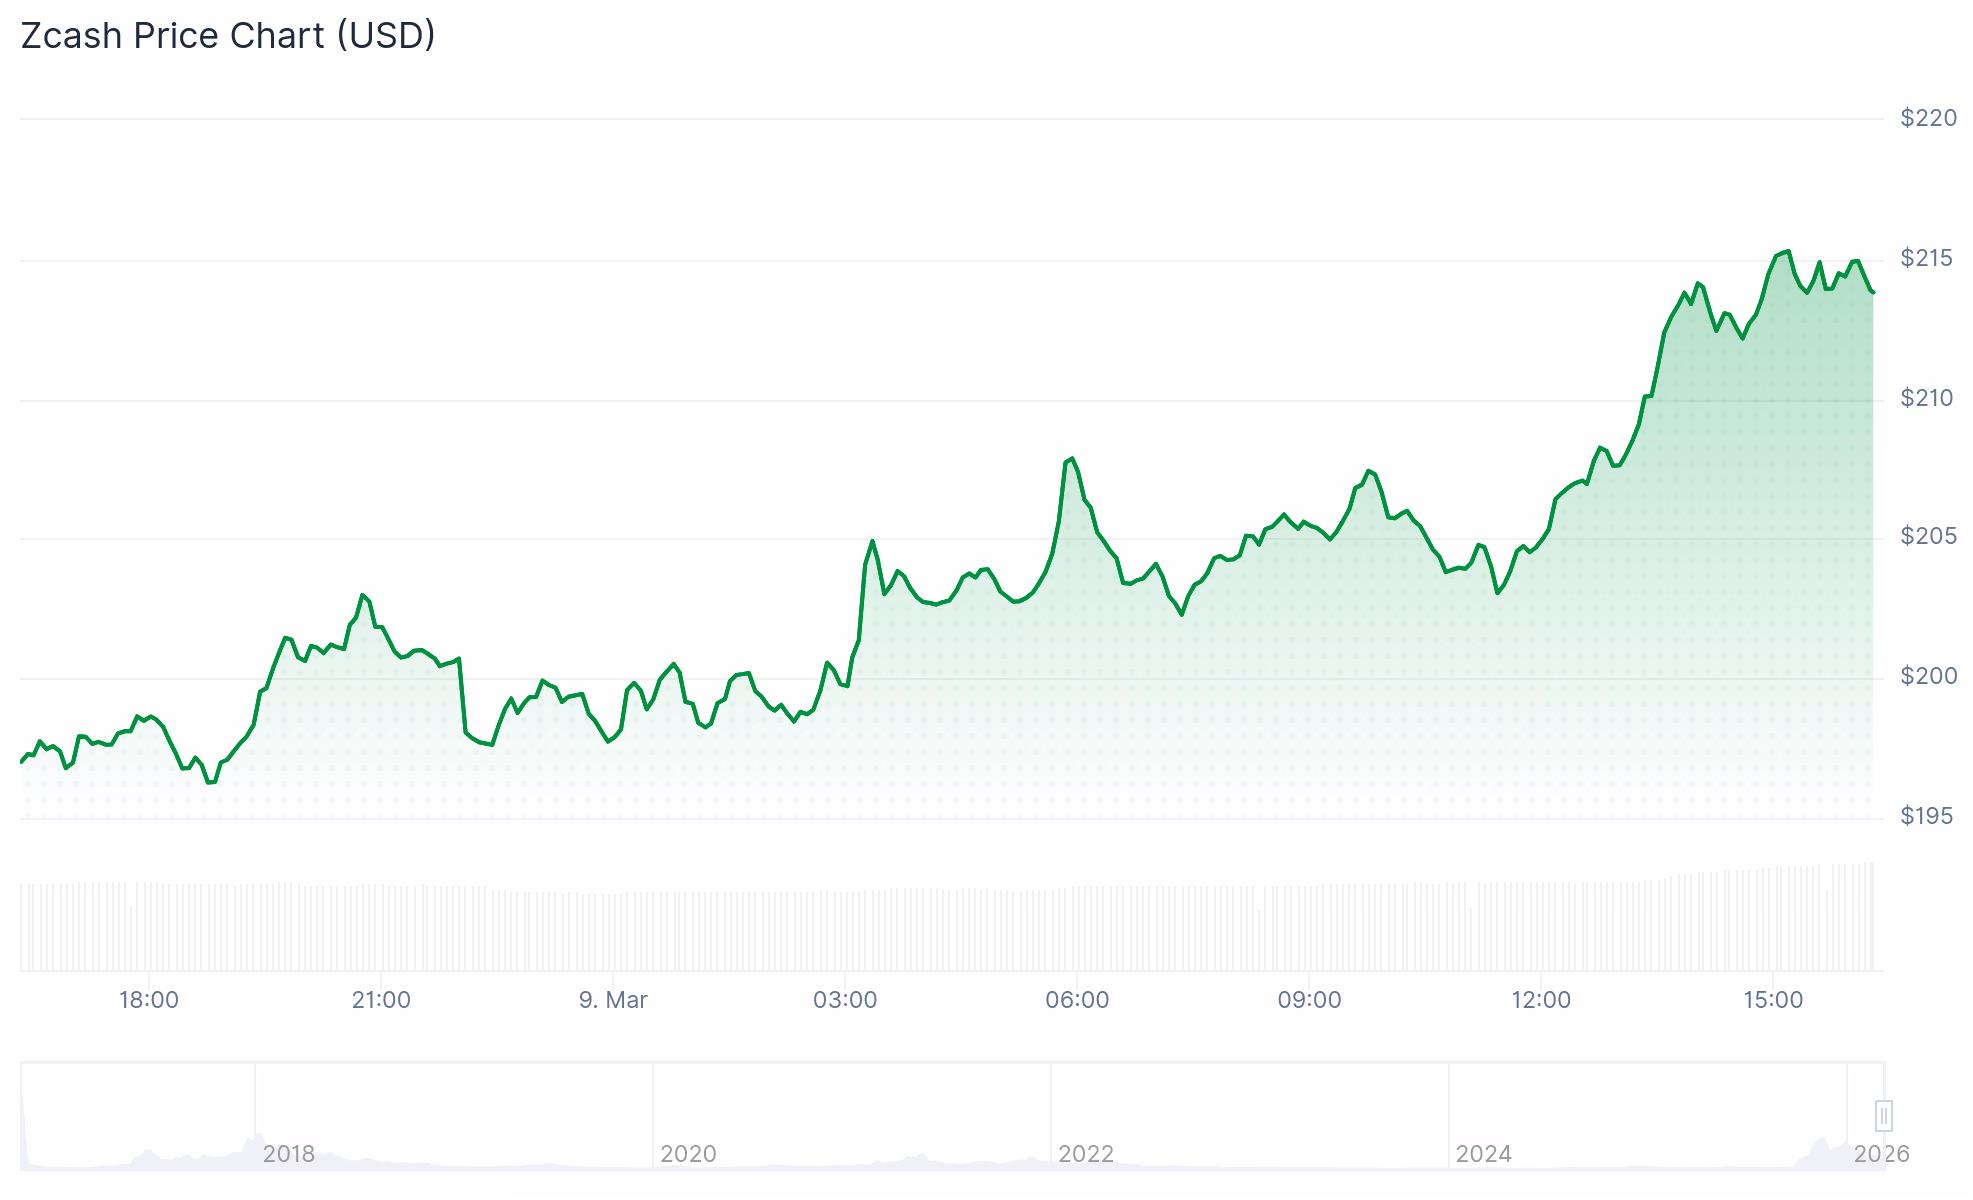
Zcash price chart by TradingView
The daily chart indicates that Zcash (ZEC) has rebounded from a key support level near $200.
If upward momentum strengthens, the token could test initial resistance in the $290–$300 range, with a potential move toward $400 if buying pressure persists.
The relative strength index (RSI) has turned higher around the 50 level, suggesting the possibility of continued bullish momentum.
However, the moving average convergence divergence (MACD) points to weakening upside strength, which could give sellers an opportunity to push the price back toward recent lows.
On the downside, ZEC could decline to levels last seen in October 2025 if bearish pressure intensifies.
A decisive close below $175 may open the door to further losses, with the next key support level around $120.
Cynthia Lummis, one of Wyoming’s two US senators, who announced plans to leave the chamber in 2027, has revived a push for a de minimis tax exclusion on small cryptocurrencies transactions as the Senate debates a digital asset market structure bill.
In a CNBC interview on Wednesday, Lummis said that the House Ways and Means Committee and Senate Finance Committee were considering a $300 exemption to allow crypto users to better use Bitcoin (BTC) for transactions without paying capital gains taxes.
The Wyoming senator’s statement followed her introduction of a standalone bill in July 2025 proposing a de minimis tax exemption for crypto transactions under $300, with a $5,000 limit annually.
“We’re trying to figure out how to weigh, the appropriate way, to decide when a sale — for example of Bitcoin — should be subject to capital gains and when it should be allowed to be used as a simple means of exchange the same way we use the US dollar,” said Lummis.

Lummis, who sits on the Senate Banking Committee, said that her Democrat colleagues were still not voting “yes” on the crypto market structure bill, which passed the House of Representatives as the CLARITY Act in July 2025.
The committee had been scheduled for a markup on the bill in January, but the chair, South Carolina Senator Tim Scott, postponed the meeting indefinitely after Coinbase CEO Brian Armstrong said that the exchange could not support the legislation “as written,” citing concerns with tokenized equities.
Related: Crypto turnaround at Fed as Kraken scores account and Trump nominee goes to Senate
The Wyoming senator has been one of the most outspoken proponents for the market structure bill in Congress. However, Lummis announced in December that she would not seek reelection to the Senate, making her last day in January 2027.
Donald Trump gets deeper into crypto-banking clash on stablecoins
Concerns over the market structure bill, ranging from tokenized equities, responsibilities for US financial regulators, ethics over potential conflicts of interest, and stablecoin yield have effectively stalled progress of the legislation in the Senate.
However, last week US President Donald Trump took to social media to urge banking groups to “make a good deal” with the crypto industry, adding that banks could not hold the CLARITY Act “hostage.” As of Monday, the Senate Banking Committee had not rescheduled its markup of the bill.
Magazine: The debate over Bitcoin’s four-year cycle is over: Benjamin Cowen
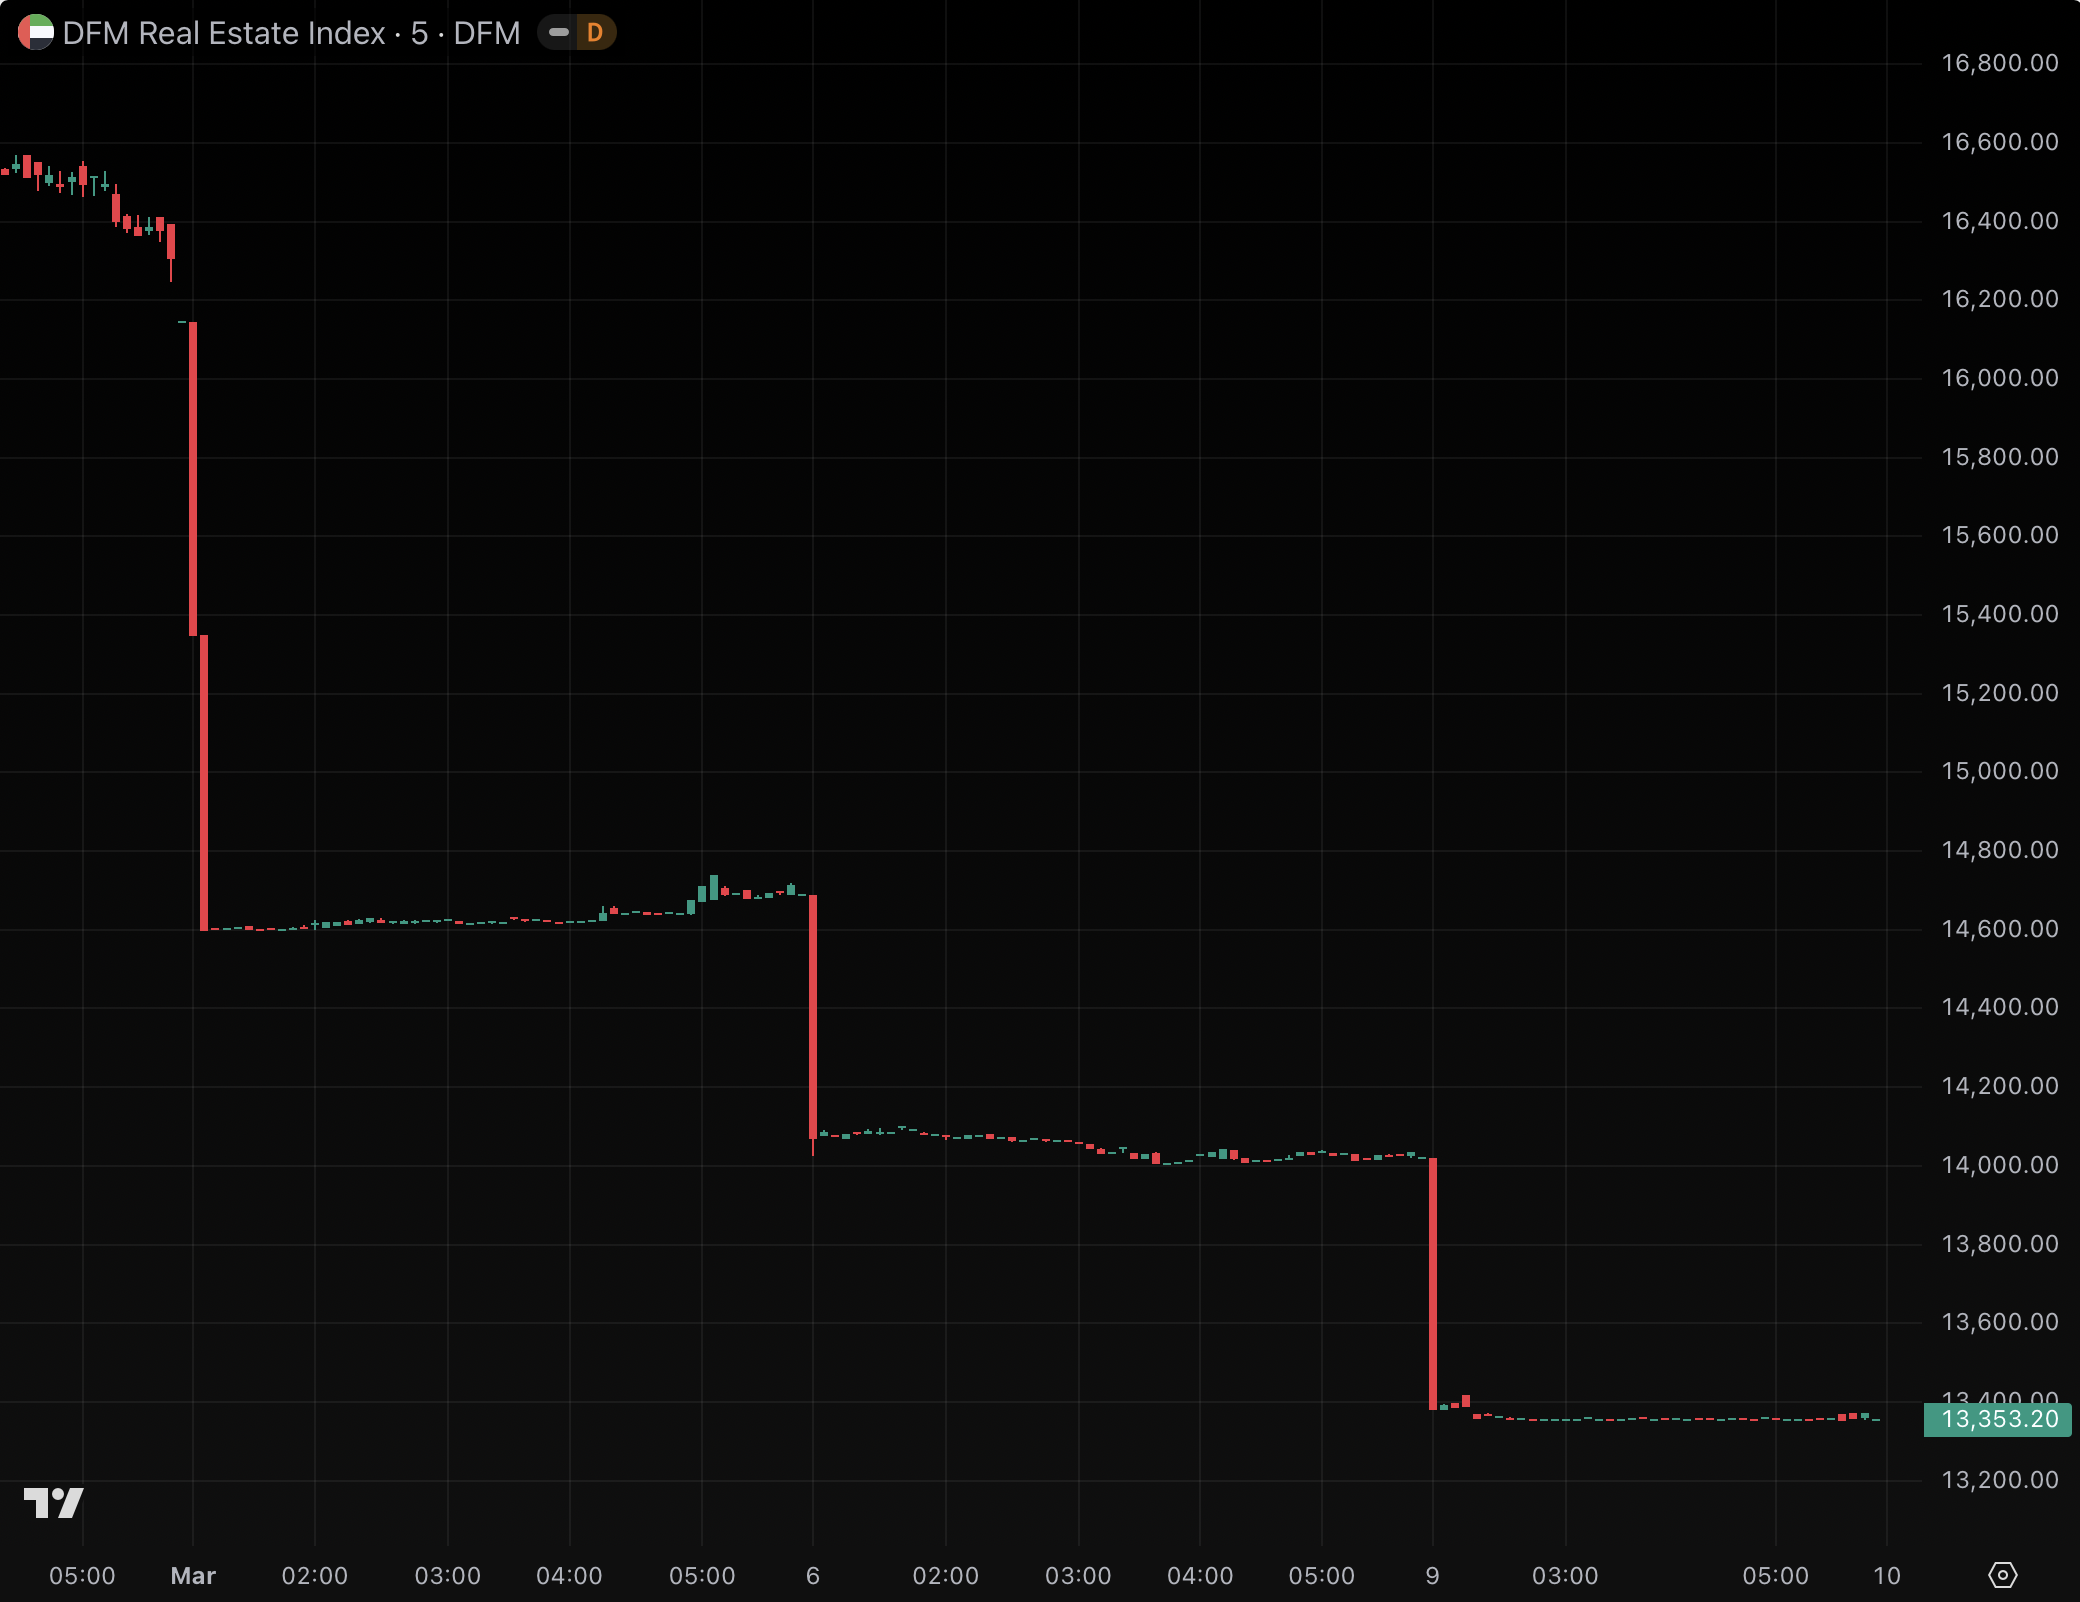
Since the onset of the Iran war, Dubai real estate has crashed worse than bitcoin (BTC).
The Dubai Financial Market (DFM) Real Estate Index closed trading at 13,353 on Monday, down 18.1% from 16,306 on February 27, the most recent trading session before Operation Epic Fury’s opening airstrikes at 1:15am New York time on February 28.
In contrast, BTC was trading at $65,492 when the first bombs fell on Iran. It briefly dipped to $63,000, but had rallied to $69,000 by 12:30pm Monday in New York — a 5.4% jump since the war began.
Dubai real estate lost nearly a fifth of its value over the same 10 days.
The city’s real estate market wipeout has erased all year-to-date gains and is threatening to reverse its 2025 gains which provide a mere 15% additional downside cushion before prices would revert to 2024 levels.

A chart of the DFM Real Estate Index shows step-like changes on each trading day along with a hard floor. For example, across four hours today, the index of real estate companies traded no lower than precisely 13,353.20.
Certain exchanges artificially limit price moves, including DFM at 5% daily.
Nearby exchange Boursa Kuwait has entirely suspended trading since March 1.
Private aircraft demand to leave Dubai is up at least 300% amid airport closures, and people are paying thousands or even six figures to flee.
Dubai bombings, drone strikes, airport closures
Dubai spent years marketing itself as a stable, tax-advantaged home for crypto influencers and it duly attracted plenty of crypto companies and influencers.
Bybit, Telegram’s TON Foundation, and Deribit have headquarters in Dubai, and many other crypto companies have offices in the city, including Binance, OKX, and Crypto.com.
Overall, 9,800 millionaires relocated to the United Arab Emirates (UAE) in 2025 alone, bringing $63 billion with them.
Then, Iran fired missiles at Dubai’s airport, luxury hotels, and civilian areas. UAE regulators closed its own stock exchanges for two full days to prevent a panic selloff.
Emaar Properties, the developer behind the Burj Khalifa, fell from 17AED on February 27 to 13.30AED today, a 22% haircut. Aldar Properties, Abu Dhabi’s largest listed developer, dropped 5% the day markets reopened. The bond market for UAE developers is only trading intermittently, with spreads blowing out across the region.
Read more: Odds swing wildly as Polymarket bets on Iran’s successor collapse
Dubai’s crypto-friendly property boom depended on foreign capital, and that capital is now heading for the exits.
In the secondary market, an aggregator tracking distressed property deals shows an average price reduction of 4.9% — for property owners who’ve had enough time to update their asking price, including several properties over 10% lower than their price days ago.
Even before the war, Fitch had warned of declines up to 15% on supply concerns alone. Analysts had already cautioned that new condo supply was set to surge in the second half of 2026, right as demand is cratering.
BTC, for all its reputation as a notoriously volatile asset, is positive since the bombs started falling. Dubai real estate, the supposedly safe store of value backed by marble lobbies and palm-shaped islands, just delivered a massive drawdown.
Got a tip? Send us an email securely via Protos Leaks. For more informed news, follow us on X, Bluesky, and Google News, or subscribe to our YouTube channel.
Strategy just bought nearly 6x more BTC than last week, while Tom Lee’s Bitmine also purchased more ETH than usual.
The largest digital asset treasury (DAT) companies for Bitcoin (BTC) and Ethereum (ETH) added more crypto than usual to their stockpiles last week.
Michael Saylor’s Strategy announced on Monday, March 9, that its latest weekly Bitcoin purchase totaled 17,994 BTC at an average price of about $70,946 per coin. Last week’s buy is nearly 6x larger than the previous week’s buy of 3,015 BTC — which itself marked a notable uptick in accumulation after weekly buys shrank since late January.
The latest purchase bring’s Strategy’s stockpile to 738,731 BTC as of March 8, or about $50.65 billion at current prices. The publicly traded firm remains the largest Bitcoin DAT by holdings, followed by MARA Holdings with 53,822 BTC.
Meanwhile, the second largest DAT company and the largest Ethereum DAT, Tom Lee’s Bitmine Immersion Technologies, announced in a press release today its most recent purchase of 60,976 ETH, bringing its total Ethereum holdings to 4,534,563 ETH as of March 8.
Per the release, last week’s purchase is well above the firm’s recent weekly purchase average of 45,000-50,000 ETH. The previous week, Bitmine bought 51,000 ETH. Bitmine is currently staking 3,040,483 ETH, or about 67% of the 4.5 million ETH that it holds in its treasury.
Also today, the second-largest Ethereum DAT, Sharplink, released its 2025 financial report. Per a press release from the firm, it recorded a $734.6 million net losses last year, a solid chunk of which — $616.2 million — were unrealized losses on its ETH holdings.
Sharplink announced its rebrand to an Ethereum DAT in May of last year — with Consensys CEO and Ethereum co-founder Joseph Lubin as chairman of its board. The firm has accumulated 864,840 ETH to date, at an average cost of $3,588 per ETH, per CoinGecko data.
But, the spot price of ETH had a volatile year in 2025. ETH reached a new all-time high near $5,000 in August, only to end the year struggling near $3,000. ETH is currently trading just over $2,000 at publishing time.


Blockchain.com is expanding its footprint in Africa with a launch in Ghana, deepening a regional push that has already shown strong traction in Nigeria over the past year. The company said it plans to offer Ghanaian users access to its trading platform as it builds out local infrastructure and pursues additional markets across the continent. The Nigeria rollout revealed robust demand, with the brokerage transaction volume up by more than 700% and trading activity centered on Bitcoin (BTC) (BTC) (CRYPTO: BTC), Tether (USDT) (USDT) (CRYPTO: USDT), and Tron (TRX) (TRX) (CRYPTO: TRX).
The Ghana expansion follows a period of rising activity ahead of a formal launch, with the company reporting a 140% increase in active users in the country over the past year and an 80% jump in transaction volumes. Blockchain.com stressed that its strategy in Ghana centers on building out local compliance and regulatory engagement, including a local compliance representation position. The move underscores a broader objective: to accelerate its regional infrastructure, forge partnerships with local payment rails, and position Ghana as a gateway to additional African markets.
“We are actively collaborating with Ghanaian officials and regulators to help build a regulatory framework and have already established local compliance representation in Ghana,” a Blockchain.com spokesperson told Cointelegraph. The emphasis on regulatory alignment mirrors a wider industry trend as exchanges seek clearer paths to operate within increasingly formal oversight regimes across the continent.
The company highlighted the importance of integrating with Ghana’s mobile money ecosystem, noting that such rails are a cornerstone of its strategy in the region. With mobile payments deeply embedded in everyday commerce, the ability to settle trades and fund wallets through popular mobile money channels is viewed as a key driver of uptake for digital assets among a broader cross-section of the population.
Blockchain.com’s Ghana announcement sits within a larger narrative of Sub-Saharan Africa’s rapid crypto growth. The firm already operates in more than 70 jurisdictions globally and has signaled plans to pursue additional African markets as part of a long-term growth plan. That strategy aligns with data from Chainalysis, which shows Sub-Saharan Africa emerging as a hotbed of on-chain activity. The region logged more than $205 billion in on-chain crypto value between July 2024 and June 2025, up 52% from the previous year, placing it among the world’s fastest-growing markets. Nigeria dominates that activity, accounting for more than $92 billion in on-chain value during the same period, with South Africa, Ethiopia, Kenya, and Ghana following closely behind.
The Ghana push also resonates with broader discussions about crypto as a tool for remittances and cross-border payments. At the World Economic Forum Annual Meeting in Davos, Vera Songwe, a former United Nations official, noted that stablecoins are increasingly used to reduce remittance costs, which traditionally run around $6 per $100 sent. In economies grappling with inflation and uneven access to traditional banking, such digital dollar alternatives are gaining appeal as faster, cheaper settlement mechanisms. Songwe’s remarks reflect a growing consensus among policymakers and researchers that digital assets can complement, rather than replace, existing financial systems when properly regulated and integrated.
Beyond Lagos and Nairobi, Africa’s crypto narrative features voices like Africa Bitcoin Corporation founder Stafford Masie, who has argued that Bitcoin is already serving as everyday money in some communities. Masie told the Coin Stories podcast that merchants in certain local economies accept satoshis for goods and services, underscoring a level of grassroots adoption that is outpacing formal channels in parts of the continent. This angle—where crypto acts as day-to-day currency rather than solely as a store of value—adds nuance to the Ghanaian expansion and the continent’s longer-term potential as a regional crypto hub.
Industry observers also point to regional price dynamics and currency volatility as catalysts for crypto uptake. Data from Borderless.xyz indicated that Africa recorded the highest median stablecoin-to-fiat conversion spreads among tracked regions in February, highlighting both demand for dollar-denominated liquidity and the challenges of local fiat markets. Taken together with Chainalysis’ Africa-focused data and Masie’s observations, the Ghana launch can be read as part of a broader pattern in which crypto infrastructure—paired with accessible payments rails—helps broaden financial options for a population that remains largely mobile-first and cash-centric in many communities.
Blockchain.com’s expansion in Ghana comes amid a wider push by global crypto exchanges to establish local footprints across Africa. The Ghana launch—backed by public relations coverage from PR Newswire—signals a willingness to engage with regulators and to tailor product offerings to local conditions. While the practical rollout will hinge on a complex mix of licensing, compliance, and partnerships, the company’s statements emphasize a pragmatic approach: build the necessary regulatory bridges, invest in regional teams, and connect digital assets to existing payment ecosystems to support everyday use cases.
Crypto adoption grows across Sub-Saharan Africa
Crypto use has surged in Sub-Saharan Africa in recent years. Chainalysis’ data for the 12-month period ending mid-2025 shows the region accumulating substantial on-chain value, with Nigeria taking the lead in absolute terms. South Africa, Ethiopia, Kenya, and Ghana are among the other notable centers of activity. Analysts say this demand is driven by cross-border remittances, currency volatility, and a youthful, mobile-first user base seeking access to financial services beyond traditional banks. The Ghana launch sits at the intersection of these dynamics, offering a test case for how a major platform can adapt its services to a regulatory environment and to local payment rails that shape user behavior.
In Davos, Songwe emphasized that stablecoins can offer meaningful improvements in remittance costs and speed, potentially reshaping how money moves across borders in Africa. The combination of lower fees, faster settlement, and broader digital adoption may accelerate not only trading and savings but also merchant adoption as more businesses accept digital assets as payment. The narrative around stablecoins, remittances, and cross-border rails is increasingly central to how policymakers, fintechs, and asset providers view Africa’s crypto opportunity.
As Africa’s crypto story unfolds, Masie’s remarks about Bitcoin as a practical medium of exchange in some regions illuminate a reality that policymakers and investors are watching closely. If more communities begin to adopt crypto for day-to-day transactions, the demand for user-friendly products, local-language support, and compliant, regionally integrated services could rise quickly. For Blockchain.com and similar firms, the Ghana market represents both a proving ground and a springboard for broader regional expansion, where the combination of regulatory clarity, accessible payment rails, and culturally aware service design could accelerate crypto’s mainstream viability on the continent.
Why it matters
The Ghana expansion, alongside Nigeria’s sustained growth, demonstrates that Africa is not merely a speculative backdrop for crypto, but a dynamic testing ground for real-world use cases. Building out local compliance structures and engaging with regulators signals a shift from offshore operations toward regionally anchored models that can adapt to diverse regulatory regimes. For users, this could translate into more reliable access to trading, wallets, and payments that work with familiar mobile money platforms, reducing friction and increasing trust in digital assets.
From an industry perspective, the Ghana launch reinforces the importance of partnerships with payment providers and local banks to unlock liquidity and enable quick settlement. It also underscores the need for clear regulatory frameworks that protect consumers while allowing innovation to flourish. The combination of on-chain growth data, grassroots adoption, and the ongoing push for settlement efficiency suggests a longer-term trajectory where crypto services become embedded in everyday financial activity across Sub-Saharan Africa.
For builders and policymakers, the initiative highlights the critical balance between market access and compliance. As the region navigates licensing regimes, data privacy, and anti-money-laundering standards, a measured, transparent approach will determine whether crypto becomes a durable feature of Africa’s financial architecture or a transient trend. The Ghana moment should be read as part of a broader continental arc—one that could redefine how people in many economies access, move, and use digital value.
What to watch next
- Regulatory milestones in Ghana: licensing decisions, local governance structures, and the pace of market onboarding.
- Speed and scope of mobile-money integrations: new payment rails, KYC requirements, and onboarding timelines for retail users.
- Additional African market entries by Blockchain.com and peers, including partner networks and regional hubs.
- Post-launch adoption metrics in Ghana: active users, transaction volumes, and the mix of assets traded.
Sources & verification
- Blockchain.com Ghana launch press release and regional expansion statements (PR Newswire).
- Chainalysis report on Sub-Saharan Africa on-chain activity and regional growth (September report referenced).
- Vera Songwe remarks on stablecoins and remittances at the World Economic Forum in Davos.
- African crypto insights from Stafford Masie’s Coin Stories interview on Bitcoin as everyday money.
- Borderless.xyz data showing stablecoin-to-fiat conversion spreads by region (February).
Blockchain.com expands in Ghana as Africa strategy accelerates
Blockchain.com is expanding its Africa footprint with a formal push into Ghana, a move described by the company as a continuation of its strategy to grow beyond markets where it already operates. The Ghana initiative follows Nigeria’s rapid uptake, where the platform launched retail operations last year and reported a more than sevenfold rise in brokerage activity. In Nigeria, traders have prioritized Bitcoin (BTC) (BTC) (CRYPTO: BTC), Tether (USDT) (USDT) (CRYPTO: USDT), and Tron (TRX) (TRX) (CRYPTO: TRX), reflecting broad appetite for major digital assets as users experiment with wallets, trading, and payments on the go.
The Ghana plan emphasizes a local presence—comprising regulatory engagement, regional leadership, and partnerships with payment rails—that could accelerate user onboarding and broaden access to digital assets in a country where mobile money is deeply entrenched in daily life. The company’s stance is to establish a regulated, compliant operating framework from the outset, a strategy that aligns with global trends toward clearer oversight as crypto markets mature across the region.
Industry observers note that Africa’s crypto surge has a distinct social dimension. Chainalysis data show that Nigeria remains a dominant driver of on-chain activity for the continent, but the growth story extends beyond a single country. The $205 billion on-chain value figure for the region underscores the scale of activity and the potential for service providers that can offer user-friendly interfaces, robust security, and accessible funding and withdrawal channels to attract a broader base of customers who previously relied on informal channels for cross-border payments and savings.
From a macro perspective, the Ghana launch comes at a time when policymakers are increasingly evaluating how to balance innovation with consumer protection. Songwe’s Davos remarks about stablecoins and remittances reflect a recurring theme: digital currencies can lower costs and speed settlements for cross-border flows, provided that stablecoin issuance, custody, and compliance frameworks are designed with local realities in mind. In practice, this means building partnerships with local banks and payment processors and cultivating a regulatory environment that supports responsible crypto usage while preserving financial stability.
Masie’s account of Bitcoin’s role in some African communities adds texture to the Ghana narrative. If merchants already accept satoshis in daily transactions in parts of the continent, then the Ghana expansion could unlock practical uses beyond speculation, reinforcing the case for a networked economy where crypto acts as a complement to, rather than a substitute for, existing financial channels. In parallel, the ongoing discourse around stablecoins and on-chain liquidity continues to shape how fintechs approach product design, risk management, and customer education as they roll out new services in the region.
Crypto World
There’s another energy market that may get hit harder than oil by Strait of Hormuz closure

A liquefied natural gas (LNG) tanker on a digital screen at the Qatar Economic Forum (QEF) in Doha, Qatar, on Tuesday, May 20, 2025.
Christopher Pike | Bloomberg | Getty Images
Oil prices jumped Monday with traffic in the Strait of Hormuz at a near standstill, but the longer-term implications of the Strait’s closure may be more extreme for the liquefied natural gas market. That’s in part because it’s more difficult to move than crude oil and LNG production is more concentrated.
Roughly 20% of global LNG flows through the Strait – the majority of which is exported from Qatar – and global gas prices are surging after the country last week halted output following an Iranian drone attack.
European natural gas rose 63% last week for its largest percentage gain since March 2022, following Russia’s invasion of Ukraine. Prices in Asia are even higher – trading at $23.40/mmbtu Monday morning – given the majority of Qatari LNG flows to Asia. Asian nations are trying to make up the lost cargoes, and as the spread between European and Asian gas widens, some LNG vessels originally bound for Europe are now U-turning and heading to Asia instead.
Part of Saudi Arabia’s and UAE’s crude has been re-routed through pipelines, but the same infrastructure doesn’t exist for gas. Put another way, a ship is required to transport it long distances.
And while many states in the Middle East produce oil, gas production is concentrated at one industrial complex in Qatar, making the market much more vulnerable going forward, noted Alex Munton, director of global gas and LNG research at Rapidan Energy.
The real risk, Munton said, is how difficult it will be to restart Qatar’s LNG production at Ras Laffan once traffic resumes in the Strait. Given the complexities of cooling gas, which is fundamentally an industrial process, it will take much longer to restart than oil production.
Rapidan predicts that LNG exports from the region won’t begin again until there’s 100% certainty that it is safe for ships to transit the Strait. Insurance is one factor – an LNG tanker can cost $250 million – but the complexity of the process means operations can’t be ramped up and down based on perceived escalations or de-escalations. It will also take weeks, rather than days, to fully restart operations, according to the firm, which added the entire plant has never been taken offline before.
“I don’t think in the first few days of this conflict – we’re only a week in – that there is an appreciation for the length of time that Qatar is going to be offline and the effect it will have on global supply and the global markets,” Munton told CNBC.
QatarEnergy’s liquefied natural gas (LNG) production facilities, amid the U.S.-Israeli conflict with Iran, in Ras Laffan Industrial City, Qatar March 2, 2026.
Stringer | Reuters
The U.S. is the world’s largest LNG exporter, but production is essentially running at max capacity. And with little additional output available worldwide, demand destruction is what might ultimately balance the market. That could include swapping gas for relatively inexpensive coal, for example.
But Munton said an escalation in hostilities, including additional attacks on Qatar’s LNG infrastructure, could lead to larger long-term ramifications. Rapidan’s view is that Iran’s prior attacks against Ras Laffan were a “warning shot that wasn’t the real deal.”
“It’s a sitting duck,” Munton said of the industrial complex. “If Iran wanted to do major damage to Qatar’s LNG capacity, it could … There is no way of defending completely against an Iranian attack if Iran was hell bent on damaging the plant.”
“It’s not like one node can take out all Middle East oil production, because there’s just too many fields, there’s too many countries, there’s too many plants and facilities…but with LNG it’s one facility. It’s a gigantic complex, but it’s just one facility.”
QatarEnergy is now delaying an expansion to its gas facilities until 2027, according to Bloomberg.


Arthur Hayes backs Hyperliquid as his largest liquid shitcoin bet, targeting $150 HYPE as Bitcoin grinds near $69K in a derivatives‑driven, fragile macro regime.
Summary
- Hayes makes Hyperliquid his largest liquid shitcoin position and calls it crypto’s highest quality project by real, fee‑paying users.
- He targets $150 per HYPE by August 2026 if annualized revenues revisit $1.4 billion on modest perp market‑share gains from CEXs.
- ADV/OI metrics and Bybit’s 2026 outlook both underscore that market structure and derivatives flows now drive Bitcoin more than the classic four‑year cycle.
Bitcoin trades firmer near $69K as derivatives-driven market structure collides with a fragile macro backdrop, and Arthur Hayes makes Hyperliquid (HYPE) his “largest liquid shitcoin position.” His latest essay frames Maelstrom as “hype men that monetize attention,” arguing that in a choppy regime “the best performing shitcoins are exchanges” because they keep earning fees even when spot markets stall.
Hayes singles out perp DEX Hyperliquid, calling it “the dominant perp DEX” and “the largest revenue-generating project that isn’t a stablecoin,” with 97% of revenue used to buy back HYPE from the market. In his base case, he targets $150 per HYPE by August 2026, roughly 5x from the “current price of ~$30 at the time of writing,” contingent on 30‑day annualized revenues climbing back to about $1.4 billion and only a modest 3.97% market‑share shift from CEX perps. That thesis leans heavily on HIP‑3 permissionless listings, which in “only four months” have grown to “close to 10% of total Hyperliquid revenues,” driven by perps on silver, gold, Nasdaq 100 and the S&P 500.
Under the hood, Hayes argues that what matters now is structure, not just narratives. He points to the ADV/OI ratio as the “only objective measure to rank exchanges,” concluding that “Hyperliquid’s volumes are the most real out of the top 5 perp DEXs because its ADV/OI ratio is the lowest.” That view echoes broader research like Bybit’s 2026 Crypto Outlook, which says the classic four‑year Bitcoin cycle is fading as “macroeconomic policy, institutional participation, and market structure play a growing role in price formation.”
Macro is not exactly friendly, but crypto is trading with a resilient, derivatives‑heavy profile. Bitcoin changes hands near $69,100, up about 2.7% over the last 24 hours. Ethereum trades around $1,993, with a 24‑hour range between roughly $1,922 and $2,016. Solana sits close to $81.7, down from $83.2 a day earlier, while Hyperliquid changes hands near $34.2, up roughly 13.2% on the session. For Hayes, that backdrop is the setup: “If the macro is figgity fucked for a while, what can I buy? What is the highest quality project that has real users, paying real money, and giving that money back to token holders?” His answer is blunt: “Hyperliquid is the highest quality project in all of crypto across these metrics.”
Dyne Therapeutics, Inc. (DYN) Presents at TD Cowen 46th Annual Health Care Conference Prepared Remarks Transcript

140,000 BTC Exit Short-Term Holders as Capitulation Pressure Builds in Bitcoin

Daily Mail appear to scrub article on meeting


-

 Politics6 days ago
Alan Cumming Brands Baftas Ceremony A ‘Triggering S**tshow’
-
Business3 days ago
Form 8K Entergy Mississippi LLC For: 6 March
-

 Fashion3 days ago
Weekend Open Thread: Ann Taylor
-

 News Videos8 hours ago
10th Algebra | Financial Planning | Question Bank Solution | Board Exam 2026
-

 Tech7 days ago
Cynus Chess Robot: A Chess Board With A Robotic Arm
-

 Tech5 days ago
Bitwarden adds support for passkey login on Windows 11
-
 Sports4 days ago
499 runs and 34 sixes later, India beat England to enter T20 World Cup final | Cricket News
-

 Sports2 days ago
Three share 2-shot lead entering final round in Hong Kong
-

 Sports2 days ago
Braveheart Lakshya downs Lai in epic battle to enter All England Open final | Other Sports News
-

 Business6 days ago
Guthrie Disappearance Enters Fifth Week as Family Visits Memorial
-

 Crypto World4 hours ago
Paradigm, a16z, Winklevoss Capital, Balaji Srinivasan among investors in ZODL
-

 NewsBeat4 days ago
Piccadilly Circus just unveiled ‘London’s newest tourist attraction’ and it only costs 80p to enter
-

 Business1 day ago
Search for Nancy Guthrie Enters 37th Day as FBI Probes Wi-Fi Jammer Theory
-

 Politics3 days ago
Top Mamdani aide takes progressive project to the UK
-

 Entertainment3 days ago
Hailey Bieber Poses For Sexy Selfies In New Luscious Lip Thirst Traps
-
 Sports6 days ago
Jack Grealish posts new injury update as Man City star enters crucial period
-

 Tech5 hours ago
Despite challenges, Ireland sixth in EU for board gender diversity
-

 Crypto World5 days ago
New Crypto Mutuum Finance (MUTM) Reports V1 Protocol Progress as Roadmap Enters Phase 3
-

 Tech4 days ago
ACIP To Discuss COVID ‘Vaccine Injuries’ Next Month, Despite That Not Being In Its Purview
-
Entertainment5 days ago
Harry Styles Has ‘Struggled’ to Discuss Liam Payne’s Death