

Crypto World
Binance Equity Trading Hits 2% of TradFi Perpetuals Volume in First Week on AI Sector Bets

TLDR:
- Binance equity trading recorded ~84% of first-week volume from emerging market users via stablecoins.
- Semiconductors and hardware captured ~44% of total fund inflows, reflecting an AI infrastructure bet.
- Information Technology led sector allocation at 57%, with Funds and ETPs following at a 20% share.
- Binance equity trading hit ~2% of TradFi-referenced perpetuals volume within its first week of launch.
Binance equity trading has completed its first week of live operations, and the early data presents a clear picture of user behavior.
According to Binance Research, the platform drew strong participation from emerging market traders, who accounted for roughly 84% of total trading volume.
Sector allocation patterns and conversion metrics further show that users arrived with defined investment positions rather than casual browsing intent.
AI Infrastructure Bet Drives Sector Allocation
Information Technology captured the largest share of sector allocation in the first week, taking 57% of total inflows.
Funds and ETPs followed at 20%, with Communication Services at 11% and Financials at 9%. The breakdown points to a concentrated preference for technology assets.
Drilling deeper into those figures, semiconductors and hardware alone accounted for approximately 44% of total fund inflows.
Binance Research noted in its thread that users “came in with a thesis,” specifically conviction around the AI infrastructure trade — chips, hardware, and the picks-and-shovels layer of the stack.
That thesis extended to breadth as well. Funds and ETPs led portfolio diversity, with users collectively holding close to 500 distinct instruments in that category.
Information Technology ranked second with approximately 300 unique stocks tracked across user portfolios.
The combination of high sector concentration and wide instrument selection suggests deliberate positioning. Users appear to be building diversified exposure within a focused macro view, rather than chasing a handful of names.
Stablecoin Settlement Opens Direct Access for Global Users
Binance equity trading’s conversion metrics for the first week were equally revealing. Roughly 10% of site visitors signed up for equity access, and approximately 34% of those who signed up placed at least one trade. Binance Research described the figures as a sign of clear intent rather than passive interest.
The 84% emerging market share of volume held steady throughout the entire week, which Binance Research characterized as structural demand rather than a launch spike.
For many of these users, Binance equity trading represents the first accessible route into U.S. equity markets — without fiat on- and off-ramps, and without separate brokerage accounts.
Equity trades on the platform settle in stablecoins, consolidating crypto, equities, payments, and peer-to-peer transfers into a single account infrastructure.
This removes friction points that have historically kept emerging market participants out of U.S. stock exposure.
In terms of volume relative to existing products, Binance equity trading reached approximately 2% of TradFi-referenced perpetuals volume in its opening week.
Binance Research noted that the crypto spot-to-perps ratio has historically run around 15%, framing that as the longer-term convergence target.
The platform’s 2026 growth trajectory across both direct and derivatives TradFi products is positioned as a structural expansion, not a product experiment.


“Crypto + AI” is the new “blockchain + [anything].” A desperate rebrand for failing business models, and investors aren’t buying it.
The Pattern We’ve Seen Before
2017: Every company added “blockchain” to their name and watched their stock price triple.
Kodak became KodakCoin. Long Island Iced Tea became Long Blockchain Corp. A company that made fruit juice rebranded to blockchain and saw its shares surge 200% overnight.
None of it was real. All of it eventually collapsed.
2026: The same thing is happening with AI. Except this time, it’s crypto companies doing the rebranding—and it’s failing faster.
What’s Actually Happening Right Now
Bloomberg reported it today: the once-hot market for cryptocurrency treasury stocks has imploded. Companies that bet their entire identity on Bitcoin accumulation are now pivoting to artificial intelligence to win back investors.
The numbers are brutal:
K Wave Media, a former Bitcoin accumulator that shifted to data center development, has seen its shares fall 71% since rebooting in May.
Satsuma Technology approved the full liquidation of its 668 BTC. The move was so drastic it triggered the company’s delisting from the London Stock Exchange. A company deleted itself from a major exchange to exit crypto.
Sequans Communications sold 1,025 BTC, along with almost 80% of its remaining holdings, just to repay convertible debt.
MARA Holdings and Bitdeer have been selling Bitcoin to repay debts while simultaneously redirecting resources toward AI data centers.
Even Strategy, formerly MicroStrategy, the loudest evangelist for the corporate Bitcoin treasury model, sold approximately 3,620 BTC and authorized further sales. They still hold over 840,000 BTC, making them the largest corporate holder. But even the true believer is selling.
The corporate Bitcoin treasury model isn’t just struggling. It’s unwinding in real time.
Why The AI Pivot Isn’t Working
Here’s what these companies are betting on: if we say “AI” enough times, investors will forget we said “Bitcoin” and give us another chance.
It’s not working. K Wave Media’s 71% decline happened after the pivot, not before.
Why? Because investors aren’t stupid. They’ve seen this movie before.
When a company pivots its entire identity to chase a hot trend, it signals one thing: the original strategy failed, and management has no real conviction about what comes next.
A Bitcoin treasury company that suddenly loves AI data centers isn’t a tech innovator. It’s a company trying to survive by attaching itself to whatever narrative is currently attracting capital.
The market can tell the difference between a genuine AI company and a crypto company that bought a few Nvidia chips and updated its press release.
Turns out, so can Bloomberg.
Brian Armstrong Saw This Coming
Coinbase CEO Brian Armstrong said it this week, publicly:
Crypto startups that rebrand to AI are missing the point. Blockchain technology isn’t competing with AI; it’s the infrastructure that will underpin future automation.
Armstrong’s argument is precise: these aren’t two separate things you can choose between. AI needs infrastructure. Blockchain provides trustless, verifiable infrastructure for AI agents, AI transactions, AI governance.
Companies pivoting from “crypto” to “AI” as if they’re alternatives are making a category error. And they’re making it because they’re panicking, not because they have a strategy.
The companies that will survive aren’t the ones that abandoned crypto for AI. They’re the ones that understood crypto is the infrastructure for AI and built accordingly.
The Real Problem: Business Models Built On Hype
Let’s be honest about what the corporate Bitcoin treasury model actually was.
Companies like MicroStrategy (now Strategy) made a bet: buy Bitcoin, hold it, watch the price go up, use the appreciation to justify your existence as a company.
That’s not a business. That’s a leveraged Bitcoin position dressed up as corporate strategy.
When Bitcoin price goes up, you look like a genius. When it stagnates, as it has for much of 2026, hovering around $64–65K, you look like a company with no real business model, sitting on an asset that isn’t moving, with investors asking uncomfortable questions about your actual operations.
The crypto treasury model required perpetual Bitcoin appreciation to work. The moment appreciation slowed, the model broke.
And now those same companies are trying to claim they were always AI companies really.
The Difference Between Real AI And AI Panic
There’s a meaningful difference between companies building genuine AI infrastructure and companies slapping “AI” on a failing crypto strategy.
Real AI infrastructure companies:
- Have actual compute resources being used by actual customers
- Generate revenue from AI services, not just from asset appreciation
- Have technical teams building real AI products
- Can explain what their AI actually does
Crypto companies pivoting to AI:
- Announce plans to build AI data centers
- Haven’t yet generated meaningful AI revenue
- Are selling Bitcoin to fund the pivot
- Can’t clearly explain how AI fits their original thesis
K Wave Media’s 71% decline after its pivot tells you which category investors think it falls into.
The Deeper Pattern: What Happens When A Narrative Breaks
Every market cycle has a dominant narrative. The narrative attracts capital. Capital inflates valuations. Valuations attract more capital. Until the narrative breaks.
2021–2022 crypto narrative: Bitcoin is digital gold, crypto is the future of finance, every company should have a Bitcoin treasury.
Companies built entire identities around that narrative. Stock prices reflected narrative premium, not business fundamentals.
2023–2025: Narrative weakens. Institutional adoption happens but stabilizes rather than explodes. Bitcoin sits at $60–65K instead of going to $200K as predicted. The narrative premium evaporates.
2026 desperation move: Attach to the new dominant narrative (AI) before investors fully price in that the old narrative failed.
The problem: AI investors are sophisticated. They know what real AI companies look like. A Bitcoin accumulator with an Nvidia press release isn’t one of them.
Who’s Actually Winning
While crypto treasury stocks implode, two categories of companies are doing well:
1. Companies that built genuine products on blockchain infrastructure
Coinbase, whatever its challenges, built an actual exchange with actual users generating actual revenue. It has a real business that doesn’t depend on Bitcoin price appreciation alone.
2. Companies building AI infrastructure that happens to use blockchain
The companies Armstrong is describing: building the trustless infrastructure layer that AI agents will need to transact, verify, and operate at scale. This is real. It has genuine demand. It’s not a rebrand.
The companies failing are the ones that were never really building anything, just accumulating an asset and hoping appreciation would substitute for operations.
The Uncomfortable Question For Every Crypto Company
If your business model requires the price of Bitcoin to keep going up forever to justify your existence, what do you actually do?
That’s the question the imploding treasury stocks can’t answer.
And “we’re pivoting to AI” isn’t an answer. It’s a postponement.
The companies that survive the current shakeout will be the ones that had actual operations, actual users, actual revenue— that happened to use blockchain or crypto as infrastructure.
The ones that don’t survive will be the ones that confused “holding Bitcoin” with “building a company.”
The AI rebrand just delays the reckoning by a quarter or two.
What Comes Next
Expect more of this: crypto companies announcing AI pivots, investors not being fooled, stock prices continuing to decline, companies eventually running out of runway.
Expect fewer of this: genuine companies built on blockchain infrastructure, serving real users, generating real revenue—that will be fine.
The shakeout was always coming. The Bitcoin treasury model worked during appreciation. It was never a real business. Now that appreciation has slowed, the reality is visible.
The AI pivot is the last gasp. Not a new beginning.
The Lesson That Never Gets Learned
Every market cycle produces the same story:
Narrative attracts capital. Capital inflates valuations beyond fundamentals. Smart money exits. Companies desperately rebrand to the next narrative. Doesn’t work. Collapse.
2017: Blockchain everything. 2021: NFT everything, metaverse everything. 2024–2025: Bitcoin treasury everything. 2026: AI everything.
The companies that survive every cycle are the ones that were never chasing the narrative in the first place. They were building something real that happened to use the technology everyone else was hyping.
Those companies exist in crypto. They’re just not the ones making headlines this week.
If your crypto strategy requires Bitcoin to go up forever, you don’t have a strategy. You have a bet. And bets eventually lose.


Cantor Fitzgerald is advising Swiss digital asset lender AMINA Bank on a possible public listing as the Wall Street firm expands its role in crypto capital markets.
Summary
- AMINA Bank is considering a public listing, although its valuation and preferred exchange remain undisclosed.
- Cantor’s mandate follows its onchain IPO partnership with Securitize, announced earlier in July.
- AMINA recorded 69% revenue growth in 2024 and holds regulatory approvals in Switzerland and Europe.
- Cantor is also reportedly pursuing a separate deal involving up to 30,000 Bitcoin from Blockstream.
AMINA Bank considers a public listing
According to reports, Cantor Fitzgerald is advising AMINA Bank, formerly known as SEBA Bank, as the Swiss crypto lender assesses a potential entry into public markets.
Discussions remain at an early stage, and neither company has disclosed a target valuation, timetable or possible listing venue. A completed transaction would make AMINA one of the few publicly traded banks focused primarily on digital asset services.
The bank operates under a licence from the Swiss Financial Market Supervisory Authority, or FINMA. Its services include cryptocurrency custody, trading, lending and staking for institutional and private clients.
AMINA reported a 69% increase in revenue during 2024. That performance positioned it as Switzerland’s fastest-growing crypto bank at the time, although updated financial figures for 2025 and 2026 were not provided.
A listing would expose the bank to greater financial disclosure and corporate governance requirements. It could also give public-market investors direct exposure to a regulated crypto banking business rather than a cryptocurrency exchange, miner or treasury company.
Cantor expands its crypto capital markets business
The advisory role builds on Cantor’s wider attempt to connect traditional capital markets with blockchain-based financial infrastructure.
As previously reported by crypto.news, Cantor partnered with tokenization company Securitize on July 15 to support blockchain-based initial public offerings and follow-on share sales.
Cantor will provide equity capital markets and trading services under that agreement. Securitize will supply the technology needed to issue, distribute and service securities onchain, while its SEC-registered broker-dealer, Securitize Markets, will participate in offerings and settlements.
That structure differs from platforms that create blockchain-based versions of shares already trading on public exchanges. The partnership aims to use blockchain infrastructure during the original issuance process while keeping offerings within existing securities rules.
Advising AMINA fits that strategy, although no indication has emerged that the bank would use Securitize’s infrastructure for its potential listing.
AMINA builds its European regulatory reach
AMINA’s regulatory position could form an important part of its case to public investors.
Alongside its Swiss banking licence, the group secured authorization under the European Union’s Markets in Crypto-Assets framework through its Austrian subsidiary. AMINA described itself as the first international crypto banking group to obtain a MiCA licence.
The approval allows the subsidiary to offer regulated crypto services across European Economic Area markets through MiCA’s passporting system, subject to applicable local requirements.
AMINA expanded its asset support in May 2026 by becoming the first regulated bank to provide custody and trading services for Canton Coin. Canton Network focuses on blockchain infrastructure for regulated financial institutions.
For US investors, access to AMINA shares would depend on where the bank lists and whether American brokerages support the security. A US listing would also bring additional Securities and Exchange Commission registration and disclosure requirements, but the parties have not identified the United States as a venue.
Cantor pursues a separate $3 billion Bitcoin deal
Cantor is also reportedly negotiating with Blockstream co-founder Adam Back over a transaction that could place more than $3 billion in Bitcoin into a publicly traded vehicle.
Under the proposed deal, Blockstream would contribute as many as 30,000 BTC to Cantor Equity Partners 1, a special purpose acquisition company that raised $200 million in January. Blockstream would receive shares in return, while the vehicle would be renamed BSTR Holdings.
The agreement could reportedly be signed as early as this week, although its terms remain subject to change.
Cantor has not disclosed when AMINA might decide whether to proceed with its listing. The bank’s chosen exchange, valuation and offering structure will determine whether the plan develops into a conventional IPO, another public-market transaction or an onchain issuance tied to Cantor’s tokenization strategy.
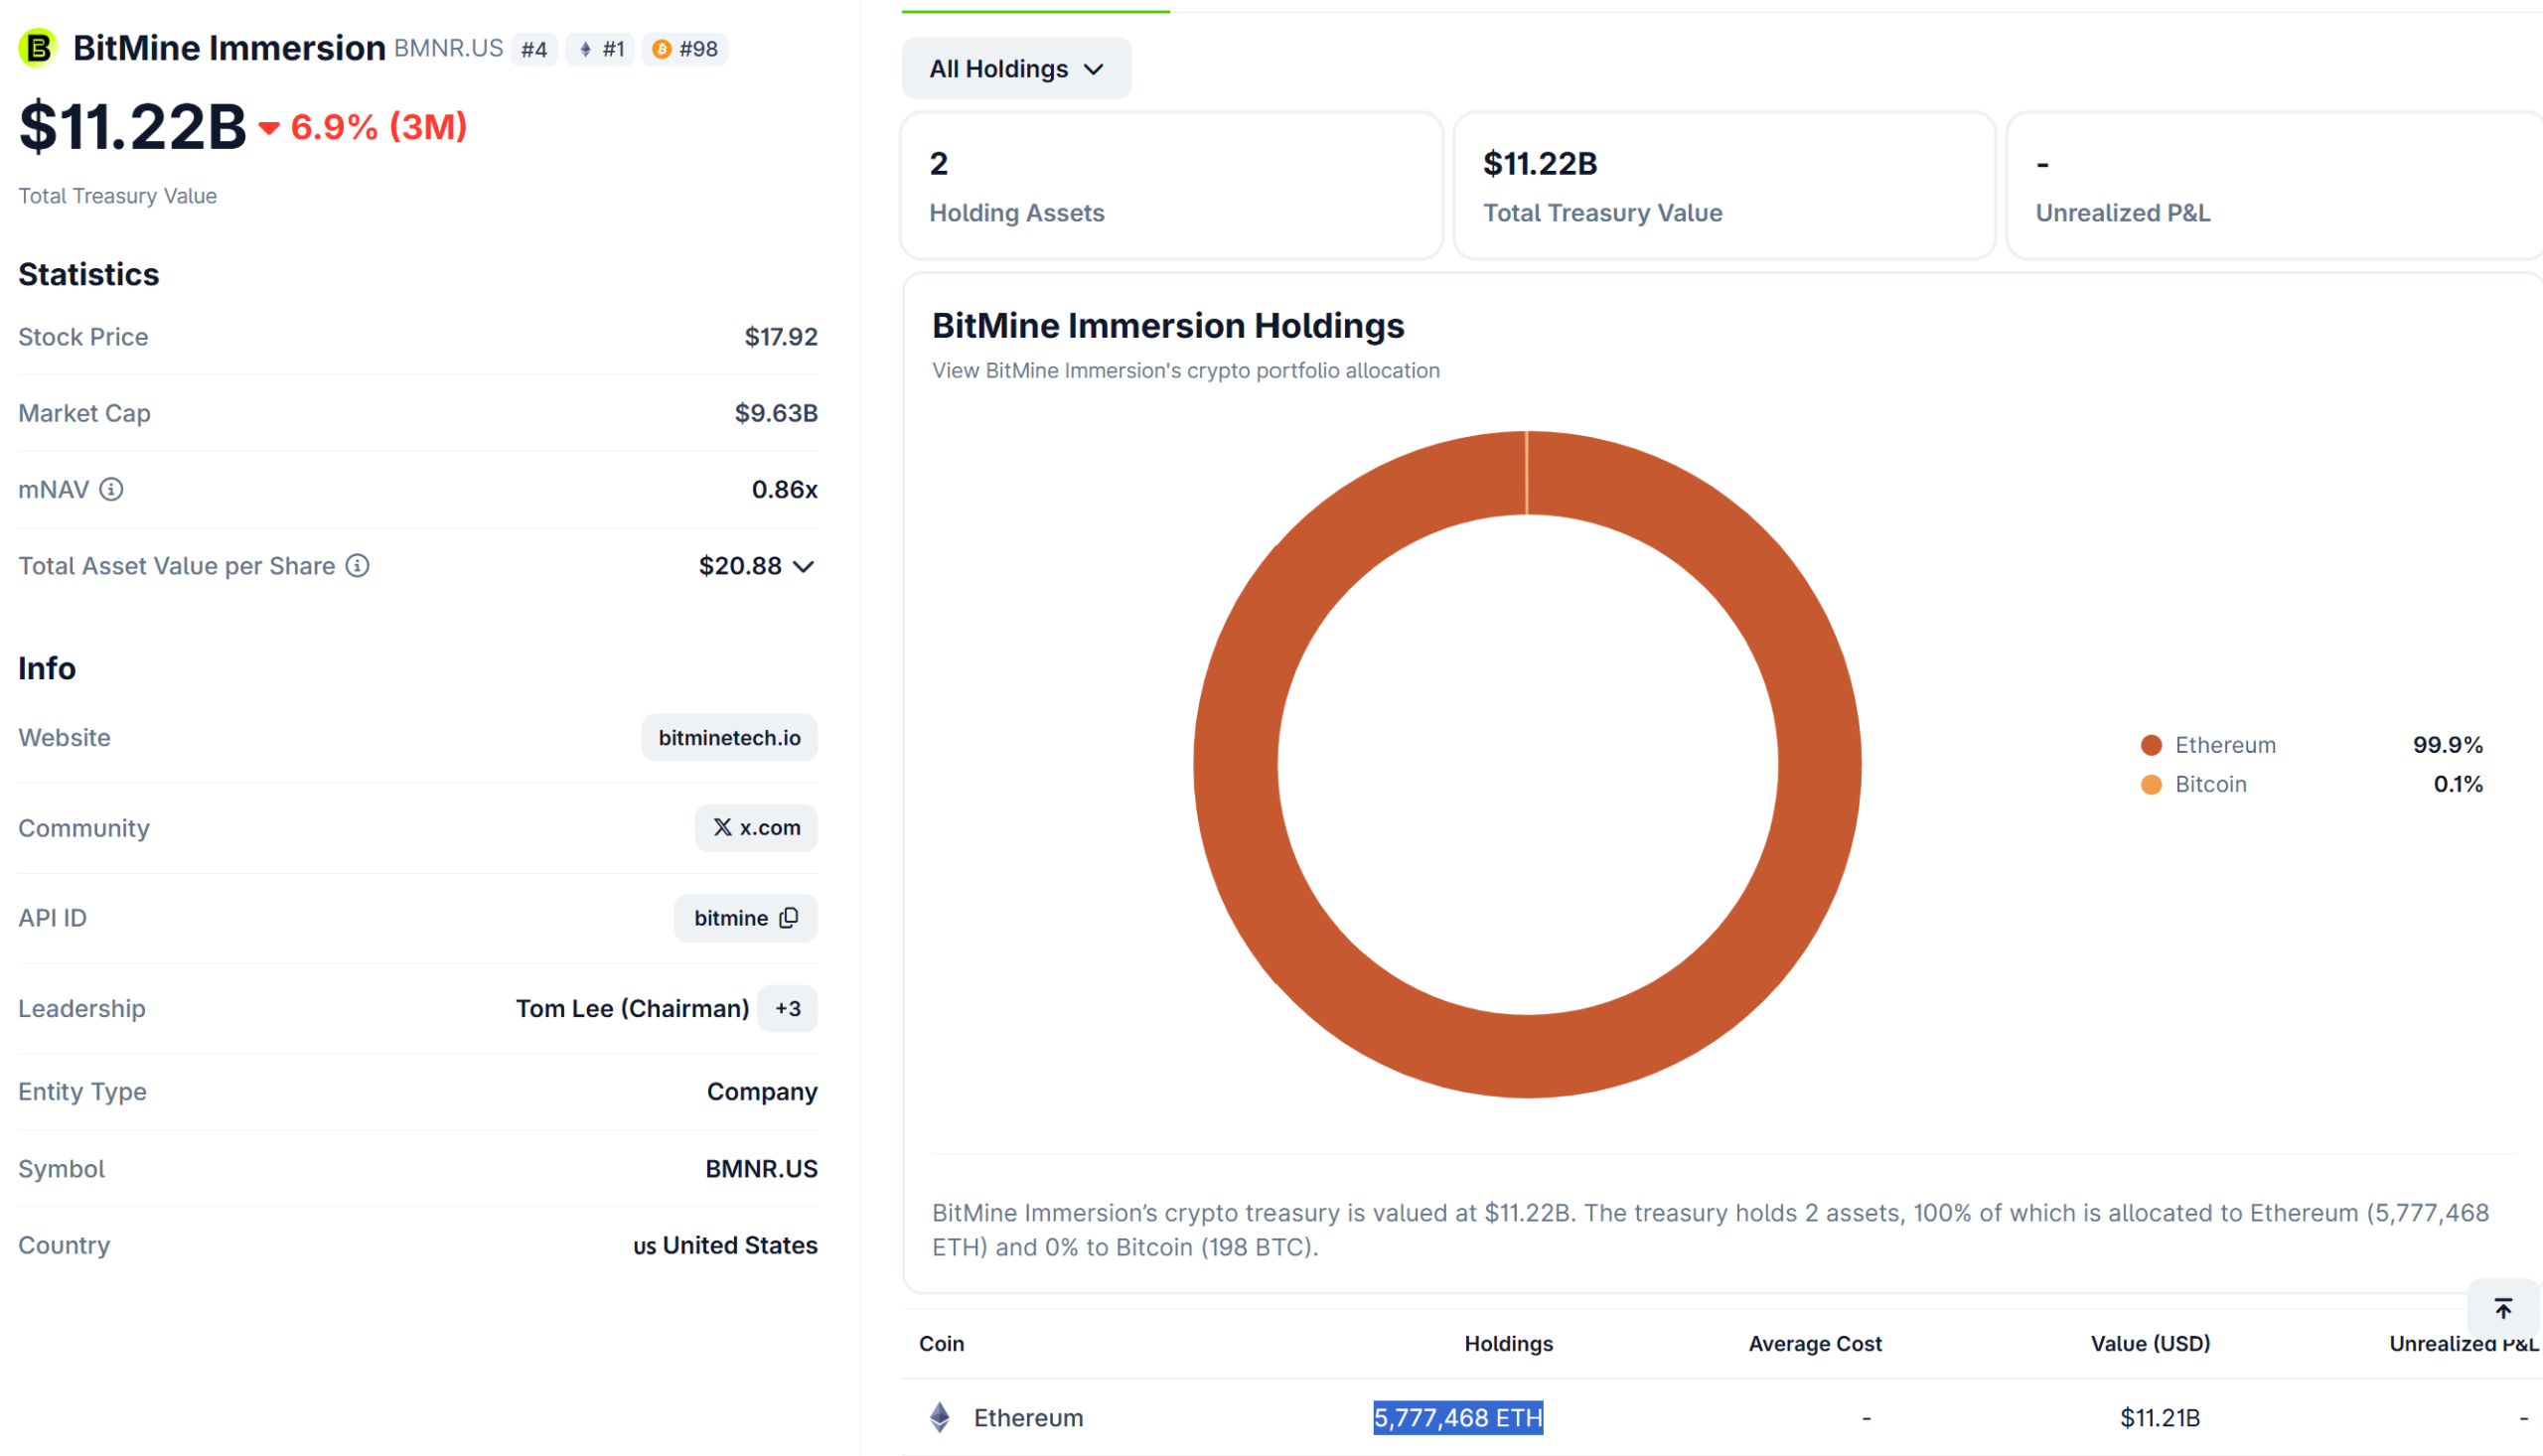
Tom Lee has called Lighter (LIT) a breakout success and a critical piece of Ethereum’s infrastructure. The remarks follow a new Bankless interview with the exchange’s founder.
Lee is no casual voice here. He chairs BitMine, which calls itself the world’s largest Ethereum treasury. The firm holds 5.79 million ether.

Why Does Tom Lee’s Lighter Call Matter?
Lee co-founded the research firm Fundstrat. He also chairs BitMine, listed on the NYSE as BMNR.
BitMine disclosed 5.79 million ether on Monday. Nearly 4.92 million of those coins are staked. So Lee holds a huge bet on Ethereum getting used.
Ether (ETH) now trades near $1,944. It is down about 49% in a year.

“Lighter is a massive breakout success and a critical infrastructure layer for Ethereum,” said Tom Lee, chairman of BitMine Immersion Technologies.
Follow us on X to get the latest news as it happens
Here is what makes the post notable. Lee’s July investor message listed Robinhood, Coinbase and Kraken’s Ink as Ethereum’s layer-2 winners. Lighter was not on it. Now he calls Lighter critical.
That is a new name on the list he uses to argue Ethereum’s Wall Street case.
What Is Lighter?
Lighter is an Ethereum layer-2 perp DEX. In plain terms, it lets people trade crypto with leverage, without a company holding their coins.
It runs on zero-knowledge proofs. These let anyone check that trades and liquidations were handled fairly.
The scale is real. Lighter handled $43 billion in trading volume over 30 days. It holds $822 million in open bets and $525 million in deposits.
Founder Vlad Novakovski finished Harvard at 18. He later traded at Citadel and ran engineering at Addepar. He told Bankless the system took 18 months to build.
Lighter began as a networking app called Lunch Club. It switched direction in 2022. It later raised a $68 million funding round from Founders Fund, Ribbit Capital and Robinhood Ventures.
But Is Lighter Growing?
Lighter (LIT) trades near $2.19. It is up 4.7% today and 23.7% this month. Its market value sits near $547 million.

The earnings trend is weaker. Quarterly revenue fell from $39.7 million to $19.7 million, then to $9.6 million.
LIT also sits far below its $7.86 high from December. It stays above its $0.78 low from March.
Lee calls Lighter infrastructure, not a trade. He has also said BitMine wants to invest in crypto unicorns. That gives his praise a second meaning.
The post Tom Lee Says This Ethereum Project Could Be a Game-Changer appeared first on BeInCrypto.
Last week, the OG meme coin briefly tumbled under a key level, prompting analysts to warn that the bears might tighten their grip.
However, the bulls managed to claw back part of the losses, and now DOGE is once again the subject of a wave of optimistic price predictions – some of which sound quite unrealistic (considering the current condition of the market).
The Rare Signals
Dogecoin has been hovering around $0.07 over the past week, currently trading slightly above $0.071, which, according to the analytics platform Santiment, is vital for its bullish path ahead.
At one point last week, the renowned analyst Ali Martinez revealed that the meme coin’s TD Sequential indicator has flashed multiple consecutive buy signals, describing the development as “a rare setup that could be warning a major bull rally is approaching.”
Earlier today (July 27), he infused even more optimism. Martinez claimed that DOGE “is screaming bullish” after the TD Sequential has printed buy signals on the monthly, weekly, 3-day, and daily charts.
“It’s rare to see this kind of alignment across so many timeframes at once,” he added.
MikybullCrypto also presented certain bullish factors in favor of Dogecoin. First, they claimed that the meme coin is sitting on a historical level that could deliver a major 10x rally. Shortly after, the analyst reiterated their thesis, saying:
“It seems a historical breakout is about to occur. The squeeze has become so tightened.”
The Vital Condition
Over the weekend, some of the well-known meme coins posted substantial gains, with X user Daan Crypto Trades noting the development and saying, “it’s always good to watch the biggest one.” The analyst suggested that DOGE could show a real sign of strength if it retaces the $0.08 zone.
Alternatively, they opined that dropping to the high timeframe support range between $0.055 and $0.061 is “generally good for long term/bear market accumulation.” Joshuwa Roomsburg paid special attention to the $0.08 as well, stating:
“That level could turn a bounce into strength holders can trust. Memes move on attention. They hold on follow-through.”
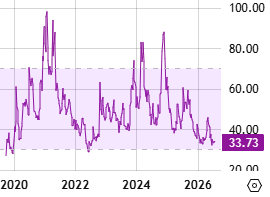
Meanwhile, certain technical indicators support a potential bullish scenario. DOGE’s Relative Strength Index (RSI), for instance, has dropped to nearly 30 on a weekly scale, the lowest point since the summer of 2022.
The technical analysis tool runs from 0 to 100, and readings around and below 30 usually indicate that the asset has entered oversold territory and could be due for a resurgence. On the other hand, ratios above 70 are interpreted as warnings for an impending pullback.
The post Dogecoin (DOGE) Flashes Major Buy Signals: 10x Rally Ahead? appeared first on CryptoPotato.
El Salvador’s two main opposition parties named their candidates for the February 2027 presidential election. The move sets up a challenge to President Nayib Bukele’s third-term bid and the Bitcoin (BTC) strategy built around him.
The Nationalist Republican Alliance, ARENA, picked former lawmaker Maytee Iraheta. The Farabundo Marti National Liberation Front, or FMLN, tapped physician and union leader Rafael Aguirre. Neither rival has embraced Bukele’s Bitcoin strategy; in fact, both campaigns have openly criticized it as a fiscal failure.
Both now face a president who remains broadly popular after six years in office.
Bukele’s Third Term Tests a Rewritten Constitution
Bukele’s Nuevas Ideas party nominated him this month. His running mate remains Vice President Felix Ulloa.
For ARENA, the ticket marks a historic first, with Iraheta and her running mate forming the party’s first all-female pairing. Neither party has proposed a rival Bitcoin policy, and both would need a broader coalition to challenge Bukele’s strategy in Congress. ARENA holds just two seats in the Legislative Assembly, and the FMLN has had none there since 2024. Whoever wins in February will govern until 2033.
That imbalance reflects Bukele’s dominant approval rating, which recently topped 94 percent in one national poll. Crime, not Bitcoin, appears to drive that support. Only 2.2% of Salvadorans call Bitcoin his biggest failure, according to one recent poll.
Bitcoin’s Legal Status Already Shifted
Notably, Bitcoin is no longer a mandatory legal tender in El Salvador. Following a $1.4 billion International Monetary Fund (IMF) loan agreement in February 2025, the government removed the requirement for businesses to accept the token. This pivot effectively returned the US dollar to its status as the nation’s sole official currency for everyday commerce
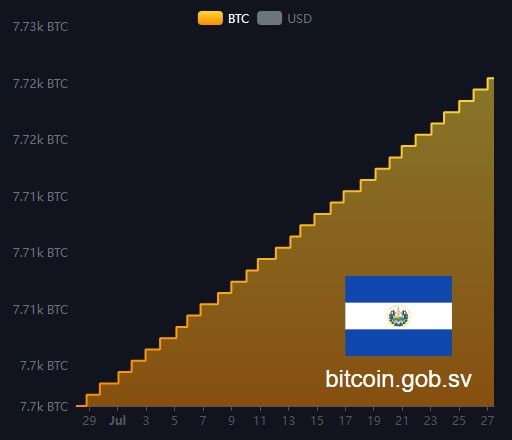
Still, the National Bitcoin Office kept buying roughly one BTC per day. The government boosted its gold reserves in January. The IMF has repeatedly warned that the Bitcoin push carries fiscal and governance risks. It has also been said that the strategy has not measurably improved financial inclusion for unbanked Salvadorans.
El Salvador’s own Bitcoin Office tracker shows holdings climbing to roughly 7,730 BTC as of July 27. That is up from about 7,700 BTC a month earlier, a steady daily staircase that confirms Bukele’s one-BTC-a-day pledge is still active.

A Reserve Exposed to Bitcoin’s Swings
Therefore, the next president inherits a bet still tied to the market. Bitcoin trades near $65,300, and its price outlook for August flags further swings ahead. The token remains roughly half its October 2025 record above $126,000.
That decline already erased nearly $300 million from the state’s holdings earlier this year. Some analysts, meanwhile, tie Bitcoin’s next move to pending US regulation rather than El Salvador’s politics.
Ultimately, February’s vote will settle the matter. The next administration, whoever leads it, will decide whether that accumulation continues or comes to a halt.
The post Bitcoin Course at Risk in El Salvador? 2027 Election Rivals Challenge Nayib Bukele appeared first on BeInCrypto.

The banking-as-a-service provider will power X Money’s peer-to-peer payments, FDIC-insured accounts and Visa debit cards as the platform expands its financial services.
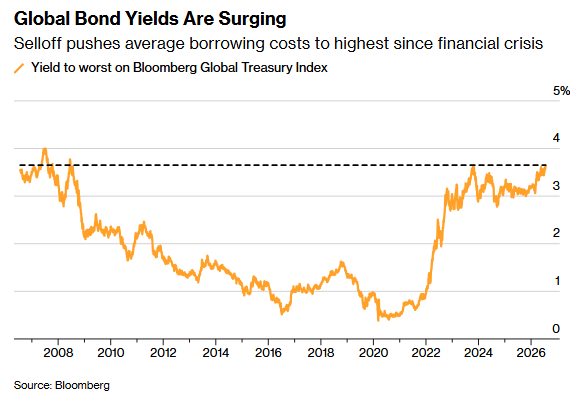
Average yields on the Bloomberg Global Treasury Index climbed to 3.68%, the highest level since the 2008 global financial crisis. The selloff lands days before rate decisions from the Federal Reserve, Bank of Japan, and Bank of England.
The index tracks government debt from investment-grade countries. It is heading for its biggest monthly drop since March, challenging hopes that the worst of this year’s bond rout has passed.
Global Bond Yields Surge Across Every Major Market
US 30-year Treasury yields trade just below their highest level since 2007. UK gilts have logged their longest streak of daily closes above 5% in almost two decades, according to Bloomberg.

Germany’s 10-year yield has reached its highest point since 2011. Meanwhile, Japan’s 40-year yield moved above 4%, and its five-year yield hit a record since the maturity launched in 2000. Australia now carries the highest benchmark yields in the developed world.
Bond prices fall when yields rise, so the pain shows up in funds. BlackRock’s iShares 20+ Year Treasury Bond ETF fell almost 5% in one month. The fund has lost more than half its value since 2020, while the global benchmark sits roughly 20% below its early-2021 peak.
Why the Selloff Refuses to Cool
Strong US employment and growth data flipped rate expectations from cuts to possible hikes. Traders assign roughly a one-in-three probability to a hike at the July 28-29 meeting, where a split among 104 economists shows how uncertain the path remains.

Fed Chairman Kevin Warsh has also cut back on forward guidance. Consequently, the ICE BofA MOVE Index, which measures bond market volatility, hit a two-month high on Thursday.
Bank of America said less guidance lets markets price the action they believe the Fed should take. Barclays warned that a hike, or a poorly explained hold, could push parts of the curve higher.
Energy added pressure earlier in the week. Brent crude broke above $100 on Thursday, reviving inflation fears, before it fell 7% on Sunday after Iran signaled a pause, while gold climbed above $4,100.
What Rising Yields Mean for Crypto
Higher government bond yields raise the risk-free rate that every other asset must beat. That pressures equity valuations, corporate borrowing costs, and governments carrying heavy debt loads.
Moody’s believes markets may have entered a period of structurally higher inflation, higher rates, and wider fiscal deficits. For crypto, that cuts both ways. Expensive money competes for capital, yet fiscal stress strengthens the case for hard assets.
Bitcoin (BTC) has held firm so far, trading near $65,157, up 1.3% over the past day. Whether that resilience holds depends partly on how two central banks act this week.
Wednesday’s Fed decision will show whether bond markets have priced policy correctly, or whether yields have further to climb.
The post Global Bond Yields Hit Highest Level Since 2008 as Fed Decision Looms appeared first on BeInCrypto.


Metaplanet plans to use its newly acquired Japanese brokerage to develop Bitcoin-backed bonds offering yields of roughly 4% to 6%, according to Benchmark.
Summary
- Metaplanet envisions issuing Bitcoin-backed bonds yielding between 4% and 6%.
- Its JPY 2.1 billion Siiibo Securities acquisition provided a regulated Japanese securities platform.
- Future Bitbonds could move onchain with stablecoin settlement and trade on a secondary market.
- Benchmark maintained its Buy rating and JPY 405 price target for Metaplanet stock.
Metaplanet Securities could become a Bitbond platform
Benchmark analyst Mark Palmer argued that investors have underestimated the importance of Metaplanet’s acquisition of Siiibo Securities, which closed for JPY 2.1 billion, or roughly $13 million.
“When Metaplanet closed its ¥2.1 billion (~$13 million) acquisition of Siiibo Securities … the market largely read the deal as a modest bolt-on,” Palmer wrote. “Our discussion last week with Dylan LeClair … made it clear that this reading badly undersells the company’s plans for the firm it acquired.”
Metaplanet used the acquired brokerage to launch Metaplanet Securities earlier in July. The subsidiary operates as a digital asset investment banking business focused on Bitcoin-linked financial products.
The transaction also gave Metaplanet control of a Type I Financial Instruments Business Operator licence regulated by Japan’s Financial Services Agency. The licence permits the subsidiary to structure and distribute securities in Japan.
According to LeClair, Metaplanet’s director of Bitcoin strategy, obtaining a similar licence from scratch would normally require several quarters or longer. Acquiring Siiibo therefore gave the company an existing regulatory base for its planned fixed-income business.
How the proposed Bitcoin-backed bonds would work
Metaplanet reportedly intends to turn its securities subsidiary into a platform where companies adopting Bitcoin treasury strategies can issue debt to finance BTC purchases.
The proposed instruments, called “Bitbonds,” could initially offer annual yields of about 4% to 6%. Metaplanet then plans to bring the bonds onchain, use stablecoins for settlement, and establish a secondary market over the next several years, according to Benchmark’s assessment reported by The Block.
That model would expand Metaplanet beyond raising capital for its own Bitcoin purchases. Its brokerage could instead structure and distribute debt for other companies seeking to add BTC to their balance sheets.
Metaplanet has not disclosed final issuance terms, eligible investors, collateral ratios or a launch date. The projected yield therefore remains part of the company’s longer-term plan rather than an active bond offering.
Project Nova moves beyond a passive Bitcoin treasury
The Bitbond proposal forms part of Project Nova, Metaplanet’s plan to use its Bitcoin balance sheet to develop financial services and acquire cash-generating businesses.
Days before Benchmark disclosed further details, Metaplanet began a joint study with yen stablecoin issuer JPYC, tokenization platform Progmat and Metaplanet Securities. The group is examining whether Bitcoin could serve as collateral or a credit-enhancement asset for digital corporate bonds and other credit products.
The study covers product design, regulation, investor safeguards, distribution and stablecoin settlement. It will also assess security tokens, round-the-clock trading and daily interest calculations.
However, the participants have not approved a product, issuance date, yield or distribution structure. Metaplanet previously stated that “nothing has been determined,” keeping the study separate from any confirmed commercial launch, as crypto.news reported on July 10.
Benchmark keeps Buy rating on Metaplanet stock
Palmer said the market continues to price Metaplanet mainly as a listed proxy for Bitcoin, even as the company prepares infrastructure for a broader capital-markets business.
“Our takeaway is that the market is still pricing Metaplanet as a passive Bitcoin proxy while the company is preparing to execute on a plan to bootstrap an entire capital market.”
Benchmark maintained its Buy rating and JPY 405 price target for Metaplanet stock. The company holds 43,000 BTC worth nearly $2.8 billion, making it the third-largest publicly traded corporate Bitcoin holder, according to the report.
For US investors, the proposal provides another comparison with Bitcoin treasury companies such as Strategy, which has used debt, equity and preferred stock to finance BTC purchases. However, Metaplanet’s Japanese licence does not automatically authorize Bitbond sales in the United States. Any US offer would need SEC registration or an applicable exemption under federal securities laws, according to SEC guidance.
Metaplanet’s next steps will depend on product approvals, talks with Japanese regulators, and whether issuers show demand for Bitcoin-backed corporate debt.
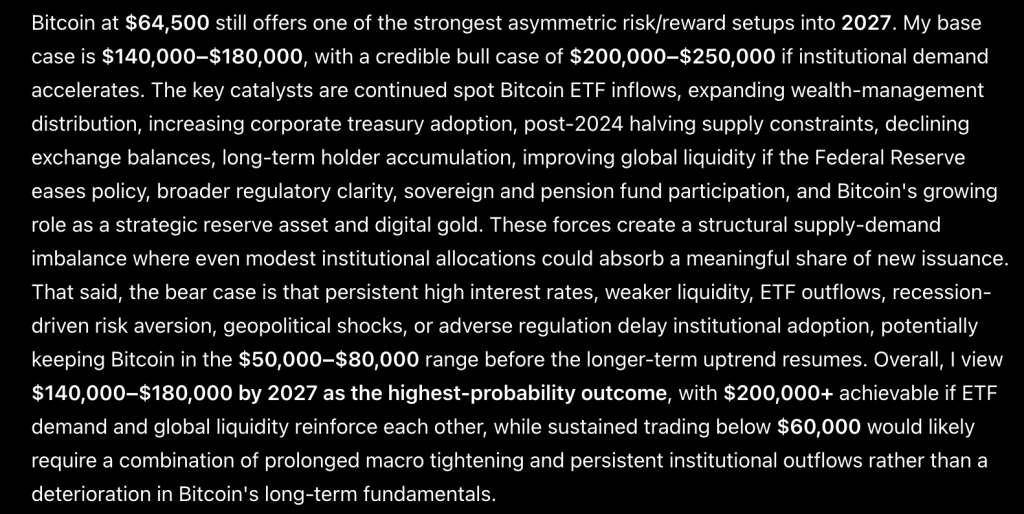
Sam Altman ChatGPT AI is extending the timeline on this one. Rather than an end-of-year prediction, it frames the Bitcoin price prediction at $64,500 as a 2027 setup and calls it one of the strongest asymmetric risk-reward positions available right now.
The base case sits at $140,000 to $180,000. A credible bull case reaches $200,000 to $250,000 if institutional demand actually accelerates from here.
The catalyst list is long, but the underlying logic is simple. Continued spot ETF inflows, expanding wealth management distribution, and growing corporate treasury adoption all pull the same lever: more structural buyers competing for a shrinking pool of coins.
Post-2024 halving, supply constraints are already in effect. Layer declining exchange balances and long-term holder accumulation on top, and ChatGPT sees a market where sellers are becoming scarce at the exact moment demand keeps widening.

Macro matters here, too. Improving global liquidity if the Fed eases, broader regulatory clarity, and early participation by sovereign or pension funds would all push in the same direction.
ChatGPT frames Bitcoin’s evolving role as a strategic reserve asset and digital gold as the connective thread running through it all. The argument is that even modest institutional allocations could absorb a meaningful share of new issuance, given how constrained supply already is.
The bear case is not soft. Persistent high rates, weaker liquidity, ETF outflows, a recession-driven flight from risk, geopolitical shocks, or adverse regulation could all delay institutional adoption.
In that scenario, ChatGPT sees Bitcoin stuck in a $50,000 to $80,000 range before any longer-term uptrend resumes. Notably, the model draws a hard line at $60,000, arguing that sustained trading below it would require actual macro tightening and real institutional outflows, not just a normal pullback.

Bitcoin Price Prediction: Five Years On A Weekly Chart Says This Is Still The Same Cycle
Zoom out to the weekly and the story changes shape entirely. Bitcoin closed the week at $64,634, essentially flat, with a range between $63,666 and $66,921.
From the 2022 bear market low, the climb into 2025 was one of the cleanest uptrends this asset has ever produced, breaking cleanly above the old 2021 highs and pushing toward $128,000 by late 2025. What followed was a sharp, multi-month correction that has brought the price back to a level it last visited over a year ago.
That is the uncomfortable part of this chart. Price today sits almost exactly where it did before the 2024 to 2025 rally even started, meaning the last twelve months have effectively round-tripped.
Support on this weekly view sits at $60,000, a level defended multiple times through 2024 before the breakout. Below that, $52,000 marks the last major consolidation floor from earlier in the cycle.
Resistance is layered higher up, first at $84,000, then the heavier ceiling near $110,000 to $120,000 where the 2025 top formed. Reclaiming that zone would be the first real signal that the uptrend has resumed rather than just paused.
Momentum on the weekly is neutral, neither compressed nor extended, which fits a market that has spent months digesting a major move rather than trending in either direction.
For ChatGPT’s 2027 targets to play out, this current range needs to resolve as a pause within a longer uptrend rather than the top of one. The chart itself is not answering that question yet.
Here is What ChatGPT AI Predicts About LiquidChain
Most people will only see this rotation in hindsight. The smart money has already moved.
Large caps are not failing. They are out of the room. Bitcoin, Ethereum, and XRP keep pressing against the same ceilings with nothing breaking through. Every macro tailwind has a new arrival date. Every institutional wave lands next quarter. Sitting in assets where the upside depends entirely on someone else’s decision is not a strategy. It is a waiting room.
A capital that has survived enough cycles knows one thing. It moves before the destination becomes obvious.
Early-stage infrastructure plays by completely different rules. A small market cap means that a modest rotation can produce dramatic price movement.
The returns live in the gap between what something is genuinely worth and what the market has assigned it so far. That gap exists only while the project remains undiscovered. Once found, it closes permanently.
Multi-chain fragmentation is bleeding DeFi every single day. Bitcoin, Ethereum, and Solana exist as completely isolated systems. No native bridge between them. Every user crossing those boundaries absorbs the cost directly in fees, slippage, and failed transactions. Every single crossing. Every single time.
ChatGPT AI predicts LiquidChain fixes that will entirely fix it. All 3 networks within a single execution layer. One deployment reaches everything. Zero cross-chain tax on any interaction.
The presale is at $0.01454 with just over $890,000 raised. The market has not found this yet. That is exactly the point.
Execution is unproven. Adoption is unknown. Established assets offer a predictable ride toward a ceiling everyone can already see. LiquidChain is an entry point that disappears the moment the market looks up.
The post Sam Altman ChatGPT AI Predicts Bitcoin Will Do Something Incredible Before 2027 appeared first on Cryptonews.

Securitize Capital, the investment-advisory arm of tokenized-asset platform Securitize, has registered with the U.S. Securities and Exchange Commission (SEC) as an investment adviser, the company said Monday. The move is intended to broaden Securitize’s regulated advisory offering for institutional clients and add investment-advisory capabilities on top of its existing suite of market infrastructure services.
Until now, Securitize Capital operated as an exempt reporting adviser. By moving into SEC registration, it becomes subject to additional requirements under the Investment Advisers Act, including enhanced disclosure and compliance obligations, along with stricter recordkeeping and examination standards.
Key takeaways
- Securitize Capital registered with the SEC as an investment adviser, expanding its regulated advisory business for institutions.
- The firm says the change strengthens its ability to support onchain capital markets through investment strategy development and management.
- Securitize Capital previously operated under an exempt reporting-adviser framework, which generally involves lighter oversight than full SEC registration.
- Securitize already operates multiple SEC-regulated businesses, including a broker-dealer, alternative trading system, transfer agent, and fund administration services.
- The parent company, Securitize, listed on the New York Stock Exchange on July 2 after completing a merger with Cantor Equity Partners II.
What the SEC adviser registration changes
SEC adviser registration is more than a procedural update—it reshapes how a firm must operate across compliance, reporting, and oversight. Securitize Capital’s registration brings it under the Investment Advisers Act, which typically increases the scope and rigor of formal compliance programs, mandated documentation, and regulatory examinations compared with an exempt reporting-adviser posture.
In its statement, Securitize framed the update as a capability upgrade for institutions looking to develop and manage investment strategies that incorporate onchain capital markets. The practical implication is that clients seeking regulated advisory services tied to tokenized investment products may have an expanded pathway within the Securitize ecosystem, rather than relying solely on the platform’s other regulated functions.
How Securitize’s existing regulated stack sets the stage
Securitize said the investment-adviser registration adds advisory capabilities to its existing regulated footprint. According to the company, its current SEC-regulated business lines include an SEC-registered broker-dealer, an alternative trading system, a transfer agent, and fund administration services.
That combination matters because tokenization platforms often rely on multiple layers of regulated infrastructure to move from issuance to transfer, administration, and execution. By layering investment advisory into an already regulated environment, Securitize is positioning itself to offer a more integrated set of services—potentially reducing friction for institutional participants that prefer to work with providers operating under recognized SEC frameworks.
It also reframes the competitive landscape in real-world assets (RWA) tokenization: rather than focusing only on issuance and custody-adjacent functions, the platform can now emphasize portfolio strategy support under the adviser framework.
Scale in tokenized assets and ties to major asset managers
Securitize described itself as the largest tokenization platform by onchain asset value, citing approximately $4.8 billion in tokenized assets across funds associated with major asset managers. The company named BlackRock, Apollo, KKR, VanEck, Hamilton Lane, and other firms.
For investors and allocators, the relevance of that figure is less about a single day’s announcement and more about where the market may concentrate liquidity and operational depth. Tokenization projects vary widely in activity and infrastructure maturity; an adviser registration can be a signal that the platform is working to deepen its institutional relationships beyond settlement and issuance into ongoing strategy and management.
Still, readers should note that the registration does not, by itself, confirm new products, fee arrangements, or changes in tokenized fund availability. It primarily establishes a broader regulated role within the existing business model.
Company listing and market performance context
Securitize’s parent company began trading on the New York Stock Exchange under the ticker SECZ on July 2, following a merger with Cantor Equity Partners II. The announcement pointed to the completion of that business combination.
Since listing, shares have fallen about 46% from their first-day closing price, according to data available via Yahoo Finance at the time of the article. While stock performance does not directly measure regulatory progress, it often reflects investor expectations about growth trajectories—especially in an RWA sector still working through questions of scale, standardization, and distribution.
The adviser-registration step can be interpreted as part of an attempt to solidify long-term institutional traction: by increasing regulatory alignment and expanding advisory capabilities, Securitize may be aiming to make its platform more attractive to institutions that want regulated investment strategy support alongside tokenized exposure.
What to watch next is whether Securitize Capital’s SEC adviser status leads to new or expanded institutional advisory workflows—such as additional advisory offerings tied to onchain investment strategies—and how regulators interpret the firm’s compliance posture as it transitions fully from exempt reporting adviser requirements to a registered adviser framework.

Ranking the Most TOXIC Financial Audit Guests
Car dumped in River Lagan makes waves as council slammed for lack of action
Mastercard Stock Rises 2% as Wall Street Positions Ahead of Thursday’s Second-Quarter Earnings Report

Renter of Home in Anne Heche Crash Denies Settlement With Son

No Jackpot Winner as $257 Million Prize Rolls Over to $269 Million Monday Draw

Weekend Open Thread: Staud – Corporette.com
Ranking the Most TOXIC Financial Audit Guests

Crypto Trading LIVE: BTC Live Trading Bitcoin Analysis | 27 JULY #crypto #bitcoin #btc

Day 7/365 | One Week Complete | Building Healthy Habits & Financial Independence |The Fit Professor
-

 Fashion3 days ago
Weekend Open Thread: Brooks Brothers
-
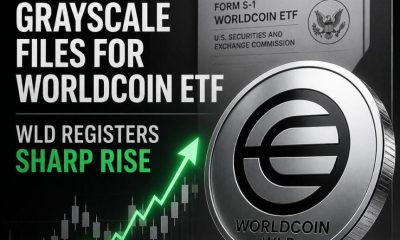
 Crypto World7 days ago
Grayscale Files For Worldcoin ETF, WLD Registers Sharp Rise
-

 NewsBeat6 days ago
How a former Blue Peter presenter stunned America’s Got Talent judges
-

 Tech22 hours ago
Intel is reversing course and bringing hyper-threading back to its server chips
-
 Tech7 days ago
Sail Virtually Aboard The “Itanic” With IA-64 Emulator
-
 Tech7 days ago
Turtle Beach Command Series KB7 review: a nifty screen-equipped gaming keyboard
-
 Business6 days ago
New Jersey voter registration controversy explained: How 6,600 noncitizens got on the rolls, and what happens next
-
 Entertainment6 days ago
Johnny Depp’s R-Rated Gothic Cult Classic Gets New Release Ahead of Sydney Sweeney Remake
-

 Crypto World5 days ago
Ethics, other provisions in crypto Clarity Act to be further discussed
-

 Politics11 hours ago
Luke Littler dismantles Gerwyn Price to retain title in Blackpool
-
 NewsBeat7 days ago
Shanghai science forum photos show China’s AI and robotics advances in rivalry with US
-

 Sports4 days ago
2026 3M Open leaderboard: Scottie Scheffler finds putter in Round 1, sits three back
-
 Sports1 day ago
Commonwealth Games boxing: Jadumani Singh seals dominant 5-0 win over Pakistan’s Sumama Rehman to enter quarter-finals | Commonwealth Games News
-

 News Videos4 days ago
The Peugeot Family: How 200 Years of an “Old Money” Dynasty Died in A Boardroom
-

 Fashion4 days ago
16 Dresses for the High Summer Event
-

 Politics1 day ago
Spain sweeps the board at 2026 World Cup with individual awards
-

 Crypto World7 days ago
Andrew Cuomo joins OKX board as crypto exchange expands in U.S.
-
 Entertainment3 days ago
A New Post-Apocalyptic Gundam Anime Series Blasts Into SDCC
-

 News Videos1 day ago
BITCOIN JUST ENTERED THIS CRITICAL ZONE…
-

 Crypto World2 days ago
XRP Ledger adds $2.6B as RWA inflows rank second
You must be logged in to post a comment Login