
Crypto World
Bitcoin $64.5K Rally Shows Low-Volume Liquidity Trap, Analysis Says

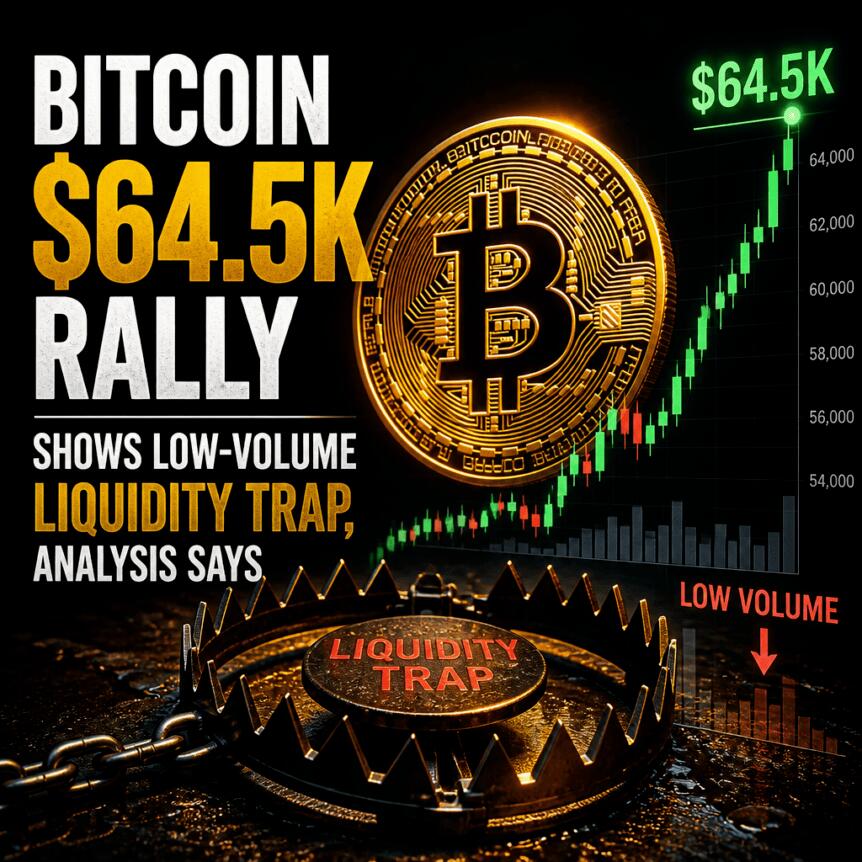
Bitcoin’s rally above $64,000 on Monday was accompanied by a sharp spike in derivative-driven risk events, with short liquidations reaching their highest level in nearly a month. The move pushed BTC to around $64,550 on Bitstamp, according to market charting referenced by Crypto news coverage.
On-chain analytics firm CryptoQuant linked the upswing to crowded short positioning and uneven funding rates across major exchanges—conditions that can force shorts to close rapidly and accelerate upward price moves. Even so, CryptoQuant and related reporting emphasized that weaker spot demand remains a key limitation for how long the rebound can last, especially after a week of net ETF outflows.
Key takeaways
- CryptoQuant attributes Monday’s jump toward $64,500 to a short squeeze fueled by illiquid market conditions and funding-rate imbalances.
- Total Bitcoin short liquidations amounted to 637 BTC on Monday, the largest single-day figure since July 21, per CryptoQuant data.
- Funding rates shifted downward over 24 hours (from roughly 0.006% to 0.003%), which CryptoQuant says could enable additional squeezes if short exposure grows.
- Despite the rally, both CryptoQuant’s commentary and earlier market coverage point to limited spot demand and ongoing ETF outflows as potential constraints.
- Short-term holders appear to be defending resistance, with their cost basis cited around $68,700, based on UTXO age metrics referenced in related analysis.
Short liquidations surge as funding rates reset
After a weekly close that helped set up the rebound, BTC climbed roughly 3% on Monday, topping out near $64,550 on Bitstamp, with prices previously hovering around $62,750. CryptoQuant’s analysis focused on what it described as a “low-volume liquidity trap,” where thin liquidity can magnify the impact of derivative positioning.
CryptoQuant reported that, around $62,750, funding-rate dynamics began to diverge between exchanges. It highlighted that shorts dominated on several major venues, including Binance, Bybit, OKX, and Deribit, while HTX saw a brief spike in funding rates to 0.05%. Funding rates represent periodic payments between long and short positions in Bitcoin derivatives markets; the direction of the aggregate rate indicates whether longs are generally paying shorts or vice versa.
In CryptoQuant’s framing, this setup created the primary catalyst for Monday’s move: a crowded short book that became vulnerable as price rose and forced traders to unwind positions. The result was a liquidation event—short positions were closed at market prices, helping drive BTC higher.
CryptoQuant data put total short liquidations at 637 BTC for Monday, described by the firm as the largest single-day total since July 21. That level of liquidations indicates that the rebound was not only a mild drift upward, but a fast repricing event concentrated in leveraged markets.
Why the next squeeze may depend on funding-rate direction
While Monday’s liquidation spike was notable, CryptoQuant cautioned that the broader pattern of funding-rate resets could still set the stage for more upside—though not necessarily in a smooth way. The firm pointed to a downward reset in funding rates over roughly 24 hours, from about 0.006% to 0.003%.
CryptoQuant suggested this kind of shift can coincide with traders increasing short exposure again, which—paired with thin liquidity—may create conditions where additional short squeezes occur if price continues to rise. In other words, the analysis implies the market is capable of repeating the same mechanism, but the trigger would still be whether leveraged positioning remains crowded and whether liquidity stays shallow.
For traders, this means the funding-rate trajectory matters as much as spot price levels. If funding rates continue to move lower while short exposure builds, the risk of another squeeze increases; if funding stabilizes or flips as shorts reduce, the upside momentum driven by liquidations may fade.
Spot demand still lags, raising questions about durability
Even with derivatives-driven buying pressure, CryptoQuant underscored a central issue: the lack of sustained spot demand. In related analysis discussed earlier, Cointelegraph reported that futures activity has been outweighing spot participation in the current trading range, with spot traders showing relatively muted interest.
In its own Monday update, CryptoQuant described spot demand as the primary hurdle to a more durable recovery. It also pointed to the absence of inflows to US spot Bitcoin exchange-traded funds (ETFs), reinforcing the notion that institutional-style spot accumulation has not yet supported the move.
CryptoQuant’s concern was explicitly framed around downside risk if spot weakness reasserts itself: it commented that a break below $60,000, especially alongside rising exchange inflows, would weaken market structure and increase the risk of a move toward $50,000. The firm also stated that while selling pressure appears to be cooling, demand still needs to return to justify follow-through.
This tension—strong liquidation-driven rebounds but soft spot participation—has practical implications. When price advances primarily through leveraged short covering, the market can become vulnerable to reversal if spot buyers do not step in at higher levels.
Resistance may be anchored by short-term holder cost basis
Beyond derivatives and spot inflows, the rebound’s ceiling may also reflect where existing holders have been accumulating. CryptoQuant referenced analysis tied to short-term holders—wallets with a UTXO age of less than 155 days—showing cost basis around $68,700. That level, according to the cited view, can become resistance as underwater or marginal holders choose to sell on strength.
Additionally, earlier coverage noted that shorter-term investor behavior has been keeping BTC pinned below that resistance zone. Taken together, the data points suggest that Monday’s move may have been less about broad spot conviction and more about leveraged positioning unwinding—an environment where resistance levels tied to holder profitability can quickly limit upside.
For investors and active traders, watching how BTC behaves near the cited $68,700 area—and whether spot activity improves as funding rates evolve—may be more informative than tracking liquidation headlines alone.
Going forward, readers should watch whether funding-rate dynamics continue to support another short-covering burst and whether spot demand—along with US spot ETF inflows—shows signs of returning. Without that support, the market may remain prone to sharp, liquidity-driven swings rather than sustained trend expansion.

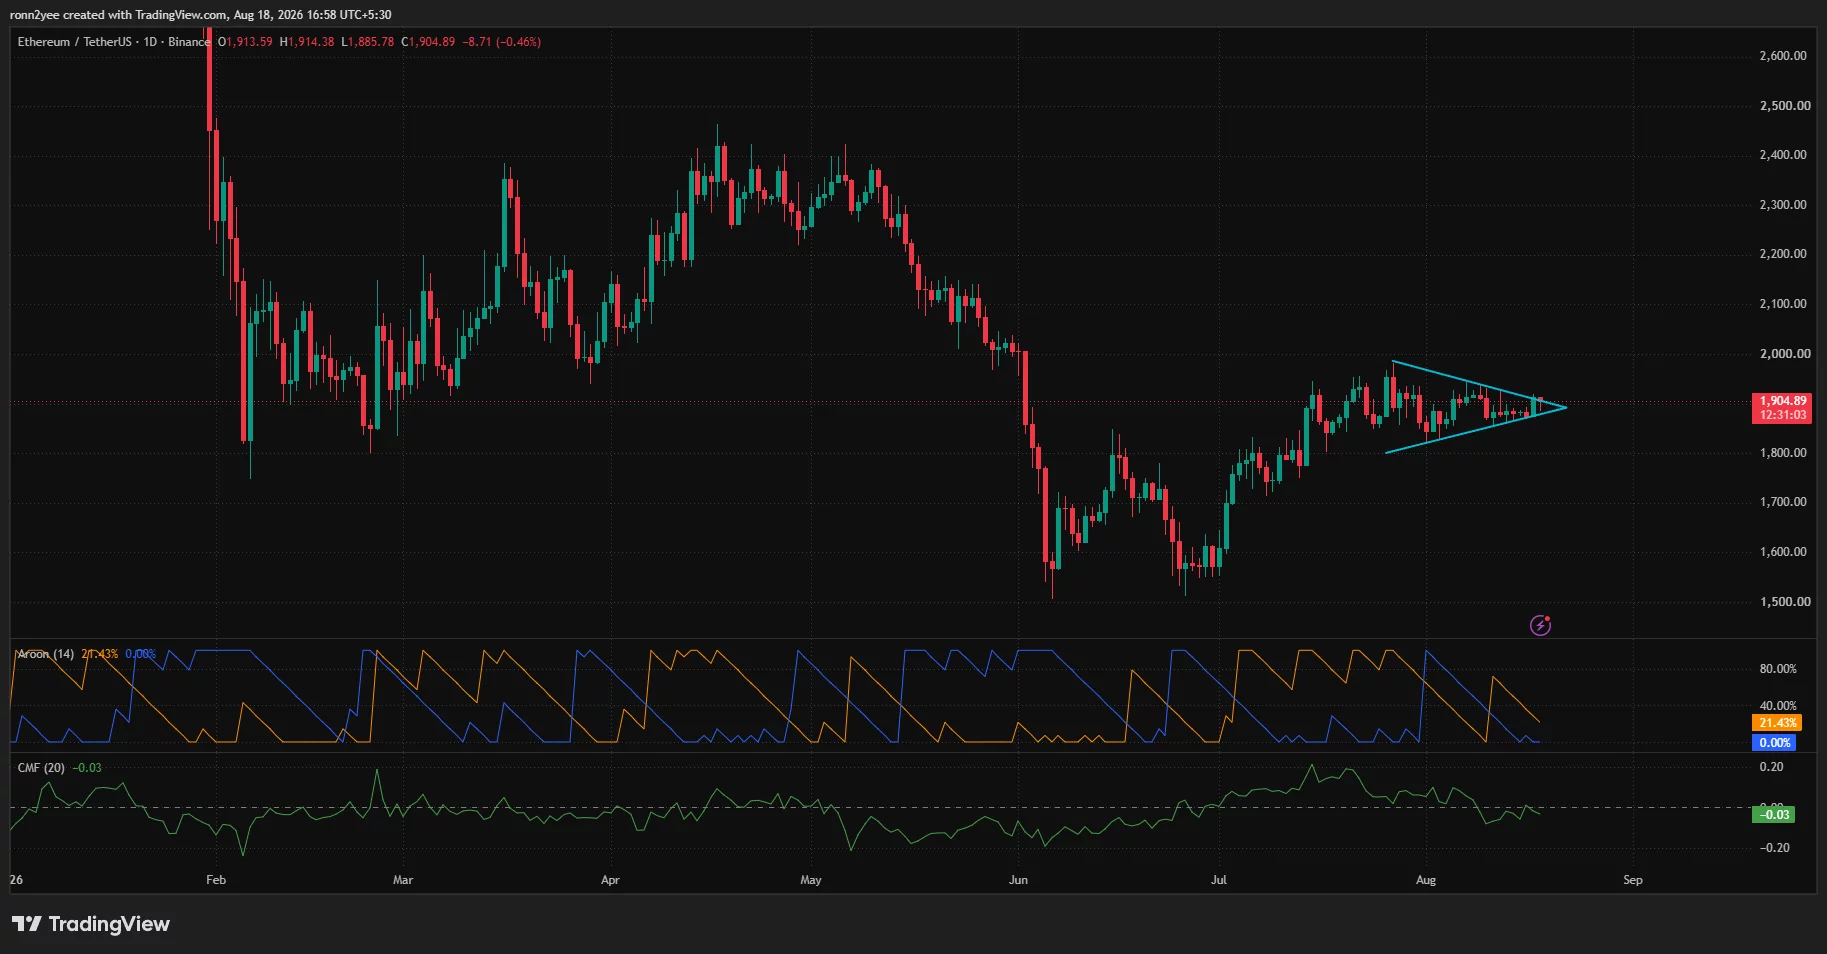
Ethereum price traded near $1,905 on Aug. 18 as tightening daily and 4-hour ranges placed the $1,920 resistance level at the center of its next major move.
Summary
- Ethereum price has formed a symmetrical triangle between roughly $1,850 and $1,930.
- A 4-hour close above $1,909 could expose the stronger $1,920 resistance level.
- Liquidation clusters are concentrated near $1,925–$1,930 and below $1,890.
- Analysts see $2,000 as the next target if Ether breaks its current range.
Ethereum price tightens inside a symmetrical triangle
According to data from crypto.news, Ethereum (ETH) price was trading at $1,904.89 after moving between an intraday low of $1,885.78 and a high of $1,914.38. The price was down about 0.5% on the day but remained inside the narrow range established since late July.
Ether’s recent lower highs and higher lows have created a symmetrical triangle on the daily chart. The upper trendline has fallen from near $1,980 toward $1,920, while the lower boundary has risen from around $1,800 toward $1,880.
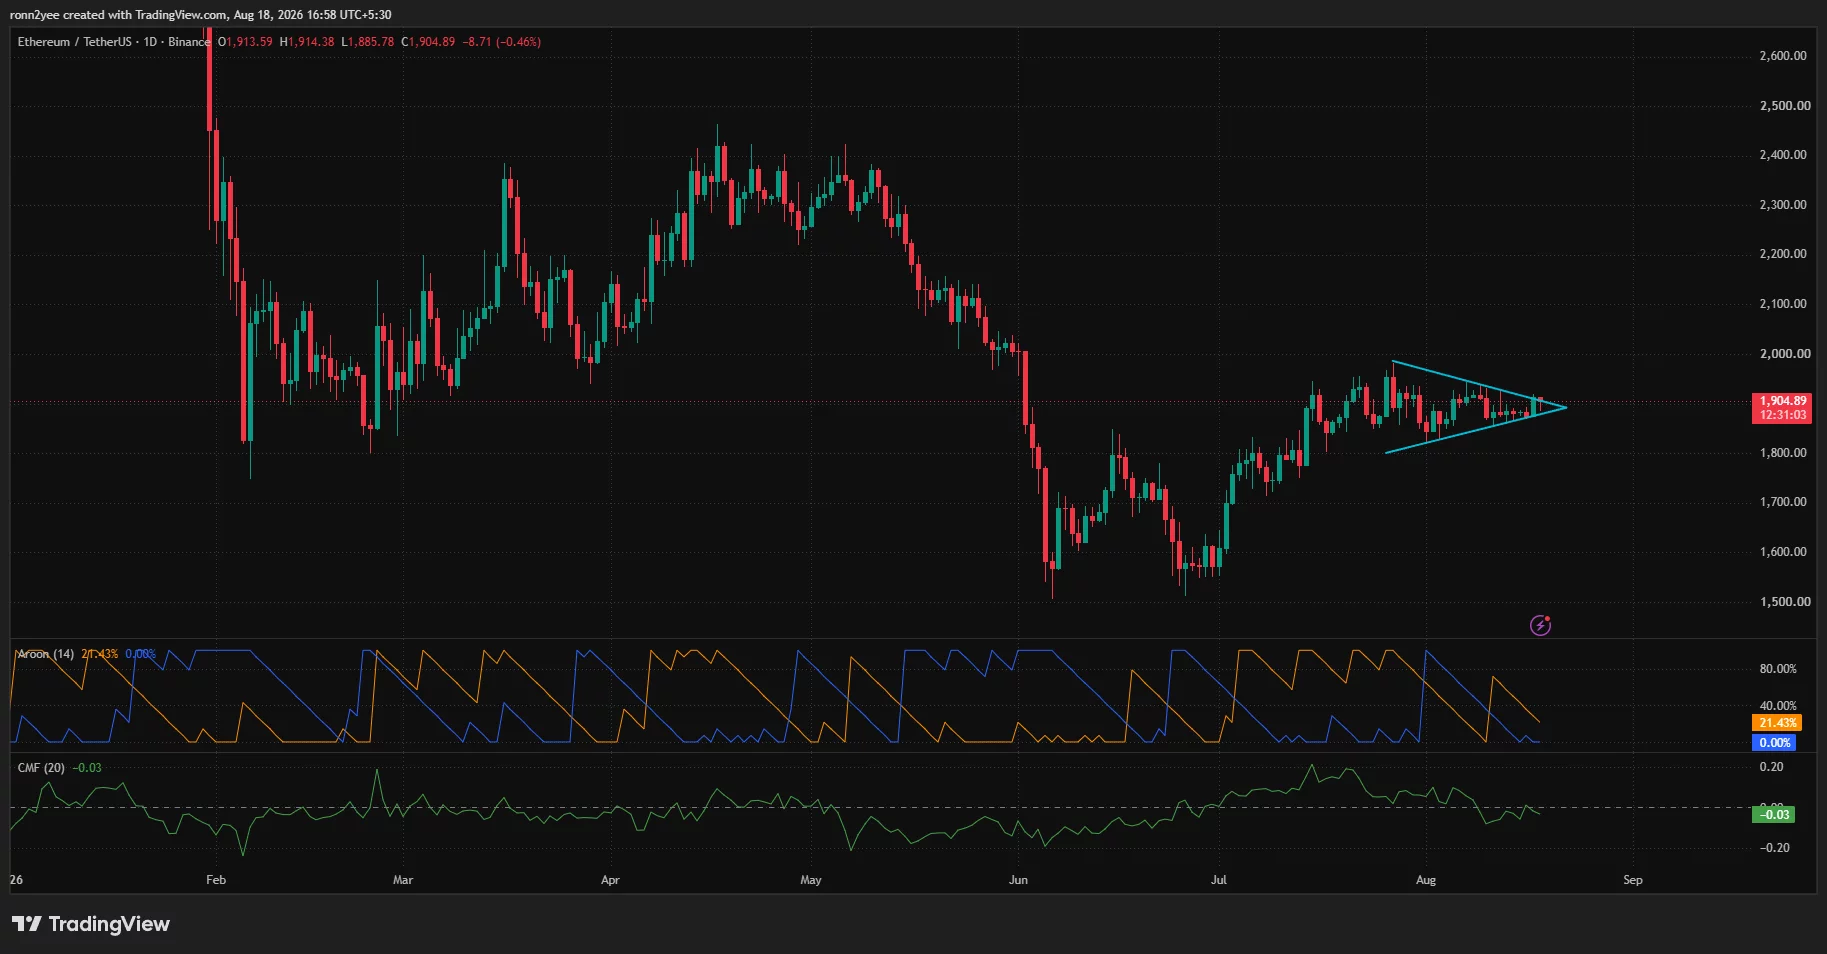
Price has now moved close to the triangle’s apex, where shrinking space between the two boundaries typically precedes a wider move. The formation remains neutral until ETH closes outside either trendline, meaning confirmation matters more than intraday movement within the pattern.
Momentum readings have not yet provided a clear directional signal. The daily Aroon readings were weak, with one line at 21.43% and the other at 0%, reflecting a lack of a strong recent high or low.
Chaikin Money Flow stood at -0.03, slightly below the neutral line. The reading shows that selling pressure has a small advantage, but the figure is not low enough to confirm strong capital flight.
Ether’s inability to break higher comes as large holders reportedly sold around $3 billion in ETH since Aug. 10. Decentralized exchange trading volume has also contracted by about 42% over recent months, while a negative Coinbase Premium Index has pointed to weak demand from US-based buyers.
4-hour chart puts $1,909 and $1,870 in focus
The 4-hour chart shows a more immediate battle between Supertrend resistance at $1,908.59 and support at $1,869.92. Ether briefly traded above $1,905 but had not secured a candle close over the upper Supertrend level at the time of the chart.
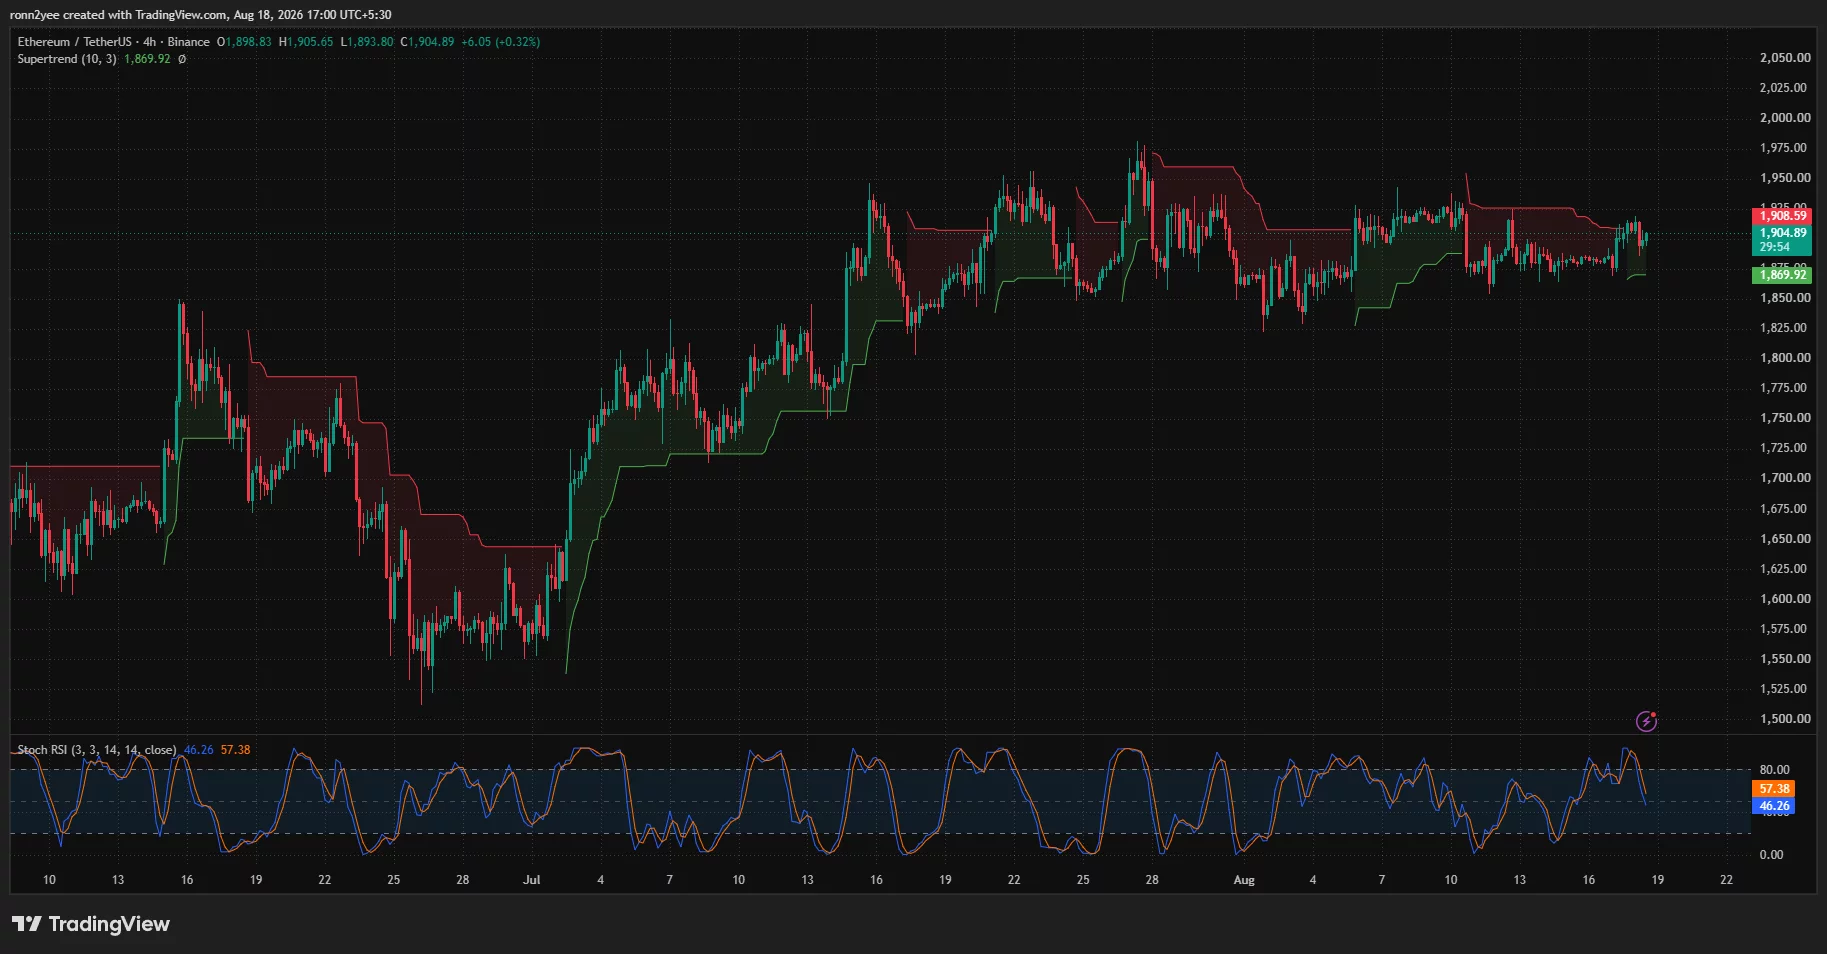
A confirmed move above $1,909 would weaken the short-term bearish signal and bring $1,920 into view. ETH has repeatedly struggled between $1,915 and $1,930, making that area the first meaningful test for buyers.
The Stochastic RSI has also turned lower after approaching overbought territory. Its two lines stood at 46.26 and 57.38, with the faster line below the slower one. The crossover shows that short-term momentum cooled during the latest push toward resistance.
However, the oscillator remains near the center of its range rather than in oversold territory. Bulls could regain momentum without requiring a deeper reset if ETH holds above $1,890 and breaks through $1,909.
Failure to clear the Supertrend barrier would keep the price exposed to $1,890, followed by the $1,870 support line. A 4-hour close below $1,870 would weaken the sequence of higher lows and shift attention toward $1,850.
Ethereum liquidation map points to $1,925
CoinGlass’ three-day liquidation heatmap shows the largest nearby concentration of leveraged positions above the market between roughly $1,925 and $1,930. Additional liquidity appears around $1,940–$1,950 and close to $1,980.
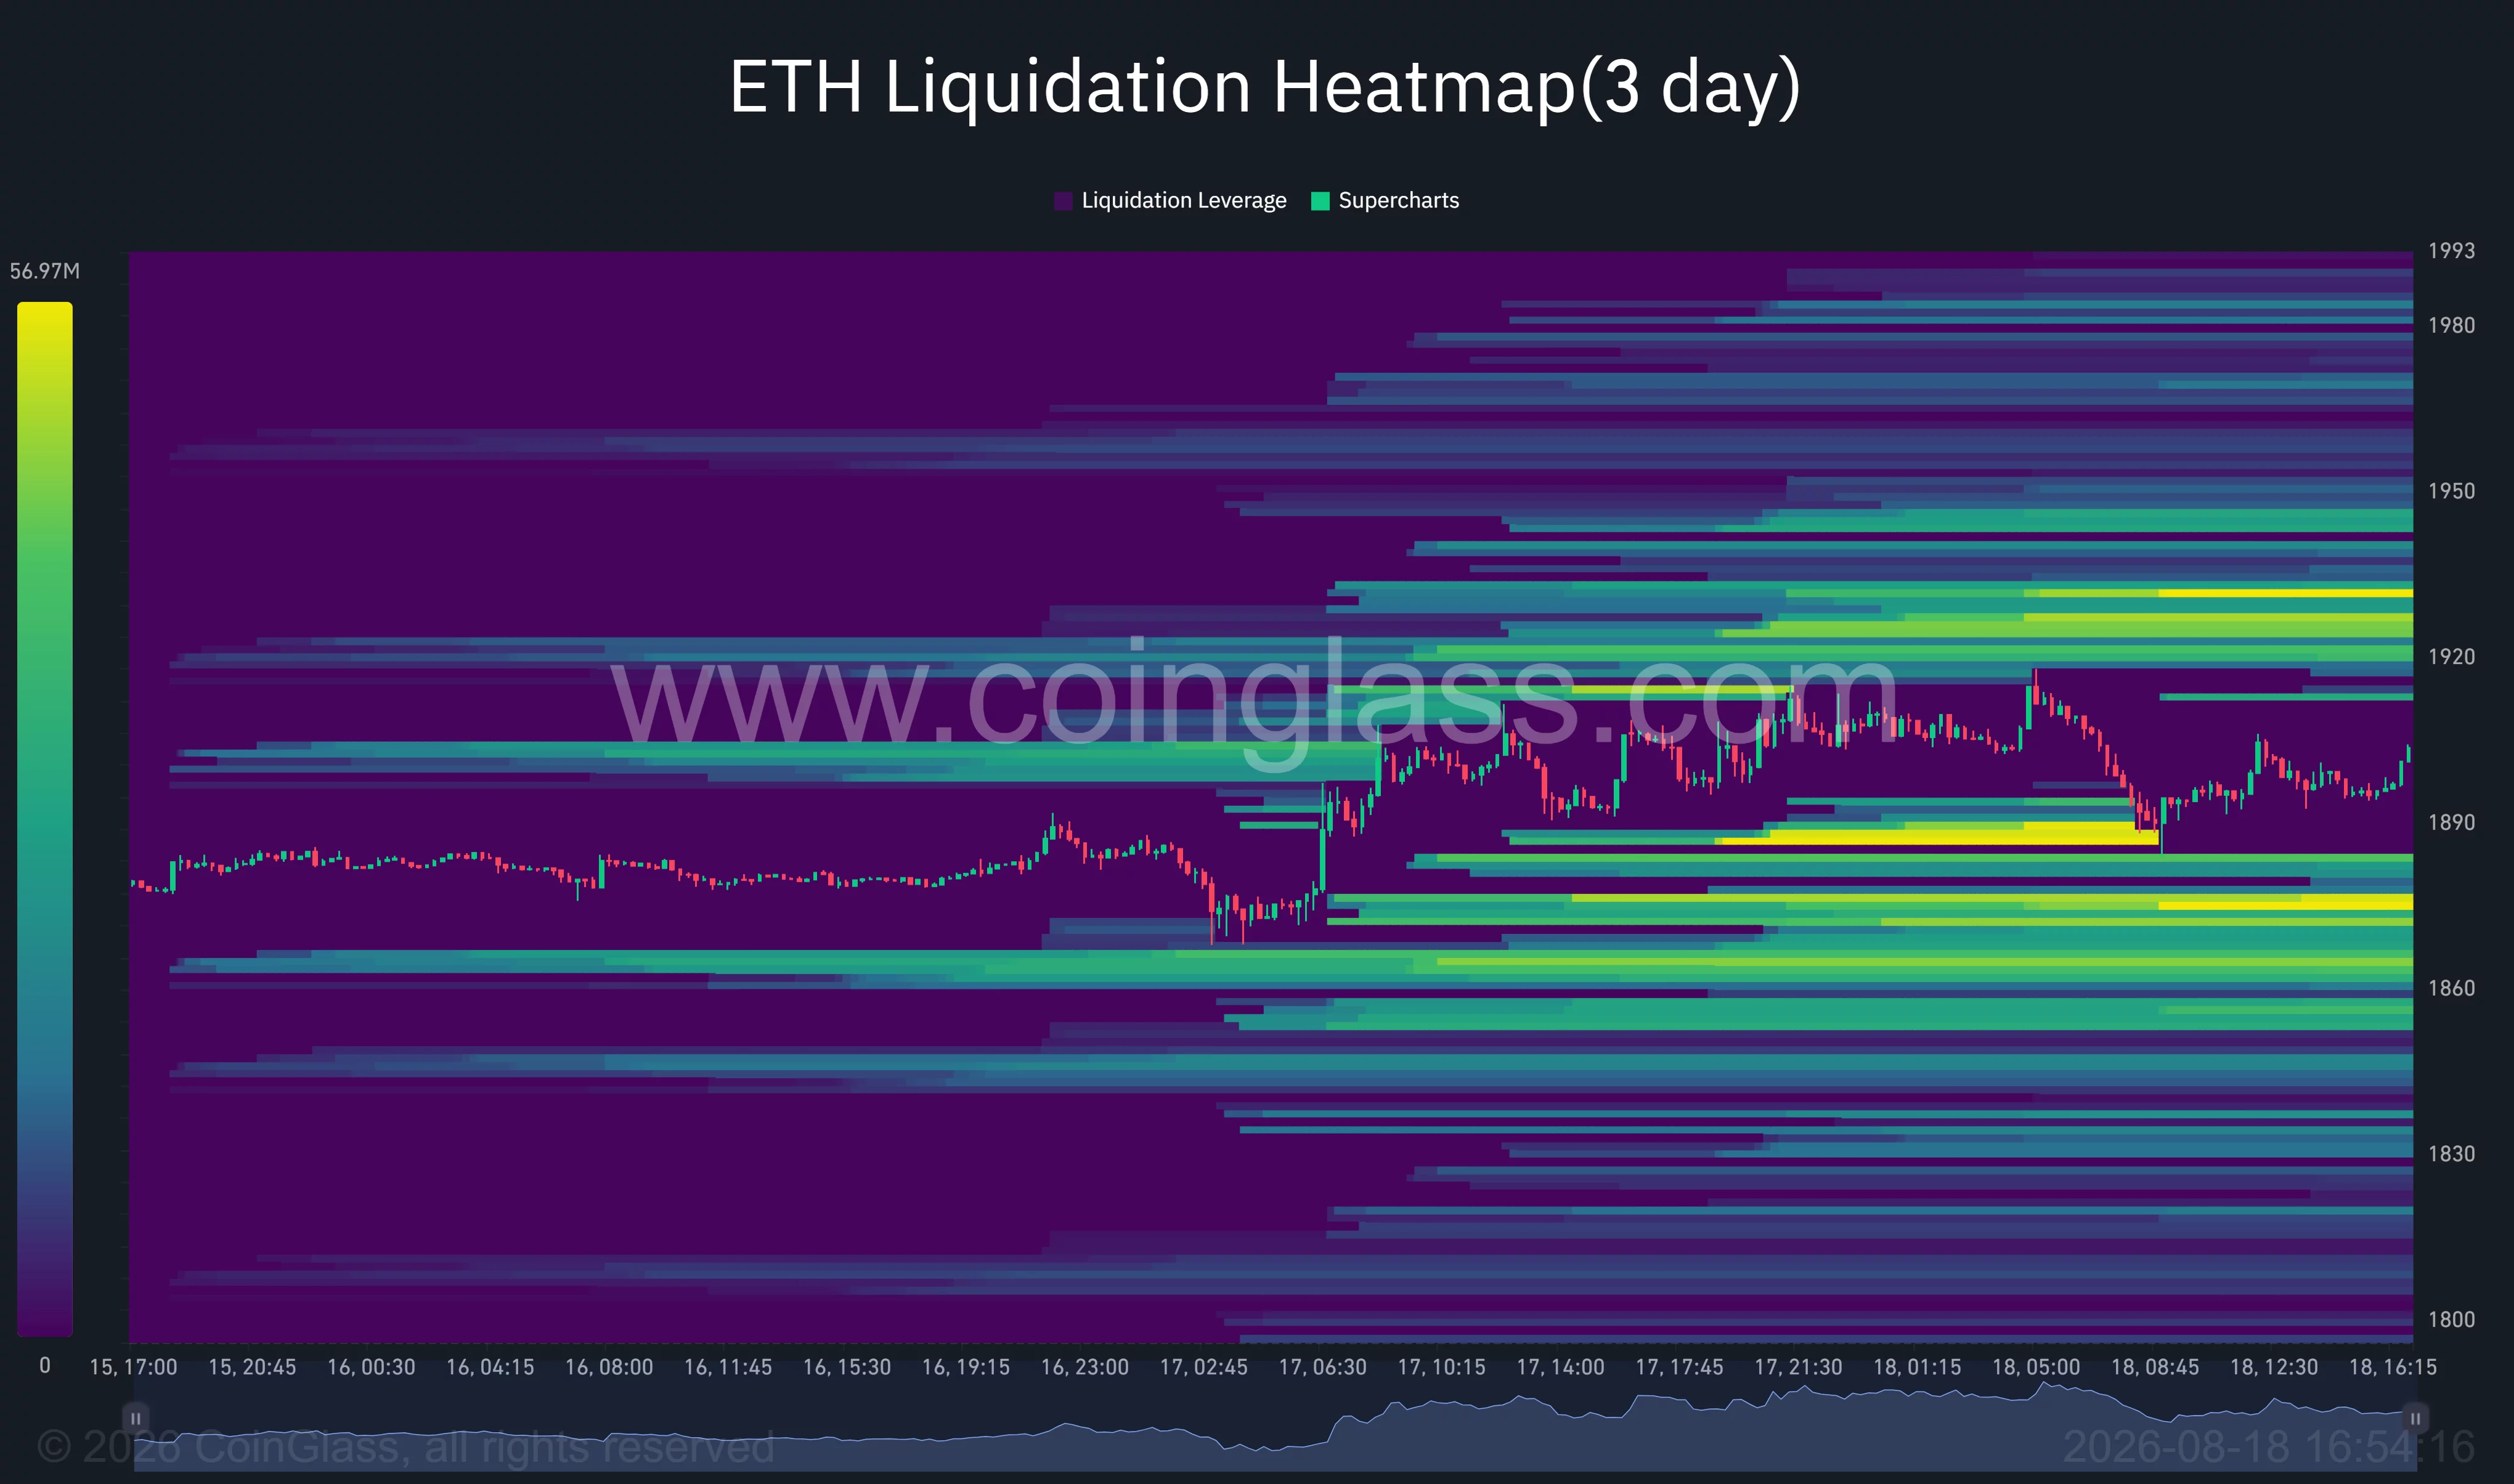
A move through $1,920 could force short positions to close around the first cluster. Such liquidations may add market buying and help ETH accelerate toward the $1,940–$1,950 region.
The downside also contains several active liquidity zones. The closest cluster sits around $1,885–$1,890, followed by stronger concentrations near $1,870 and $1,860.
Price briefly moved into the $1,885 region earlier on Aug. 18 before recovering above $1,900. The rebound suggests buyers remain active near the lower liquidation band, although repeated tests could weaken that defense.
A sweep below $1,885 could therefore pull ETH toward $1,870, which aligns with the 4-hour Supertrend support. The overlap between technical support and liquidation liquidity makes $1,870 the main short-term invalidation level for the bullish setup.
Analysts target $2,000 after a $1,920 breakout
Analyst Michaël van de Poppe said Ethereum remained stuck in a range and had not matched Bitcoin’s larger move. He identified $1,920 as the resistance level that could unlock a stronger advance.
“However, once it cracks through the resistance at $1,920 I would assume we’re going to see a big move happening towards $2,000 here.”
His target matches the daily chart, where the psychological $2,000 level sits above the triangle and recent swing highs. ETH would first need to clear the supply zone between $1,920 and $1,950 before testing that target.
Analyst Ted Pillows presented a longer-term threshold, arguing that a weekly close above $2,500 would confirm that Ethereum’s bear market had ended. Such a close would allow ETH to reclaim its 200-week simple and exponential moving averages, according to his chart.
The $2,500 condition remains well above the current market and does not affect the immediate range. It instead shows that even a break above $2,000 would represent an early recovery step rather than confirmation of a full long-term trend reversal.
US flows remain a barrier for Ethereum
US-listed spot Ethereum exchange-traded funds recently recorded $2.26 million in net outflows, interrupting a multi-week inflow streak. The negative Coinbase premium also shows that US demand has not yet provided enough support to drive ETH through its current resistance.
Investors are waiting for the upcoming Federal Reserve minutes after annual US inflation slowed to 3.4%. Any signal that policymakers are moving closer to lower interest rates could affect demand for risk assets, including Ether.
For now, Ethereum remains compressed between nearby liquidity on both sides of the market. A sustained break above $1,920 would favor a move toward $1,950 and $2,000, while rejection followed by a loss of $1,870 would expose $1,850 and potentially $1,800.
Disclosure: This article does not represent investment advice. The content and materials featured on this page are for educational purposes only.
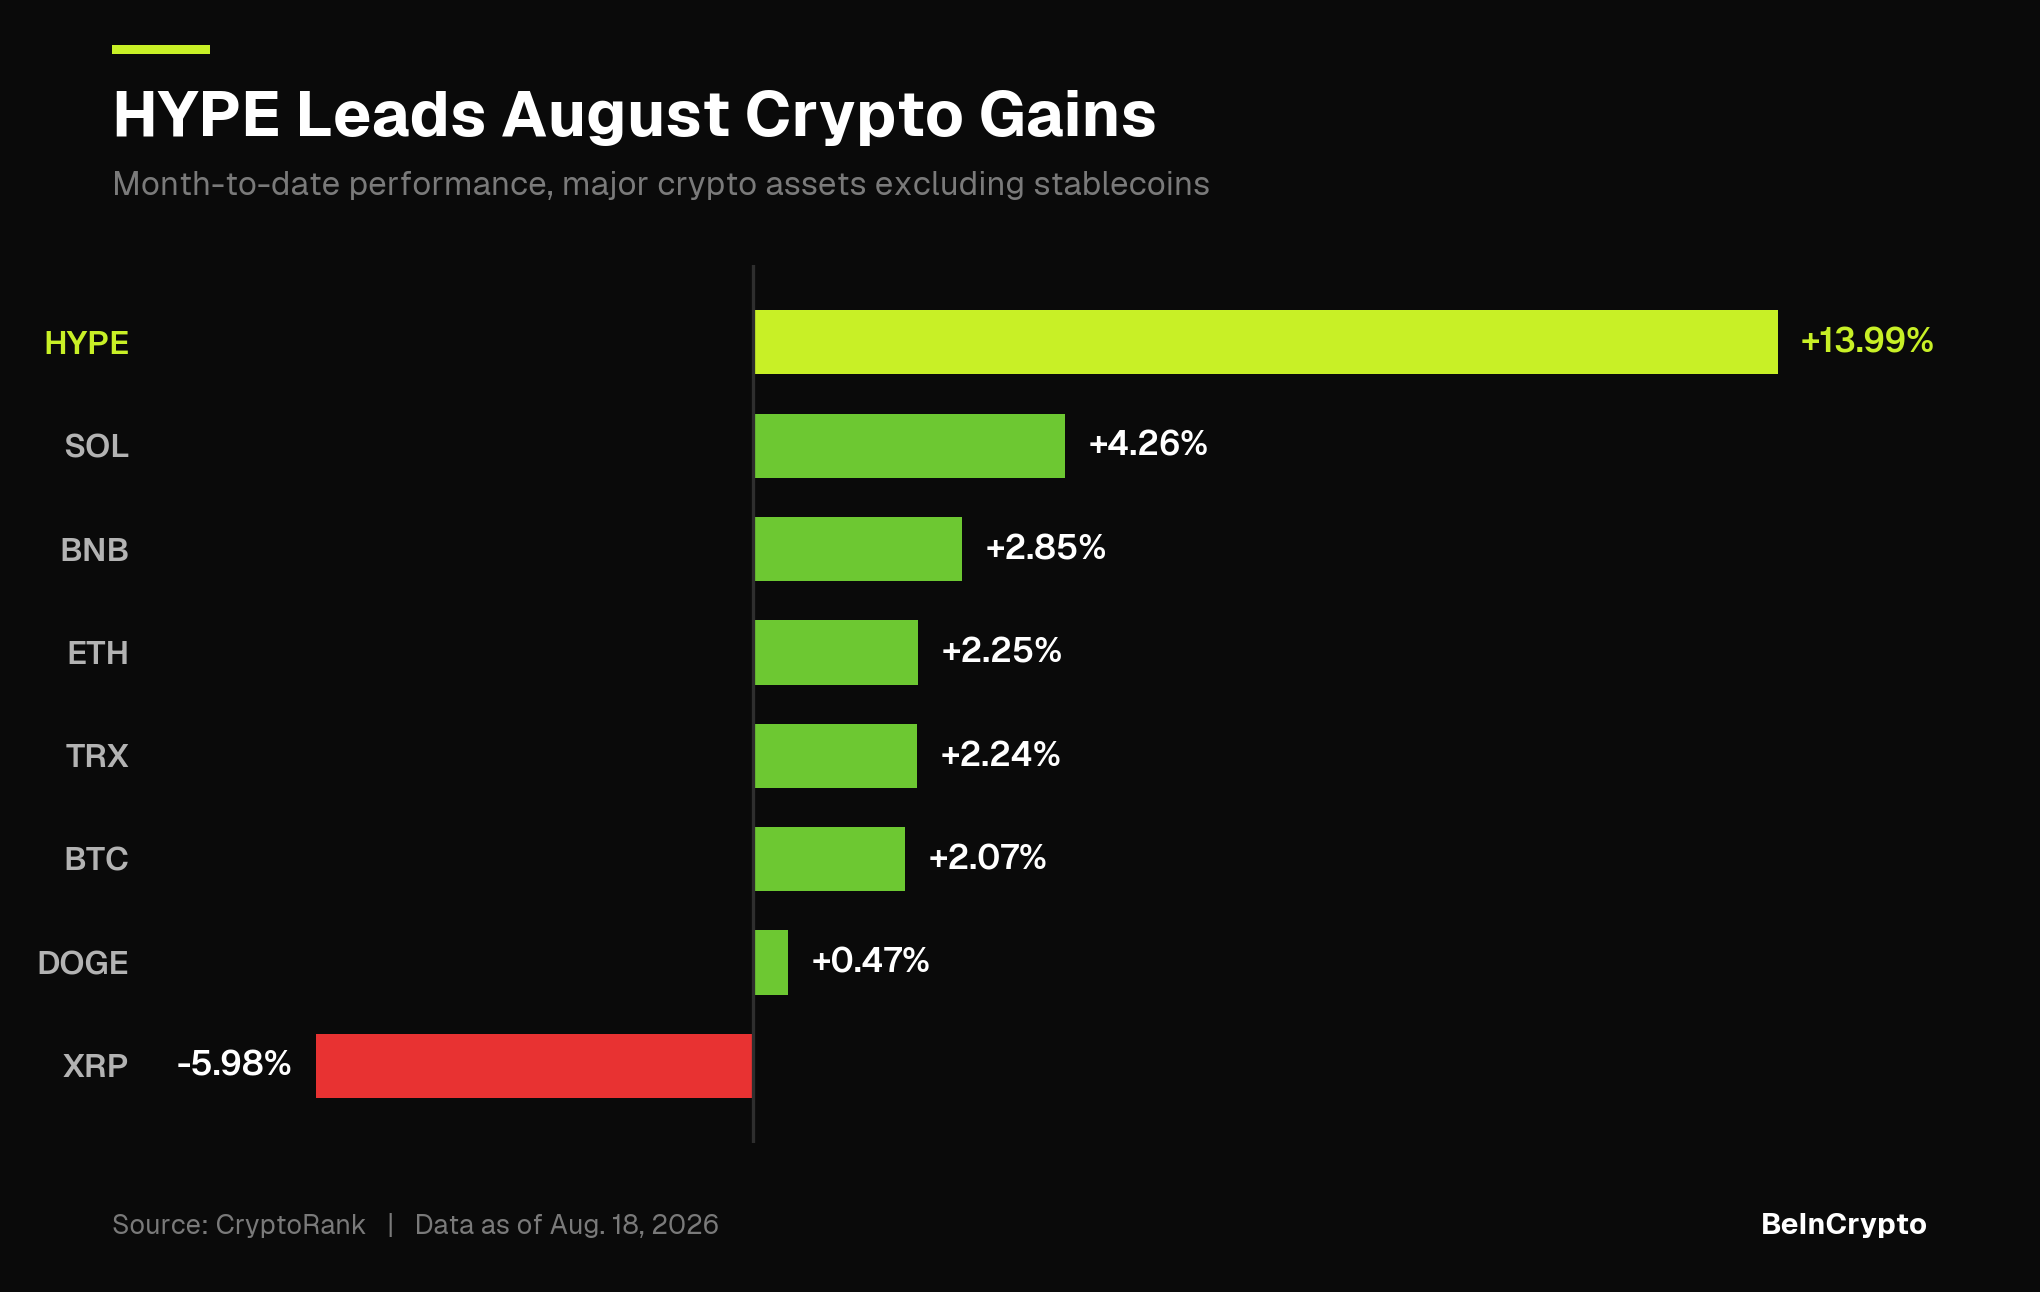
Hyperliquid (HYPE) price has gained 13.99% in August, making it the strongest performer among the top 10 crypto assets this month.
However, exchange-traded fund flows, large holder activity, and derivatives positioning now point in different directions.
HYPE Outpaces Bitcoin and Ethereum as ETF Demand Slows
CryptoRank data show HYPE up 13.99% for the month. This runs roughly 3.3 times Solana’s (SOL) 4.26% gain and 6.8 times Bitcoin’s (BTC) 2.07% uptick.
Follow us on X to get the latest news as it happens

XRP (XRP) is the only major asset in the red, down 5.98%. It has spent the month trailing its major peers while large holders kept buying.
The latest gain comes after a period of decline. HYPE fell 21.94% from its record high until early August, before rebounding. A 13.99% gain off a 21.94% drawdown still leaves the token short of its prior mark.
Meanwhile, institutional demand has yet to return in any sustained form. SoSoValue data shows that HYPE ETFs saw three consecutive weeks of outflows through July 31.
Flows turned positive in the first two weeks of August. The recovery has since stalled, with no new inflows recorded since August 10.
Holders Show Mixed Behavior
Large holders moved in both directions this month. On-chain trackers recorded several wallets buying while others sold.
A wallet linked to Maven11 Capital withdrew 202,705 HYPE from OKX last week. Monetalis-linked wallets sold 3.72 million Uniswap (UNI) via Cumberland and bought 171,543 HYPE, worth $9.56 million, over the weekend.
Selling ran in parallel. One whale sold 923,743 HYPE worth $53.02 million last week.
“HyperLabs unlocked another 433,025 HYPE ($23.46M) and has been gradually depositing the tokens into exchanges, including Flowdesk and OKX, likely to sell,” Lookonchain reported in early August.
Sophisticated Traders Lean Short
Derivatives positioning leans the other way. Nansen data show whales, smart traders, and public figures all net short. Funding stands at 0.00125% per hour, near 10.95% annualized, so longs currently pay shorts.
Spot flows offer no tiebreaker. Nansen recorded $5.7 million in HYPE leaving exchanges over seven days, alongside heavy accumulation on centralized exchanges and over-the-counter across 30 days.
Each dataset answers a different question, and none confirms the others. Renewed ETF creations would show institutional buyers returning. A shift in the whale cohort to net long would signal the same from derivatives. Neither has happened yet.
Subscribe to our YouTube channel to watch leaders and journalists provide expert insights
The post Hyperliquid (HYPE) Leads the Top 10 in August, Yet Smart Money is Short appeared first on BeInCrypto.

Key takeaways
- Chainlink trades around $9.42 after gaining more than 14% last week.
- A long-to-short ratio of 0.76 and negative funding point to weakening derivatives sentiment.
- Spot LINK ETFs attracted $2.07 million on Monday, their largest daily inflow since July 22.
- Losing support at $9.39 could trigger a pullback toward $8.94 and the $8.60–$8.50 region.
Chainlink (LINK) is struggling to overcome resistance near $9.56 on Tuesday, pausing after rallying more than 14% during the previous week.
Weakening derivatives indicators suggest that bullish momentum may be losing strength. However, renewed institutional demand through spot LINK exchange-traded funds could support another attempt to move higher.
Derivatives traders adopt a bearish stance
CoinGlass data shows early signs of weakening sentiment in Chainlink’s derivatives market.
LINK’s long-to-short ratio stands at 0.90 on Tuesday, close to its lowest level in a month. A reading below one indicates that short positions outnumber long positions, suggesting more traders expect the price to decline.
Chainlink’s funding rate also turned negative, falling to minus 0.0050%. Negative funding means short-position holders are paying traders with long exposure, reflecting a bearish imbalance in the perpetual futures market.
Together, the indicators suggest that derivatives traders are becoming more cautious after LINK’s double-digit weekly rally.
However, heavily bearish positioning could also increase the possibility of a short squeeze if Chainlink breaks through its nearby resistance levels.
Institutional demand showed improvement at the beginning of the week. Data from SoSoValue shows that spot Chainlink ETFs recorded $2.07 million in net inflows on Monday. This represented the products’ largest single-day inflow since July 22.
The increase suggests that institutional investors are rebuilding exposure to LINK following its recent recovery.
Continued ETF inflows could help absorb profit-taking and provide the demand needed for Chainlink to overcome the 200-day Exponential Moving Average. However, a single day of positive flows is insufficient to establish a lasting trend.
A sustained series of inflows throughout the week would provide stronger confirmation of renewed institutional interest.
Chainlink price outlook: LINK tests the 200-day EMA
Chainlink trades around $9.42 on Tuesday and remains above its 50-day and 100-day EMAs, positioned at $8.50 and $8.60, respectively.
Holding above these moving averages supports a mildly bullish medium-term outlook. However, LINK remains below the 200-day EMA at $9.56, which is limiting the current recovery.
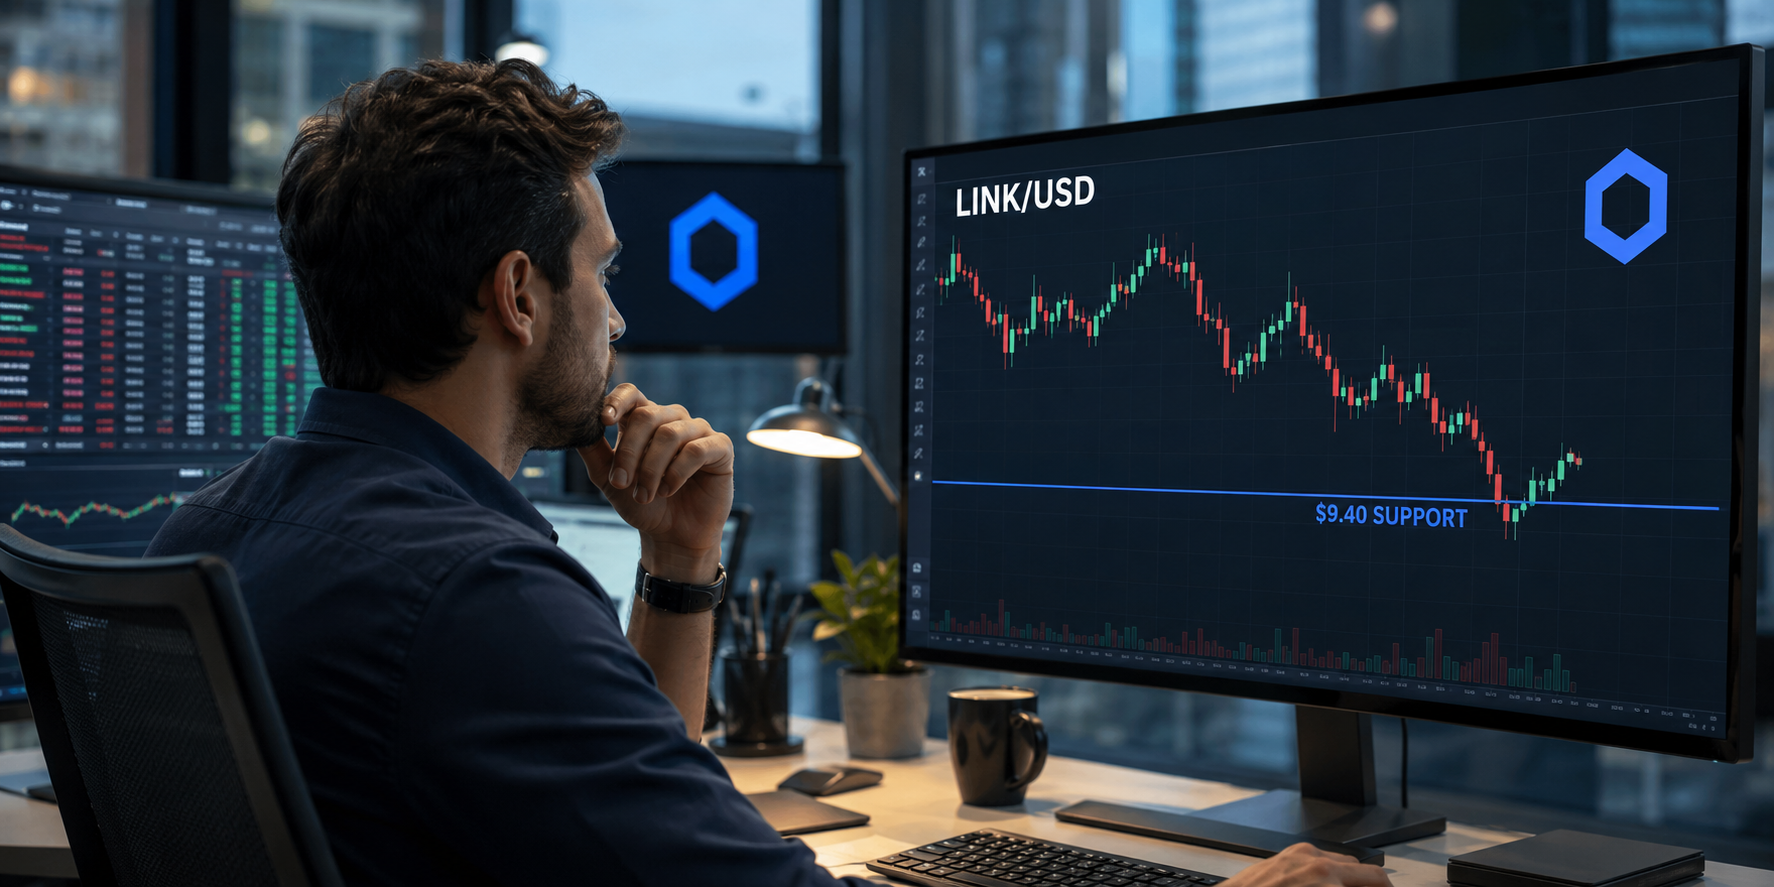
The token has reclaimed the 61.8% Fibonacci retracement at $9.39, establishing this level as immediate support.
Momentum indicators remain constructive but show that LINK may be approaching stretched conditions. The Relative Strength Index is near 67, just below the overbought threshold of 70, while the Moving Average Convergence Divergence indicator remains positive.
These readings suggest that buyers retain control but may encounter increasing resistance following last week’s sharp rally.
A decisive daily close above the 200-day EMA at $9.56 would strengthen Chainlink’s bullish outlook and bring the horizontal resistance at $9.92 into focus.

Clearing both barriers could allow LINK to test the 78.6% Fibonacci retracement at $10.04. Beyond that, the cycle-high region around $10.87 represents the next major bullish objective.
On the downside, the 61.8% Fibonacci level at $9.39 provides the first line of support. A break below this area could trigger a pullback toward the 50% retracement at $8.94.
Stronger support is concentrated between the 100-day EMA at $8.60 and the 50-day EMA at $8.50. Holding this zone would preserve the medium-term recovery structure, while a decisive breakdown could return control to sellers.

To be considered, a firm must be headquartered in the United States and, as a core part of its business model, raise third-party capital and deploy it as direct venture capital funding to companies and startups across various venture stages and sectors. Firms whose investment activities are exclusively or predominantly focused on growth equity, private equity, fund-of-funds, venture debt, or similar non-VC-focused strategies are not eligible.
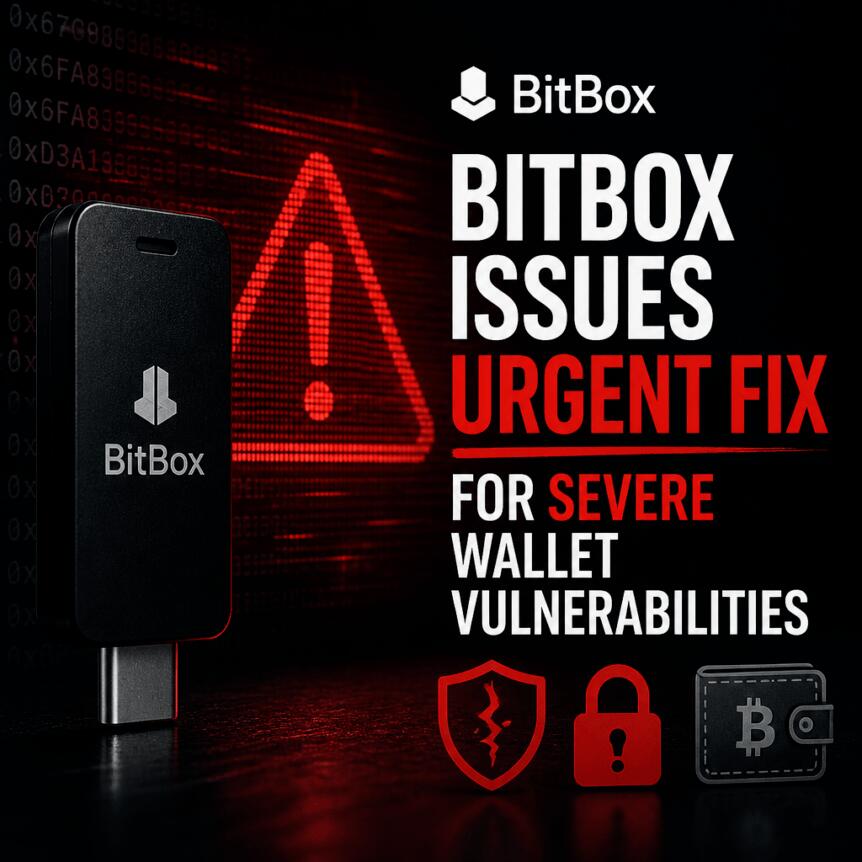
BitBox, the Swiss maker of self-custody hardware wallets, has released a firmware update to address two security issues it describes as “severe.” The company says the fixes reduce the risk of malicious firmware installation and prevent scenarios involving its Silent Payments feature that could cause Bitcoin to be locked to an unintended address.
BitBox reported that it has not received any information indicating either vulnerability has been exploited in the wild or that users have lost funds as a result. Still, the disclosure lands amid a broader run of hardware-wallet-related security concerns, including a Coldcard flaw that was later linked to losses exceeding $112 million, according to Galaxy Research.
Key takeaways
- BitBox’s latest firmware update targets two vulnerabilities it labels “severe,” including a memory corruption issue that could allow arbitrary code execution in unconfigured wallet states.
- The update also addresses a Silent Payments weakness that could enable Bitcoin to be locked to an unintended address, creating a potential ransom-type leverage scenario.
- BitBox says it has seen no reports of exploitation or user fund loss tied to either issue.
- The release arrives after high-profile incidents spanning hardware wallet devices and the services around them, including a Coldcard issue tied to large BTC theft totals.
What BitBox says the firmware flaws could enable
In a security disclosure released on Monday, BitBox said one of the vulnerabilities stems from memory corruption affecting “Multi editions of BitBox02 and BitBox02 Nova” when those devices have not been configured with a wallet.
BitBox explained that, under certain conditions, a malicious host could exploit the bug to execute arbitrary code and potentially install malicious firmware. If successful, that chain of events could expose user funds by altering how the device signs transactions or operates.
The second issue relates to BitBox’s Silent Payments implementation. BitBox said the vulnerability could allow a malicious host to lock Bitcoin to an unintended address. While the company stated that the flaw does not enable direct theft in the way some vulnerabilities do, it argued an attacker could still use the situation to demand a ransom in exchange for cooperation on recovering the coins.
Why the update matters for self-custody users
Hardware wallets are designed to minimize the amount of trust users must place in online systems. Even so, the BitBox disclosure highlights an important nuance: the device is not only responsible for protecting private keys, but also for maintaining a secure operating environment under all possible states—including those that occur before a wallet is configured.
For users, this is a practical reminder to keep firmware current, especially when device behavior can be influenced by connected hosts during setup or ongoing interactions. BitBox’s emphasis on “unconfigured” wallets suggests there is risk concentrated in specific device states rather than a universal exposure across all usage patterns. Still, the company’s decision to classify both bugs as severe indicates the potential outcomes are serious enough to warrant immediate action.
The timing: hardware-wallet incidents beyond device code
BitBox’s update arrives at a moment when the hardware wallet narrative has been dominated not only by device-level flaws, but also by problems in surrounding ecosystems—such as shipment and order-management systems.
Earlier, Cointelegraph reported on a Coldcard flaw that was traced to a March 2021 firmware change and reportedly remained undetected for more than five years. That vulnerability affected wallet-seed randomness. According to Galaxy Research, that defect enabled attackers to brute-force impacted wallet seeds and derive private keys without physical access. Galaxy Research said Coldcard-related losses exceeded $112 million, and reported approximately 1,778.6 BTC swept from more than 8,600 addresses.
More recently, separate data breaches involving Trezor and SafePal exposed customer and order information for more than 53,000 customers. Cointelegraph coverage noted that Trezor attributed exposure affecting 13,689 customers’ data to shipping provider ShipMonk. SafePal, meanwhile, said an authorization flaw in an order-tracking plug-in exposed details tied to 39,798 customers. In both cases, Cointelegraph reported that the incidents did not compromise device private keys or recovery phrases, but both companies warned the information could be used for targeted phishing and impersonation attempts.
These episodes underline a broader reality: self-custody security is shaped by a chain of components—device firmware, host-side software interactions, and operational services that handle customers and transactions. Even when devices themselves remain uncompromised, attackers may still exploit human and process-level weaknesses to increase the odds of successful fraud.
What investors and builders should watch next
BitBox says there are no reports of exploitation tied to either vulnerability, but the company’s disclosure nonetheless reinforces the need for disciplined update practices across the hardware wallet stack. The next signal to monitor is whether BitBox’s patch becomes the new baseline for Multi editions of BitBox02 and BitBox02 Nova users, and whether Silent Payments-related guidance triggers further clarification from the company about conditions under which users could be exposed.
For the industry, the broader question is how quickly manufacturers respond after audits or research uncover weaknesses—and how effectively they communicate practical mitigation steps to users who may not follow security advisories closely.


Kraken has launched trading in more than 7,000 US-listed stocks for customers in the European Economic Area (EEA), expanding its traditional finance offering alongside cryptocurrencies and tokenized equities.
The crypto exchange said Tuesday that eligible EEA customers can trade US stocks through Kraken Pro and its mobile app under the company’s Markets in Financial Instruments Directive II authorization.
The shares are available alongside more than 600 crypto assets and over 700 xStocks, which are tokenized versions of publicly listed equities.
The setup allows customers to hold conventional shares and tokenized representations of the same assets within a single platform.
The service is provided by Payward Europe Digital Solutions, Kraken’s Cyprus-based investment firm. Kraken said eligible customers can trade US-listed stocks commission-free, subject to applicable conditions. Kraken said it plans to extend its integrated equities offering to additional markets in the coming months.
Kraken launched xStocks in 2025, offering tokenized exposure to US equities and exchange-traded funds. The company said xStocks has since generated more than $38 billion in total transaction volume.
As of Monday, xStocks is the second-largest tokenized stock issuer by market capitalization, with about $609 million, behind Ondo Finance, with about $974 million, according to Token Terminal data. Binance’s bStocks is currently the third-largest issuer, with about $544 million.
Related: Kraken adds S&P 500 to funded trading program, commodities to follow


South Korea ordered domestic access to popular prediction market Polymarket blocked, becoming the latest of more than 30 jurisdictions to restrict the platform over gambling concerns.
The Korea Media and Communications Standards Commission approved the move after finding that Polymarket facilitates gambling and the operation of gambling venues under the country’s Criminal Act along with similar categories under the National Sports Promotion Act, according to local reports.
Polymarket lets users trade yes-or-no contracts tied to the outcomes of real-world events including elections, sports, economic data and the weather. It’s one of the largest prediction markets along with Kalshi.
The commission said that these markets’ structure encourages speculative behavior because users’ gains and losses depend on events beyond their control.
Polymarket, according to local media, said that it had removed Korean-language services, does not support payments in the country’s won fiat currency, and uses non-custodial peer-to-peer transactions and smart contracts.
The company did not immediately respond to CoinDesk’s request for further comment.
The regulator rejected the defense, saying Polymarket’s operator still manages market creation and trading rules while providing crypto deposit, withdrawal and settlement systems and charging fees.
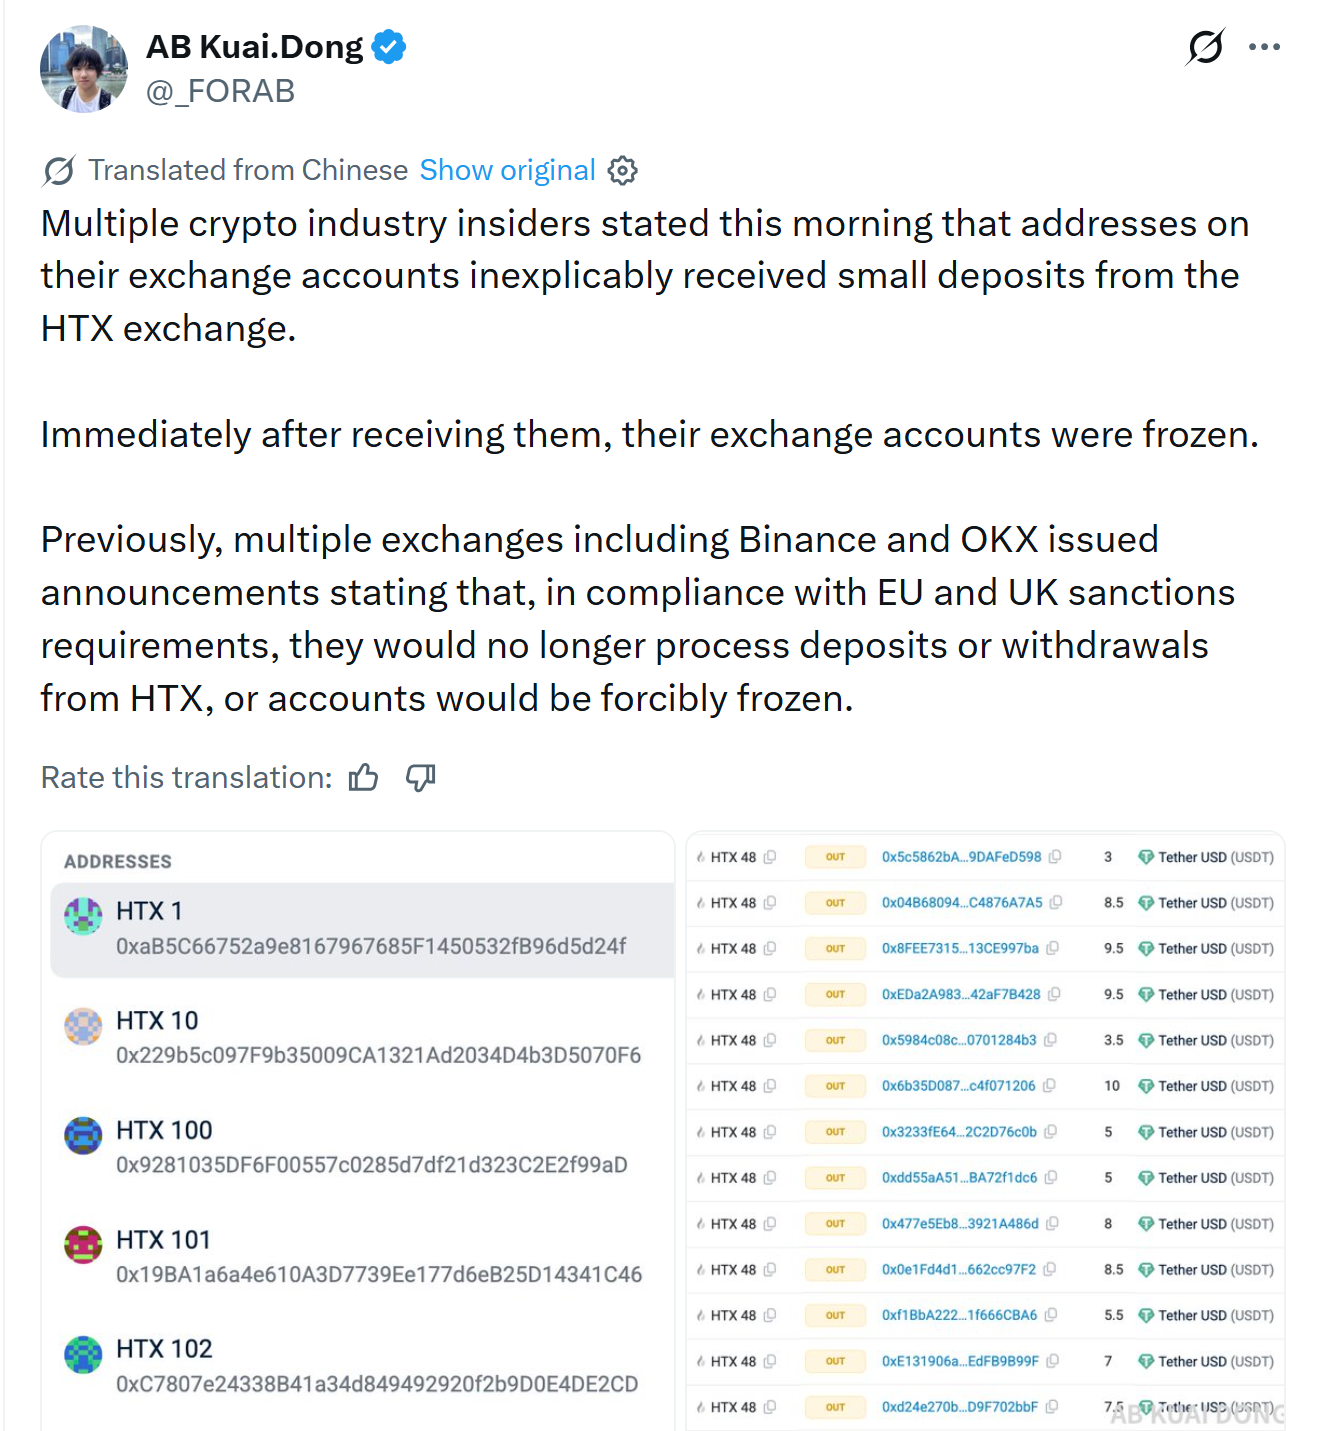
Seven dollars you never asked for can now freeze your crypto account. Users blame an HTX dusting wave, a spray of tiny Tether (USDT) deposits that lands innocent traders in compliance trouble.
One Coinbase user says an unrequested 7.5 USDT transfer brought a closure threat. HTX denies sending anything, just five days before Binance blocks HTX transfers on August 23.
Unsolicited Deposits Put Exchange Accounts on Ice
Pseudonymous trader 0xZiye posted the first complaint early Tuesday. The trader’s Coinbase deposit address received 7.5 USDT from a wallet tagged as HTX. Reportedly, Coinbase then demanded an explanation or the account would be closed.
“HTX is crazily transferring out small amounts, polluting other addresses.. My Coinbase received 7.5u of Brother Sun’s poisoning.. Right now, Coinbase says if they don’t explain it clearly, they’ll just close the account…,” they posed.
Chinese crypto commentator AB Kuai Dong soon reported the same pattern among several industry insiders. Small HTX-labeled deposits arrived. Accounts froze soon after the money landed.

Dusting means firing tiny amounts of crypto at many wallets at once. It costs the sender almost nothing. The receiver, however, can lose access to everything.
The reason is sanctions. The UK froze HTX’s assets on May 26 over suspected dealings with A7 and Garantex, two sanctioned Russian financial firms.
Compliance software at major exchanges now treats any HTX-linked coin as toxic, even money the user never requested.
Mass dusting also has a track record. A revived Salomon Brothers entity dusted 40,000 Bitcoin wallets last year while claiming $150 billion in supposedly abandoned Bitcoin (BTC).
What the HTX Dusting Panic Means for Compliance
HTX moved fast to distance itself. Molly, an HTX executive, said an internal review found no official involvement.
“What we can confirm at present is that HTX’s official channels have not initiated any related transfers or testing activities.”
Follow us on X to get the latest news as it happens
In the statement, she said HTX is still tracing the funds. She did not rule out address-tagging errors or misread on-chain data.
Earlier, she called the reports a misunderstanding or deliberate trouble-making.

Meanwhile, the timing feeds suspicion. Binance announced restrictions on HTX transactions on August 14 under a July EU sanctions package. From August 23, transfers touching HTX and 10 other platforms risk being frozen for review.
No on-chain evidence ties Justin Sun to the transfers. Sun has argued separately that Binance’s limits only affect UK and EU users.
The bigger problem is the math. Dust costs almost nothing to send, while one flagged deposit can lock an entire account.
Anyone can send funds to a public address, yet the receiver carries the burden of proof. HTX did not immediately respond to BeInCrypto’s request for comment.
The post Can $7 in Crypto Freeze Your Account? HTX Dusting Panic Explained appeared first on BeInCrypto.

Key takeaways
- Zcash dipped 1% on Tuesday following Monday’s rally. day,
- The Ironwood shielded pool now holds 3.07 million ZEC, representing 70% of total shielded volume.
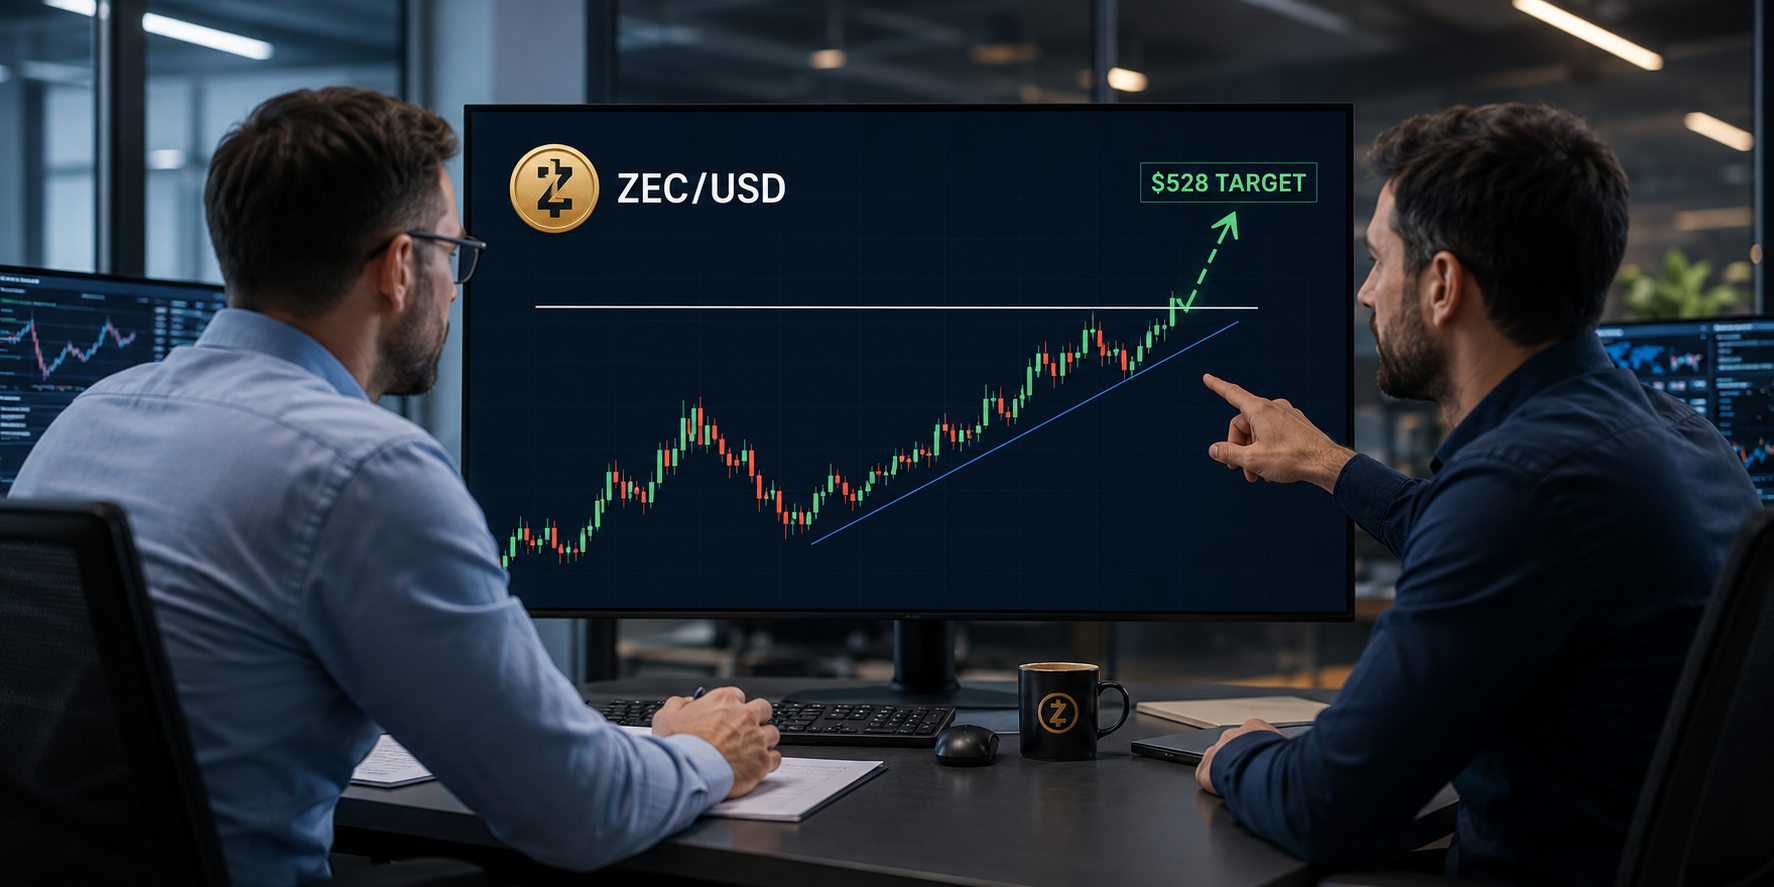
- ZEC is approaching the apex of a symmetrical triangle, with resistance near $528.
Zcash (ZEC) dipped 1% on Tuesday despite the massive rally on Monday. The surge earlier this week comes as rising Ironwood adoption and stronger derivatives activity supported demand.
The privacy coin trades above $500 and is approaching the apex of a symmetrical triangle pattern. A breakout above the upper trendline could strengthen the bullish outlook and bring the $600 region into focus.
Ironwood shielded volume crosses 3 million ZEC
Migration to Zcash’s Ironwood shielded pool continues to gain traction following the discovery of a counterfeiting vulnerability affecting the network’s older pool infrastructure.
Data from Zkp.baby shows that Ironwood’s shielded volume reached 3.07 million ZEC on Monday. The pool now accounts for approximately 70% of the total ZEC held in shielded pools.
Meanwhile, volume in the older Orchard pool has declined to 761,889 ZEC as users continue migrating their holdings.
The shift toward Ironwood indicates growing adoption of the updated shielded infrastructure. It also suggests that users are responding to the network’s security changes while maintaining demand for Zcash’s privacy features.
Zcash’s derivatives market is also showing renewed retail participation. CoinGlass data shows that ZEC futures Open Interest decreased 1% over the past 24 hours to $924.16 million. The decrease signals that traders are closing new positions or allocating more capital to existing contracts.
Zcash price outlook: ZEC approaches triangle breakout
Zcash trades above $500 on Tuesday, maintaining a mildly bullish technical outlook as it holds above the 50-day Exponential Moving Average at approximately $490.
The 200-day EMA near $420 also supports the broader bullish structure. Meanwhile, the price is contracting between two converging trendlines, forming a symmetrical triangle on the daily chart.
This pattern typically indicates declining volatility before a larger directional move. However, the triangle does not confirm whether the eventual breakout will be bullish or bearish.
Momentum indicators provide mixed but improving signals. The Relative Strength Index has risen above its neutral level to 55, suggesting renewed buying pressure.
The Moving Average Convergence Divergence indicator remains marginally below its signal line, pointing to some lingering downside pressure. A bullish crossover would provide additional confirmation that buyers are regaining control.
Zcash faces immediate resistance at the triangle’s upper trendline near $528. A sustained daily close above this level would confirm a bullish breakout and could propel ZEC toward the 78.6% Fibonacci retracement at approximately $595. This level is calculated from the decline between $690 and $250.

Clearing $595 would bring the psychologically important $600 level into focus and strengthen the prospect of a broader trend continuation.
On the downside, the 50-day EMA near $490 provides initial support. A breakdown below this moving average could extend the correction toward the 50% Fibonacci retracement at $470.
If selling pressure intensifies, the 200-day EMA at approximately $420 represents the next major support level. Holding above these moving averages would preserve Zcash’s broader recovery structure.


- The first question for any crypto prop firm is whether trades hit a real order book or a simulation.
- A crypto-native perpetuals trader gets the most from a crypto-first structure with verifiable payouts.
- HyroTrader is crypto only: USDT perpetual futures, no forex pairs, no indices, no metals.
Every crypto prop firm’s homepage makes the same pitch: six figures of buying power, a generous profit split, a challenge fee that looks small next to the capital on offer. Read five pricing pages in a row, and they blur into one.
The differences that decide whether a funded account survives live below the marketing.
They come down to three structural questions: where orders execute, how drawdown is measured, and what a payout actually is.
A trader who can answer all three about a firm knows more than most reviews will ever tell them.
Test one: where orders execute
The first question for any crypto prop firm is whether trades hit a real order book or a simulation.
Both architectures exist, and both can be honest; the failure mode is a simulation dressed up as the real thing.
HyroTrader put direct exchange execution at the center of its model in 2023, the first crypto prop firm to do it.
Traders connect to Bybit by API, and trade USDT perpetual futures on the trader’s own account against live order books, across more than 700 pairs.
The same firm shows what honest simulation looks like.
Its CLEO platform, built for traders in Bybit-restricted countries, prices from real-time Binance market data and order book depth while filling trades internally, and it simulates the unflattering parts: market impact, commissions, slippage landing in the position PnL at fill.
If a firm will not say plainly where fills happen, assume the answer costs you money.
Test two: how drawdown is measured
Two firms quoting the same daily limit can be selling different products, because what matters is the reference point.
HyroTrader’s standard daily drawdown is trailing: measured from the highest equity point reached during the day, unrealized profit included, so the risk line rises as the day goes well.
Its swing variant, sold as a paid upgrade, is static, measured from the day’s starting equity and reset once every 24 hours.
The daily limit itself is 4 percent on the one-step model and 5 percent on the two-step, calculated from initial capital.
A trailing limit punishes how you win. Ride a position up, give a third of the move back, and the giveback can trip the limit while the day is still green.
Crypto compounds the effect because volatility arrives in bursts; CoinJournal’s analysis of Bitcoin’s current tight range describes exactly the kind of compression that precedes them.
Test three: what a payout actually is
A payout policy is three numbers and a proof: how often, how fast, and whether anyone can verify it happened.
At HyroTrader, payouts are on demand, typically processed within 12 to 24 hours, in USDT or USDC, with no withdrawal commissions, and the first one can be requested as early as the day of the first trade.
Since April 2026, payouts through its vault system execute as Solana transactions with publicly verifiable IDs on Fireblocks infrastructure, so the proof does not depend on the firm’s word.
Cost belongs in the same test. HyroTrader’s challenge fees run one-time, from $59 for a 5,000 USDT account to $969 for 200,000 USDT, with no recurring charges, and the fee is refunded with the first profit split after passing.
A firm confident in its payout process has no reason to bury these numbers.
The honest trade-off
HyroTrader is crypto-only: USDT perpetual futures, no forex pairs, no indices, no metals.
A trader who wants gold or the S&P alongside BTC needs a multi-asset firm and accepts the different execution model that comes with it.
There are consistency rules too: during evaluation, no single day may contribute more than 40 percent of the result, though exceeding the cap only discounts the excess rather than failing the account.
The structure fits deliberate traders and frustrates all-in ones, which is the point.
Choosing by profile
A crypto-native perpetuals trader gets the most from a crypto-first structure with verifiable payouts, which is HyroTrader’s case.
A generalist who wants metals and indices in the same account belongs at a multi-asset firm: FTMO, which popularized the modern evaluation model, runs crypto as one market among forex, indices, and metals, and FundedNext brings similar breadth.
Whatever the profile, start from a crypto prop firm comparison that puts evaluation costs, drawdown types, and payout terms side by side, then read the full rulebooks of the two finalists. Pick the rulebook you can recite before you pay for it.
Figures come from the firms’ published terms as of August 2026; verify current numbers before purchasing an evaluation. Trading crypto derivatives carries substantial risk of loss.

Financial Update Luglio 2026 | Public Version

Earl Spencer to tell all about Diana’s death: He plans ‘historic’ book to take on ‘untruths’ about her marriage to Charles and aftermath of Paris crash

Krusteaz focuses on fundamentals to fuel growth





-

 Fashion4 days ago
Weekend Open Thread: Ann Taylor
-
 NewsBeat7 days ago
Communication cards help banking customers access services or report scams
-
 Sports5 days ago
This U.S. Amateur is a glimpse into golf’s future in more ways than you think
-
 NewsBeat3 days ago
Myanmar says over 300,000 Rohingya refugees verified for repatriation as exodus enters ninth year
-

 Sports3 days ago
Birmingham 2026: Day 6 Timetable for Irish Athletes
-

 Politics3 days ago
SEQ Code: The Three Letter Boarding Pass Code That Could Give You The Worst Seat
-
 Entertainment6 days ago
Keke Palmer Subtly Hints At Sean Evans Drama With Cryptic Post
-
 Tech4 days ago
11 Ways to Rank Your Videos
-

 Fashion7 days ago
Coffee Break: The Fonteyn Jane Flat
-

 Fashion7 days ago
Should you refinance your debt? Pros, cons, and real numbers
-

 Fashion7 days ago
Claire Life: Kicking Off MVAAFF With the C Suite Luncheon Featuring Phylicia Rashad, Letoya Luckett, and More!
-

 Tech7 days ago
Zoom Screen-Sharing Bug Let People Fully Take Over Other Devices On A Call
-
 Crypto World6 days ago
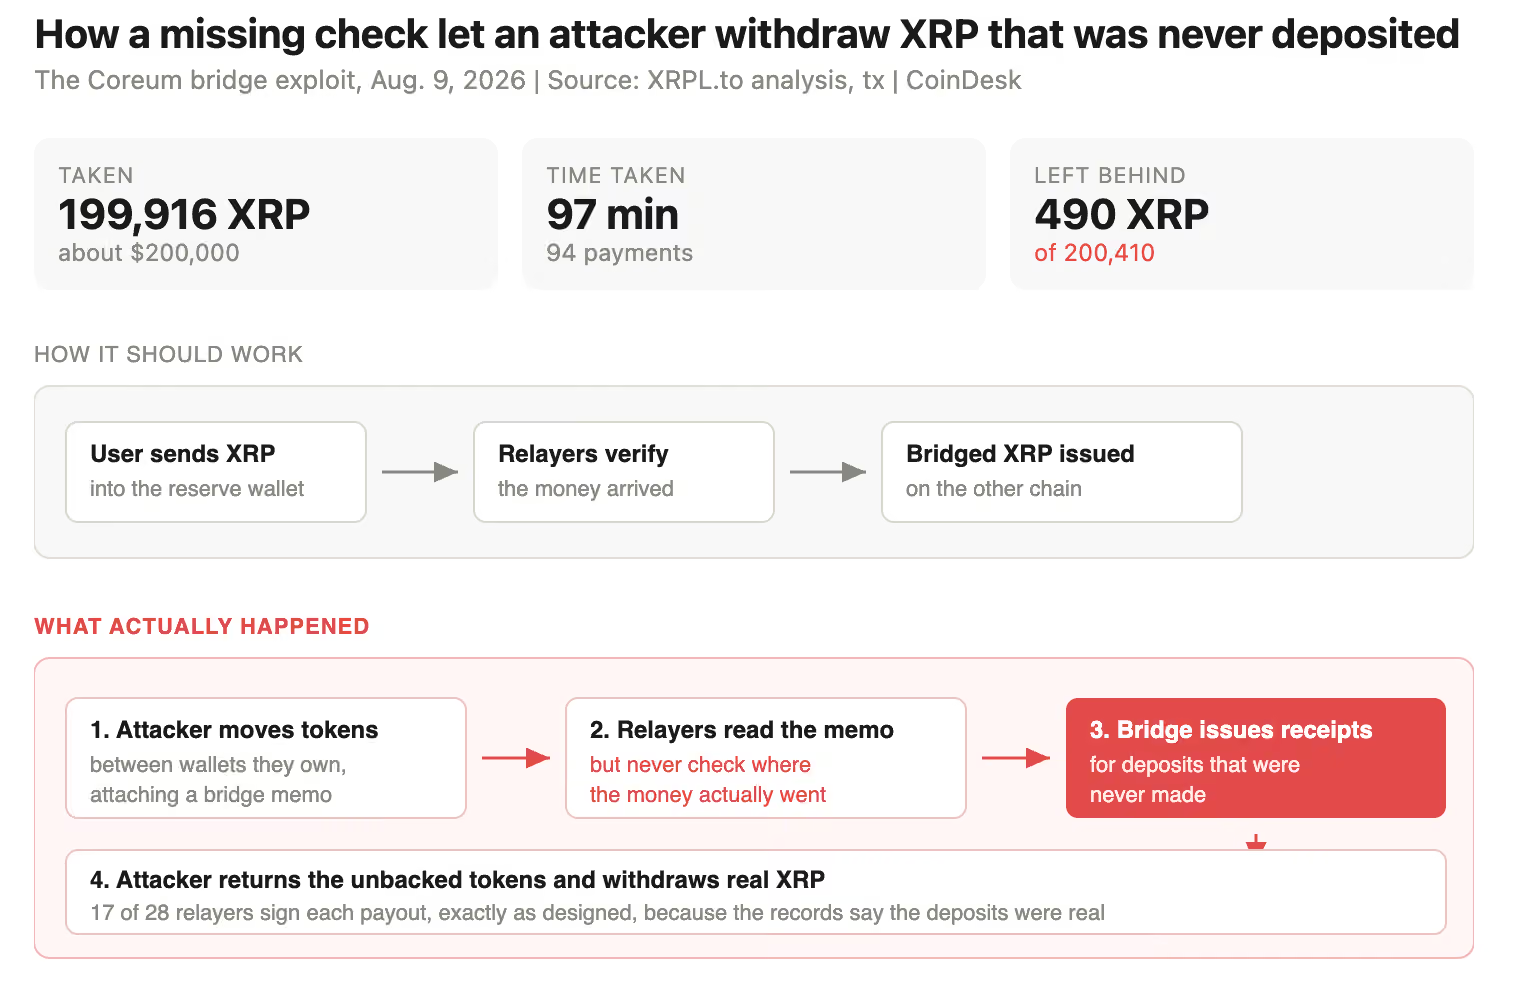
XRP bridge drained after software mistook fake deposits for real ones
-

 Tech5 days ago
DeepSeek Harness launches as open source rival to Claude Code, alongside V4-Pro on API with higher prices
-

 Sports6 days ago
DeQuan Jones in ‘high spirits’ after successful leg surgery
-

 Tech6 days ago
SpaceXAI’s Grok Bot turns agents into persistent digital coworkers that can operate your apps for $120-per-month
-

 Politics6 days ago
How Average Are You In The UK?
-
 Crypto World6 days ago
Perplexity AI Predicts an XRP Scenario Few Analysts Are Discussing
-

 Politics7 days ago
In the Chris Kaba case, the police watchdog capitulated to the mob
-

 Fashion7 days ago
How Do You Get Your Work Noticed?
You must be logged in to post a comment Login