
Crypto World
Bitcoin Bears Eye $50K Bottom as Analysts Warn One More Drawdown
Bitcoin enthusiasts and market observers are once again debating whether the flagship crypto will endure a final, liquidity-driven flush before any meaningful recovery takes hold. With price action mostly consolidating after recent swings, several prominent analysts say the path to a durable uptrend could still require a deeper test of support around the $50,000 region, even as episodic rallies surface on shifting macro news.
Key takeaways
- Several respected traders argue a final downside sweep toward roughly $50,000 could precede a lasting recovery, even as Bitcoin has shown intermittent strength in other macro setups.
- Despite a bounce to just under $75,000 linked to hopes for a US–Iran deal, the broader trend remains down according to noted analysts, who see any big bullish impulse as contingent on a shift in market structure and macro conditions.
- Chart patterns and cycle theory feature prominently: a bear-flag setup is still considered active by some analysts, suggesting further declines before a potential distribution phase and new accumulation.
- In the longer view, the market is wrestling with a different macro regime and a higher degree of institutional participation, factors that could blunt historic drawdown magnitudes in this cycle.
- Fidelity Digital Assets has cautioned that downside risk in 2026 may be less dramatic than in prior cycles, signaling a potentially more resilient macro-structure for Bitcoin amid ongoing adoption.
Bitcoin’s near-term trajectory: the debate among traders
Among the most vocal skeptics is Ivan Liljeqvist, the trader and author known for his social commentary on price action. In a recent post, he argued that Bitcoin has yet to witness a true “big flush,” suggesting that the market could test lower levels before a durable turn toward higher prices. His view centers on the idea that the current bounce strength is insufficient to mark the end of the bear phase, and that the downtrend remains intact.
“I don’t think we’ve had it yet, I don’t think $60,000 was the bottom. Trend is still down,” Liljeqvist wrote, underscoring the persistent breadth of selling pressure that has characterized this cycle. The implication for traders is straightforward: a mild rebound may prove unsustainable without accompanying macro or institutional shifts that breathe new life into demand at scale.
Another veteran observer, Merlijn Enkelaar, has framed Bitcoin’s path in a broader cycle view. He argues that the asset could be entering its second bear-market phase after a period of accumulation, with a potential “manipulation phase” pushing prices down toward the $50,000 region before a third, or distribution, phase takes hold. The framing implies a longer-than-expected consolidation period, punctuated by volatile drawdowns that shake out weaker hands and reset expectations for institutions stepping in later in the cycle.
“This could potentially set up for stronger bullish momentum once the flush concludes, but the institutionalization of crypto markets places consistent buying pressure at current levels.”
For Nick Ruck, director at LVRG Research, the narrative centers on accumulation zones and macro resilience. He interprets a move toward $50,000 as the last meaningful accumulation window before any sustained rebound, positioning it as a cyclic reset amid broader macro headwinds and capital rotation challenges. Ruck’s perspective highlights a tension in the market: while doom-oriented voices dominate headlines, a longer arc of accumulation could still unfold if non-price factors align in favorable ways.
From the charts to the macro matrix
The discussion isn’t confined to price psychology alone. The current debate sits at the intersection of chart-driven patterns and macro-market structure. On the chart, some analysts point to a bearish flag formation that remains “in play,” signaling continued downside pressure until a new balance is found. A bear-flag pattern has historically served as a continuation signal, suggesting the trend may extend lower before buyers re-emerge with conviction.
Even as some market players look for a bottoming signal, Bitcoin did experience a relief rally earlier in the month, climbing to just under $75,000. The move was attributed to renewed optimism over a potential Iran–U.S. deal, a development that temporarily lifted markets across risk-on assets. Yet the price action once again underlines the fragility of near-term resistance: even sharp intraday squeezes can be reversed if macro news reverts to risk-off concerns or if liquidity conditions tighten.
On the longer horizon, the drawdown history remains a salient reference point. The 2017 bear market retraced roughly 82% from its high, while the 2021 cycle saw about a 77% peak-to-trough decline. In light of those precedents, some observers concede that the current cycle may diverge from the textbook 60% drawdown baseline they had expected earlier in the year. As one analyst noted, the market environment today is macro-structured in a way that could limit such a clean retreat, complicating any attempt to predict an exact bottom or the pace of subsequent recovery.
Further nuance comes from Fidelity Digital Assets, which has recently argued that downside risk in 2026 could be less dramatic than in past cycles. The assessment points to a world in which institutions already possess deeper exposure to digital assets and where the macro backdrop—while still challenging—appears less prone to catastrophic, regime-shifting drawdowns for Bitcoin than during prior bear markets.
What to watch next in a market evolving under new dynamics
As the debate unfolds, several indicators could shape the next phase of Bitcoin’s cycle. First, the $50,000 region looms as a potential pivot point, especially if the market breaks decisively below key demand zones on high-volume selloffs. A decisive move through this level would not only test investor conviction but also influence the timing and scale of any subsequent accumulation by institutions or large holders.
Second, the pace of institutional participation continues to be a critical variable. If the market’s “institutionalization” indeed places steady buying pressure at current price levels, the upswing could be more gradual and less prone to sharp, V-shaped recoveries. In that context, traders may need to tolerate broader ranges and more pronounced drawdowns during the transition to a new cyclical phase.
Third, macro developments—ranging from geopolitical tensions to liquidity conditions and monetary policy signals—will continue to drive risk sentiment and cross-asset correlations. The ongoing sensitivity of Bitcoin to these macro factors reinforces the idea that price action alone cannot tell the full story of where the market is headed next. Investors and builders will want to monitor how the macro story evolves alongside on-chain activity and sector adoption, as those elements often feed into longer-term cycles more decisively than short-lived price spikes.
Finally, the market’s risk-reward calculus remains nuanced. While some traders anticipate a deeper flush, others point to the possibility of a measured, protracted recovery as institutions allocate capital to crypto-related strategies and products. In this tension lies the potential for a steadier ramp higher rather than an abrupt, speculative rally—an outcome that could align with a structurally improved macro environment and greater clarity around regulatory and custodial frameworks.
For readers and market participants, the near future will likely test these competing theses in real time. The immediate question remains whether Bitcoin can sustain any rally without revisiting the lower sub-50k zones, or whether a test of those levels becomes a necessary precondition for a durable breakout. As always, the answer will partly hinge on how the macro narrative unfolds and how patient capital responds to evolving price discovery signals.
As the year progresses, watchers should keep a close eye on price action around the 50,000 to 60,000 band, the behavior of large holders, and the tempo of institutional activity. The convergence—or divergence—of these factors will illuminate whether this cycle is on track for a traditional recovery arc or a more complex, protracted consolidation shaped by macro realities and market participants increasingly anchored to crypto markets.
Readers should watch the next price action and macro developments closely, as the coming weeks may determine whether Bitcoin breaks decisively toward a new regime or tests a deeper trough before gathering momentum for a broader, more sustainable upswing.


US voters ranked crypto last among election priorities in an April poll of 1,000 registered Americans.
Summary
- Just 1% of registered US voters named crypto their top concern; only 3% called it the single most important 2026 midterm issue.
- Majorities of independents, Democrat-leaning voters, and base Democrats all held unfavorable views of cryptocurrency in the poll.
- Despite low priority rankings, 22% said crypto is an important issue and 40% would vote for a candidate aligned on digital assets.
Public Opinion Strategies conducted the poll in late April on behalf of CoinDesk, surveying 1,000 randomly selected registered US voters with a credibility interval of plus or minus 3.53%.
Respondents were evenly split between Republican and Democratic identifiers at 41% each. As crypto.news reported, TD Cowen had already warned that the 2026 midterm cycle could push the CLARITY Act “off the congressional calendar until 2027,” framing voter indifference as a direct threat to industry legislative goals.
The sentiment numbers were broadly negative outside the GOP base. Independents viewed crypto unfavorably at 48% versus 27% favorably. Democratic-leaning voters were 54% unfavorable to 26% favorable.
Only Republican leaners produced a slight net positive at 41% to 39%. TraderSunion noted that 62% of respondents said they did not trust the Trump administration to oversee the crypto sector.
What the numbers mean for the industry
AI fared better in the same survey, with 46% favorable versus 45% unfavorable, a net positive that crypto has not achieved. Just 27% of respondents said they had ever invested, traded, or used cryptocurrency, while another 27% said they had not but might one day.
Digital Chamber CEO Cody Carbone has said “there are outstanding sticking points, but that shouldn’t slow down the process” on the CLARITY Act. As crypto.news documented, that sentiment sits against a political backdrop where voter indifference to crypto limits the electoral cost of blocking legislation entirely.
As crypto.news tracked, crypto groups spent roughly $120 to $130 million in the 2024 elections, with 2026 spending expected to exceed that. As crypto.news noted, Binance Research found midterm years historically produce average Bitcoin declines of roughly 56%, with a recovery typically following once election results reduce policy uncertainty.

TLDR
- World Liberty filed a defamation lawsuit against Justin Sun in a Florida state court.
- The lawsuit follows Sun’s federal case in California over frozen WLFI tokens.
- World Liberty alleged that Sun engaged in misconduct tied to WLFI token purchases.
- The company claimed Sun launched a short-selling campaign during the token’s public debut.
- The complaint linked $300 million in wallet transfers to Binance to Sun-affiliated entities.
World Liberty filed a defamation lawsuit against Tron founder Justin Sun in Florida on Monday. The company alleges Sun made false statements after it froze his WLFI tokens. The case follows Sun’s own federal lawsuit in California over the same tokens.
World Liberty Alleges Misconduct Over WLFI Token Activity
World Liberty accused Sun and related entities of “gross misconduct” tied to WLFI token purchases. The company claimed Sun used straw buyers to acquire tokens for other investors. It also alleged that Sun may have engaged in short selling during the public launch.
The complaint described “a large, deliberate, short-selling campaign designed to suppress $WLFI’s price.” It linked that campaign to Sun-affiliated wallets that moved $300 million to Binance. World Liberty stated that it froze the tokens under its contractual rights.
The lawsuit said the freeze aimed to “protect” the company and the broader $WLFI community. It argued that Sun knew about the transfer restrictions before the freeze occurred. The filing stated that Sun understood the company’s authority over token transferability.
World Liberty claimed Sun later posted tweets that contained false or defamatory information. The company said Sun knew those statements were untrue because of prior agreements. It alleged that those posts harmed its reputation and business prospects.
The complaint also alleged that Sun hired influencers and used bots to amplify his claims. World Liberty said those actions led to lost business opportunities. Several sections of the filing remain redacted, including details about token purchases.
Justin Sun Challenges Freeze as Legal Battle Escalates
Sun filed his own lawsuit against World Liberty in federal court in California. He alleged that the company unfairly froze his WLFI tokens. His complaint claimed that the freeze restricted his ability to transfer assets.
World Liberty responded in its Florida filing by emphasizing contract terms. The company stated that Sun “knew through his personal experience” about the transfer limits. It argued that Sun’s public statements ignored those agreed terms.
The Florida lawsuit seeks damages, expenses, and a retraction of Sun’s statements. World Liberty requested compensation for reputational harm and related losses. It framed the dispute as a breach of agreement and defamation issue.
The filing repeated that Sun knew about the company’s right to restrict token transfers. It stated that both Sun and the public understood that authority. The court has not yet set a hearing date in the Florida case.
World Liberty filed the complaint in a Florida state court on Monday. Sun’s separate case remains pending in a California federal court. Both cases now proceed in parallel as the dispute over WLFI tokens continues.

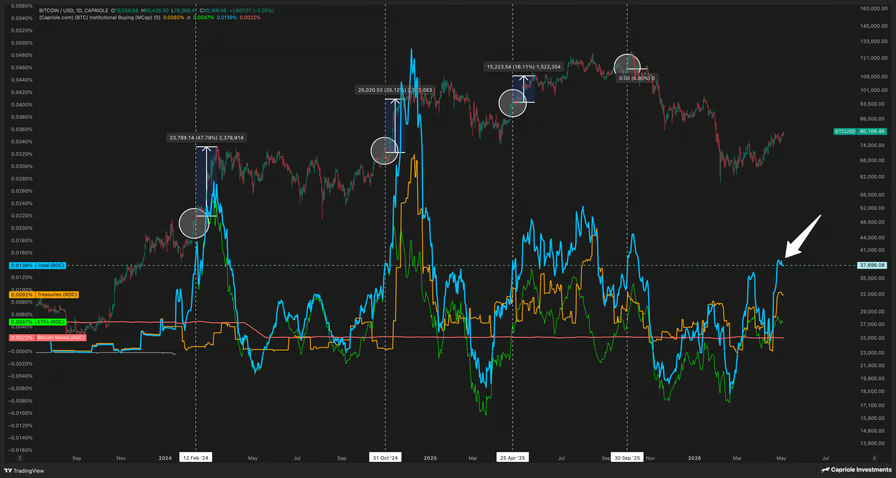
Bitcoin (BTC) may rally toward $96,000 by June as institutions absorb more than five times the daily mined BTC supply, according to Capriole Investments founder Charles Edwards.
BTC price averages 24% gains after institutional supply squeeze
In a Monday post, Edwards said institutions have been “slurping up 500%+ of Bitcoin’s daily mined supply.”

BTC/USD daily chart vs. institutional buying market cap. Source: Capriole Investments
Since the April 2024 halving, Bitcoin miners have produced roughly 450 BTC per day, keeping supply growth relatively stable, with its rate of change (ROC, the red line) hovering near 0.0022% as of Monday.
In contrast, institutional buying’s ROC (blue) stood near 0.0139%, showing demand momentum rising more than five times faster than new supply growth.
Renewed ETF inflows and steady BTC purchases by Michael Saylor’s Strategy have helped drive that demand. They added roughly 70,000 BTC in April, more than approximately 13,500 BTC mined during the same period.

US Spot Bitcoin ETF monthly net flows and Strategy’s BTC holding. Source: Glassnode, BitBo.IO
“Every time it’s been this high before, price has shot up over the next week,” said Edwards, adding:
“The average return in prior cases is +24% over the next 1 month from here, that would take us to around $96K.”
Edwards noted that when institutional absorption exceeds 500% of Bitcoin’s daily mined supply, BTC has historically delivered ~24% average gains over the following month, which would put the price around $96,000 by June.
Similar targets have also been shared by analyst Michaël van de Poppe, who said Bitcoin may “easily” reach $95,000, citing renewed demand for spot BTC ETFs and other technical factors.
Bitcoin sharks accumulate over 61,000 BTC in 30 days
Onchain data shows the supply squeeze extends beyond ETFs and corporate buyers.
Bitcoin “sharks,” entities that hold 100–1,000 BTC, have accumulated over 61,000 BTC in the past 30 days, according to data resource Glassnode.
.png?prefix=media%2Fcontent)
BTC shark net position change vs. price. Source: Glassnode
Smaller cohorts, including “fishes” holding 10–100 BTC and “crabs” holding 1–10 BTC, are also net accumulators during the same period.
.png?prefix=media%2Fcontent)
BTC fish and crab net position change vs. price. Source: Glassnode
The data shows that both mid-sized investors and retail participants are steadily absorbing supply, raising BTC’s odds of hitting $96,000 over the next few weeks if the demand persists.
Related: Strategy takes Bitcoin buying breather ahead of Q1 earnings report
Still, some analysts warrant caution, citing a prevailing bear flag setup.
In a Monday post, trader Bitbull highlighted $60,000–$62,000 as a potential downside target if BTC corrects from the flag’s upper trendline toward the lower trendline.

BTC/USD daily chart. Source: TradingView/BitBull
A breakdown below the lower trendline may send the BTC price under $50,000.
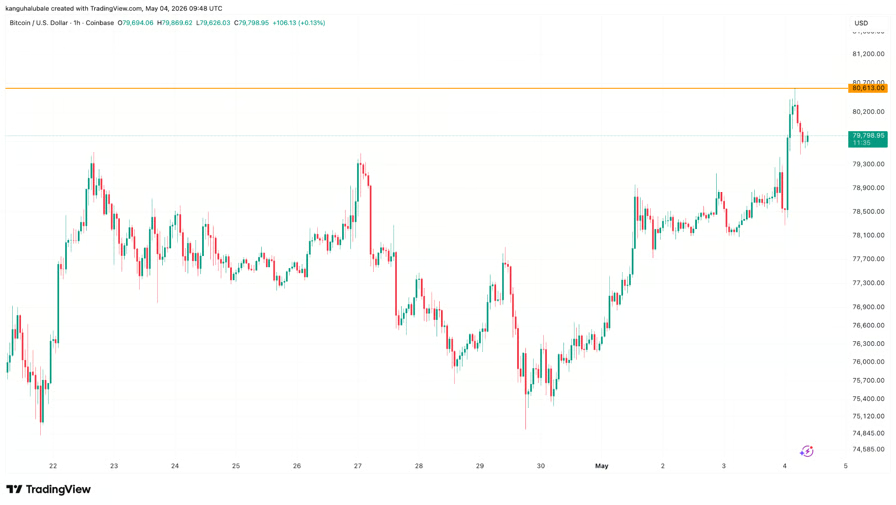
Market analysts said Bitcoin (BTC) is “primed for upward momentum” after rallying past $80,000 during the early Asian trading hours on Monday.
Key takeaways:
- Bitcoin price rises to a 13-week high of $80,610 on Monday amid $462 million in crypto liquidations.
- The CME gap at $84,000 could act as a “magnet” for BTC price.
Bitcoin leads market in fresh May rally
Data from TradingView showed 1.6% daily BTC price gains, with BTC/USD rising as high as $80,610 for the first time since Jan. 31.

BTC/USD one-hour chart. Source: Cointelegraph/TradingView
Ether (ETH), the largest altcoin by market capitalization, was trading at $2,367 at the time of writing, up 2% over the last 24 hours. Fourth-place XRP (XRP) has gained nearly 2% over the last day to trade just above $1.41.
Dogecoin (DOGE) climbed the most among the top 10 cryptocurrencies, up 3.5% over the same period.
Related: BTC price can ‘easily’ hit $95K: Five things to know in Bitcoin this week
As a result, the global crypto market capitalization is up 1.6% over the last day toward $2.65 trillion on Monday.

Performance of top-cap cryptocurrencies: Source: CoinMarketCap
“Bitcoin looks primed for upwards momentum,” MN Capital founder Michael van de Poppe said in an X post on Monday.
The analyst added that a “breakout above $79K opens the opportunities” toward the $86,000-88,000 resistance zone and later to $90,000.

BTC/USD daily chart. Source: X/Michael van de Poppe
“It’s a disbelief rally” for Bitcoin, crypto analyst Matthew Hyland said in response to Bitcoin’s latest push above $80,000, adding:
“The many calling for $60K and below will be the ones flipping bullish late above $90K.”
Bitcoin’s rally is accompanied by significant short liquidations across the crypto market totaling $452 million over the last 24 hours, signaling intense buying by traders.
Meanwhile, Bitcoin taker buy volume saw “two consecutive large hourly buy-volume spikes on Binance of approximately $1.19 billion and $792 million,” CryptoQuant analyst Amr Taha said in a Quicktake note on Monday, adding:
“When this type of volume appears near a major breakout level, it often shows that traders are not waiting for a pullback; instead, they are chasing confirmation as the price moves higher.”

Bitcoin taker buy volume on Binance. Source: CryptoQuant
BTC bulls target $84,000 next
As Cointelegraph reported, Bitcoin bulls were required to push above $80,000 to sustain the upward momentum.
Bitcoin’s 5.5% rally over the last five days saw the BTC/USD pair reclaim key support levels, including the true market mean at $77,500 and the short-term holder cost basis around $78,000.
Traders now shifted their focus to the CME gap at $84,000, formed in early February.

BTC/USD four-hour chart. Source: X/AlphaBTC
Bitcoin is on “its way to close the previous large gap from $84K,” trader Daan Crypto Trades said in a Monday post on X, adding
“Good to mark these levels on your chart as they could act as ‘magnets’ and local reversal zones if price trades close/into them.”
Meanwhile, Bitcoin’s 30-day liquidation map reveals that a break above $84,000 would trigger over $2.85 billion worth of leveraged short liquidations across all exchanges.

Bitcoin exchange liquidation map. Source: CoinGlass
TLDR:
- Binance PAXG reserves surged 344%, climbing from 25,301 tokens in early 2025 to a peak of 133,334 by April 2026.
- Physical gold prices rose from $2,700 in early 2025 to $4,650, running parallel to the spike in tokenized gold holdings.
- JPMorgan targets $6,300 and Goldman Sachs projects $5,400 for gold by year-end 2026 despite the recent price correction.
- Crypto investors are treating PAXG as a long-term hedge, mirroring institutional safe-haven strategies in traditional markets.
PAXG reserves on Binance have recorded a dramatic 344% growth between early 2025 and May 2026. This surge in tokenized gold accumulation mirrors a historic rally in physical gold prices.
Crypto investors appear to be actively positioning themselves against macroeconomic risks. Meanwhile, top Wall Street institutions maintain bullish targets for gold through the end of 2026.
The parallel movements across both markets reflect a clear shift in how digital asset holders manage long-term value.
Binance PAXG Reserves Climb to Record Levels
Binance’s tokenized gold holdings stood at just 25,301.5 PAXG tokens in early 2025. By early April 2026, that figure climbed sharply to a peak of 133,334.1 tokens.
As of early May 2026, reserves have settled at 112,385.4 tokens. The overall growth from start to peak represents a 344% increase over roughly 15 months.
This accumulation trend developed alongside a steep rise in physical gold prices. Spot gold moved from $2,700 per ounce in early 2025 to $4,650 currently.
The two trends together point to a broader risk-hedging strategy taking shape within the crypto market. Investors appear to be using PAXG as a long-term store of value rather than a short-term trading position.
Cryptoquant analyst CryptoOnchain noted on X that the growth in Binance’s PAXG reserves aligns closely with bullish institutional forecasts for gold.
According to the analyst, crypto investors are actively hedging risks by treating tokenized gold as a long-term hold.
This behavior mirrors strategies more commonly seen in traditional commodity markets. The data from CryptoQuant supports this reading.
PAXG, issued by Paxos Trust Company, is an ERC-20 token backed one-to-one by physical gold bars. Each token represents one fine troy ounce held in LBMA-accredited vaults.
The token allows fractional ownership without the logistics of physical storage. Its presence on Binance makes it one of the most accessible forms of tokenized gold for retail and institutional traders.
Wall Street Targets Remain Bullish Despite Recent Gold Correction
Gold reached an all-time high of $5,589 per ounce in January 2026 before pulling back. Prices have since corrected into the $4,800 to $4,900 range.
However, major institutions have not revised their bullish outlook in response to the dip. JPMorgan has set a year-end 2026 target of $6,300, while Goldman Sachs projects $5,400.
Both banks cite central bank accumulation and geopolitical hedging as the main drivers. These factors have remained consistent throughout the current bull cycle.
The correction, in their view, represents a buying opportunity rather than a trend reversal. Institutional demand continues to absorb available supply at lower price levels.
The structural forces supporting gold remain unchanged in the current macro environment. Persistent geopolitical tensions and ongoing currency risks continue to push investors toward safe-haven assets.
Tokenized gold has become a practical bridge between traditional hedging and digital asset portfolios. The growth in Binance’s PAXG reserves is one measurable outcome of this shift.
As gold markets head further into 2026, both on-chain data and Wall Street forecasts point in the same direction. The alignment between PAXG reserve growth and institutional price targets suggests a coordinated rotation into hard assets.
Whether through physical bullion, ETFs, or tokenized alternatives, the appetite for gold exposure remains strong across investor segments.


Morgan Stanley head of digital asset strategy Amy Oldenburg said at the Bitcoin 2026 Conference in Las Vegas that Bitcoin on US bank balance sheets is “not totally out of the question,” citing 16 months of regulatory progress while warning that Basel capital rules and Fed guidance still stand in the way.
Summary
- The Basel Committee’s 1,250% risk-weight on unbacked crypto makes direct Bitcoin balance-sheet exposure economically unviable for major banks under current rules.
- Morgan Stanley’s MSBT launched April 8 as the first US bank-affiliated Bitcoin ETP, hitting $100M in six days entirely through self-directed client demand with zero advisor involvement.
- The bank recommends a 2% to 4% Bitcoin allocation to certain clients and is pursuing an OCC digital trust charter for direct crypto custody and spot trading.
Morgan Stanley’s Amy Oldenburg said at the Bitcoin 2026 Conference on May 3 that direct Bitcoin holdings are not imminent but regulatory progress has made the scenario more plausible. “I think if we continue to see the progress that we’ve made over the last 16 months or so in regulatory, that that’s something that you may see going forward. It’s not totally out of the question,” she said.
CoinCentral reported that Oldenburg identified two conditions: the Basel Committee must revise its 1,250% risk-weight for Bitcoin, and the Federal Reserve must provide examiners a clear framework for Bitcoin exposure.
The Basel Committee said in February 2026 it had expedited a targeted review of its crypto standards.
As crypto.news reported, Morgan Stanley launched MSBT on April 8 as the first spot Bitcoin ETF issued directly by a major US commercial bank, with Coinbase Custody and BNY Mellon serving as dual custodians.
As crypto.news documented, MSBT attracted $103 million in net inflows within eight days of launch, with 80% of exposure coming through self-directed channels and zero advisor involvement. Oldenburg said the slow advisor adoption reflects an education gap the bank is now addressing through internal training programs.
As crypto.news tracked, Morgan Stanley is pursuing an OCC digital trust charter for direct crypto custody and spot trading, and has filed separately for Ethereum and Solana trusts, with retail crypto trading on E*Trade targeted for the first half of 2026.
Bitcoin (BTC) reached a new three-month high of $80,500 on Monday, testing the level for the first time since Jan. 31. The rally above $80,000 puts the price just below short-term holders’ cost basis of $81,486, the next dynamic resistance level. For the rally to continue, a daily close above this level is key to securing $80,000 as support.
A rally to $81,500 may lock in the trend
Bitcoin’s rally to $80,000 places the price directly under the short-term holder’s realized price of $81,486. This metric reflects the average cost of coins moved over the last 155 days and indicates where recent buyers have flipped from loss to profit.
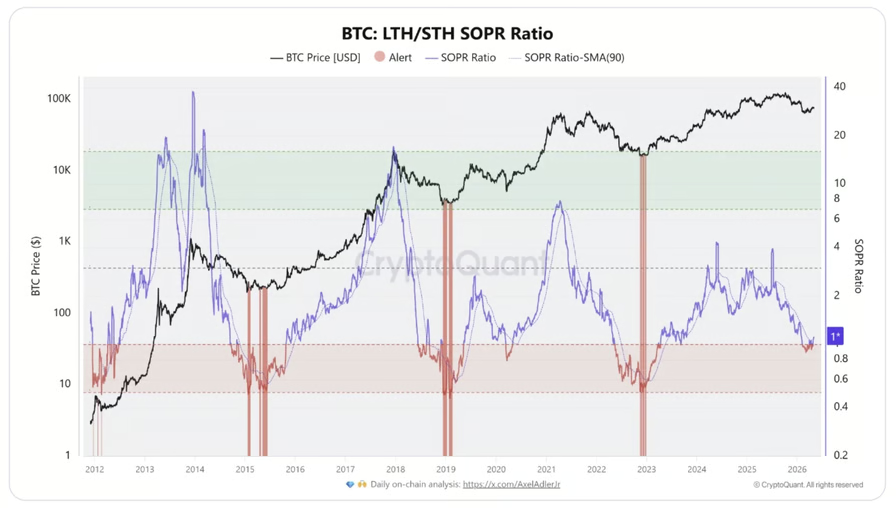
A daily close above $81,500 would return these holders to profit and reduce sell-side pressure. According to crypto analyst Crazyyblockk, the short-term holder losses have narrowed to about -2.17%, showing that the overhead supply band is thinning. The long-term holders (LTHs) hold near +27% profit and are not distributing aggressively.

Bitcoin LTH/STH SOPR ratio. Source: CryptoQuant
The spent-output profit ratio (SOPR), which tracks whether coins are spent at a profit or a loss, has climbed to 1.097 from 0.99. This indicates the coins are being spent in profit again, led by long-term holders.
The exchange inflow data aligns with that shift. Around 97.2% of recent deposits came from short-term holders, with wallets holding 1 to 1,000 BTC contributing roughly 58%.
BTC inflows peaked at 35,649 BTC on April 24 and dropped to 3,895 BTC by May 3. That compression reduces immediate sell pressure and supports the case for holding at $80,000 once the cost basis flips.
Related: Bitcoin in ‘disbelief rally’ as traders spot $84K BTC price target
BTC exchange supply builds below $80,000
BTC exchange flow data tracked by Bitcoin researcher Axel Adler Jr shows 8,512 BTC in net inflows over recent days, with spikes on April 27 and April 30. The price absorbed that supply without a sharp downside, signaling an active BTC demand.

Bitcoin exchange netflows for all exchanges. Source: CryptoQuant
The BTC flows have since cooled to near-neutral at 269 BTC between May 1 and May 3. The short-term averages stay positive, while the longer-term averages sit near zero, keeping the move contained to a short impulse.
BTC exchange reserves increased by 5,773 BTC week over week to 2,685,541 BTC, before easing slightly after April 30. Adler Jr explained that the coins are currently sitting on exchanges without aggressive selling, forming a supply overhang that could turn into pressure if demand slows.
Meanwhile, crypto trader Ardi highlighted that BTC is retesting breakout liquidity near $79,600. The trader said that holding this level keeps the move intact toward the next supply zone near $84,000.

BTC/USDT analysis by Ardi. Source: X
A breakdown below $80,000 shifts focus to the new-money cost basis near $76,500 and increases the likelihood of a failed breakout setup.
Related: BTC price can ‘easily’ hit $95K: Five things to know in Bitcoin this week
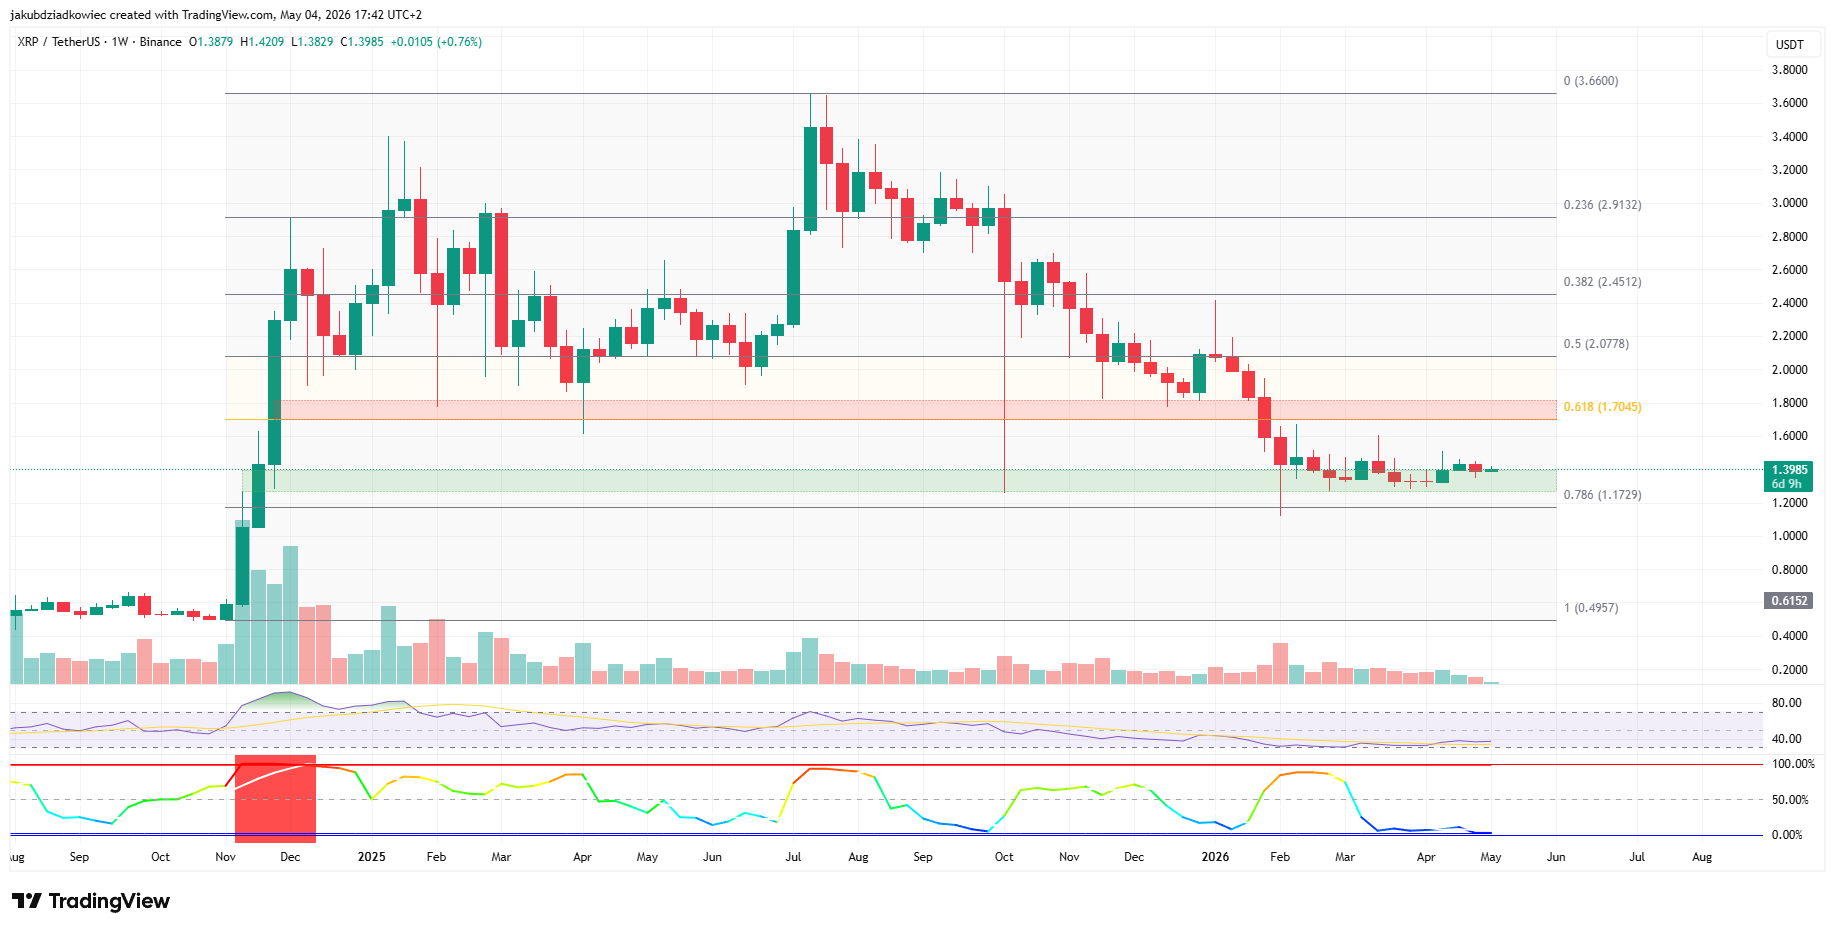
XRP price action has flatlined near $1.40 as Bollinger Bands on both the weekly and daily charts compress to their tightest readings in years, setting the conditions for an outsized directional move.
The Bollinger Band Width Percentile has fallen into extreme blue territory across multiple timeframes, and on-chain activity from large holders has cooled in step. Together, these signals point to a coiled market waiting for a catalyst.
Volatility Compression Reaches Multi-Year Extremes
On the weekly chart, XRP trades at $1.3985 just above the 0.786 Fibonacci retracement zone near $1.1729, while the BBWP reading sits at the very bottom of its range.
That places weekly volatility at its lowest level since the late 2024 expansion phase.

The daily timeframe tells the same story. The BBWP has flashed extreme blue three times in recent weeks, with the most recent reading from late April still pinned to the indicator’s floor.
The Relative Strength Index hovers near 40, reinforcing the absence of momentum in either direction.

A move on the BBWP back above 50 would signal that volatility is expanding. Until then, the squeeze remains the dominant technical feature on both timeframes.
On-Chain Activity Confirms the Calm
While the chart shows compression, on-chain data confirms why. Santiment data shows the whale transaction count for transfers above $100,000 has dropped to 117, well below the 700-900 peaks seen during the January and early February swings.
Exchange inflows tell the same story. The metric currently stands at roughly 2.19 million XRP per day, near the lowest level in the past six months. Large holders are not moving size onto exchanges, and retail flows have thinned out alongside.

This combination historically precedes volatility expansion rather than continued drift. When whale activity and exchange flows reset to local lows, the market typically runs out of fuel to sustain the existing range.
XRP Price Prediction Hinges on Triangle Apex Near $1.40
The daily price chart shows XRP grinding inside a contracting symmetrical triangle. The descending resistance line tracks down from the mid-February high near $1.65 toward $1.45, while the ascending support line rises from the early February low near $1.20 toward $1.30. The apex sits within days of completion.
An independent analyst @seth_fin highlighted the same setup, noting that the current Bollinger Band squeeze on Ripple is the tightest in years.
The Visible Range Volume Profile on his chart shows the heaviest volume node clustered between $1.35 and $1.42, identifying that band as the immediate battleground.

A breakout above the descending trendline near $1.45 opens the path toward $1.4697 and the 0.618 weekly Fibonacci resistance at $1.7045. A breakdown through $1.3563 exposes the $1.1427 to $1.1729 region, which aligns with the weekly 0.786 Fibonacci support.
The catalyst remains open. Spot Bitcoin and Ethereum exchange-traded fund flows, fresh news on the Ripple legal file, or a broad macro shift could each force the squeeze to release. Either way, the apex is closing fast, and the next candle of size should set the direction.
The post XRP Calm Before the Storm? Bollinger Squeeze Signals Big Move appeared first on BeInCrypto.


Pi Network co-founder Dr. Chengdiao Fan is set to speak at Consensus 2026 in Miami on May 6, delivering a session titled “Aligning Web3, AI, and Blockchain for Utility” at the Convergence Stage, six days before Protocol 23 brings full smart contracts to the Pi blockchain on May 11.
Summary
- Fan’s session argues that verified human identity is the competitive advantage that AI cannot replicate, directly connecting Pi’s 18 million verified users to the AI era’s core governance problem.
- Pi Network has completed over 526 million human KYC validation tasks and runs 421,000 active Mainnet nodes entering Consensus week.
- Protocol 23, Pi’s most significant upgrade, launches May 11, introducing full smart contract functionality and transforming Pi into a programmable blockchain.
Pi Network’s official X account confirmed that Dr. Fan will speak May 6 from 11:15 to 11:35 AM EDT at the Convergence Stage. Her presentation argues that as AI lowers the barriers to building products, competition increasingly centres on authentic human data, verified user acquisition, and trusted participation.
This is the infrastructure Pi has been building since 2019. As crypto.news reported, Pi Network is an official sponsor of Consensus 2026, with co-founder Nicolas Kokkalis joining a May 7 panel titled “How to Prove You’re Human in an AI World (Without Doxing Yourself).”
As crypto.news documented, Protocol 23 is scheduled for May 11, six days after Consensus 2026 closes, introducing full smart contract functionality and unlocking decentralised applications, exchanges, and real-world asset tokenisation on Pi for the first time. The Consensus timing creates maximum public visibility immediately before launch.
As crypto.news tracked, PI rose more than 5% on April 29 as both founders were confirmed for Consensus 2026, with the token near $0.187 entering conference week. The official minepi.com blog confirmed full schedule details and session descriptions for both founders.
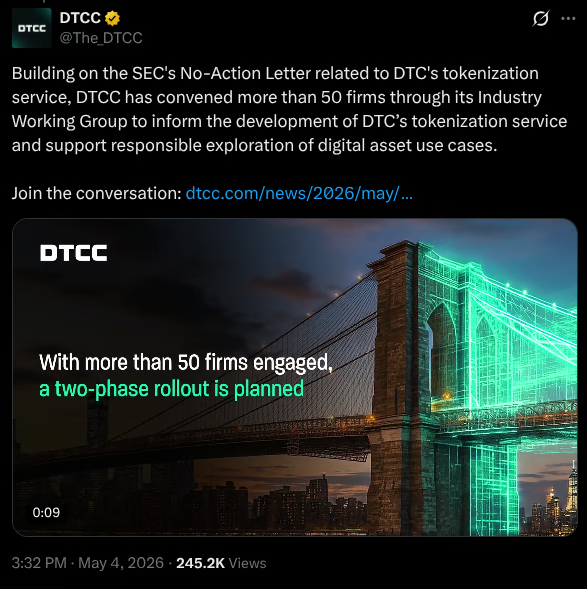
The Depository Trust & Clearing Corporation (DTCC) plans to pilot trading of tokenized securities in July with a goal of a full service launch in October.
The post-trade market infrastructure giant said Monday that more than 50 TradFi and DeFi firms will play a role in the design and deployment of the service. That DTCC Industry Working Group includes Alpaca, Anchorage Digital, BitGo Bank & Trust, BlackRock, Circle and Fireblocks, along with some of the biggest banks in the country.

Source: DTCC
DTCC, which currently custodies $114 trillion in liquid assets from stocks to exchange-traded funds, said it expects the service will enable tokenization of real-world assets that provide the same entitlements, investor protections and ownership rights as the assets held in traditional form.
In December, DTCC received permission from the US Securities and Exchange Commission (SEC) to offer tokenization services on pre-approved blockchains for three years.
“Although this program is a pilot subject to various operational limitations, it marks a significant incremental step in moving markets onchain,” SEC Commissioner Hester Peirce said at the time.
Related: Tokenized assets climb to $23.6B as investors seek always-on markets
While the pilot phase will test limited production trades, the full service is expected to tokenize a specific set of some of the most-widely traded liquid assets, including exchange-traded funds tracking major indexes, Russell 1000 constituents, US Treasury bills, bonds and notes, according to DTCC’s announcement.
Tokenized RWA market grows, but remains concentrated
The value of tokenized real-world assets have surged 66% in 2026, with funds, gold and equities driving growth across public blockchains.
Data from the analytics platform RWA.xyz show that tokenized stocks alone expanded from $375.4 million on May 3, 2025, to about $1.21 billion on May 3, 2026. Kraken’s xStocks platform has emerged as one of the more visible entrants, reporting more than $25 billion in cumulative trading volume since launching last year.
In January, the New York Stock Exchange and its parent company, the Intercontinental Exchange, announced the development of a new platform to trade tokenized stocks and ETFs. The platform, subject to regulatory approvals, is intended to underpin a new NYSE trading venue for tokenized securities.

Tokenized stocks have recently topped $1.2 billion in value. Source: RWA.xyz
Rather than creating a parallel crypto-native marketplace, the venue is designed to operate within existing US market rules while leveraging blockchain-based settlement infrastructure.
Both NYSE Group and Kraken’s parent, Payward, are part of the DTCC Industry Working Group announced Monday.
In March, TD Securities’ Reid Noch, vice president for electronic trading, said tokenization is beginning to carry real implications for market structure, pointing to the NYSE’s proposed tokenized equities alternative trading system as a key development.
Noch described the structure as closer to a “2.0” market shift, where custody and settlement would remain anchored to the DTCC, while trading would comply with National Best Bid and Offer requirements.
Magazine: How to fix suspected insider trading on Polymarket and Kalshi

crypto ranks last with US voters

Lizzo Rejects Settlement As Case Drama Deepens
The dreams of an iPhone-rivaling face unlock on the Pixel 11 might as well be dead
Manchester United reach agreement with Casemiro over contract clause amid transfer speculation

US brings back mandatory military draft registration

Steven Gerrard disagrees with Gary Neville over ‘shock’ Chelsea and Arsenal claim | Football


-

 Fashion6 days ago
Kylie Jenner’s KHY Enters a New Era with ‘Born in LA’
-

 Business6 days ago
Most Commercial Energy Audits Miss the Real Losses
-

 NewsBeat1 day ago
Channel 5 – All Creatures Great and Small series 7 new post
-
 Tech3 days ago
Trump’s 25% EU auto tariff breaches Turnberry Agreement that also covers semiconductors and digital trade
-

 Crypto World6 days ago
CFTC’s AI will review U.S. crypto registration applications, chairman tells CoinDesk
-
 Sports3 days ago
Paul Scholes issues Marcus Rashford reality check as agreement emerges over Man United star
-

 Business6 days ago
Barclay Brothers Avoid Bankruptcy: HSBC Drops High Court Petitions After IVA Deal
-
 Business5 days ago
Tesla Officially Registers Elon Musk’s Stock: What Investors Need to Know
-
Crypto World7 days ago
Robinhood Phishing Scam Exploits Gmail Dot Feature to Bypass Security
-

 Tech6 days ago
Get Ready for More Brain-Scanning Consumer Gadgets
-

 Crypto World7 days ago
Gmail Dot Trick Underpins Robinhood Phishing, Sending Real-Looking Emails
-

 Entertainment7 days ago
Michael Jackson’s Biopic Excluded Abuse Allegations For $25M
-

 Business4 days ago
Two Powerball Tickets Split $143 Million Jackpot in Indiana and Kansas
-

 Tech5 days ago
Texas Instruments made a new flagship graphing calculator: the TI-84 Evo
-

 Business7 days ago
Superdry co-founder accused of raping woman
-
 Crypto World4 days ago
CoreWeave (CRWV) Stock Climbs 8% Despite $45M Insider Share Dump
-
 Crypto World7 days ago
ETH Triple Top Rejects $2.4K As Analysts Flag Weakness Against BTC
-

 Crypto World7 days ago
Will Ethereum hold $2,300 or slip lower from here?
-

 Business7 days ago
Outsourced IT Support vs Internal Teams: A Complete Guide
-

 Entertainment7 days ago
How A Fantasy Flop Finally Found Success On HBO Max
You must be logged in to post a comment Login