

Crypto World
Bitcoin Bounces Back Mildly After Iran Conflict Sends Crypto Markets into a Sharp Sell-Off

TLDR:
- Bitcoin dropped 3.8% to nearly $63,000 after joint US-Israel strikes on Iran rattled crypto markets on Saturday.
- The total crypto market shed $128 billion in minutes, triggering forced liquidations across digital asset exchanges.
- Bitcoin ETF inflows totaling $1 billion over three sessions last week are now the key metric traders are watching closely.
- Call options concentrated at $75,000 on Deribit suggest traders are positioning for a recovery ahead of the Fed meeting.
Bitcoin staged a tepid recovery on Sunday as geopolitical tensions rattled investor confidence. Joint US and Israeli strikes on Iran triggered a sharp sell-off on Saturday.
The total crypto market lost $128 billion in value within minutes. Traders are now watching for a confirmed bottom before committing to a stronger position.
Market Reacts Sharply to Geopolitical Escalation
Digital assets fell quickly after news broke of the joint US-Israel military campaign on Saturday. Bitcoin dropped as much as 3.8%, briefly touching nearly $63,000 during the session.
The rapid decline forced cascading liquidations across the broader crypto market. Data from CoinGecko confirmed the $128 billion wipe across the total crypto market capitalization.
Hayden Hughes, managing partner at Tokenize Capital, weighed in on the speed of the sell-off. “Over $128 billion wiped in minutes, forced liquidations cascaded, and once that selling exhausted itself, the reflex bounce was mechanical,” Hughes said.
Iran followed with counterstrikes targeting Israel, Qatar, the UAE, and Bahrain. Threats against US-linked bases in Iraq added further pressure to market sentiment.
Hughes also flagged Monday’s US equity market reopening as the defining moment for crypto. “The real price discovery happens Monday when US equity markets and Bitcoin ETFs reopen,” he noted.
“With missiles hitting Dubai, Iranian retaliation across the Gulf, and Strait of Hormuz closure risk, this is not a contained event,” he added. Last week saw $1 billion in inflows over three consecutive sessions in spot Bitcoin ETFs.
Hughes further warned that a reversal of ETF inflows could push Bitcoin below $63,000. Bitcoin ETF flows will be “the single most important number to watch,” he stated.
Put options worth $1.87 billion were concentrated at the $60,000 strike on Deribit. That concentration signals persistent demand for downside protection among traders.
Meanwhile, $529 million in contracts were traded on Polymarket around the timing of a US strike. That activity shows how closely crypto markets tracked the geopolitical situation throughout the weekend.
Traders Position for Recovery Ahead of Fed Meeting
Bitcoin rose as much as 2.2% to $68,196 on Sunday after Iran confirmed the death of Supreme Leader Ayatollah Ali Khamenei.
The bounce was short-lived, with prices pulling back to around $67,000 by 7:30 a.m. London time. Still, some market observers viewed the mild recovery as a constructive signal. Traders appeared to be looking past the Iran turmoil in early positioning.
Markus Thielen, head of research at 10x Research, pointed to growing optimism among options traders. “Traders generally don’t expect the Iran conflict to have major negative economic consequences, and demand for upside Bitcoin calls has clearly picked up in recent days,” Thielen said.
Bitcoin call options were concentrated around the $75,000 strike level on Deribit. Traders were also factoring in positioning ahead of the upcoming Federal Reserve meeting.
Richard Galvin, co-founder of Digital Asset Capital Management, offered a measured read on Saturday’s price action.
The US attack was, to a large extent, already factored in by traders who “used the weakness as a buy-the-dip or close-their-shorts opportunity,” Galvin said.
That behavior reflects a calculated response rather than panic selling. The coming sessions will clarify whether the recovery holds any real conviction.


Leading bitcoin treasury company Strategy has again raised the dividend on its STRC (“Stretch”) preferred series.
Led by Executive Chairman Michael Saylor, the firm lifted the annualized payout by 25 basis points to 11.5%.
While STRC to this point has performed as hoped by the company — continuing to trade in a tight range close to $100 — Strategy’s common stock, MSTR, has floundered alongside the price of bitcoin.
MSTR closed February with its eighth consecutive monthly decline, falling 14% as bitcoin tumbled nearly 20%.
Stretch is meant for steady income
Strategy describes STRC as a short-duration, high-yield savings account. This latest dividend increase marks the seventh since STRC began trading in July 2025.
A perpetual preferred stock that pays monthly cash distributions, the STRC dividend rate is set each month to help the shares trade close to their $100 par value and to limit price volatility. STRC closed at $100 on Friday but had traded somewhat below that level during part of February’s brutal month for crypto, necessitating the payout boost.

Bitcoin held a steady line through a weekend marked by geopolitical flare-ups in the Middle East, easing some of the stress that had rippled through risk assets. The benchmark cryptocurrency kept its bearings around the mid-to-high $60,000s as traders weighed potential supply disruptions, oil price volatility, and the staying power of traditional markets. While the narrative around the Strait of Hormuz and regional tensions added a geopolitical layer to the narrative, Bitcoin and broader crypto markets avoided a sudden breakout, instead trading in a relatively tight corridor as weekend liquidity faded and futures markets prepared for the Monday open.
Key takeaways
- Bitcoin started the week near $67,000 after a volatile weekend, with traders watching how U.S. markets would react to ongoing regional tensions.
- Trading data pointed to a lingering focus on a notable CME futures gap at $65,880, a potential “fill” area that could influence short-term moves.
- Oil-price risk rose as Tehran signaled actions around the Strait of Hormuz, raising concerns about inflationary pressures and their potential impact on risk sentiment.
- Analysts offered mixed views: some described the initial response as positive, while others warned that the market could drift until macro catalysts clear, including the U.S. opening and inflation data.
- The crowd of strategists and traders continues to eye a possible relief rally if Bitcoin can reclaim momentum above critical moving-average levels and push toward the high-$70,000s range.
Tickers mentioned: $BTC
Sentiment: Neutral
Price impact: Neutral. Price action remained range-bound despite regional tensions and a looming data calendar.
Trading idea (Not Financial Advice): Hold. Monitor the Monday open and the CME gap as liquidity returns to the market.
Market context: The weekend period saw traditional markets digesting geopolitical headlines as traders awaited U.S. opening dynamics and inflation-related data. Early signs showed U.S. stock futures down roughly 0.65% as traders braced for potential volatility once liquidity returned to normal levels, underscoring a cautious risk-on environment for crypto assets as well.
Why it matters
Bitcoin’s behavior in the wake of regional turmoil underscores how the asset class often behaves as a macro sponge—quick to absorb risk-off impulses and slower to trend during periods of mixed signals. The tension around the Strait of Hormuz and the broader Middle East flare-up adds a persistent inflationary lens to the discussion. Oil markets, which frequently respond to geopolitical headlines, can—by extension—spark concerns about energy costs feeding into consumer prices. A notable moment referenced by market observers is the potential for inflation to surprise to the upside, a scenario some analysts say could lift traditional hedges or drive risk assets into a different regime.
On the technical front, traders highlighted Bitcoin’s proximity to a key moving-average level as a potential fulcrum. The 21-day simple moving average, an often-watchful gauge for short- to mid-term momentum, sat near a critical threshold that, if breached, could accelerate a relief rally. Observers like Michaël van de Poppe framed the setup in a nuanced way, noting that while the initial reaction to weekend events looked “positive,” markets needed to clear the CME gap and establish a higher low before committing to a sustained move higher. This view aligns with a broader narrative that price action over the next few sessions could depend as much on opening prints in the United States as on any headline flow from abroad.
“On the other hand, the 21-Day MA needs to break in order to have a relief rally. I think we’ll see it in March/April, question of how we’re opening the markets tomorrow and whether it finds a higher low.”
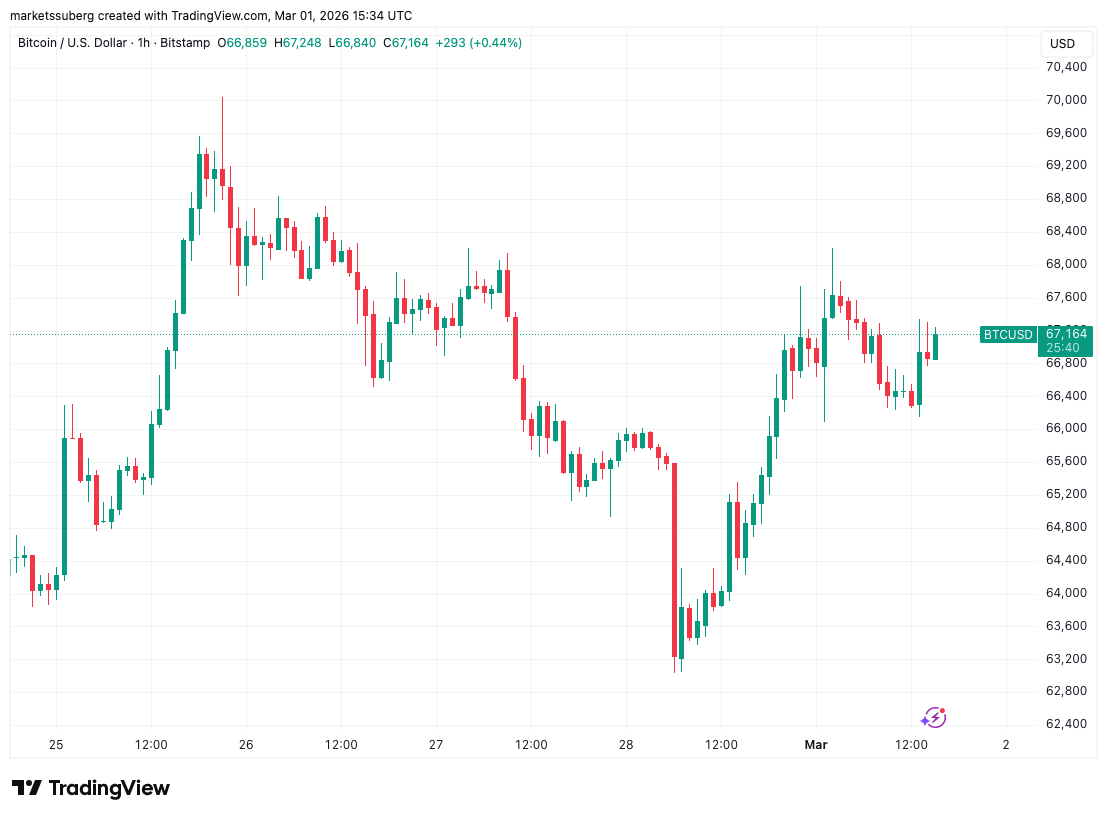
Data from TradingView tracked BTC/USD action as traders focused on the $67,000 region after the weekend’s headlines, painting a picture of a market waiting for a catalyst to push beyond a short-term ceiling. The absence of a decisive breakout did not surprise all participants, given the complexity of the macro backdrop and the potential for a “gap fill” scenario as futures markets settle into Monday’s session. A number of technicians agreed that a break above the immediate resistance zone could set the stage for a move toward the $73,000–$74,000 zone, underscoring how volatile macro drivers can unfold into a structured technical chase for price targets in the near term.
Beyond the chart, the weekend narrative included other voices pointing to why a breakout could be delayed. Some market participants argued that geopolitical risk had already been priced in to an extent, with the market absorbing headlines and awaiting a clearer signal from U.S. policy and data releases. Crypto traders—who often weigh cross-asset correlations—emphasized that the next few sessions would likely hinge on how traditional markets respond when liquidity returns and whether risk appetite recovers or remains cautious. “We will probably move sideways in the next days,” reasoned another active trader, highlighting the ongoing balance between geopolitical risk and macro resilience.
The macro overlay extended to inflation concerns. The Kobeissi Letter’s thread, drawing on JPMorgan research, suggested the possibility of a fresh inflation spike that could push the U.S. Consumer Price Index higher—potentially around 5%—a development that would feed into both equity and crypto dynamics. This thread arrived in the context of recent U.S. inflation prints that had already surprised to the upside, notably with the latest Producer Price Index data underscoring that the floor for inflation might be sticky rather than easily transitory. In parallel, market observers referenced Bitcoin’s historical dynamics—such as metrics that point to elevated longer-horizon returns in certain cycles—to anchor expectations for how BTC might respond as macro conditions evolve. A related discussion on a widely cited price metric is available in a Cointelegraph piece that linked to a longer-term pattern, illustrating how historically prolonged uptrends have unfolded in response to regime changes in inflation and liquidity.
As the weekend wound down, a chorus of voices underscored the nuances of the setup. Crypto influencers and traders reminded audiences that headlines alone rarely deliver a sustained move; instead, the probability of a meaningful rebound depends on the confluence of technical breakouts, macro data, and the opening tone of U.S. markets. The crosswinds—from geopolitical tensions to inflation risk—mean Bitcoin’s path may be less about a single trigger and more about a sequence of catalysts aligning in the weeks ahead.
What to watch next
- Monday open: observe whether U.S. equities’ early direction validates or contradicts the weekend narrative, particularly as the CME gap at 65,880 remains a potential target for a fill.
- BTC price action around 67,000: monitor if the asset can hold this level or accelerate toward the upper target near 73,000–74,000 based on momentum signals and moving-average dynamics.
- Oil and inflation linkage: track oil price movements and any fresh inflation data releases that could reframe risk sentiment and liquidity expectations.
- Futures and liquidity cycles: pay attention to how liquidity returns in the coming days and whether any new macro surprises push risk assets into a fresh regime.
- Geopolitical headlines: continue to monitor developments around the Strait of Hormuz and broader regional tensions, as these could reintroduce volatility into risk assets and affect hedges like BTC.
Sources & verification
- Trading view data showing BTC price activity around $67,000 after the latest Middle East events (TradingView).
- Discussion and charts cited by Michaël van de Poppe on X about the 21-day moving average and potential resistance turned support levels.
- Market commentary on the CME futures gap at $65,880 and its potential relevance to near-term price action.
- References to inflation risk and CPI considerations from JPMorgan-linked discussions in the Kobeissi Letter thread (KobeissiLetter).
- Cointelegraph coverage linking to inflation data and the broader macro narrative surrounding Bitcoin’s historical performance in higher-inflation regimes (Cointelegraph).
- Bitcoin historical price metric references and longer-term return discussions (Bitcoin historical price metric …).
- Direct posts from market participants on X offering perspectives on near-term price trajectories (Michaël van de Poppe, BitBull, Crypto Caesar).
Bitcoin steadies as geopolitical tensions test risk appetite
Bitcoin (CRYPTO: BTC) threshold dynamics dominated the narrative as regional headlines intersected with macro data expectations. The asset’s late-week price action found support near the $67,000 level, consistent with a broad risk-off-to-risk-on tug-of-war that markets have navigated throughout the weekend. While some participants argued that a relief rally could unfold if momentum gathers and key moving-average levels break, others emphasized the need for a clear bullish trigger—one that could come from a favorable Monday open or a cooling of inflation concerns. The combination of a cautious open from U.S. equities and a disciplined approach to risk deployment shaped the tone for the early week, with traders eyeing a potential test of the CME gap and a move toward higher targets if liquidity and sentiment cooperate.
Trading data pointed to ongoing technical work in BTC’s near-term chart. The 21-day moving average, a key reference for many short-term traders, sits at a level that many watch as a potential springboard for momentum. As one veteran analyst noted, decisive action above that threshold could catalyze a more pronounced move, while a failure to gain traction could prolong a consolidative phase. In parallel, market observers highlighted the role of the CME’s futures market in shaping intraday risk, with the gap below the current price acting as a potential magnet for price action if markets shift into risk-on mode.
The macro backdrop—particularly inflation dynamics and energy-price volatility—adds a layer of complexity to Bitcoin’s trajectory. The Strait of Hormuz could become a focal point for oil markets, and any supply concerns tend to reverberate through inflation expectations and risk sentiment. Analysts who have studied post-crisis price cycles note that inflation shocks can align with crypto cycles in nuanced ways: liquidity remains a critical piece, but the direction of flow—whether into crypto as a hedge or as an alt-risk asset—depends on how investors digest the evolving macro picture. In this context, Bitcoin’s price range-bound behavior over the weekend can be seen as a reflection of a market seeking a credible catalyst rather than chasing headlines.
As market participants refine their models for the week ahead, the broader takeaway is that Bitcoin’s near-term path will hinge on a confluence of factors: a measured Monday opening, the pace at which the CME gap closes, and any renewed guidance from inflation and energy data. The dynamics suggest a market that might remain cautious until a clearer signal coalesces, even as some voices project a path toward the $73,000–$74,000 zone should momentum swing in BTC’s favor. The coming days will reveal whether the technical setup can convert into a sustained trend or whether traders revert to a wait-and-see posture in response to macro uncertainty.


XRP went through intense volatility on Saturday, but it had nothing to do with the ETFs.
Although they have ended the underwhelming zero-inflow-day streak, the spot XRP ETFs are still far away from their initial glory in terms of net inflows.
At the same time, the underlying asset continues to fight with BNB for the fourth spot in the cryptocurrency market cap ranking, but it sits inches below a crucial resistance.
Ripple ETF Inflows Still Missing
CryptoPotato has reported on several occasions on the diminishing activity on the XRP ETF front. The financial vehicles saw under $8 million in net inflows during the trading week that ended on February 13, and less than $2 million in the following one. Moreover, it had three days with zero inflows during this time, a streak that extended to February 23.
However, investors finally picked up the pace in the next four trading days, albeit in a very modest manner. The net inflows stood at $3.04 million on Tuesday, $3.09 million on Wednesday, $1.22 million on Thursday, and $2.21 million on Friday. Overall, the week ended in the green, with $9.55 million entering the funds.
This modest amount is in stark contrast to the initial boom. After the first XRP-focused ETF went live for trading in mid-November, investors were rushing to pour funds into it and the four more such products that followed. Consequently, the cumulative net inflows skyrocketed to the $1 billion mark within a month since Canary Capital’s XRPC saw the light of day.
Since then, though, the trend has seemingly changed. The total net inflows stand at $1.24 billion now, which means that only $240 million has entered the funds in over two months.
XRP Fights BNB
Saturday was an eventful day in the crypto markets due to the strikes against Iran and the subsequent retaliation. XRP was not immune as it dumped from $1.43 to $1.27 before it rebounded to its starting point after reports that Iran’s Supreme Leader was killed during the attacks.
You may also like:
Popular crypto analyst CryptoWZRD noted that the asset had closed with a “dragonfly doji candle and respected the $1.30 daily support.” They believe XRP could continue higher only if it manages to close weekly above $1.3820. As of press time, the asset trades inches below that line. However, it has retaken its fourth place in terms of market cap from BNB after a quick flip on Saturday.
XRP Daily Technical Outlook:$XRP closed with a dragonfly doji candle and respected the $1.3000 Daily support. However, anything is possible due to geopolitics. Tomorrow is the Weekly transition. Above the $1.3820 resistance it can push higher if the breakout remains stable 😈 pic.twitter.com/YJaJyp0DTt
— CRYPTOWZRD (@cryptoWZRD_) March 1, 2026
Binance Free $600 (CryptoPotato Exclusive): Use this link to register a new account and receive $600 exclusive welcome offer on Binance (full details).
LIMITED OFFER for CryptoPotato readers at Bybit: Use this link to register and open a $500 FREE position on any coin!

Bitcoin price continues to trade under sustained pressure, struggling to reclaim the $70,000 level. BTC remains capped by a persistent downtrend that has limited upside attempts for weeks.
Historical cycle data and current on-chain signals suggest that bearish conditions may not be over. While short-term rallies occur, structural indicators imply that Bitcoin could remain constrained below $70,000.
Bitcoin’s Past Says Pressure Persists
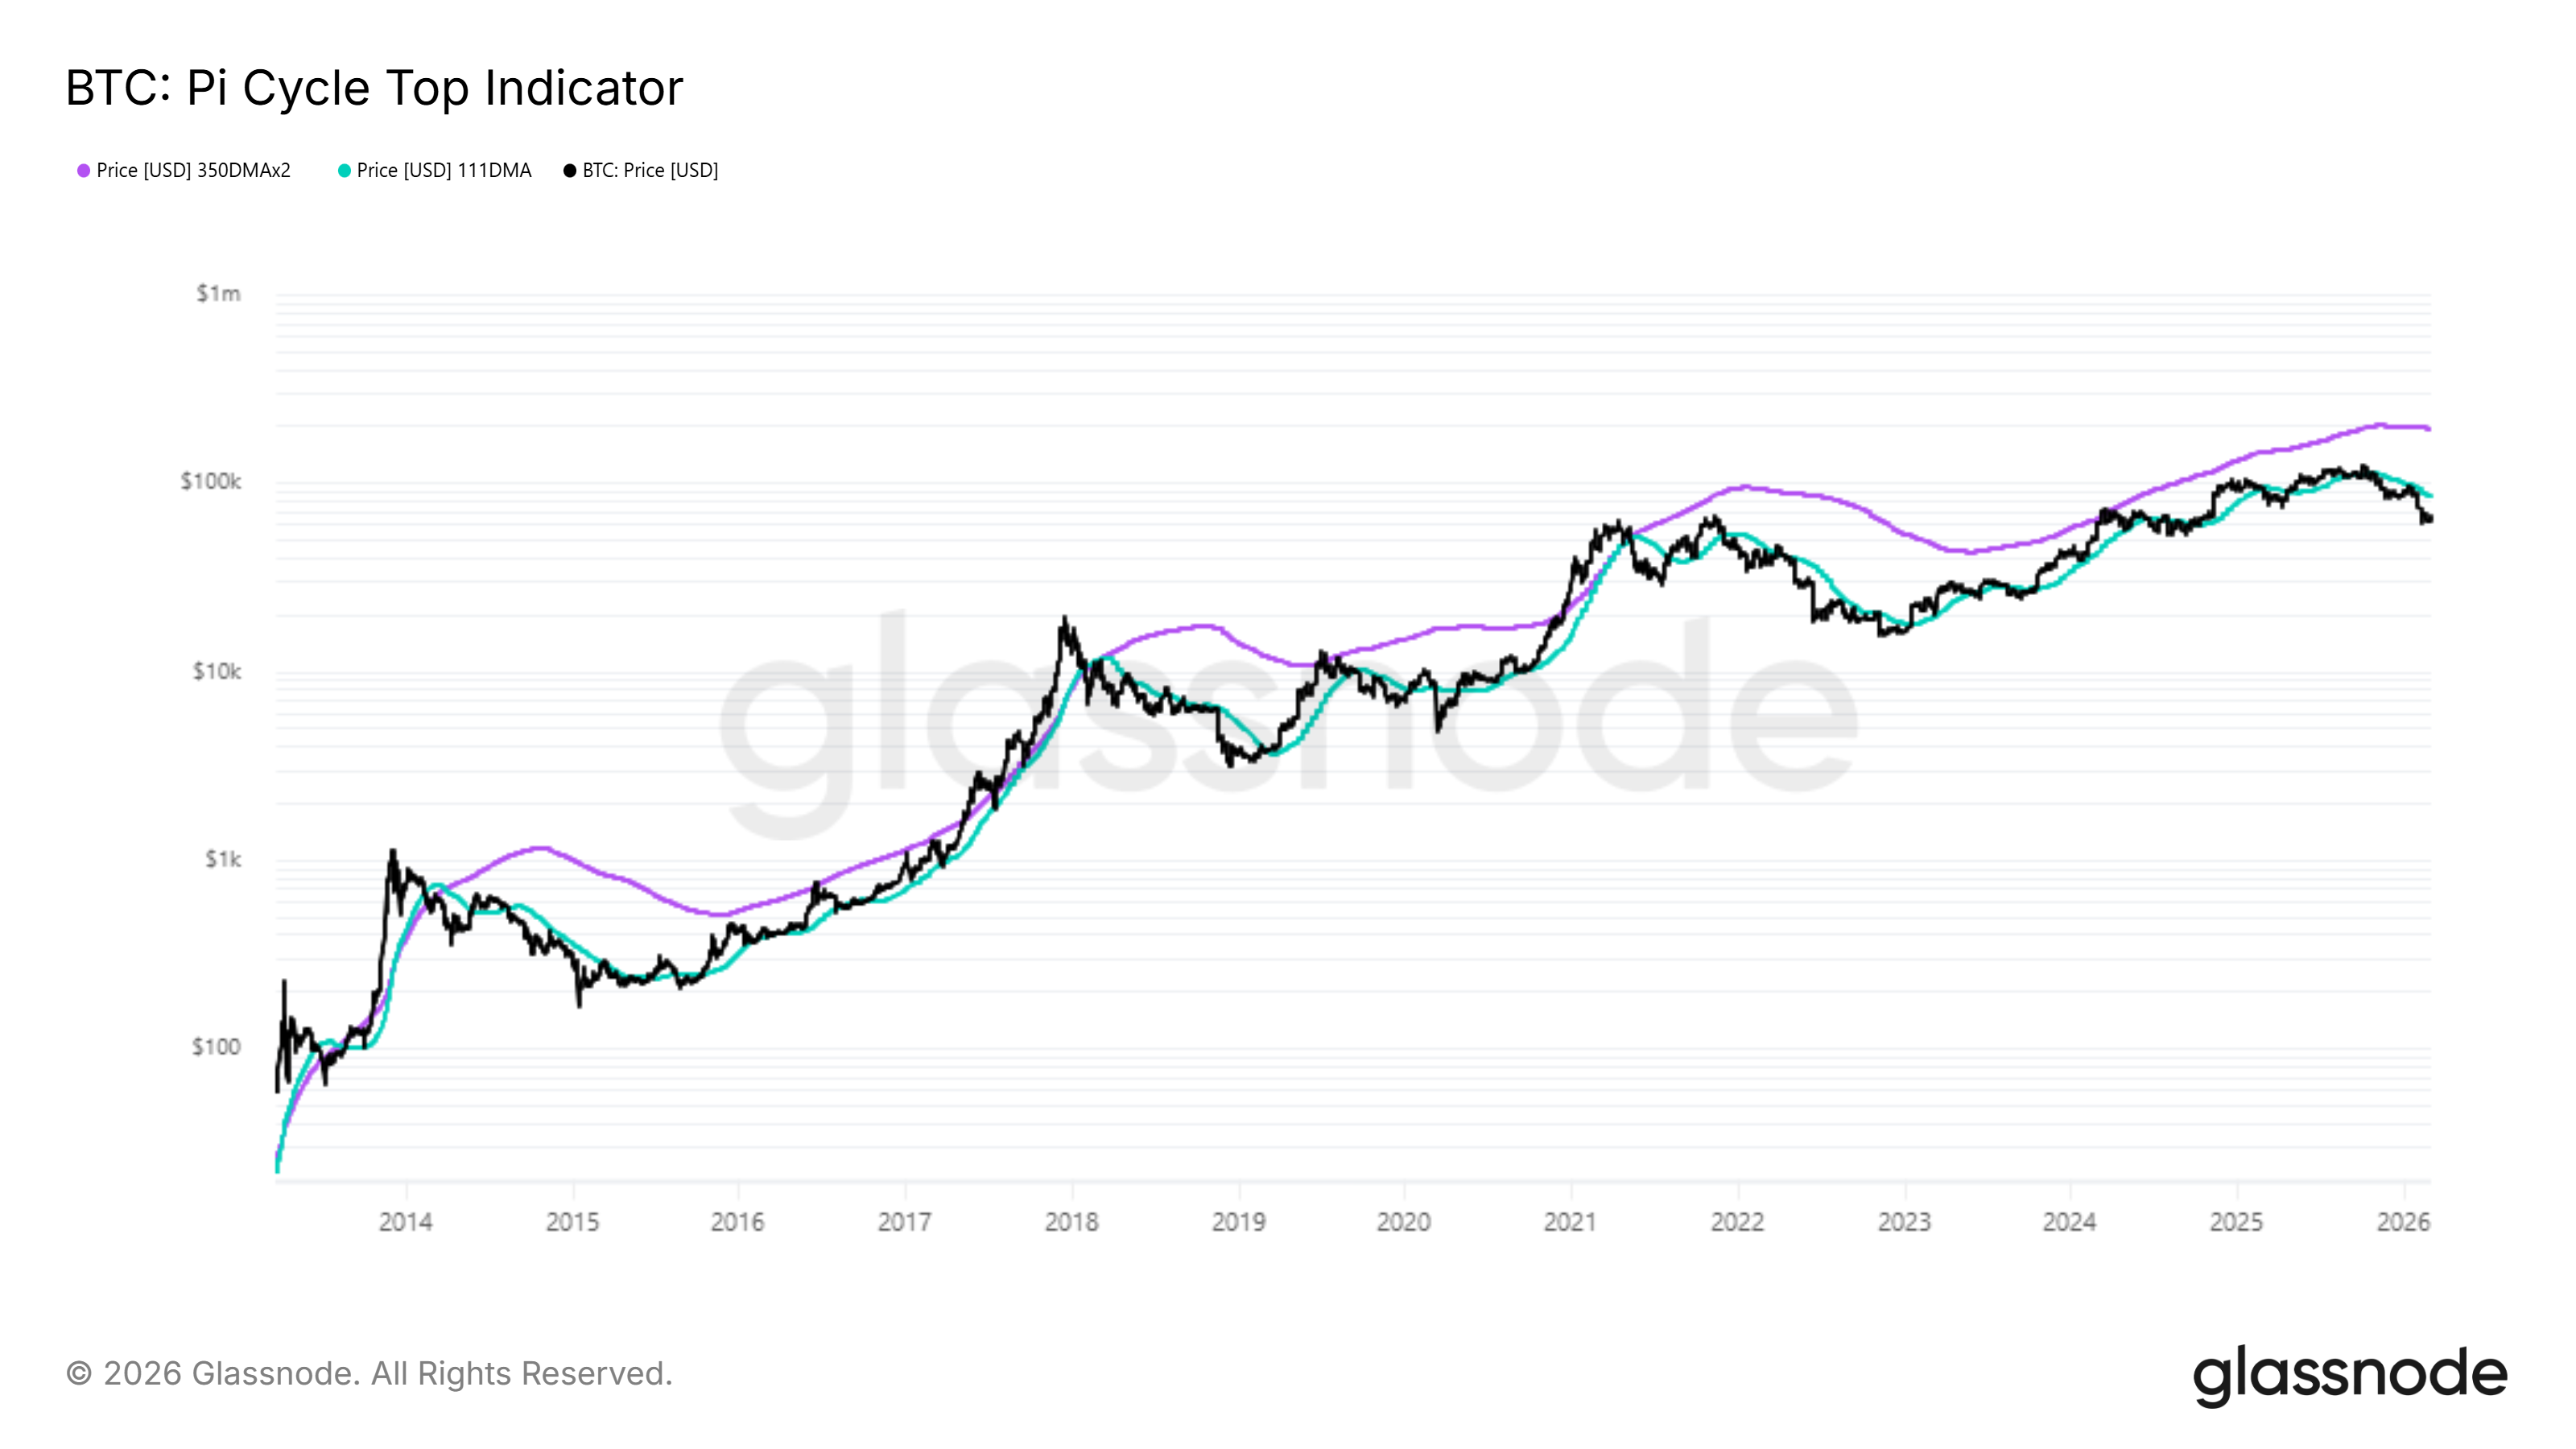
The Pi Cycle Top Indicator provides important context for Bitcoin’s current phase. This metric uses the 111-day moving average and a two-times multiple of the 350-day moving average. When these averages converge, the market is considered overheated.
Conversely, when the moving averages diverge widely, the asset is often viewed as undervalued. In the present cycle, Bitcoin does not exhibit either extreme. Instead, it appears positioned at the midpoint of a broader bearish phase.
Historically, mid-cycle bearish periods within Bitcoin’s four-year cycle have lasted a year or longer. Similar structures in past cycles kept BTC suppressed before the eventual recovery.
Current divergence between the 111 SMA and the 350 SMA x2 suggests continued bearishness rather than recovery.
Want more token insights like this? Sign up for Editor Harsh Notariya’s Daily Crypto Newsletter here.
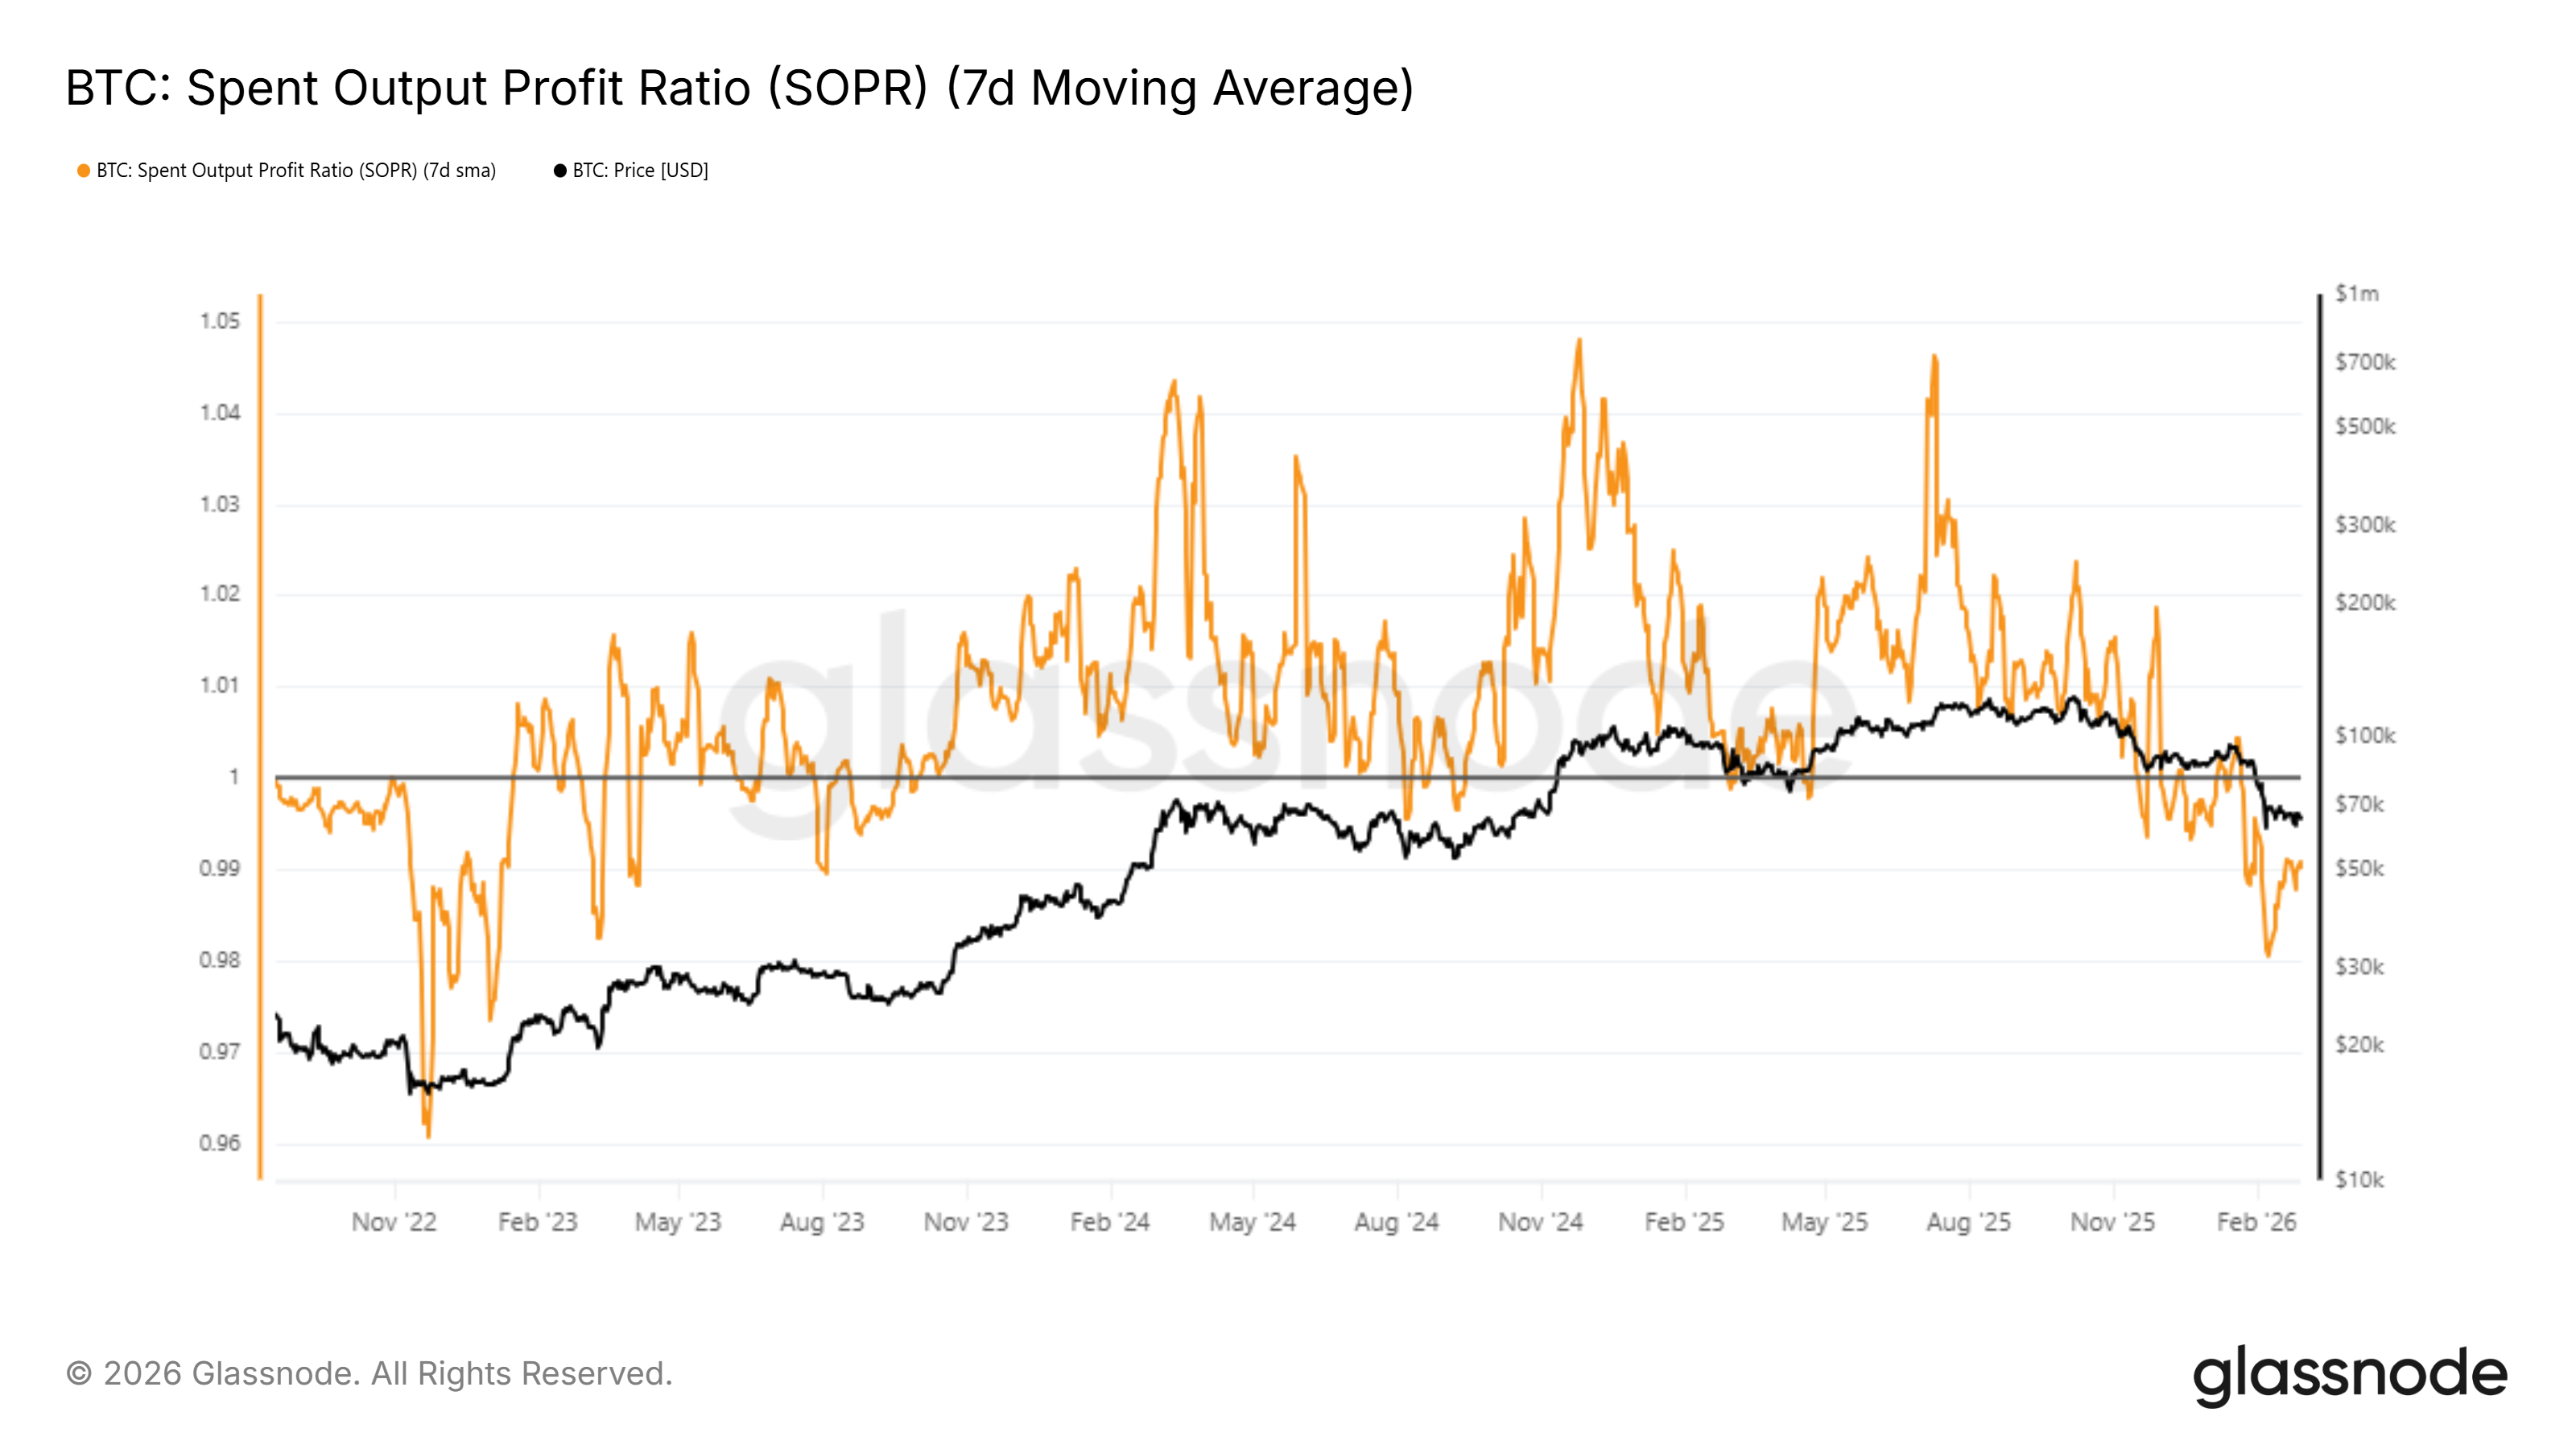
The Spent Output Profit Ratio further reinforces the cautious outlook. SOPR remains below the critical 1 level, signaling that many investors are selling at a loss. Persistent readings under 1 indicate limited profitability across market participants.
This dynamic suppresses recovery attempts. Bitcoin investors selling at a loss often reflect fear-driven behavior. Until SOPR consistently moves above 1, the Bitcoin price may struggle to build sustainable upside momentum.
BTC Price Downtrend Continues
Bitcoin is trading at $66,443 at the time of writing, still confined under a descending resistance line active for nearly a month. Repeated failures to break above this barrier highlight ongoing weakness. Without stronger buying pressure, BTC may remain trapped beneath this trendline.
The Money Flow Index shows active selling pressure. MFI readings indicate capital outflows continue to dominate inflows. Global macro uncertainty and geopolitical tensions are amplifying risk aversion. This environment encourages cautious positioning and limits aggressive accumulation.
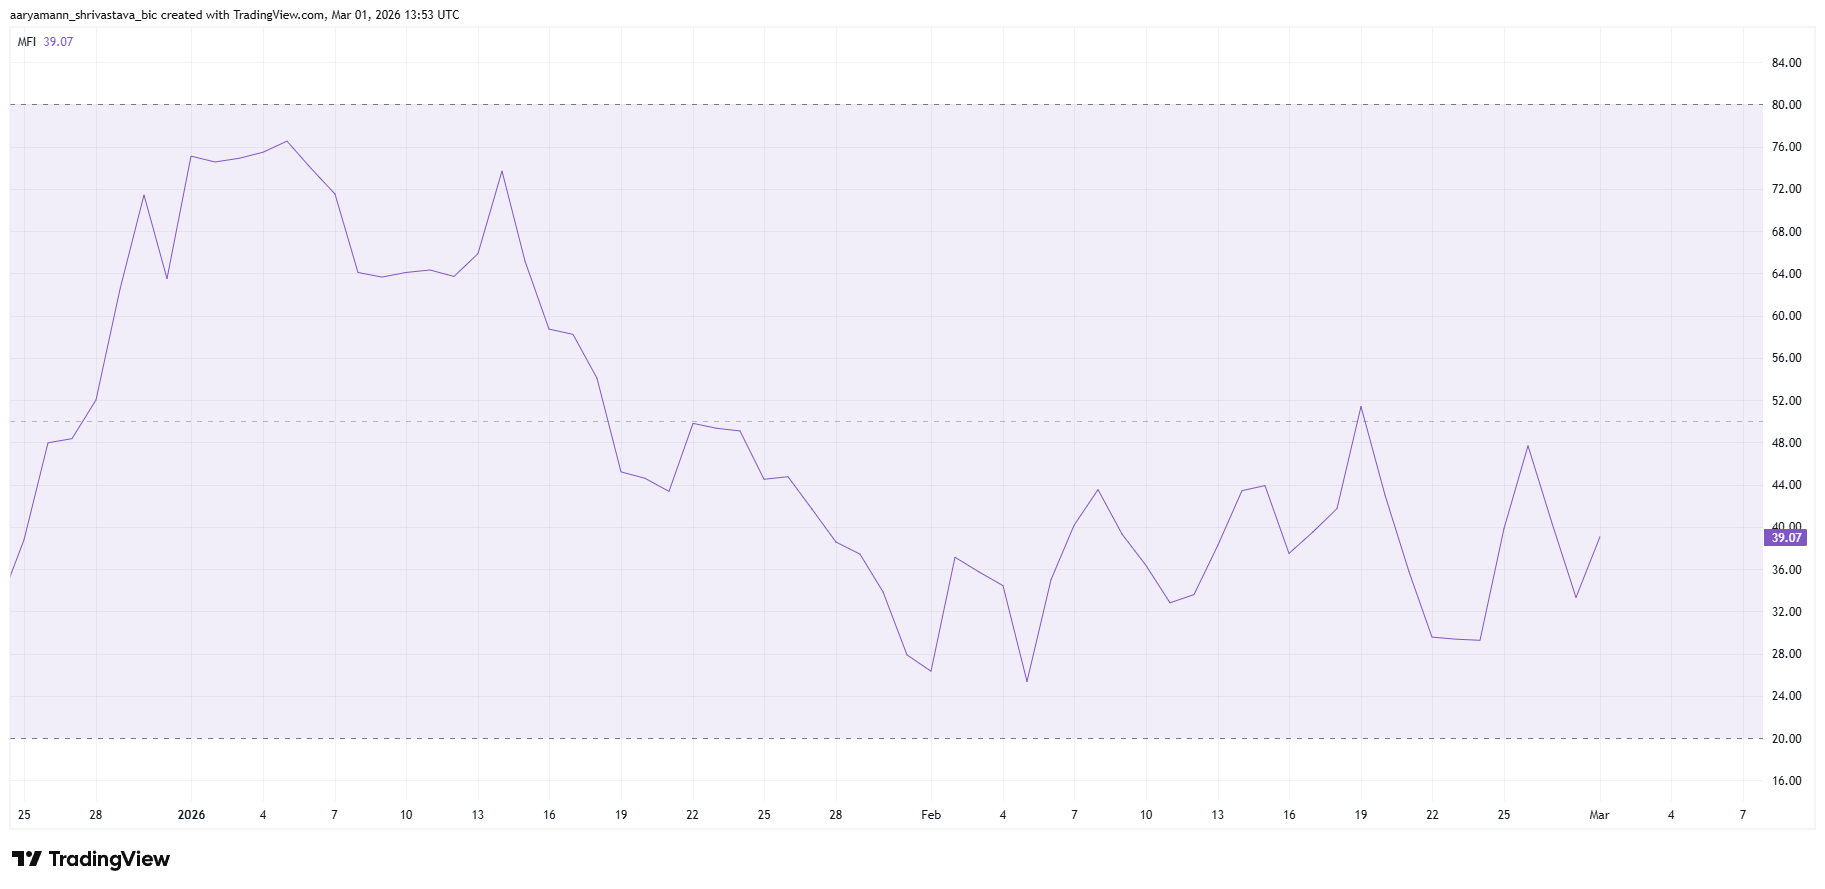
Given these conditions, the Bitcoin price could continue oscillating within a constrained range. A break below $65,000 would likely expose the $62,893 support. That level has already been tested twice this week, increasing vulnerability if selling intensifies.
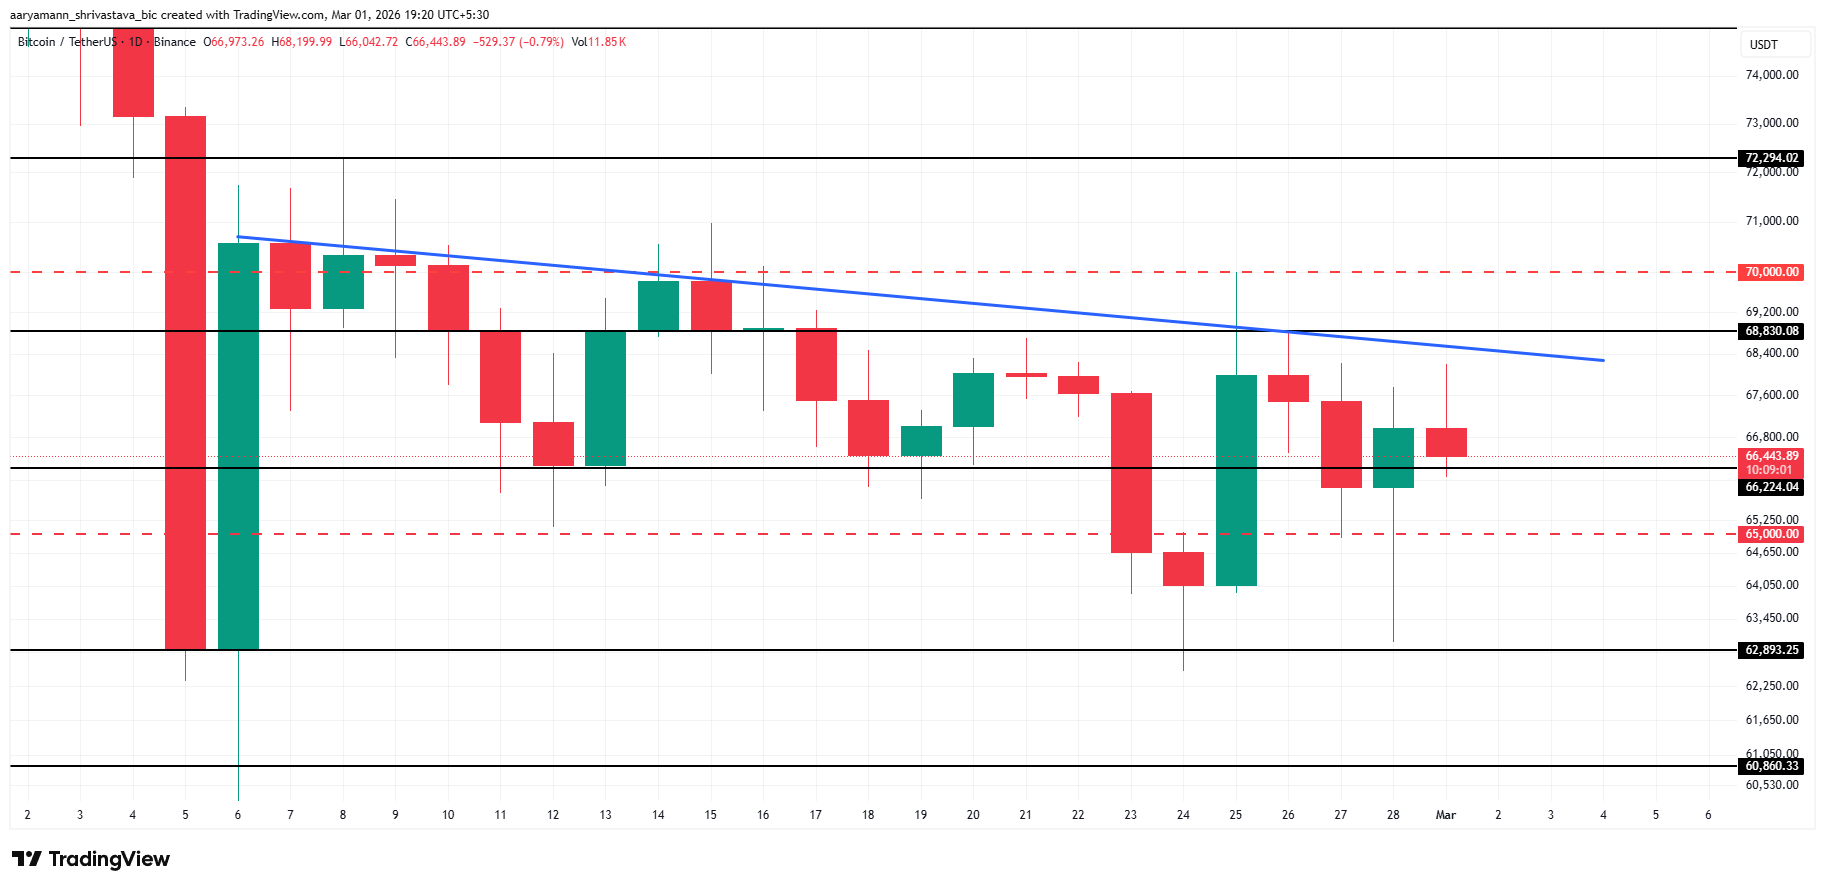
However, a shift in macro sentiment could alter the trajectory. If Bitcoin holds the $66,224 support and attracts fresh inflows, it may challenge $68,830 resistance.
A decisive move above $70,000 would invalidate the current bearish thesis and signal renewed structural strength.
Bitcoin avoided a fresh breakdown around major geopolitical events in the Middle East, with BTC price targets now including $74,000 next.
Bitcoin (BTC) ignored geopolitical volatility on Sunday as traders waited for markets’ Iran reaction.
Key points:
-
Bitcoin coils around $67,000 as the dust settles on a wild weekend in the Middle East.
-
TradFi market reactions are in focus, with BTC price action avoiding major volatility.
-
Oil price concerns compound as Iran seeks to close the Strait of Hormuz.
Trader sees $74,000 BTC price rally
Data from TradingView showed BTC price action focusing on $67,000 in the aftermath of the latest round of conflict in the Middle East.

The weekend prevented TradFi markets from adjusting to events in real time, with US stock market futures down 0.65% at the time of writing.
Crypto also saw volatility, but soon cooled, and BTC/USD avoided a major breakout from its local trading range.
Commenting, crypto trader, analyst and entrepreneur Michaël van de Poppe described the initial response as “positive.”
“Now, markets are correcting back down, as there’s uncertainty on how US markets will open tomorrow (and there’s still an outstanding gap of the CME),” he wrote in a post on X.
“On the other hand, the 21-Day MA needs to break in order to have a relief rally. I think we’ll see it in March/April, question of how we’re opening the markets tomorrow and whether it finds a higher low.”

Van de Poppe referred to Bitcoin’s 21-day simple moving average at $67,627. The weekend’s “gap” in CME Group’s Bitcoin futures market lay to the downside at $65,880.
“$BTC looks good in the short-term,” trader BitBull agreed about the three-day chart.
“Deviation below the support zone and has now flipped resistance into support. I think a rally towards the $73K-$74K level could happen.”

Some argued that geopolitical instability had been “priced in” by the market in advance, explaining the comparatively modest price action over the weekend.
“We will probably move side ways the next days…,” trader Crypto Caesar concluded.

Strait of Hormuz tied to next US inflation spike
A separate point of concern focused on potential oil price volatility as Iran claimed to be closing the Strait of Hormuz.
Related: Bitcoin historical price metric sees $122K ‘average return’ over 10 months
Despite being international waters, the Strait became a holding ground for oil shipping on Sunday, leading to swift analysis of the knock-on effect for US inflation.
Trading resource The Kobeissi Letter referenced research by JPMorgan while suggesting that the Consumer Price Index (CPI) could jump to 5%.
“The last time we saw US inflation at 5% was in March 2023, when the Fed was aggressively hiking rates,” it wrote in a dedicated X thread.

As Cointelegraph reported, recent US inflation prints outpaced expectations, notably Friday’s Producer Price Index (PPI) numbers.
This article does not contain investment advice or recommendations. Every investment and trading move involves risk, and readers should conduct their own research when making a decision. While we strive to provide accurate and timely information, Cointelegraph does not guarantee the accuracy, completeness, or reliability of any information in this article. This article may contain forward-looking statements that are subject to risks and uncertainties. Cointelegraph will not be liable for any loss or damage arising from your reliance on this information.


Crypto exploits declined by more than 90% in February, with digital asset thieves siphoning just $35.7 million across the ecosystem.
The sharp decline marks the quietest month for crypto security since March 2025, providing a brief reprieve for a sector routinely battered by nine-figure hacks.
Phishing and Oracle Attacks Linger Despite the Sharp Fall in Crypto Theft
Data compiled by blockchain security firm CertiK revealed a drastic month-over-month drop from January’s staggering losses.
Meanwhile, the figures also represent a massive year-over-year contraction. Last year’s February was dominated by a historic $1.5 billion exploit on the Bybit exchange, an anomaly that heavily skewed annual security metrics.
Despite the broader market slowdown in illicit activity, targeted attacks still drained millions from decentralized finance protocols.
The single largest crypto exploit incident occurred on February 22 on the Stellar network.
According to Quill Audits, a hacker exploited the community-managed YieldBlox Blend pool. The attacker stole more than $10 million through a classic thin-liquidity oracle manipulation attack.
By executing a single abnormal trade in the highly illiquid USTRY/USDC market, the attacker artificially inflated the token’s price by a factor of 100.
This tricked the protocol’s valuation system, allowing the attacker to execute massive undercollateralized borrowing.
A day earlier, on February 21, the Internet-of-Things blockchain project IoTeX suffered a major breach after a private key was compromised.
While CertiK estimated the losses at nearly $9 million, the IoTeX team claimed the stolen amount was closer to $2 million.
Security researchers noted the attacker used the compromised key to access the token safe, quickly swapped the stolen assets for ETH and routed them to Bitcoin using cross-chain bridges.
Rounding out the top three was a $2.2 million exploit of Foom.Cash, a privacy protocol.
In this attack, the hacker reportedly exploited a cryptographic flaw to forge zkSNARK proofs. This allowed them to create fake digital credentials that the protocol accepted, enabling the withdrawal of large volumes of tokens.
Crypto Phishing Attacks Remain a Concern
Beyond smart contract vulnerabilities, phishing remains a persistent threat, accounting for exactly $8.5 million of February’s total losses.
The crypto phishing sector has flourished recently, driven by the rise of professionalized “drainer-as-a-service” providers like Angel Drainer and Inferno Drainer.
These platforms allow scammers to execute large-scale malicious operations with minimal technical expertise. They provide fraudsters with a complete toolkit, including cloned websites, deceptive social media accounts, and automated smart contract scripts.
In exchange for providing this illicit infrastructure, the operators take a percentage of all stolen funds.


In this week’s edition of the weekly recap, Bitcoin fell to $63,062 before recovering following explosive strikes in Tehran amid U.S.-Israel operations and Iranian retaliatory missiles.
Summary
- Bitcoin fell to $63K on Tehran strike news before rebounding above $66K.
- DOJ arrested Goliath Ventures founder over alleged $328M Ponzi scheme.
- MetaMask launched its self-custodial crypto card across the U.S.
In other prominent news, federal authorities arrested Goliath Ventures founder Christopher Alexander Delgado on charges related to an alleged $328 million Ponzi scheme, and MetaMask partnered with Mastercard to launch its self-custodial payment card across the United States.
Cryptocurrency markets react to Middle East conflict
- Bitcoin (BTC) declined to $63,062 before rebounding to $66,201 following reports of large explosions in Tehran as the United States and Israel launched coordinated strikes across Iran.
- Ethereum (ETH) dropped to $1,837 before recovering to $1,940 during the volatility spike as Iran launched retaliatory missiles at multiple locations including Israel, Qatar, the United Arab Emirates, and Bahrain.
Federal prosecutors charge crypto Ponzi operator
- The Department of Justice announced the arrest of Christopher Alexander Delgado, 34, founder and CEO of Goliath Ventures, on federal charges tied to an alleged $328 million cryptocurrency Ponzi scheme.
- Delgado was taken into custody in Apopka, Florida, on a criminal complaint filed in the United States District Court for the Middle District of Florida charging wire fraud and money laundering.
MetaMask expands crypto card to U.S. market
- MetaMask and Mastercard have officially launched the MetaMask Card in the United States.
- The self-custodial crypto payment card is now available in 49 U.S. states, including New York for the first time.
Magic Eden narrows platform focus to Solana
- The prominent NFT marketplace announced plans to close its Bitcoin and EVM-based trading platforms in early March 2026 while discontinuing support for its multi-chain wallet.
- The platform will continue supporting Solana-based assets exclusively.
MoonPay introduces AI agent wallet access
- The crypto payments platform launched February 24 a new product providing artificial intelligence systems direct access to digital wallets and on-chain transactions.
- MoonPay Agents, a non-custodial software layer, enables AI agents to create wallets, manage funds, and trade on behalf of verified users.
Morgan Stanley plans multiple Bitcoin products
- The banking giant has intentions to offer various Bitcoin-related product offerings according to digital assets strategy head Amy Oldenburg.
- These planned products would expand Morgan Stanley’s cryptocurrency exposure beyond its current limited offerings.
AI security tool identifies critical XRP vulnerability
- An autonomous AI security tool discovered a bug in the XRP Ledger that could have aided attackers to steal funds from any network account without accessing private keys.
- XRPL Labs disclosed Thursday the vulnerability existed in signature-validation logic of the Batch amendment.
- This was a pending upgrade allowing multiple transactions to be bundled and executed together.
Barclays explores blockchain payment platform
- The multinational bank is examining creation of a blockchain platform for payments and other processes according to reports
- The London-based financial services giant is consulting with prospective technology providers to develop infrastructure rivaling JPMorgan and others using decentralized technology for banking services.
Kalshi penalizes insider trading violations
- The prediction market firm disclosed catching and penalizing two users for insider-trading activity, including an editor for social media star MrBeast.
- The company stated it has over a dozen active insider-trading cases among 200 investigated, with Wednesday disclosures detailing two resolved matters including action against Artem Kaptur, identified as working for James Donaldson’s MrBeast persona.


The Office of the Comptroller of the Currency published its proposed rulemaking to regulate stablecoins under the GENIUS Act, sparking questions about whether it was banning yield payouts from crypto companies.
You’re reading State of Crypto, a CoinDesk newsletter looking at the intersection of cryptocurrency and government. Click here to sign up for future editions.
The narrative
The Office of the Comptroller of the Currency (OCC), a federal banking regulator, published a notice of proposed rulemaking pursuant to the GENIUS Act explaining how it might oversee stablecoins. Most of it appears straightforward, but the portion addressing yield seems ambiguous, and possibly even controversial.
Why it matters
The OCC published its first take at rulemaking under the GENIUS Act, the first step toward turning the 2025 law into actual, applicable rules for crypto companies to abide by. Controversially, it seems to propose setting up new restrictions around how stablecoin issuers and their partners can offer yield payments to end users.
Breaking it down
Just to get this out of the way: Most of this 376-page proposal seems fairly straightforward. Provisions address custody controls, capital requirements and the other prosaic regulatory details that one would expect from a proposal seeking to govern the U.S. stablecoin sector. This newsletter may touch on those details in a future edition.
The most controversial part appears to be the sections addressing stablecoin yield and how issuers and affiliates can handle those. According to multiple people tracking this process, speaking on condition of anonymity to discuss an active rulemaking proposal candidly, these sections also seem to be ambiguous. One individual said the OCC seemed to be claiming the authority to ban third parties from offering yield from holding stablecoins, exceeding its authority in the process. But two others said the proposal fit the language of the law defined in GENIUS, and that they had no concerns about yield being banned unilaterally.
What the provisions might do is place restrictions on how stablecoin issuers’ partner companies can pay out interest on stablecoin deposits, the yield we’ve been referring to here.
“[The] proposed [section] provides that permitted payment stablecoin issuers must not pay the holder of any payment stablecoin any form of interest or yield (whether in cash, tokens, or other consideration) solely in connection with holding, use, or retention of such payment stablecoin,” the proposal said. “The OCC understands that issuers could attempt to make prohibited payments of interest or yield to payment stablecoins holders through arrangements with third parties.”
The section went on to list some of these third-party relationships but said “it would not be possible to identify in detail all, or even most, of the potential arrangements.”
However, the proposal said that the OCC would presume these payments are solely for yield purposes if there was a contract to that effect and third parties would be defined as entities paying yield as a service.
Companies would be able to push back and “rebut the presumption” if they have evidence their contractual relationship does not meet those terms, the proposal said.
Companies like Coinbase and Circle might have to tweak the terms of their relationship to abide by the terms of the proposal, as might companies like PayPal and Paxos, the issuer of PayPal’s PYUSD stablecoin, two people said about this section.
Matthew Sigal, head of digital assets research at VanEck, also shared this view, saying on X (formerly Twitter) that companies like Coinbase would have to make their agreements look more like loyalty programs than interest payments.
One confusing part about the proposal, one individual said, is in the definition of an “affiliate.” A company could be an issuer or an affiliate, where affiliates may not be able to issue yield solely for holding deposits, but the proposal appears to create a third category based on ownership stakes. If an issuer has a 25% or greater stake in a third-party, they would not be able to offer payments on yield, which might open the door for third-parties that don’t have such ownership stake concerns.
Similarly, the wording addressing “white-label relationships” may bar yield payments, but it would depend on the terms of the contract between the issuer and the company associated with the stablecoin, the person said. This is the sort of setup PayPal and Paxos have.
To further add to the confusion, stablecoin yield is also one of the issues holding up the advancement of the market structure legislation that the crypto industry continues to hope for. Two people said the OCC proposal might mean that Congress does not need to address yield in the market structure bill at all, but others said there is zero chance Congress will skip over this portion of the bill.
Yield isn’t the only issue holding up the bill — ethics provisions concerning President Donald Trump and his family’s crypto activities, as well as anti-money laundering and know-your-customer rules, still need to be worked out — but if the market structure bill becomes law, it will again reshape how stablecoins can operate in the U.S.
As a result, it is likely that this part of the OCC proposal will not be implemented as-is.
If the market structure bill does become law before the OCC can finalize its rules, the regulator will have to issue an interim proposal to remain compliant with the new law. Otherwise, there will be a whole separate rulemaking process later down the line.
On the market structure bill itself, individuals said that there is some updated draft language circulating among lawmakers but there is no deal between the banking industry and the crypto industry yet.
This week
- There are no government hearings or meetings scheduled as of press time addressing crypto-related issues.
If you’ve got thoughts or questions on what I should discuss next week or any other feedback you’d like to share, feel free to email me at [email protected] or find me on Bluesky @nikhileshde.bsky.social.
You can also join the group conversation on Telegram.
See ya’ll next week!
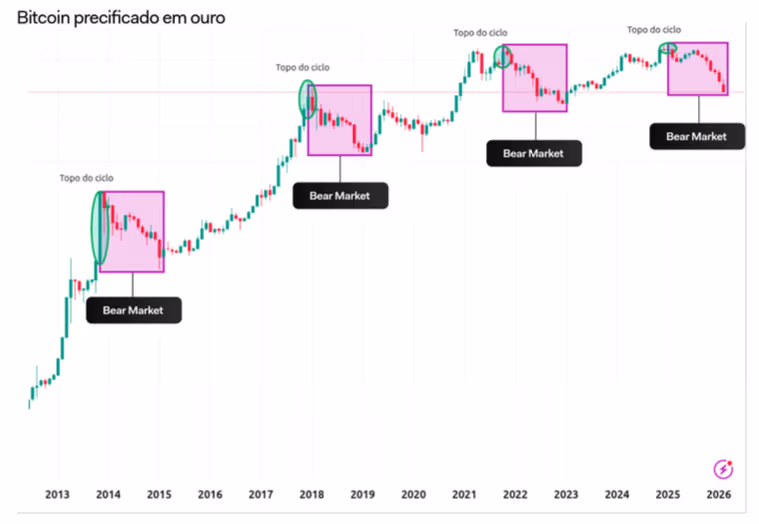
Bitcoin’s path to a market bottom could come as soon as next month, if the gold-denominated bitcoin price is any indication, according to Rony Szuster, Head of Research at the largest Brazilian crypto exchange, Mercado Bitcoin.
In dollar terms, the most recent peak occurred in October 2025 at about $126,000. If the current cycle follows past patterns, the downturn could extend into late 2026, Szuster wrote in a report shared with CoinDesk.
But when priced in gold, the timeline shifts. Bitcoin reached its high against gold in January 2025. Applying the same 12- to 13-month pattern would place a potential bottom around February 2026, with a recovery possibly beginning in March.

The divergence reflects broader macro forces.
Since the start of Donald Trump’s new mandate, markets have faced aggressive trade tariffs, domestic institutional disputes in the U.S., and rising tensions with China and Iran. Rising tensions with the latter have since resulted in ongoing military conflict.
Global uncertainty, measured via the World Uncertainty Index, has exploded as a result. Gold benefited from that shift, rising more than 80% over the past year to $5,280. As capital rotated into bullion, bitcoin weakened against it sooner than it did against the dollar, Mercado Bitcoin’s analyst wrote.
Exchange-traded funds have also added pressure. Since November, about $7.8 billion has flowed out of spot bitcoin ETFs, roughly 12% of the $61.6 billion total.
However, this fear-driven sell-off only paints part of the picture.
While reactive capital is fleeing bitcoin, large-scale investors or “whales” are treating the downturn as an accumulation zone, the report adds, pointing to Abu Dhabi’s major investment firms Mubadala Investment Company and Al Warda Investments adding in spot bitcoin ETF exposure in mid-February.
Against this backdrop, Szuster calls for investors to build their positions intelligently and leverage a dollar-cost averaging strategy to take advantage of current market fear and avoid timing issues.
“Historically, buying during periods of fear has been more effective than buying during euphoria,” he wrote. “Does this mean it’s already the bottom? No. But it means that, statistically, we are in the zone where the best average prices are usually built.”
The landscape around Ethereum is even worse, with the red streak going for six months.
The positive start to 2026 was quickly erased, and bitcoin began to lose value rapidly, reaching new local lows of $60,000 in early February.
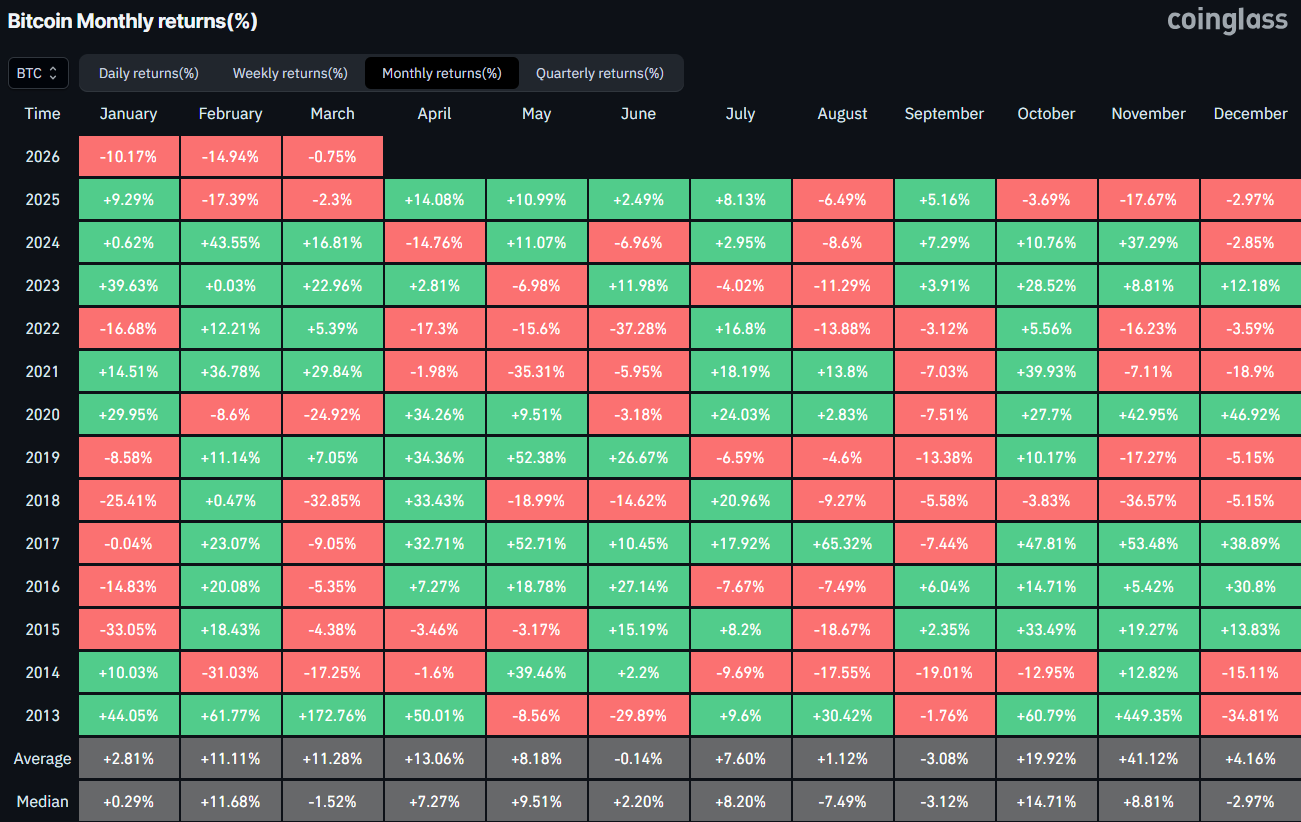
Although it recovered some ground since those 15-month lows, it still ended the month in the red with a painful double-digit decline. This made it five in a row.
February Deep in Red As Well
It was almost impossible to imagine the current situation in early October. At the time, bitcoin’s price was riding high, charting fresh peaks at over $126,000, and the community was anticipating even more records during the so-called ‘Uptober.’ The reality, though, was far different and brutal.
On October 10, the cryptocurrency market experienced its worst single-day liquidation event, with more than $19 billion wrecked as prices tumbled. As many analysts claimed after that pivotal day, something in the market’s structure broke, and it was never the same.
Bitcoin started to chart frequent losses and dumped to a five-digit price territory by the end of the year. It ended 2025 in the red, making it the first post-halving year to do so. January began on the right foot, but the rejection at $98,000 resulted in another nosedive. Thus, January saw losses of just over 10%.
Another massive crash occurred in early February, pushing bitcoin south to its lowest level since October 2024 at $60,000. Although it rebounded and finished February at around $65,000-$66,000, it still ended the month with a 15% decline. This made it the fifth consecutive month in the red for the first time since 2018.

Ethereum Goes a Step Further
Data from Cryptorank shows that the landscape around the world’s largest altcoin is even more painful. ETH has been in the red for six months in a row. Moreover, it has been in the green only three out of the past 15 months.
You may also like:
January and February were quite violent, with a 17.7% decline during the first month of the year and a whopping 19.6% drop in the second. This is the worst monthly streak for ETH since 2018, when it was in the red for seven consecutive months.
ETH is currently fighting to stay above $2,000 after dipping below that level on numerous occasions in the past month.

Binance Free $600 (CryptoPotato Exclusive): Use this link to register a new account and receive $600 exclusive welcome offer on Binance (full details).
LIMITED OFFER for CryptoPotato readers at Bybit: Use this link to register and open a $500 FREE position on any coin!

Premier League Roundup: Man United flying high after win over Crystal Palace

Color Mixing Spray Paint On The Fly

Can We (Finally) Admit That Crypto Was Really… Dumb?


-

 Sports6 days ago
Women’s college basketball rankings: Iowa reenters top 10, Auriemma makes history
-

 Fashion2 days ago
Weekend Open Thread: Iris Top
-

 Politics6 days ago
Nick Reiner Enters Plea In Deaths Of Parents Rob And Michele
-

 Business5 days ago
True Citrus debuts functional drink mix collection
-

 Politics3 days ago
ITV enters Gaza with IDF amid ongoing genocide
-
Sports1 day ago
The Vikings Need a Duck
-

 Tech12 hours ago
Unihertz’s Titan 2 Elite Arrives Just as Physical Keyboards Refuse to Fade Away
-

 Crypto World5 days ago
XRP price enters “dead zone” as Binance leverage hits lows
-

 Tech5 days ago
Unsurprisingly, Apple's board gets what it wants in 2026 shareholder meeting
-
 NewsBeat23 hours ago
Dubai flights cancelled as Brit told airspace closed ’10 minutes after boarding’
-

 Business7 days ago
Law enforcement kills armed man seeking to enter Trump’s Mar-a-Lago resort, officials say
-

 NewsBeat4 days ago
Cuba says its forces have killed four on US-registered speedboat | World News
-
 NewsBeat1 day ago
The empty pub on busy Cambridge road that has been boarded up for years
-
 NewsBeat4 days ago
Manchester Central Mosque issues statement as it imposes new measures ‘with immediate effect’ after armed men enter
-
 NewsBeat6 days ago
‘Hourly’ method from gastroenterologist ‘helps reduce air travel bloating’
-

 Tech7 days ago
Anthropic-Backed Group Enters NY-12 AI PAC Fight
-

 NewsBeat19 hours ago
Abusive parents will now be treated like sex offenders and placed on a ‘child cruelty register’ | News UK
-

 NewsBeat7 days ago
Armed man killed after entering secure perimeter of Mar-a-Lago, Secret Service says
-
 NewsBeat5 days ago
Police latest as search for missing woman enters day nine
-

 Business4 days ago
Discord Pushes Implementation of Global Age Checks to Second Half of 2026