

Crypto World
Bitcoin (BTC) Risks Deeper Drop, Ripple (XRP) Eyes New Targets, and More: Bits Recap Feb 20

Here are some of the projected scenarios involving BTC, XRP, and SHIB.
While Bitcoin (BTC) has slightly rebounded in the past several days, it might be gearing up for a renewed downtrend.
Ripple’s XRP may also experience another substantial pullback, while Shiba Inu (SHIB) can rally, but under one vital condition.
Crash to $10K Comes Next?
Bitcoin’s overall condition remains quite bearish, which gives crypto critics the opportunity to envision further declines in the near future. The popular economist Peter Schiff (who is an outspoken opponent of the digital asset industry and a proponent of gold) predicted a collapse to $20,000 should BTC break below $50,000.
“I know Bitcoin has done that before, but never with so much hype, leverage, institutional ownership, and market cap at stake. Sell Bitcoin now,” his advice reads.
The X user Chiefy, along with Bloomberg’s strategist Mike McGlone, also presented pessimistic forecasts. The former envisioned a short-term plunge to as low as $29,000, while the latter suggested BTC could plummet to $10,000.
For his part, Ali Martinez recently spotted the formation of an “Adam & Eve” pattern on the asset’s price chart, where a break above $71,500 could trigger a jump to $79,000. Michael van de Poppe also chipped in, foreseeing “a big move on the horizon.”
Unable to predict the exact direction, the analyst stated he would accumulate on a downturn and realize some profits should BTC reach $80,000-$85,000.
What Now for XRP?
Ripple’s cross-border token surged to $1.66 late last week, but the rally quickly faded, with the price retreating to the current $1.41 (per CoinGecko’s data). Some analysts warned the move could signal a deeper pullback ahead.
You may also like:
Ali Martinez described the 2-week candle as a graveston doji, reminding that the last time this formation appeared on the chart, XRP’s valuation fell by 46%. For their part, Crypto Tony identified a potential retest of $1.52 as the “perfect” scenario before a new downtrend.
Despite the grim predictions, XRP continues to draw strong interest. Earlier this week, Rayhaneh Sharif-Askary (Head of Product & Research at Grayscale) revealed that advisors at the digital asset manager are “constantly asked” by clients about the token. She also noted that, in some cases, it ranks as the second most discussed asset after BTC.
SHIB Pump Incoming?
While Shiba Inu remains the second-biggest meme coin (trailing only behind Dogecoin), its price has been on a steep decline in the past months. As of this writing, it is worth around $0.000006264, representing a 60% collapse on a yearly scale.
According to Martinez, though, the asset could restore some of its former glory if it manages to flip the $0.0000067 resistance level into support. Should that happen, SHIB might explode by 50% to approximately $0.0000099, he predicted.
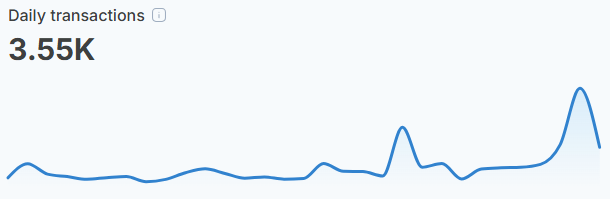
It is important to note that fading interest from traders and investors, along with Shibarium’s stalled progress, doesn’t support the bullish scenario. The security of Shiba Inu’s layer-2 scaling solution was breached in September last year, and it has been coping with issues ever since. Prior to the incident, daily transactions processed on the protocol were in the millions, while lately the figure has dropped to mere hundreds and thousands.
SECRET PARTNERSHIP BONUS for CryptoPotato readers: Use this link to register and unlock $1,500 in exclusive BingX Exchange rewards (limited time offer).


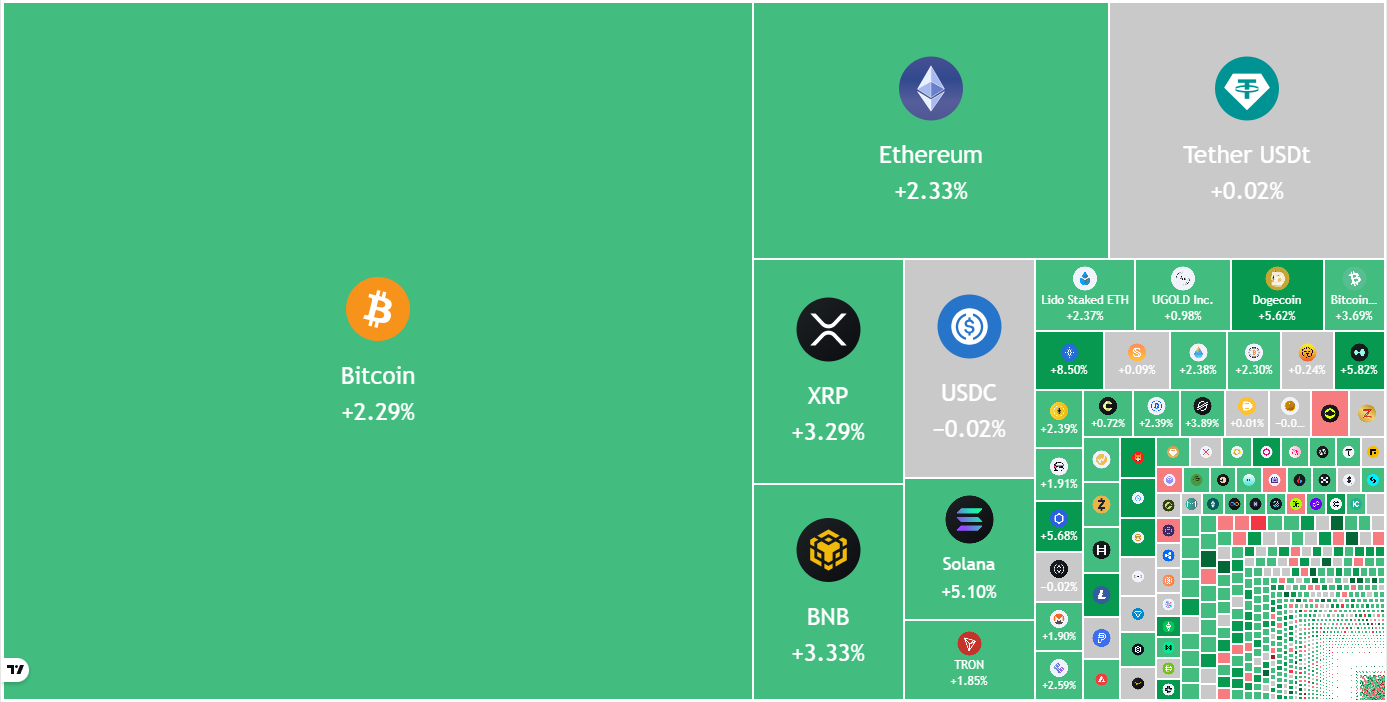
Bitcoin and most altcoins, including popular names like Dogecoin, Shiba Inu Coin, and XRP, were in the green today, February 20, as investors bought the dip after some key catalysts.
Summary
- Bitcoin and most altcoins rose on Friday, with the market capitalization of all tokens rising to over $2.3 trillion.
- The rally happened after the Supreme Court ruled against Donald Trump’s tariffs.
- They also rose after the latest US GDP report, which showed that the economy slowed in Q4.
Bitcoin (BTC) jumped to $68,000, while Dogecoin (DOGE), Shiba Inu Coin (SHIB), and Ripple (XRP) rose by over 4%. The market capitalization of all tokens rose by 2.2% to over $2.3 trillion.
Dogecoin, Shiba Inu Coin, and XRP rose after the Supreme Court ruling
The main reason why altcoins like DOGE, SHIB, and XRP rose is that the Supreme Court ruled against President Donald Trump’s tariffs.
In theory, the ruling will have a positive impact on the US economy by lowering inflation. Such a move raises the possibility that the Federal Reserve will cut interest rates, especially now that the recent data showed that the headline Consumer Price Index dropped in January.
In reality, however, the decision will not have a major impact as Trump has some backup strategies that he will use to implement tariffs on key countries like China, India, and those in the European Union.
Weak US GDP data and impact on the Federal Reserve
Bitcoin and other altcoins rose after the US published a weak GDP report. According to the Bureau of Economic Analysis, the economy expanded by 1.4% in the fourth quarter, badly missing the expected 3%.
The economic growth was much lower than the 4.4% experienced in the third quarter. This slowdown was mostly because of the prolonged government shutdown that happened during the quarter.
The weak economic report is bullish for cryptocurrencies because it raises the possibility that the Fed will cut interest rates later this year.
Donald Trump gave Iran more time to reach a deal
Bitcoin and most altcoins also rose after Donald Trump gave Iranian leaders more time to reach a nuclear deal with the United States. He gave them 15 days, meaning that an attack may not happen during the weekend as some analysts were expecting.
Still, most analysts believe that he will ultimately attack the country later this year, a move that will lead to lower crypto prices. As such, there is a risk that the ongoing rebound is a dead-cat bounce, a situation where assets rise briefly and then resume the downtrend.
Key points:
-
Bitcoin bulls are struggling to sustain the intraday rallies, indicating that every minor rise is being sold into.
-
Select major altcoins are showing weakness, signaling a drop to their strong support levels.
Bitcoin (BTC) bulls pushed the price above $68,300 but are struggling to maintain the higher levels. BTC is likely to record its fifth consecutive red monthly candle in the absence of a major rally in the next few days. That is the longest losing streak since 2018/19 when BTC fell for six successive months. A minor positive for the bulls is that the losing streak in 2018/19 was followed by a 131.6% rally over the following five months, per CoinGlass data.
Another indicator signaling a possible rally to the upside is the Bollinger Bands. According to crypto analyst Dorkchicken, the monthly Bollinger Bands are at their “tightest” level on record. All previous such instances have resulted in a bullish breakout, except the breakdown to $16,000 from $20,000 in 2022.

Although signs point to a possible up move, traders should keep a close watch on BTC exchange-traded funds (ETFs) flows to gauge institutional activity. US spot BTC ETFs have recorded $403.9 million in net outflows this week, according to SoSoValue data. Unless Friday witnesses sharp inflows, reversing losses of the past three days, the ETFs are on track for a five-week outflow streak. A sustained recovery may be difficult without institutional participation.
Could buyers push BTC and select major altcoins above their overhead resistance levels? Let’s analyze the charts of the top 10 cryptocurrencies to find out.
Bitcoin price prediction
BTC bulls have maintained the price above the immediate support at $65,118, indicating demand at lower levels.

Buyers will have to push the Bitcoin price above the 20-day exponential moving average ($71,247) to gain the upper hand. If they manage to do that, the BTC/USDT pair may climb to the breakdown level of $74,508. Sellers are expected to aggressively defend the $74,508 level, as a break above it suggests the pair may have formed a short-term bottom. The pair may then ascend to the 50-day simple moving average ($82,258).
Sellers will have to yank the price below the $65,118 level to signal strength. The pair may then retest the Feb. 6 low of $60,000, which is likely to attract solid buying by the bulls.
Ether price prediction
Ether (ETH) has been consolidating between the $1,750 and the $2,111 level, indicating uncertainty about the next directional move.

There is minor support at $1,897, but if the level cracks, the ETH/USDT pair may drop to the $1,750 support. Buyers are expected to fiercely defend the $1,750 level, as a close below it may sink the pair to $1,537.
The bulls will be back in the driver’s seat on a close above the $2,111 resistance. If they can pull it off, the Ether price may rally to the 50-day SMA ($2,665). Sellers may again attempt to halt the recovery at the 50-day SMA, but if the buyers prevail, the pair may surge to $3,045.
XRP price prediction
The failure of the bulls to push XRP (XRP) above the 20-day EMA ($1.50) suggests a lack of demand at higher levels.

The XRP/USDT pair may slide to the support line, which is a crucial level to watch out for. If the XRP price turns up sharply from the support line and breaks above the 20-day EMA, it suggests that the pair may remain inside the descending channel for some more time. Buyers will have to pierce the downtrend line to signal a short-term trend change.
Contrarily, a break and close below the support line indicates that the bears are in command. The pair may then tumble to $1.11 and subsequently to $1.
BNB price prediction
BNB (BNB) has been gradually sliding toward the $587 to $570 support zone, indicating that the bears are in control.

If the BNB price turns down and skids below the support zone, the BNB/USDT pair may start the next leg of the downtrend to the psychological level at $500.
This bearish view will be negated in the near term if the bulls push the price above the $669 resistance. If that happens, the pair may surge to the breakdown level of $730 and then to the 50-day SMA ($797). Such a move suggests that the pair may have bottomed out in the short term.
Solana price prediction
Solana (SOL) bulls are attempting to maintain the price above the immediate support at $76, but the bounce lacks strength.

That heightens the risk of a break below the $76 level. If that happens, the SOL/USDT pair may plummet to the Feb. 6 low of $67. Buyers are expected to mount a strong defense at the $67 level, as a close below it may sink the pair to $50.
The first sign of strength will be a break and close above the breakdown level of $95. That indicates the bears are losing their grip. The Solana price may then rally to the 50-day SMA ($114).
Dogecoin price prediction
Buyers are attempting to push Dogecoin (DOGE) above the 20-day EMA ($0.10), but the bears have held their ground.

A minor positive in favor of the bulls is that they have not given up much ground to the bears. That increases the possibility of a break above the 20-day EMA. If that happens, the DOGE/USDT pair may rally to the breakdown level of $0.12.
Contrary to this assumption, if the Dogecoin price turns down and breaks below $0.09, it suggests that the bulls have given up. That might sink the pair to the critical $0.08 support.
Bitcoin Cash price prediction
Bitcoin Cash (BCH) has slipped below the 20-day EMA ($548), indicating that the bears are attempting to take charge.

If the Bitcoin Cash price sustains below the 20-day EMA, the BCH/USDT pair may plummet to the next major support at $500. Buyers are expected to vigorously defend the $500 level, as a close below it may open the doors for a fall to the vital support at $443.
The bulls will have to push and maintain the price above the 50-day SMA ($575) to signal strength. The pair may then jump to $600 and later to $631. Buyers are expected to encounter aggressive selling in the $631 to $670 zone.
Related: Here’s what happened in crypto today
Hyperliquid price prediction
Hyperliquid (HYPE) bounced off the 50-day SMA ($27.89) on Thursday, indicating that the bulls are buying on dips.

Buyers will have to drive the Hyperliquid price above $32.50 to seize control. The HYPE/USDT pair may then pick up momentum and surge to the $35.50 to $38.42 resistance zone.
On the contrary, if the price turns down from the 20-day EMA ($30.01) and breaks below the 50-day SMA, it suggests that the bulls are losing their grip. The pair may then slump toward the $20.82 support, where buyers are expected to step in.
Cardano price prediction
Buyers are struggling to push Cardano (ADA) above the 20-day EMA ($0.28), but a minor positive is that they have not ceded much ground to the bears.

The bulls will again attempt to drive the Cardano price above the 20-day EMA. If they succeed, the ADA/USDT pair may march toward the stiff overhead resistance at the downtrend line. Buyers will have to achieve a close above the downtrend line to signal a potential short-term trend change.
Sellers are likely to have other plans. They will strive to tug the price below the support line, indicating the resumption of the downtrend. The next stop on the downside is likely to be $0.15.
Monero price prediction
Monero (XMR) has been consolidating in a downtrend, indicating that the bears have kept up the pressure.

Sellers will attempt to strengthen their position by pulling the Monero price below the $309 level. If they manage to do that, the XMR/USDT pair might drop to the $276 level. Buyers are expected to defend the $276 level with all their might, as a close below it may sink the pair to $247.
On the upside, the bulls will have to drive and maintain the price above the 20-day EMA ($360) to signal strength. The pair may then climb to the 61.8% Fibonacci retracement level of $414.
This article does not contain investment advice or recommendations. Every investment and trading move involves risk, and readers should conduct their own research when making a decision. While we strive to provide accurate and timely information, Cointelegraph does not guarantee the accuracy, completeness, or reliability of any information in this article. This article may contain forward-looking statements that are subject to risks and uncertainties. Cointelegraph will not be liable for any loss or damage arising from your reliance on this information.

TLDR:
- The Supreme Court struck down Trump’s IEEPA tariffs, putting $150B+ in potential refunds on the table for U.S. firms.
- Refunds won’t be automatic; companies must file claims or lawsuits to recover payments made under the tariffs.
- If tariffs ease, import costs may fall, inflation could cool, and the Fed may have room to cut rates sooner.
- Trump retains tariff authority under Sections 232, 301, and 122, though broader tariffs now require stronger legal grounds.
The Supreme Court has ruled Trump’s sweeping tariffs unconstitutional, upending a cornerstone of his trade policy.
Importers across the U.S. paid over $150 billion under these tariffs. The government now faces pressure to return that money. The ruling reshapes the trade landscape and carries wide economic consequences.
Supreme Court Tariff Ruling Opens Door to $150 Billion in Refunds
The tariffs in question relied on the International Emergency Economic Powers Act, known as IEEPA. The court’s decision strips that tool from the administration’s trade arsenal. It does not, however, eliminate the president’s authority to levy tariffs altogether.
Refunds will not flow automatically to affected companies. According to Bull Theory, businesses will likely need to file formal claims or pursue litigation. That process could take months or years to resolve.
If the government approves large-scale refunds, federal revenue takes a serious hit. The fiscal gap could force higher borrowing, which tends to push Treasury yields upward. That creates a new pressure point for bond markets.
At the same time, removing these tariffs could ease cost burdens on importers. Lower import costs typically reduce what businesses charge consumers. That could translate into softer inflation readings over time.
Crypto and Financial Markets Watch Fed’s Next Move Amid Tariff Fallout
The Federal Reserve currently faces a difficult position. Growth signals are soft. Inflation remains sticky. The tariff ruling adds a new variable to that calculation.
If import costs fall and inflation cools, the Fed gains more room to cut interest rates. Bull Theory notes that reduced tariff pressure and easing prices could support more aggressive rate cuts. Lower rates historically benefit risk assets, including crypto markets.
Rate cuts tend to lift consumer spending and business investment. Housing markets also respond quickly to cheaper borrowing. Crypto traders watch these macro signals closely.
Trump still holds several legal tools for imposing tariffs. Section 232 covers national security-based tariffs and applies to specific industries. Section 301 targets countries engaged in unfair trade practices, and it already underpins most China-related tariffs.
Section 122 offers a faster but narrower option, limited in size and duration. Anti-dumping and countervailing duties remain available too, though they require formal legal proceedings.
Bull Theory points out that what changes most is speed. IEEPA allowed near-instant, broad tariffs. Future tariffs will require investigations and stronger legal grounds.


A Polymarket trader has lost hundreds of thousands of dollars in crypto because of a Uniswap phishing ad that appeared at the top of a Google search result. Hundreds of friends and associates filled up the comment section with condolences.
The founder of DefiLlama broadcasted the terrible story as a warning to the crypto community.
The founder of Uniswap – the real Uniswap – repeated that warning, “These scams are horrible, we’ve been fighting them for years.” He called the disturbing industry of fake websites that rely on ads to lure crypto investors “the ad economy” and implored that it “needs to go.”
Uniswap is a common way for crypto traders to exchange digital tokens without trusting a centralized crypto exchange with custody of their funds.
The six-figure loss is the latest example in an ongoing series where scammers buy Google Ads to direct users to fraudulent, lookalike websites that mimic real crypto interfaces like Uniswap. Victims click the ad, connect their wallet, and sign a malicious transaction. That approval grants the power to drain assets or make trades from the wallet.
For years, fraudulent Google search ads have led users to phishing pages that impersonate well-known crypto apps.
Uniswap phishing scam-as-a-service
The particular wallet drainer tool used in this attack was AngelFerno. This ‘scam-as-a-service’ wallet drainer script targets DeFi users, including prior front-end attacks that impersonated OpenEden and Curvance websites.
AngelFerno is live on multiple domains that are itemized on GitHub phishing blocklists. Users should not navigate to them.
Particularly nefarious attackers use Cyrillic characters in URLs, also known as Punycode URLs, to make the fake domain appear visually indistinguishable from the real URL.
Read more: Crypto phishing blitz hits CoinMarketCap, Cointelegraph, and Trezor
Chainalysis and other security researchers have flagged Google phishing ads as a major attack vector. In July 2025, for example, a DeFi user lost $1.2 million through a nearly identical Uniswap scam involving fraudulent Google Ads.
Forensic investigator ZachXBT called for severe consequences against Google for failing to prevent phishing ads.
Protos has reached out to the victim for confirmation about the mid-six-figure and “entire net worth” estimate of his loss but did not receive an immediate response prior to publication. The victim has said publicly that he lost six figures after being fooled by a Google ad.
Got a tip? Send us an email securely via Protos Leaks. For more informed news, follow us on X, Bluesky, and Google News, or subscribe to our YouTube channel.

BGD Labs, a core technical contributor to the DeFi protocol Aave, announced it will conclude its involvement with the project’s DAO on April 1, ending a four-year collaboration that helped shape the protocol’s core subsystems. In a post on Aave’s governance forum, BGD cited an “asymmetric organizational scenario” and argued the DAO had not adequately accounted for contributors’ expertise. The team said the project had adopted an adversarial posture toward v3 in favor of features planned for v4, a shift it said impeded meaningful improvements. Nothing changes until April 1, but BGD signaled it will wind down its formal contributions while remaining engaged in certain areas through a defined transition. The forum note points to ongoing work on multiple fronts, even as the formal collaboration winds down.
Key takeaways
- BGD Labs will end its involvement with the Aave DAO on April 1 after four years of work.
- The departure is framed around an asymmetric organizational setup and perceived governance misalignment with technical contributors, particularly in the v3-versus-v4 prioritization debate.
- Until the wind-down date, BGD will continue work on v3, Umbrella, chain expansions, security, and asset onboarding, with no immediate off-boarding path but a transition-focused plan.
- A two-month, $200,000 security retainer has been proposed to support continuity beyond April as the community seeks a replacement for critical contributions.
- Reactions within the user base were mixed-to-positive toward BGD, tempered by concerns about the loss of a significant DeFi builder; Stani Kulechov publicly praised BGD’s contributions.
Sentiment: Neutral
Market context: The development underscores ongoing governance and talent-retention dynamics within DeFi DAOs, where centralized expertise must coexist with decentralized decision-making, and where transition plans can influence security and upgrade trajectories.
Why it matters
The departure of a long-standing technical contributor from a high-profile protocol like Aave highlights how DeFi projects balance governance with engineering depth. BGD Labs’ four-year involvement positioned it at the center of critical subsystems, meaning its exit could ripple through areas spanning core protocol stability, security reviews, and on-boarding of assets. When a DAO relies on a limited set of builders for foundational components, even routine changes can take on outsized importance. In this case, the forum discussion that accompanied the announcement suggests a broader tension between centralized expertise and DAO-driven governance, a stakes-laden issue for communities that prize decentralization but depend on specialized knowledge to maintain robust, scalable systems.
The situation also spotlights the challenge of aligning long-term technical progress with a governance model that is, by design, open to diverse stakeholders. BGD’s public characterization of an “asymmetric organizational scenario” reflects concerns that the DAO’s governance structure may not always create the conditions necessary for sustained improvement, particularly when competing priorities between v3 stabilization and v4 feature development emerge. Such tensions are not unique to Aave; they echo broader discussions across the ecosystem about how to evolve upgrades and enhancements without fracturing consensus or stalling critical work.
From a practical standpoint, the two-month security-retainer proposal signals a pragmatic approach to continuity, allowing time for a replacement to come online while limiting risk exposure. In a space where security, asset onboarding, and cross-chain capabilities are high-stakes, transitional mechanisms like retainers can help calm the nerves of users and developers who rely on steady maintenance. The move may also influence how other DAOs outline transition plans when a core contributor departs, potentially becoming a template for similar exits in the future.
For the broader market, the episode reinforces that DeFi projects remain highly collaborative efforts where governance decisions, technical leadership, and risk management intersect. Talent mobility — from one protocol to another or toward new ventures — is a reality of the space. The emphasis on sustaining critical subsystems while seeking a replacement provider reflects an industry-wide trend toward clearer transitional governance and more explicit continuity strategies as ecosystems scale and mature.
In the immediate term, the community’s reaction—largely positive toward BGD’s contributions while raising concerns about the loss of foundational expertise—highlights a nuanced sentiment: appreciation for past work alongside vigilance regarding ongoing development and security assurances. The public response from Aave’s founder suggests confidence in the ecosystem’s resilience, even as the project navigates a meaningful personnel shift.
“I respect BGD’s decision, though I am sad to see them go. The DeFi ecosystem is better for having a team like BGD in it and I hope they continue to build and make contributions to the industry.”
What to watch next
- April 1 milestone as BGD’s formal wind-down begins and responsibilities are reallocated or retired.
- Whether Aave’s DAO moves to nominate or contract a replacement for BGD’s technical leadership on v3, Umbrella, and related areas.
- Groundwork or approval for the proposed two-month, $200,000 security retainer or alternative continuity arrangements.
- Any governance updates or votes touching on the prioritization of v3 stabilization versus v4 feature development and how contributors are engaged in those decisions.
Sources & verification
BGD Labs exits Aave DAO after four years of technical leadership
BGD Labs, a core technical contributor to the DeFi protocol Aave, announced it will conclude its involvement with the DAO on April 1, ending a four-year collaboration that helped shape the protocol’s core subsystems. In a post on Aave’s governance forum, BGD cited an “asymmetric organizational scenario” and argued the DAO had not adequately accounted for contributors’ expertise. The team said the project had adopted an adversarial posture toward v3 in favor of features planned for v4, a shift it said impeded meaningful improvements. Nothing changes until April 1, but BGD signaled it will wind down its formal contributions while remaining engaged in certain areas through a defined transition. The forum note points to ongoing work on multiple fronts, even as the formal collaboration winds down.
The decision reflects BGD’s long-running role as a builder for the Aave ecosystem, involving substantial hands-on work across technical subsystems and security-related tasks. The forum post emphasizes that BGD’s work extended beyond a narrow scope, with the team frequently leading or collaborating on critical components that the community recognizes as part of Aave’s technical backbone. While the departure focuses on governance dynamics and organizational structure, the practical implications are real: what happens to ongoing maintenance, security audits, and cross-chain initiatives when a primary contributor steps back?
As part of the wind-down plan, BGD noted that “nothing changes” immediately after the announcement and that the group will continue supporting v3, Umbrella, chain expansions, security, and assets onboarding up to and beyond the April deadline. The firm argued that the current environment—where improvements to v3 are expected to be constrained by governance dynamics—undermined its ability to push forward effectively. It also proposed a two-month, $200,000 security retainer intended to bridge the gap while Aave searches for a suitable replacement and while the community weighs longer-term continuity options.
From a governance perspective, the episode illustrates a broader conversation about how DAOs sustain momentum when essential contributors depart. The Aave community’s response—varying from appreciation for BGD’s contributions to concern about the impact on ongoing development—mirrors a wider tension across the DeFi landscape: decentralization versus the practical need for specialized, ongoing expertise. Stani Kulechov’s public reply to the forum thread underscores the ecosystem’s resilience and willingness to recognize value created by core teams, even as leadership transitions take place.
In the weeks ahead, observers will be watching for concrete steps toward replacing BGD’s functions, the fate of the proposed security retainer, and any governance actions that influence the prioritization of v3’s stabilization versus v4’s feature set. The move also serves as an implicit reminder that even established contributors can re-evaluate alignment with a DAO’s evolving objectives, and that a thoughtful transition plan may prove essential to maintaining user trust and system reliability in a rapidly evolving DeFi environment.


BGD Labs, a core technical contributor to decentralized finance protocol Aave, said it will conclude its involvement with the project’s DAO on April 1 after four years.
In a Friday forum post on Aave, BGD cited an “asymmetric organizational scenario,” which it said the DAO has “badly executed” without consideration of contributors’ expertise. The contributor added that Aave had taken an “adversarial position” of the third version (v3) of its protocol to promote features in the fourth (v4).
“While all previous points that BGD should just keep contributing on the v3 side exclusively, the situation created makes it nonsensical to us: every time we think/will think about improving v3, there will be some type of implicit/explicit artificial constraint,” said BGD. “We are not really interested in being in that position, as we think it is a waste of our potential.”
As part of the winding down of its collaboration with Aave, BGD said “nothing changes” until April 1, and the project would continue to contribute to v3, Umbrella, chain expansions, security and assets’ onboarding.
Existing projects likely to continue after its contributions end will have maintenance guidelines, but BGD said there was not a “direct off-boarding path” for the project to contribute to the Aave protocol. It proposed a two-month, $200,000 security retainer for the community to consider beyond April as Aave finds a potential replacement.
Related: Aave founder pitches $50T ‘abundance asset’ boom to drive DeFi
“BGD Labs was created in early 2022 to build in the DeFi/web3 ecosystem,” said the forum post. “Since then, we have been almost exclusively focused on our contribution to Aave: any technical sub-system of Aave that the community knows about, BGD Labs was leading its development, or at least participating/collaborating with other entities in it.”
Aave users react to BGD departure
Reactions from many users to the news were largely positive toward BGD, with many expressing concerns about the loss of a significant contributor to the DeFi protocol.
“If independent contributors feel sidelined by DAO-level centralization, maybe the answer is just structural clarity inside the DAO,” said user JosueMpia. “Because this feels bigger than one team leaving.”
Some users accused Aave founder and CEO Stani Kulechov of being responsible for the project’s departure. The CEO also responded to the post, praising BGD for its role:
“I respect BGD’s decision, though I am sad to see them go. The DeFi ecosystem is better for having a team like BGD in it and I hope they continue to build and make contributions to the industry.”
Magazine: IronClaw rivals OpenClaw, Olas launches bots for Polymarket — AI Eye


The Dubai Land Department (DLD) and tokenization firm Ctrl Alt unveiled a secondary market for real estate-backed tokens, enabling the resale of $5 million in fractional property ownership in an announcement on Friday.
Roughly 7.8 million tokens tied to ten Dubai properties are now eligible for trading within a controlled market environment. Transactions will take place on a regulated distribution platform, recorded on the XRP Ledger blockchain and secured by Ripple Custody.
The effort is part of Dubai’s ambitious plan to become a global hub for real estate tokenization, turning ownership in properties into tradable tokens on blockchain rails. Proponents argue that blockchain rails can streamline ownership records and settlement. However, uneven regulation remains a bottleneck and thin secondary trading can limit liquidity, a report by EY pointed out.
The tokenized real estate market is still a tiny slice of the global property market, but it is projected to grow rapidly over the next decade. Deloitte said in a report last year that $4 trillion of real estate will be tokenized by 2035, growing 27% a year.
Dubai’s $16 billion roadmap
DLD, a government agency for the real estate industry, set out a roadmap last year to tokenize 7% — or about $16 billion — of Dubai’s real estate market by 2033. The first milestone of that plan was the inception of a platform developed with Prypco and Ctrl Alt to tokenize property deeds on the XRP Ledger (XRP) chain.
Secondary market trading with the tokens is part of the second phase of that pilot, aiming to test market infrastructure, investor protections, and alignment with existing property laws. Ctrl Alt, the project’s infrastructure partner, has integrated directly with the DLD system to issue and manage title deed tokens onchain.
The tokens are also paired with a second layer — Asset-Referenced Virtual Assets (ARVAs) — that regulate who can trade them and under what conditions. This setup ensures all trades are compliant and accurately reflected in Dubai’s official property registry.
Crypto World
Binance’s CZ Says He Played a ‘Tiny’ Part in UAE’s Embrace of Bitcoin as Store of Value


Over the years, the UAE has increased its Bitcoin holdings through mining and ETF purchases, with exposure now exceeding $1 billion.
Changpeng Zhao (CZ), founder and former CEO of the world’s largest crypto exchange, Binance, has revealed his role in the United Arab Emirates’ (UAE) Bitcoin adoption.
In a tweet highlighting information that the UAE has formally recognized bitcoin (BTC) as a store of value similar to gold, CZ disclosed that his advocacy contributed to the development.
CZ Influenced the UAE’s Bitcoin Adoption
“I might have done a tiny bit of advocacy for this,” the Binance founder said.
It is no news that CZ established his primary residence in Dubai in 2021, due to the city’s pro-crypto and forward-thinking environment. His presence in the city and influence on prominent figures have certainly affected their stance on Bitcoin and the crypto industry as a whole.
Over the years, the UAE has increased its Bitcoin exposure through mining and the purchase of exchange-traded funds (ETFs). By 2022, Abu Dhabi’s royal family had ventured into Bitcoin mining through its affiliated firm, Citadel Mining. The royal family, through Citadel, established large-scale mining operations on AI Reem Island and has since amassed over $450 million in bitcoin.
Earlier today, the market intelligence platform, Arkham, revealed that the UAE has mined $453.6 BTC. On-chain data shows the entity has been holding the majority of BTC produced, with its last outflow recorded 4 months ago. The royal family is now $344 million in profit on their BTC, minus energy costs.
UAE’s Bitcoin Exposure Crosses $1B
Besides the Bitcoin mining ventures, two major Abu Dhabi sovereign wealth entities, namely Mubadala Investment Company and Al Warda Investments, have purchased millions of shares in spot Bitcoin ETFs. By the end of 2025, the companies had amassed more than $1 billion in combined holdings of BlackRock’s iShares Bitcoin Trust (IBIT).
Separate 13F filings with the U.S. Securities and Exchange Commission (SEC) revealed that by the end of last year, Mubadala held over 12.7 million shares in IBIT. On the other hand, Al Warda owned at least 8.21 million shares of the same product. The shares were worth $631 million and $408 million, respectively.
You may also like:
Although the value of the ETF shares has plummeted alongside bitcoin’s price, the combined Bitcoin exposure for the UAE remains well above $1 billion. With the government recognizing BTC as a store of value, the cryptocurrency is likely to be treated as a permanent reserve asset going forward.
SECRET PARTNERSHIP BONUS for CryptoPotato readers: Use this link to register and unlock $1,500 in exclusive BingX Exchange rewards (limited time offer).


The development team said that disagreements over direction, particularly around Aave V4, drove the decision.
BGD Labs, one of the main teams that builds and maintains Aave’s technology, said it will stop working with the Aave DAO when its contract ends on April 1, 2026.
Aave is currently the largest decentralized finance (DeFi) protocol, with more than $26.8 billion in total value locked, according to DeFiLlama. In a new blog post, BGD said its decision to leave after four years follows disagreements about the protocol’s future direction.
One of the key issues, the team said, is increasing pressure to focus on v4, even though v3 remains the main system in use. The v4 testnet went live in November 2025 and introduced a new “hub-and-spoke” architecture aimed at reshaping DeFi lending.
“While initially our understanding was that Aave v4 would be a complement of a very mature and successful v3, over time, Aave Labs started to create what we think is a very aggressive [sic] criticism of Aave v3, to promote the new features of v4,” the post reads.
BGD’s exit raises questions about how Aave’s development work will be handled going forward. Although the team said it will continue working as usual, and then hand off projects so other teams can take over.
BGD also stressed that its decision wasn’t due to technical problems with the protocol, adding that many of the issues it identified in 2022 have since been resolved. They also described Aave v3 as a “solid and future-proof” system with governance that “just works,” and reassured that its systems should keep running normally.
Separately, Marc Zeller, founder of the Aave Chan Initiative (ACI), said in a message originally written in French on Telegram that BGD’s departure “changes everything.” In a separate message, he disclosed that he sold part of his token holdings.
Currently, Aave’s native token AAVE is trading at around $118, down about 3% over the past 24 hours.

XRP has remained under pressure amid a broader crypto market pullback. The token continues to trade below a persistent downtrend line that began at the start of the year. Multiple breakout attempts have failed, reinforcing bearish control in the short term.
Despite the ongoing decline, historical patterns suggest this phase may precede a recovery rally. Similar technical setups have marked turning points in the past. Notably, July 2024.
XRP Could See Its History Repeated
The Market Value to Realized Value, or MVRV, Extreme Values indicator shows XRP has traded below the 1.0 threshold for an extended period. An MVRV ratio under 1.0 often signals that the asset is undervalued relative to its historical cost basis. This condition can reflect capitulation among short-term holders.
Green bars within the MVRV model indicate XRP is “getting low,” suggesting a potential bottom formation. Historically, such readings have occurred after MVRV remained below 1.0 for roughly 15% of trading days. These periods have often aligned with reversal stages rather than prolonged declines.
Want more token insights like this? Sign up for Editor Harsh Notariya’s Daily Crypto Newsletter here.
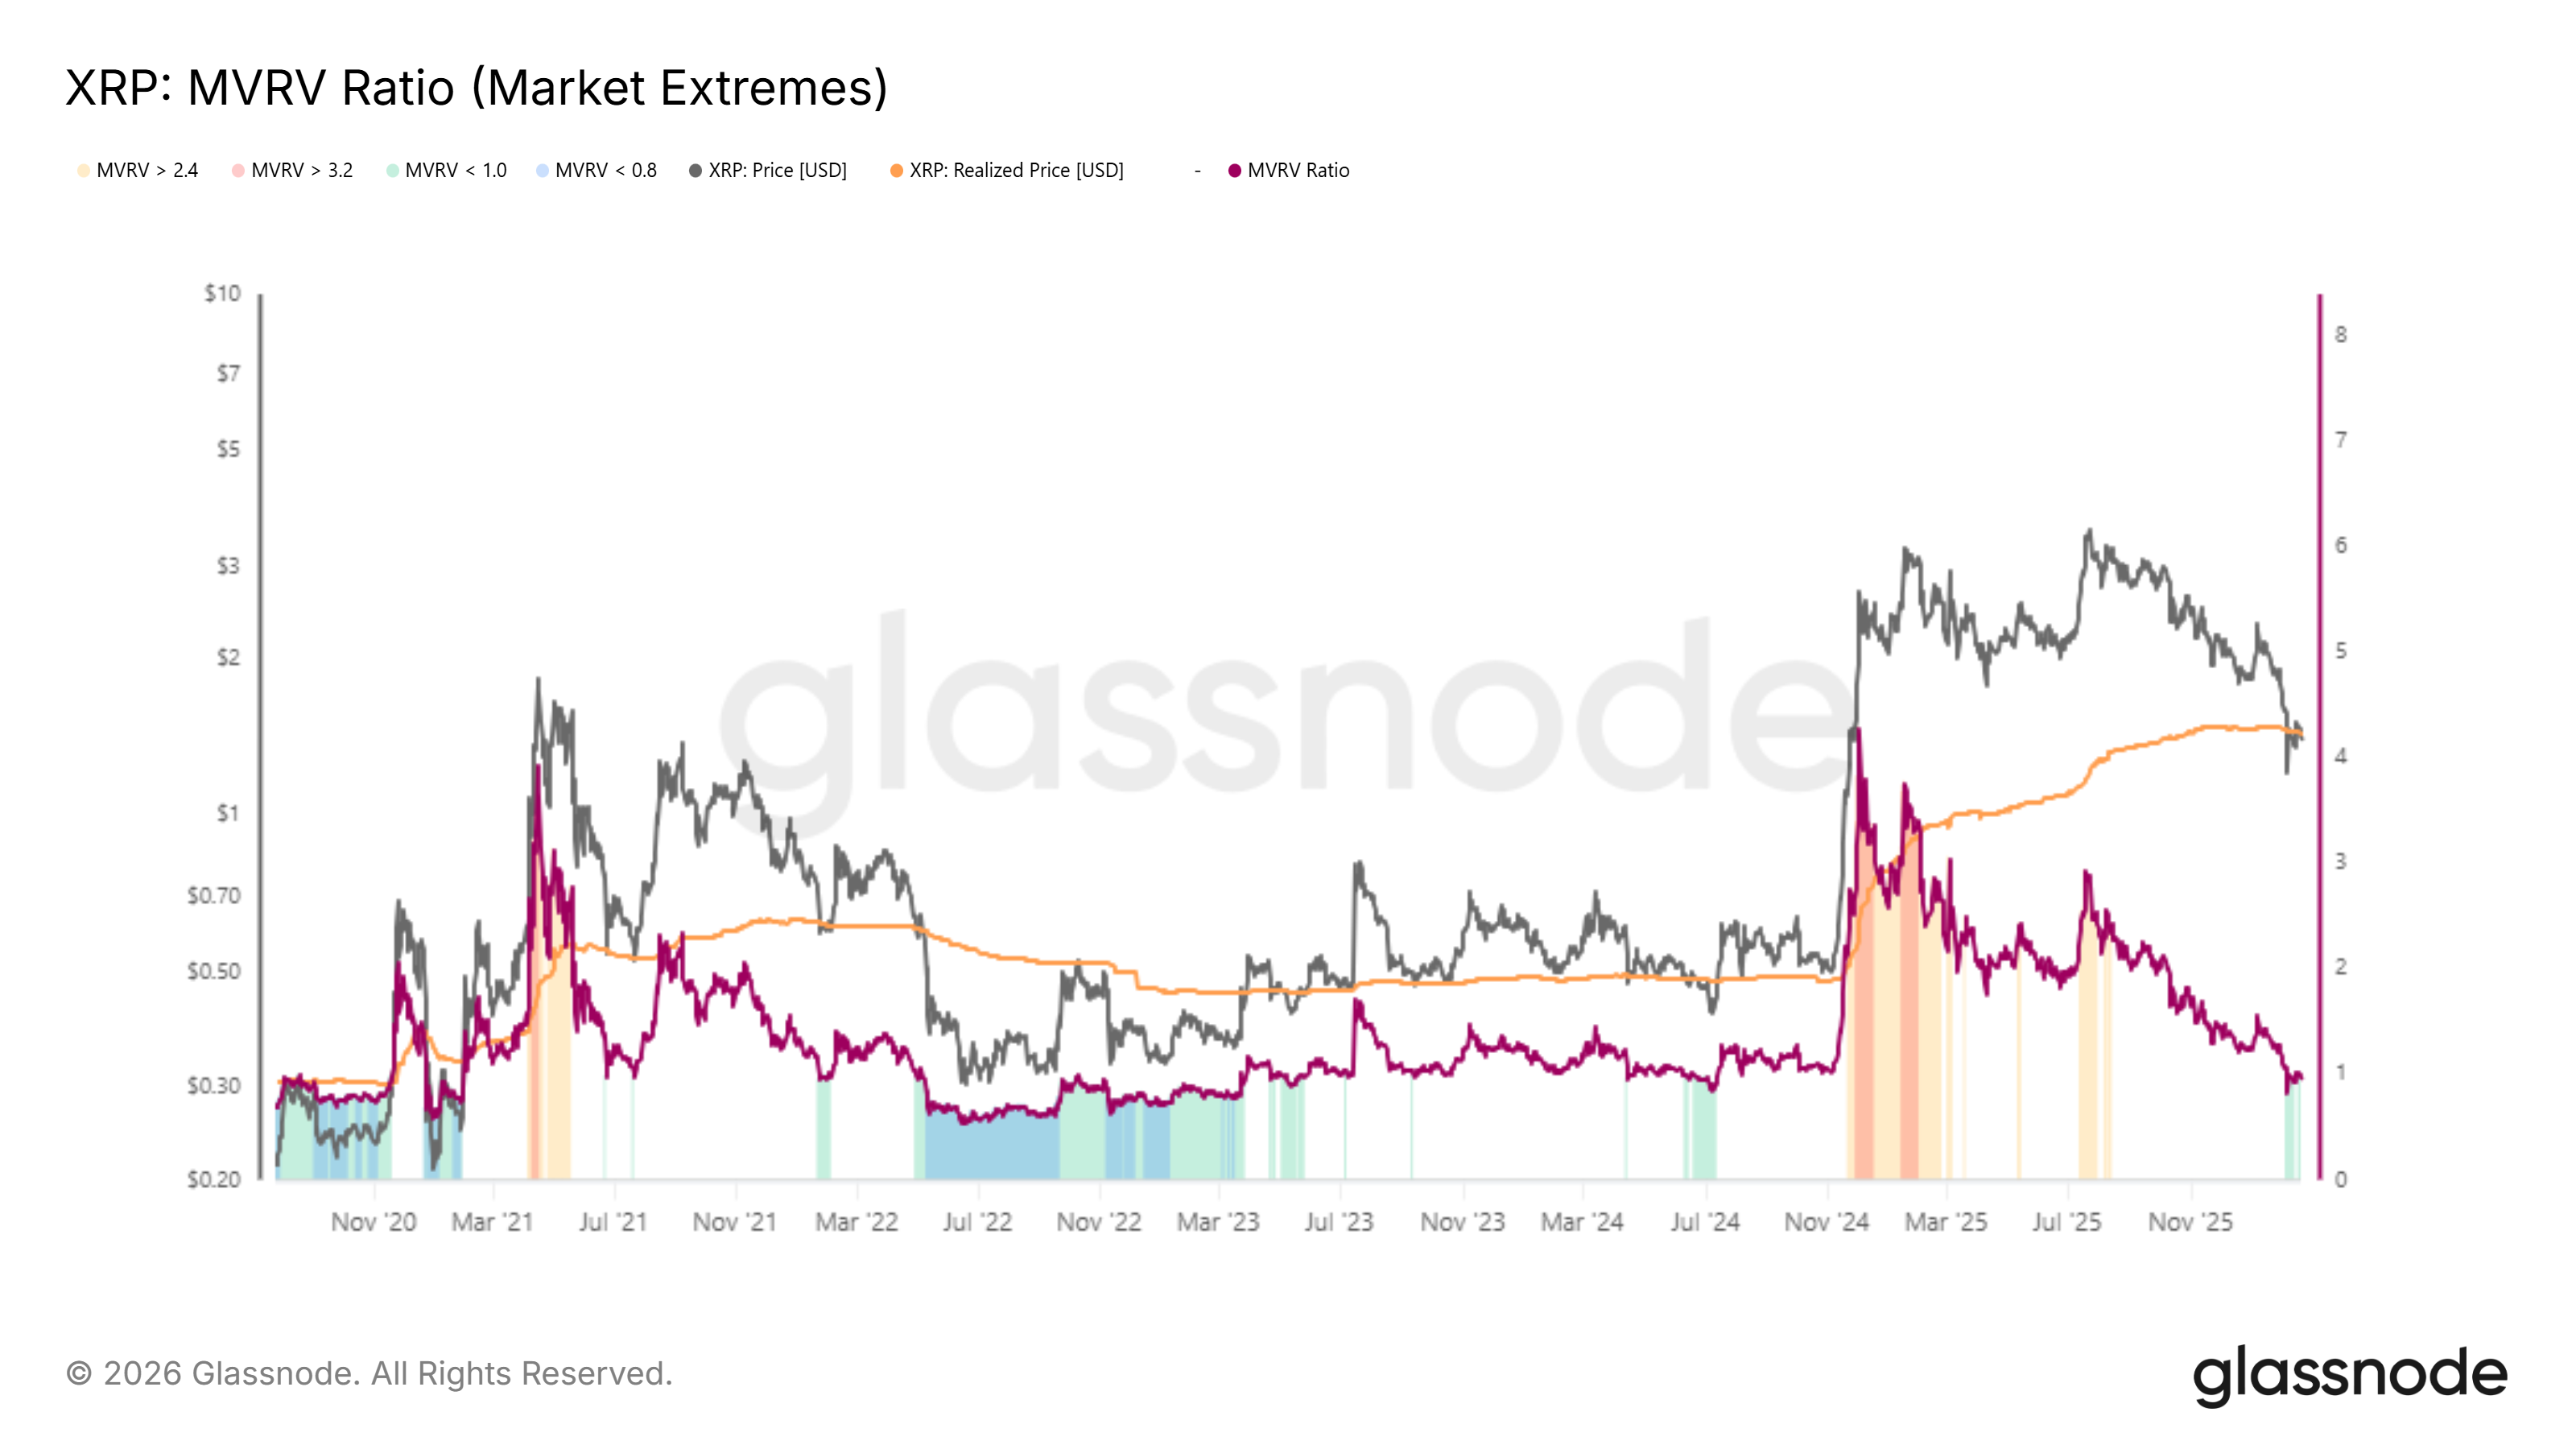
A similar setup emerged in July 2024. Shortly after comparable MVRV readings, XRP surged 51% within days. While past performance does not guarantee future results, the data suggests XRP may be nearing a recovery phase if historical tendencies repeat.
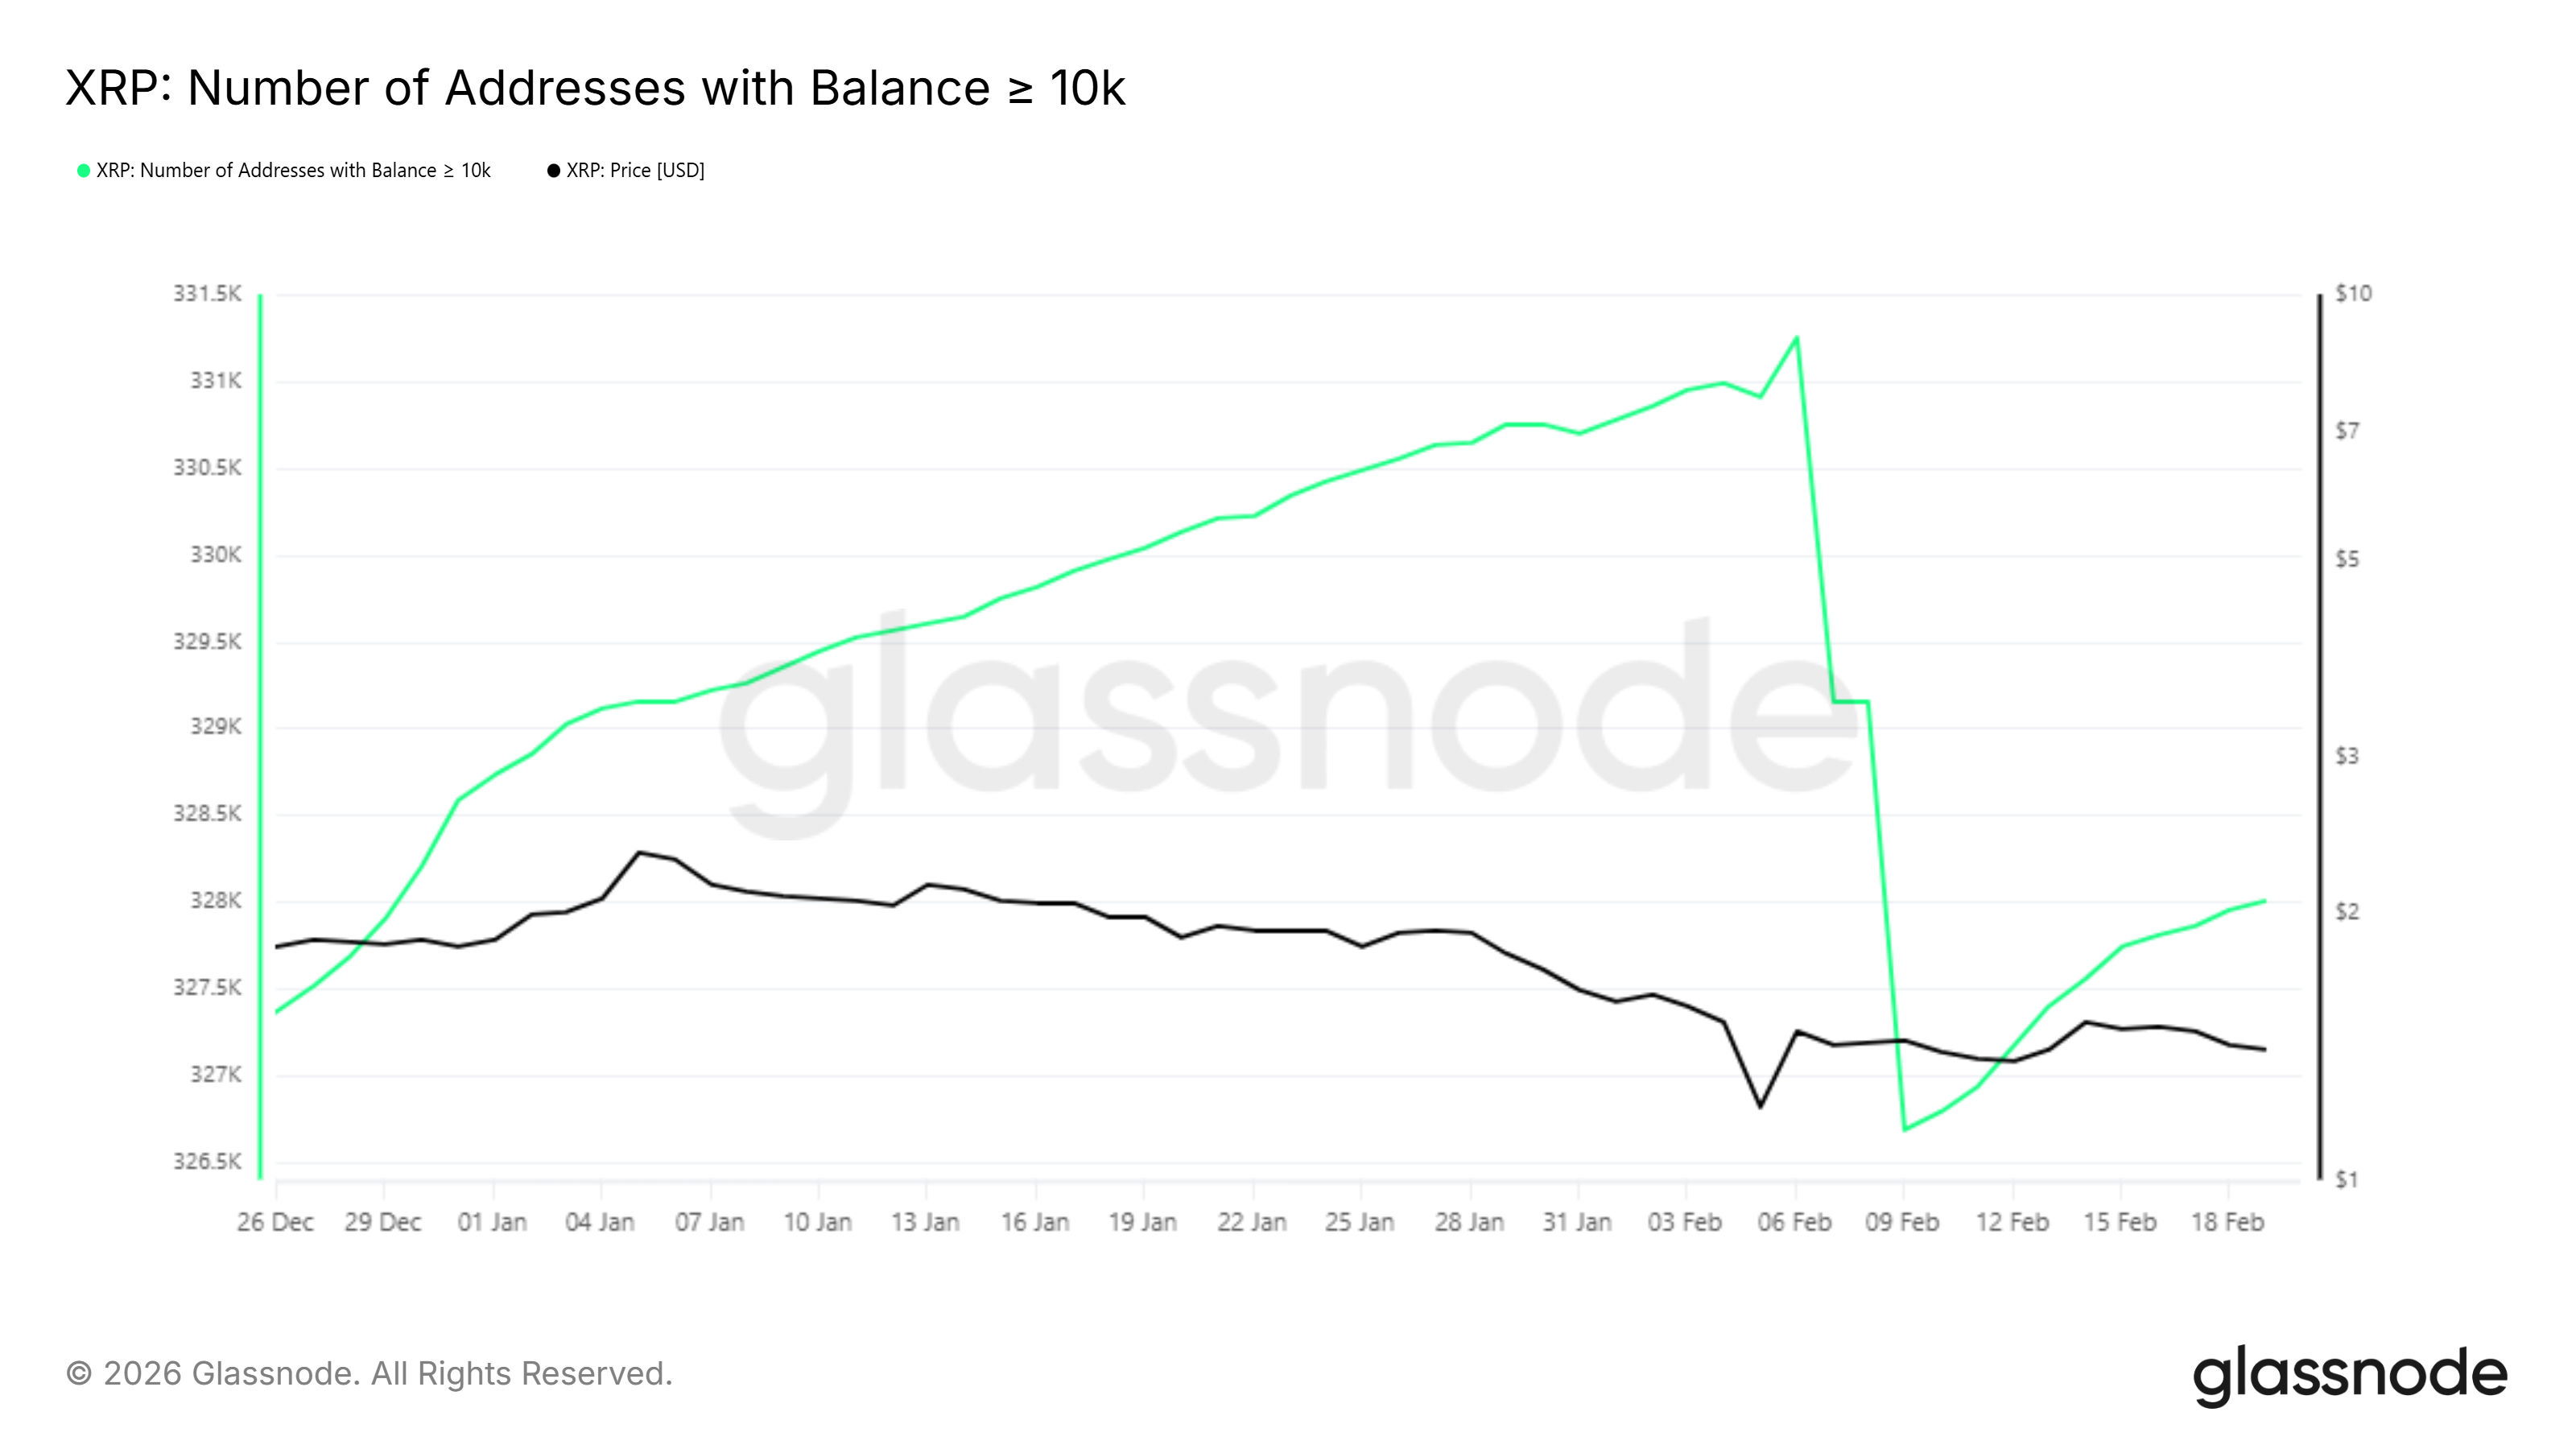
On-chain metrics offer additional insight into shifting investor behavior. The number of addresses holding at least 10,000 XRP has begun to stabilize after a notable decline. This cohort represents mid-sized holders rather than large whales.
The recent uptick follows the largest drop in such addresses since December 2020. Historically, renewed participation from these holders comes after accumulation by larger XRP investors. Rising conviction among smaller participants often reflects a cascading improvement in confidence in price stability and potential upside from top holders.
XRP Price Aims At Ending Downtrend
XRP is trading at $1.42 at the time of writing, holding above the critical $1.36 support level. Maintaining this base is essential for preserving near-term bullish prospects. However, the asset remains capped beneath a descending trendline that has rejected price advances three times this year.
While improving MVRV readings and addressing growth support a constructive outlook, confirmation remains pending. A decisive move above $1.57 would be required to validate a breakout. Flipping this level into support would clear the $1.50 resistance and break the established downtrend structure. Such a shift could open a path toward $1.91, marking a significant recovery extension.
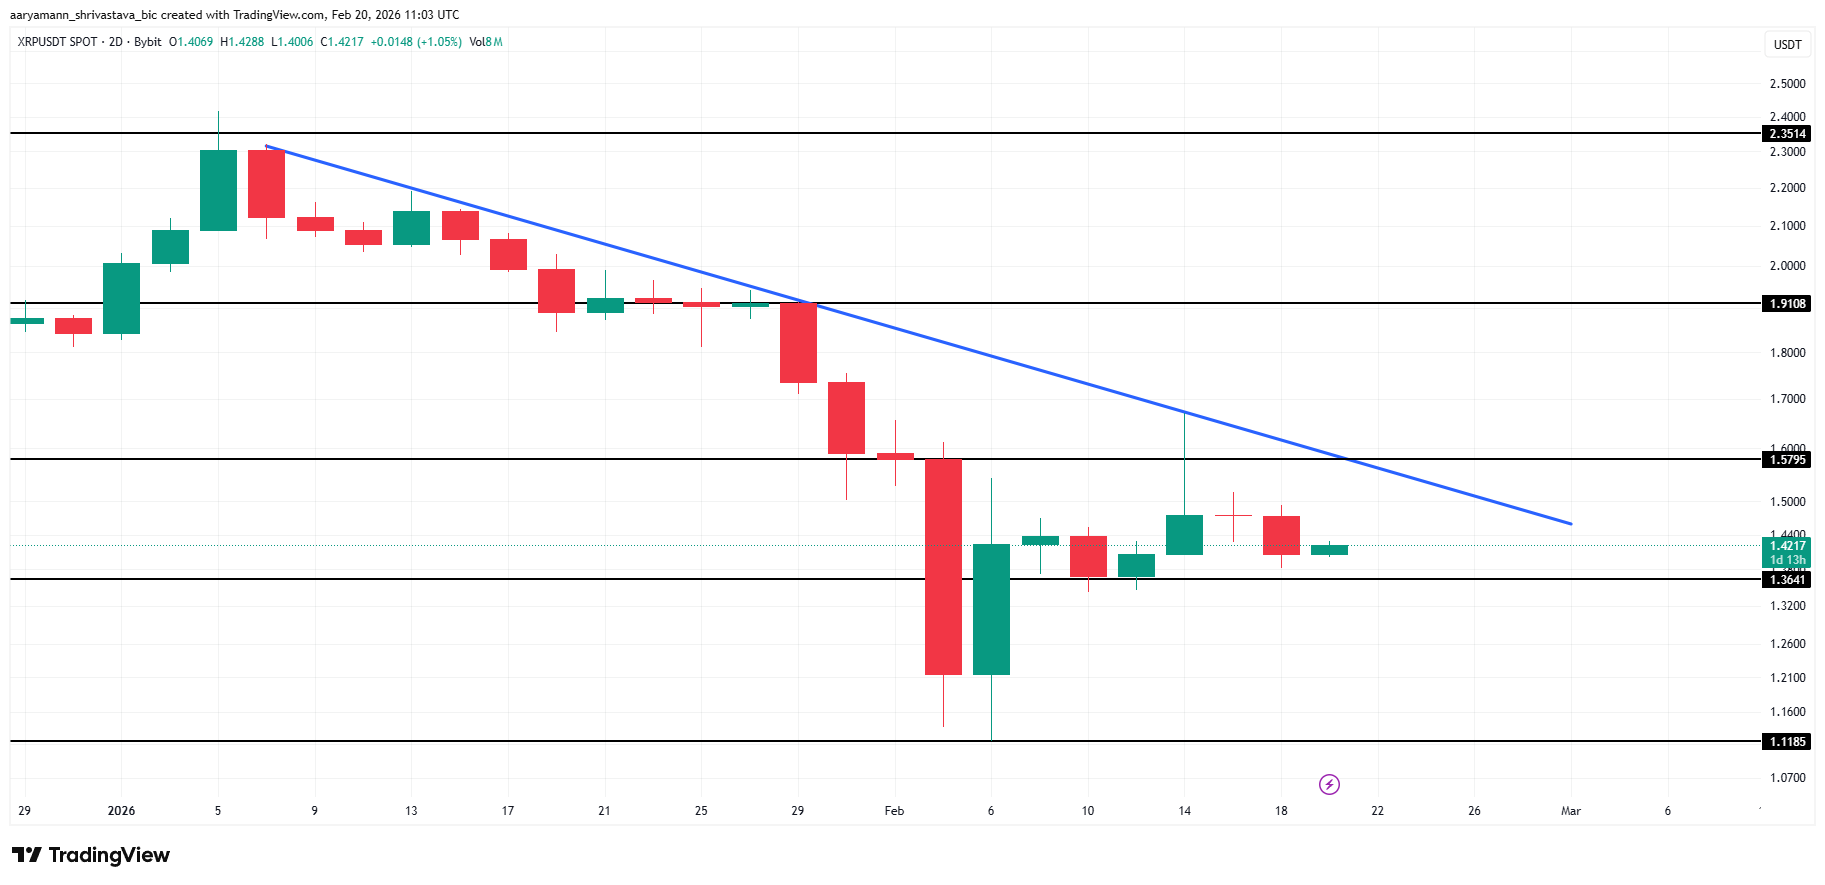
If bullish momentum weakens, XRP may continue consolidating within its current range. A breakdown below $1.36 would shift the structure bearish. In that scenario, downside risk could extend toward $1.11, invalidating the recovery thesis and reinforcing selling pressure in the broader XRP price trend.

Gavin Hunt Explains Why Olisa Ndah Will Miss Cup Debut

Top Android AI photo and video editor exposes nearly two million user images and videos

Why 2026 Financial Crisis Could Trigger World War 3 (Financial History Explained)


-

 Video4 days ago
Bitcoin: We’re Entering The Most Dangerous Phase
-

 Tech6 days ago
Luxman Enters Its Second Century with the D-100 SACD Player and L-100 Integrated Amplifier
-

 Crypto World3 days ago
Can XRP Price Successfully Register a 33% Breakout Past $2?
-

 Sports4 days ago
GB's semi-final hopes hang by thread after loss to Switzerland
-

 Video16 hours ago
XRP News: XRP Just Entered a New Phase (Almost Nobody Noticed)
-
 Tech4 days ago
The Music Industry Enters Its Less-Is-More Era
-

 Business3 days ago
Infosys Limited (INFY) Discusses Tech Transitions and the Unique Aspects of the AI Era Transcript
-

 Video3 days ago
Financial Statement Analysis | Complete Chapter Revision in 10 Minutes | Class 12 Board exam 2026
-

 Entertainment2 days ago
Kunal Nayyar’s Secret Acts Of Kindness Sparks Online Discussion
-

 Tech2 days ago
Retro Rover: LT6502 Laptop Packs 8-Bit Power On The Go
-
 Crypto World7 days ago
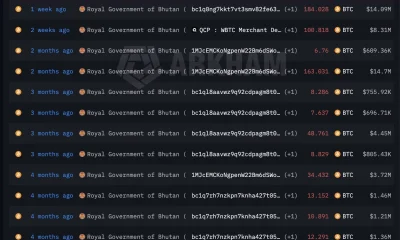
Bhutan’s Bitcoin sales enter third straight week with $6.7M BTC offload
-
 Sports2 days ago
Clearing the boundary, crossing into history: J&K end 67-year wait, enter maiden Ranji Trophy final | Cricket News
-

 Entertainment2 days ago
Dolores Catania Blasts Rob Rausch For Turning On ‘Housewives’ On ‘Traitors’
-

 Business2 days ago
Tesla avoids California suspension after ending ‘autopilot’ marketing
-
 NewsBeat5 days ago
The strange Cambridgeshire cemetery that forbade church rectors from entering
-

 Crypto World2 days ago
WLFI Crypto Surges Toward $0.12 as Whale Buys $2.75M Before Trump-Linked Forum
-
 NewsBeat5 days ago
Man dies after entering floodwater during police pursuit
-

 Crypto World21 hours ago
83% of Altcoins Enter Bear Trend as Liquidity Crunch Tightens Grip on Crypto Market
-

 NewsBeat6 days ago
UK construction company enters administration, records show
-

 Politics3 days ago
Eurovision Announces UK Act For 2026 Song Contest