

Crypto World
Bitcoin can survive 72% of the world’s submarine cables being cut, but a targeted attack on five hosting providers could cripple it
Bitcoin’s network has been running nonstop since 2009. The question nobody had rigorously answered until now is what it would actually take to break it.
Researchers at the Cambridge Centre for Alternative Finance last week published the first longitudinal study of Bitcoin blockchain’s resilience to physical infrastructure disruption, analyzing 11 years of peer-to-peer network data against 68 verified submarine cable fault events.
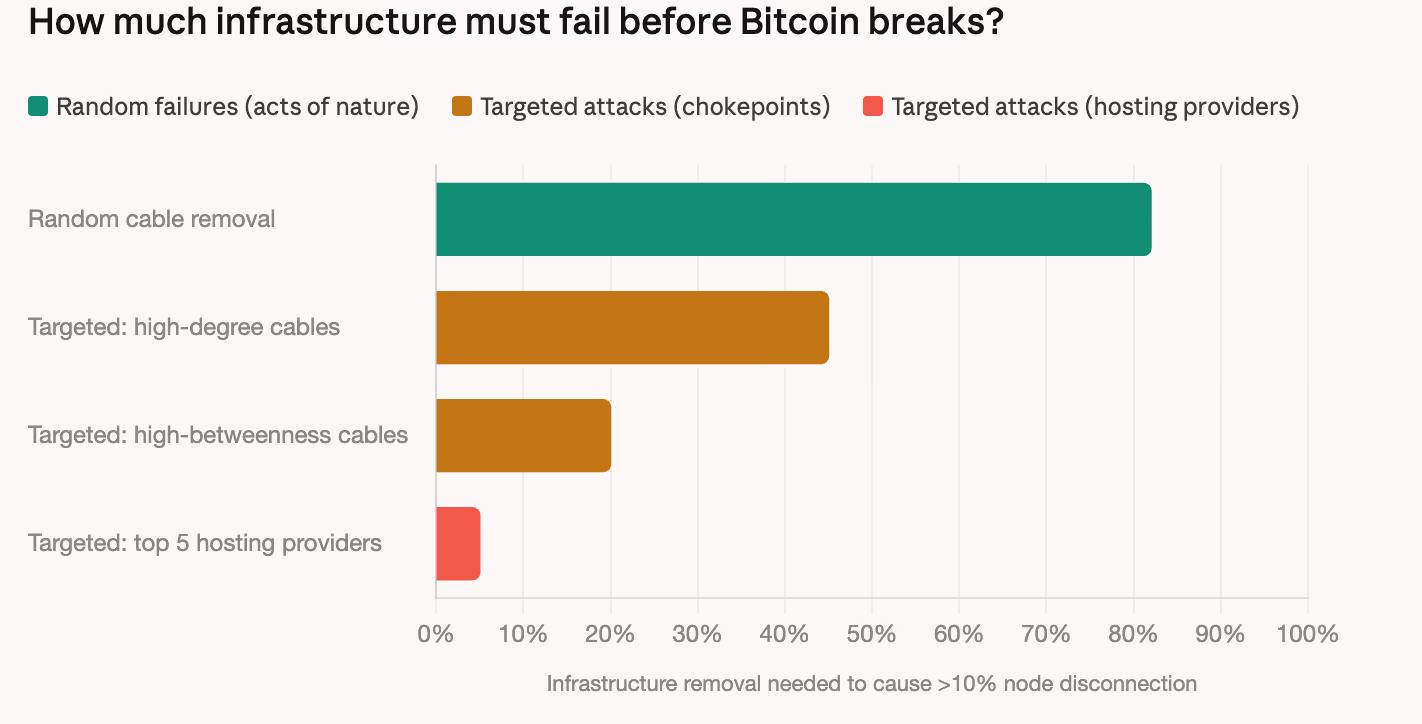
The headline finding is that between 72% and 92% of the world’s inter-country submarine cables would need to fail simultaneously before Bitcoin experiences significant node disconnection.
In a world where the Strait of Hormuz is currently disrupted and infrastructure vulnerability is front of mind, the study provides the first empirical benchmark for how hard Bitcoin actually is to knock offline.
The numbers tell a story of a network that degrades gracefully rather than collapsing catastrophically. The researchers ran 1,000 Monte Carlo simulations per scenario across the full dataset and found that random cable failures barely register.
Over 87% of the 68 real-world cable fault events they studied caused less than 5% node impact. The largest single event, when seabed disturbances off Côte d’Ivoire damaged 7-8 cables simultaneously in March 2024, knocked out 43% of regional nodes but affected only 5-7 bitcoin nodes globally, roughly 0.03% of the network.
The correlation between cable failures and bitcoin’s price was essentially zero, at -0.02. Infrastructure disruptions are invisible against daily price volatility.

But the paper’s most important finding is the asymmetry between random and targeted attacks.
While random cable failures require 72-92% removal to cause damage, a targeted attack on the cables with the highest betweenness centrality, the ones that serve as chokepoints between continents, drops that threshold to 20%.
And targeting the top five hosting providers by node count, Hetzner, OVH, Comcast, Amazon, and Google Cloud, requires removing just 5% of routing capacity to achieve the same impact.
That’s a fundamentally different threat model. Random failures are acts of nature. Targeted attacks are acts of state, coordinated regulatory shutdowns of hosting providers or deliberate severing of critical cable routes. The study essentially maps two very different adversaries: one Bitcoin can easily survive, and one that remains a credible risk.
How threats to bitcoin change over time
The paper tracks how resilience evolved over time, and the trajectory isn’t a straight line. Bitcoin was most resilient in its early years from 2014-2017, when the network was geographically diverse and the critical failure threshold sat around 0.90-0.92.
Resilience declined sharply during 2018-2021 as the network grew rapidly but concentrated geographically, hitting its lowest point of 0.72 in 2021 during peak mining concentration in East Asia. The China mining ban in 2021 forced redistribution, and resilience partially recovered to 0.88 in 2022 before settling at 0.78 in 2025.
The TOR finding is the one that challenges conventional thinking. As of 2025, 64% of Bitcoin nodes use TOR, making their physical location unobservable.
The assumption has been that this inability to observe might hide fragility, that if TOR nodes turned out to be geographically concentrated, the network could be more vulnerable than it appears.
The Cambridge researchers built a four-layer model to test this and found the opposite. TOR relay infrastructure is heavily concentrated in Germany, France, and the Netherlands, countries with extensive submarine cable and land border connectivity.
An attacker trying to disrupt TOR relay capacity by cutting cables faces a compound problem because those countries are among the hardest to disconnect. The four-layer model consistently showed higher resilience than the clearnet-only baseline, with TOR adding between 0.02 and 0.10 to the critical failure threshold.

The paper frames this as “adaptive self-organization.” TOR adoption surged after censorship events like Iran’s internet shutdown in 2019, the Myanmar coup in 2021, and the China mining ban.
The Bitcoin community shifted toward censorship-resistant infrastructure without any central coordination, and that shift happened to also make the network physically harder to disrupt.
With the Strait of Hormuz effectively closed and a regional war disrupting infrastructure across the Middle East, the question of what happens to Bitcoin if submarine cables get damaged isn’t theoretical.
The study suggests the answer is probably nothing, unless someone is deliberately targeting the specific cables and hosting providers that matter most.

TLDR
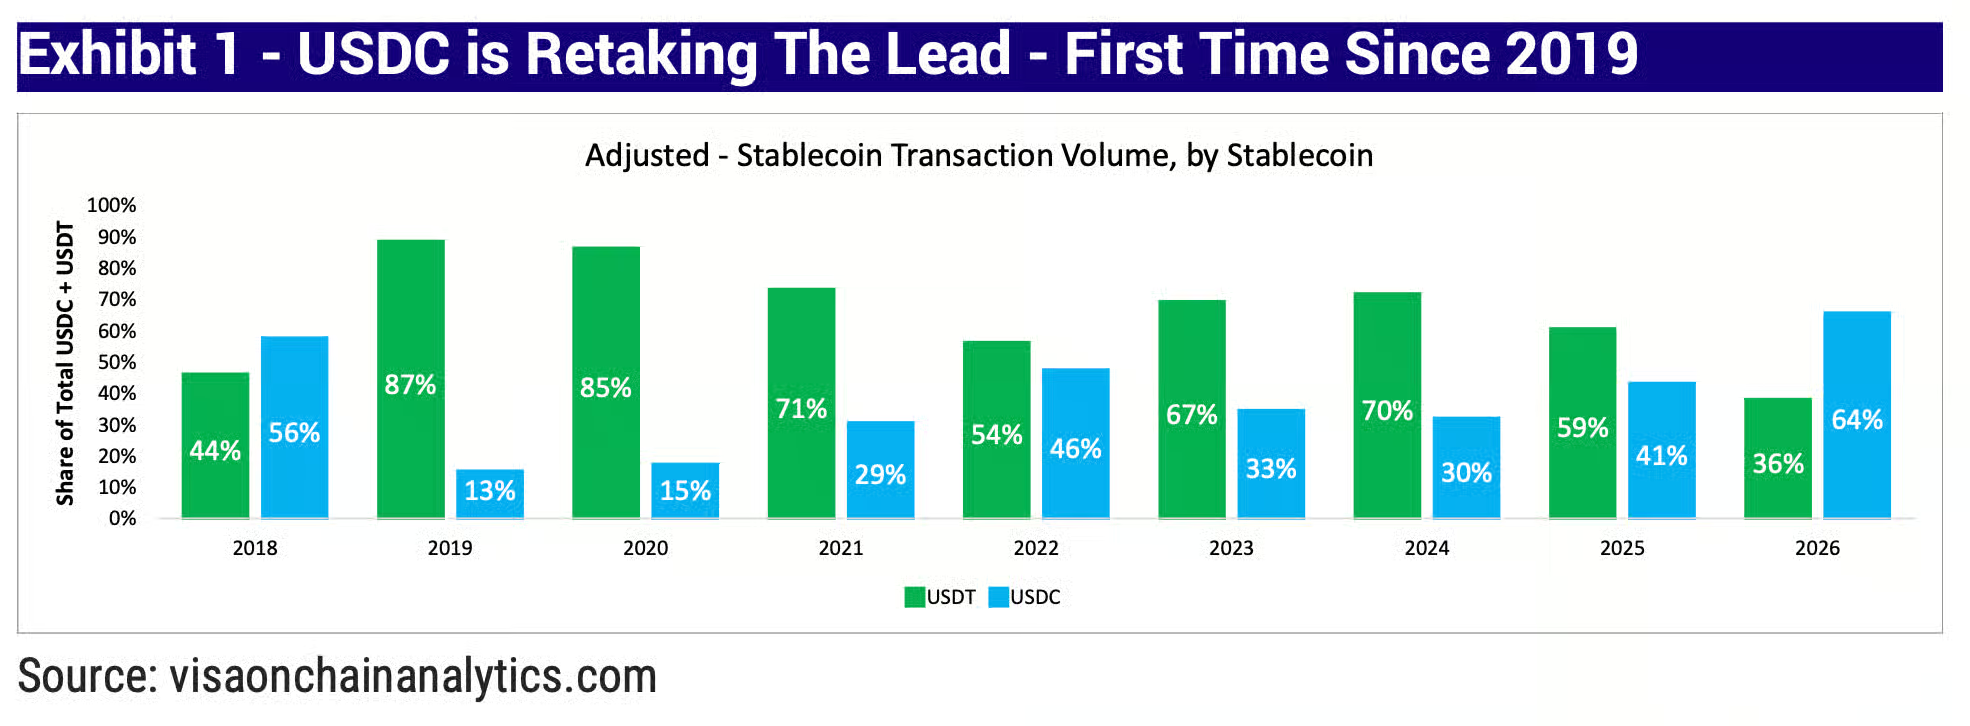
- USDC commands 64% of adjusted transaction volume market share, surpassing USDT in year-to-date metrics per Mizuho analysis
- First instance of USDC volume leadership since 2019
- USDT maintains market capitalization dominance with $184 billion versus USDC’s $79 billion
- Mizuho elevates Circle stock price target from $100 to $120
- According to Mizuho analysts, transaction volume rather than market cap will determine the ultimate stablecoin leader
Tether’s USDT has been surpassed by Circle’s USDC in adjusted transaction volume on a year-to-date basis, based on research findings published by Mizuho, a Japanese investment bank, on Friday, March 13.
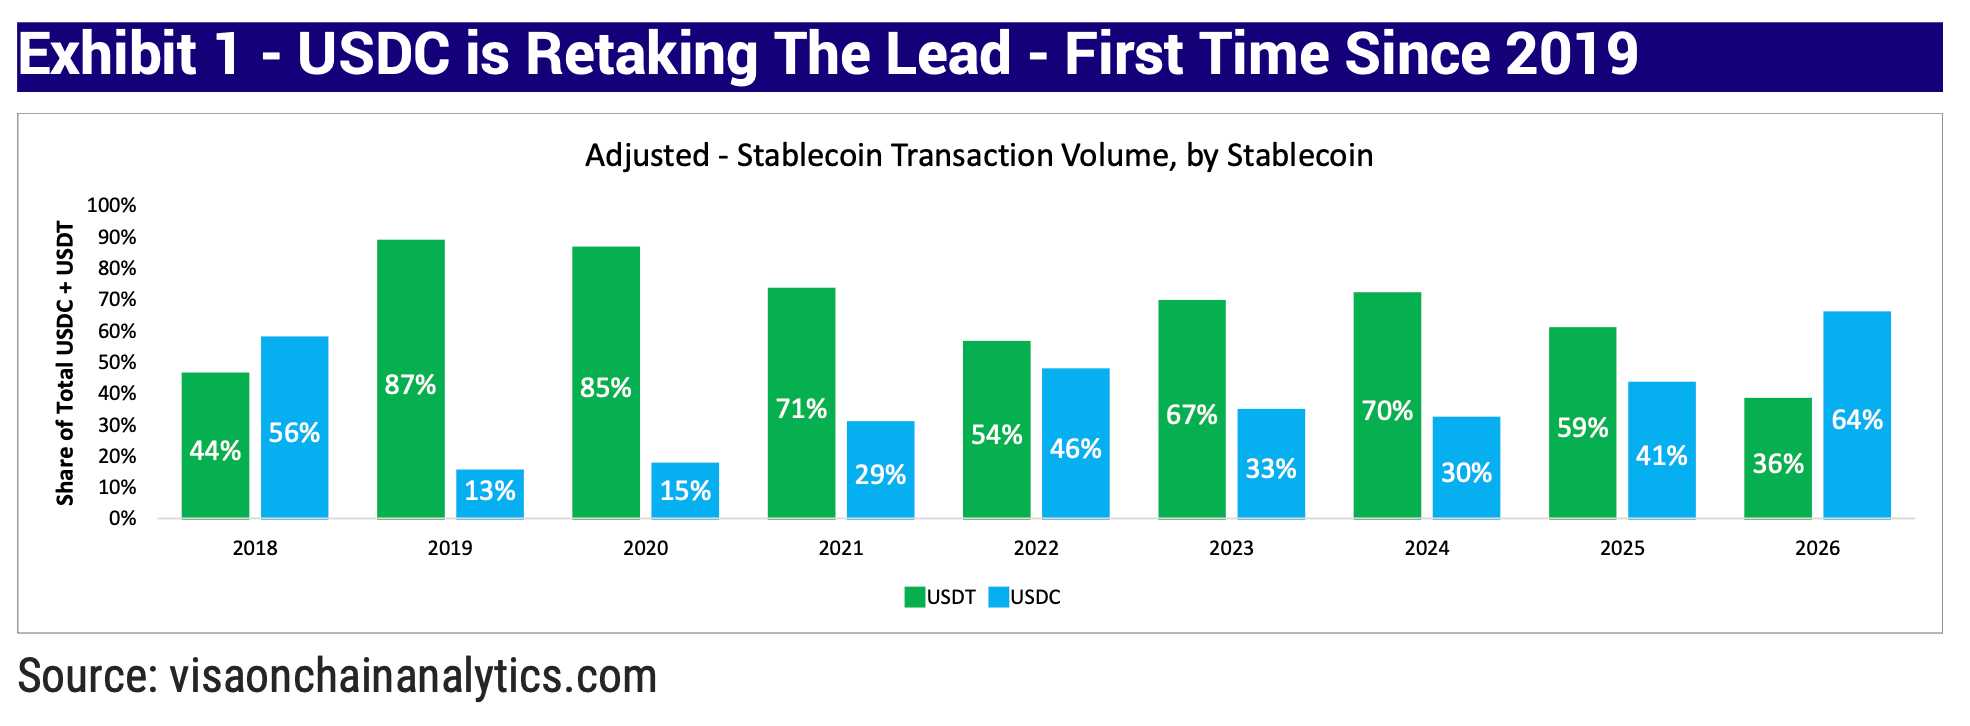
This development represents USDC’s first volume leadership position since 2019, bringing an end to USDT’s extended reign in this metric.
According to Mizuho’s data, USDC processed approximately $2.2 trillion in adjusted transaction volume year-to-date, while USDT recorded $1.3 trillion during the identical timeframe.
These figures translate to USDC controlling 64% of the adjusted volume when comparing the two leading stablecoins, per Mizuho’s calculations.
Mizuho’s methodology defines “adjusted volume” as transactions involving centralized exchanges, decentralized exchanges, and other identified entities — or participants who haven’t exceeded specific activity benchmarks. Essentially, transactions that appear to represent genuine person-to-person or institutional value transfers.
The analysts cited examples such as corporate supplier payments, user wagers on platforms like Polymarket, and capital flows between centralized exchanges and DeFi protocols.
What the Volume Shift Means
According to Mizuho analysts, transaction volume provides superior predictive value compared to market capitalization when forecasting long-term stablecoin dominance.
“We believe that longer term, the stablecoin winner will be the one mostly used in everyday economic activity, rather than just the highest market cap,” Mizuho wrote.
Market capitalization leadership remains with USDT. Tether’s stablecoin maintains approximately $184 billion in total value, substantially ahead of USDC’s $79 billion.
Circle completed its public listing on the New York Stock Exchange in June 2025. The company’s stock price exhibited minimal reaction to the Mizuho research release.
The investment bank upgraded its Circle price target from $100 to $120 within the same research publication.
Circle Stock and the Regulatory Backdrop
In the nation’s capital, proposed legislation affecting the stablecoin sector continues to face obstacles.
The CLARITY Act successfully cleared the House of Representatives but has encountered delays in the Senate. Discussions surrounding stablecoin yield distribution, ethics guidelines, and tokenized securities have impeded legislative advancement.
Senate Majority Leader John Thune indicated on Thursday that the Senate would focus on voting requirement legislation ahead of digital asset market structure bills. He projected that the market structure legislation would not advance before April.
The legislative gridlock contributes additional uncertainty to the comprehensive stablecoin regulatory environment as Circle’s shares maintain NYSE trading activity.
Based on Mizuho’s research published March 13, 2026, USDC controls 64% of adjusted volume among the two dominant stablecoins, marking its first leadership position since 2019.

Crypto World
Bitcoin (BTC) Price: Stabilizes at $70K Following Iran Strike as ETF Inflows Surge Past $1.9B

Key Takeaways
- Bitcoin maintains support near $70,000, experiencing a 0.7% decline over 24 hours following U.S. military action on Iran’s Kharg Island
- Weekly performance shows a 4.2% increase — marking BTC’s most substantial seven-day rally since September 2025
- The critical resistance zone between $73,000–$74,000 has turned back Bitcoin on four separate occasions within a two-week period
- Bitcoin ETF inflows have surged to $1.9 billion across a three-week span, with March accounting for $1.34 billion of that total
- Federal Reserve’s upcoming March 17–18 meeting has market participants analyzing potential shifts in monetary policy direction
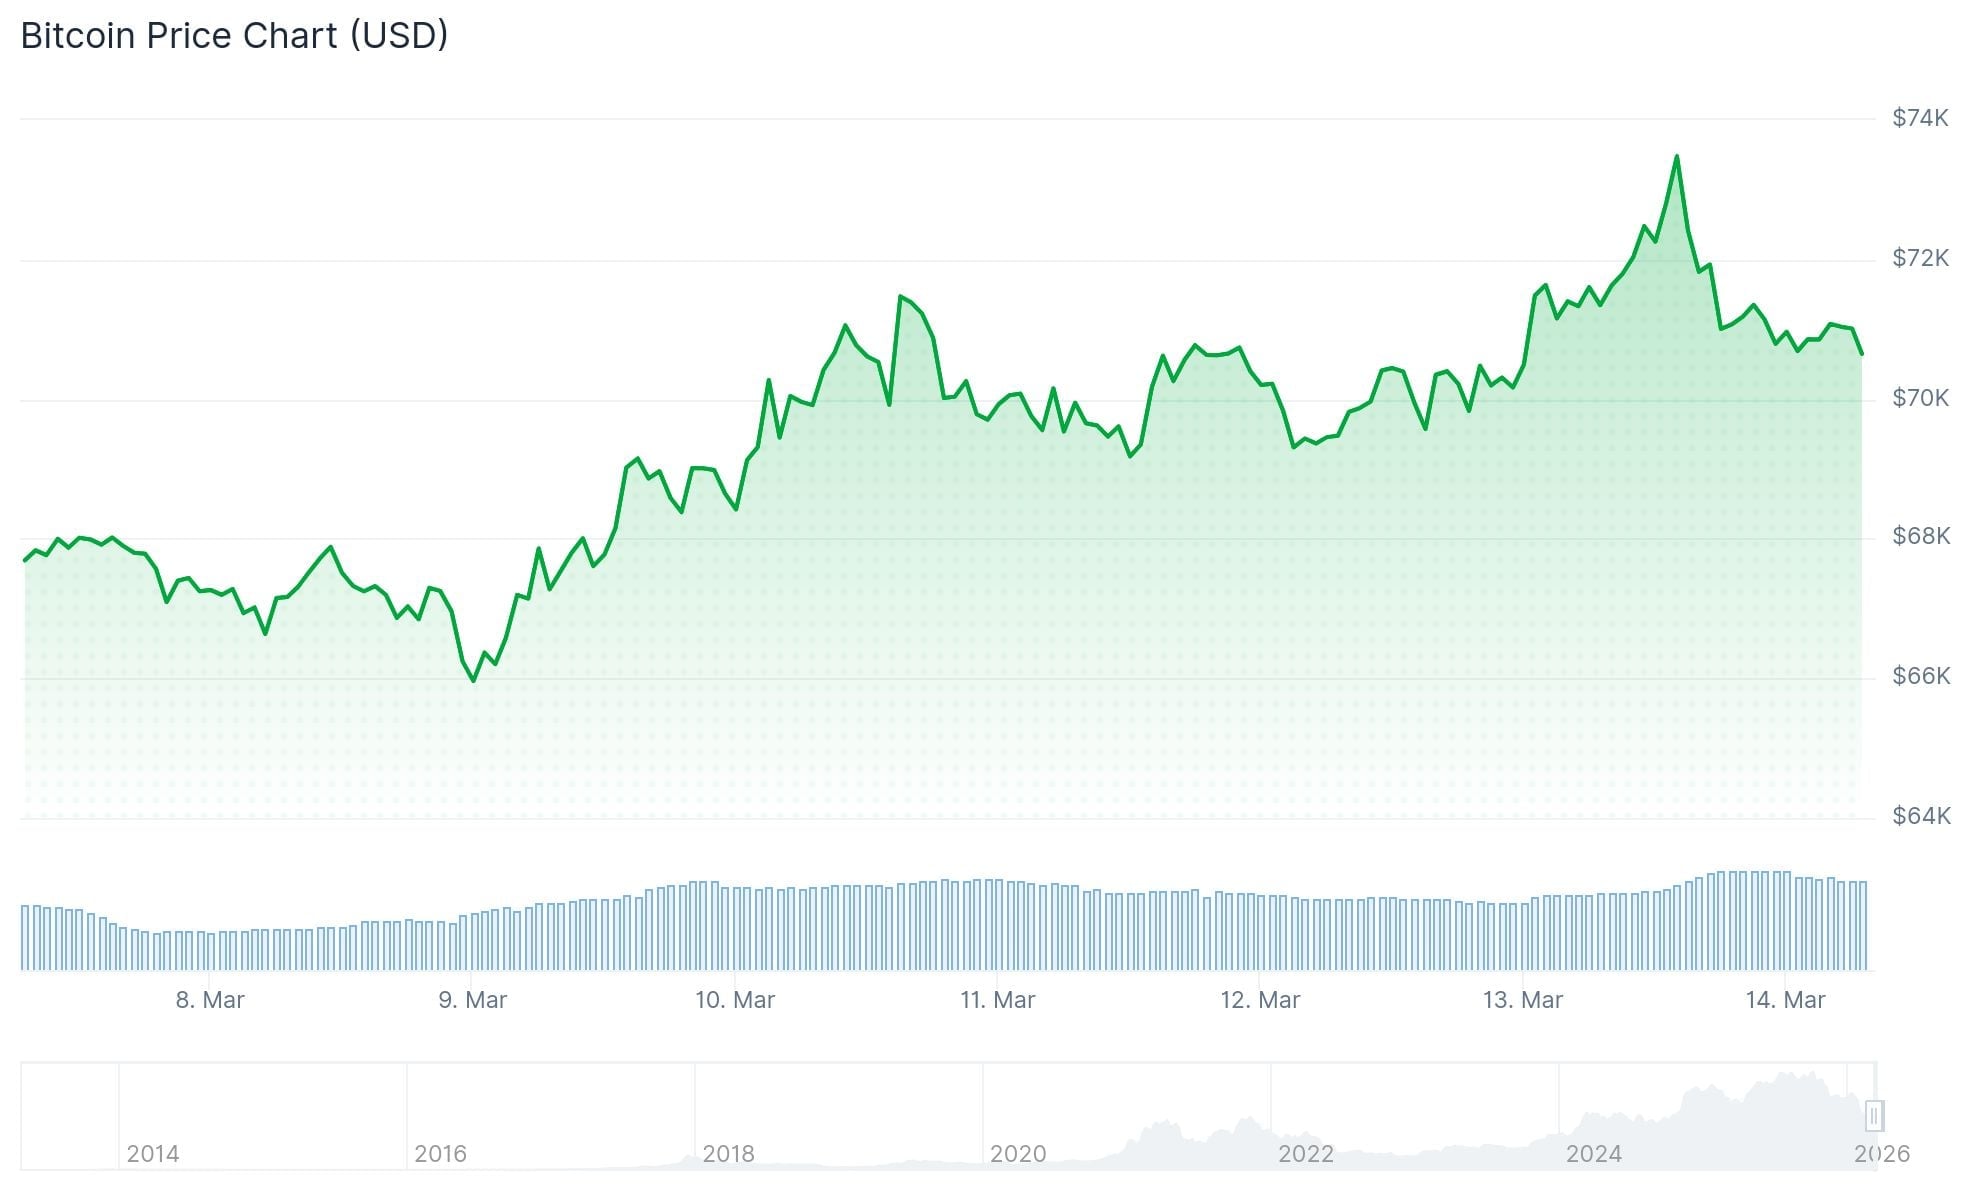
Bitcoin continues to maintain its position around the $70,000 threshold this Saturday, March 14, showing resilience despite escalating geopolitical tensions triggered by U.S. airstrikes targeting Kharg Island, Iran’s crucial oil export hub.
Following the military action, BTC experienced a 3.5% decline from Friday’s peak of $73,838. While the downturn was notable, it remained relatively controlled within the broader market context.
Remarkably, Bitcoin’s current valuation exceeds its price point from when Middle East hostilities initially commenced two weeks ago.
Weekly performance metrics reveal BTC climbing 4.2%. Ethereum advanced 5.5% to reach $2,090. Dogecoin registered a 5% increase. Solana moved 4.2% higher to $88. BNB appreciated 4.5% to $655. Major cryptocurrencies across the board posted positive weekly returns.
During the conflict’s initial phase, cryptocurrency markets reacted sharply to each development. Currently, market participants have seemingly developed a predictable response pattern: military strikes occur, crude oil prices surge, Bitcoin experiences temporary weakness — followed by subsequent recovery.
This cyclical behavior has occurred with sufficient frequency that immediate panic-selling has diminished considerably.
Resistance at the $73,000–$74,000 Zone Persists
Bitcoin has encountered rejection within the $73,000–$74,000 price band on four distinct occasions during the past two weeks. This level continues representing the critical resistance threshold commanding trader attention.
Should BTC establish firm support above $74,000, liquidation analytics indicate approximately $1.9 billion in leveraged long positions concentrated immediately above $75,000 — creating a potential price magnet.
Beyond that threshold, the $76,000 to $80,000 range contains roughly $2 billion in sell-side liquidity distributed across the $4,000 span.
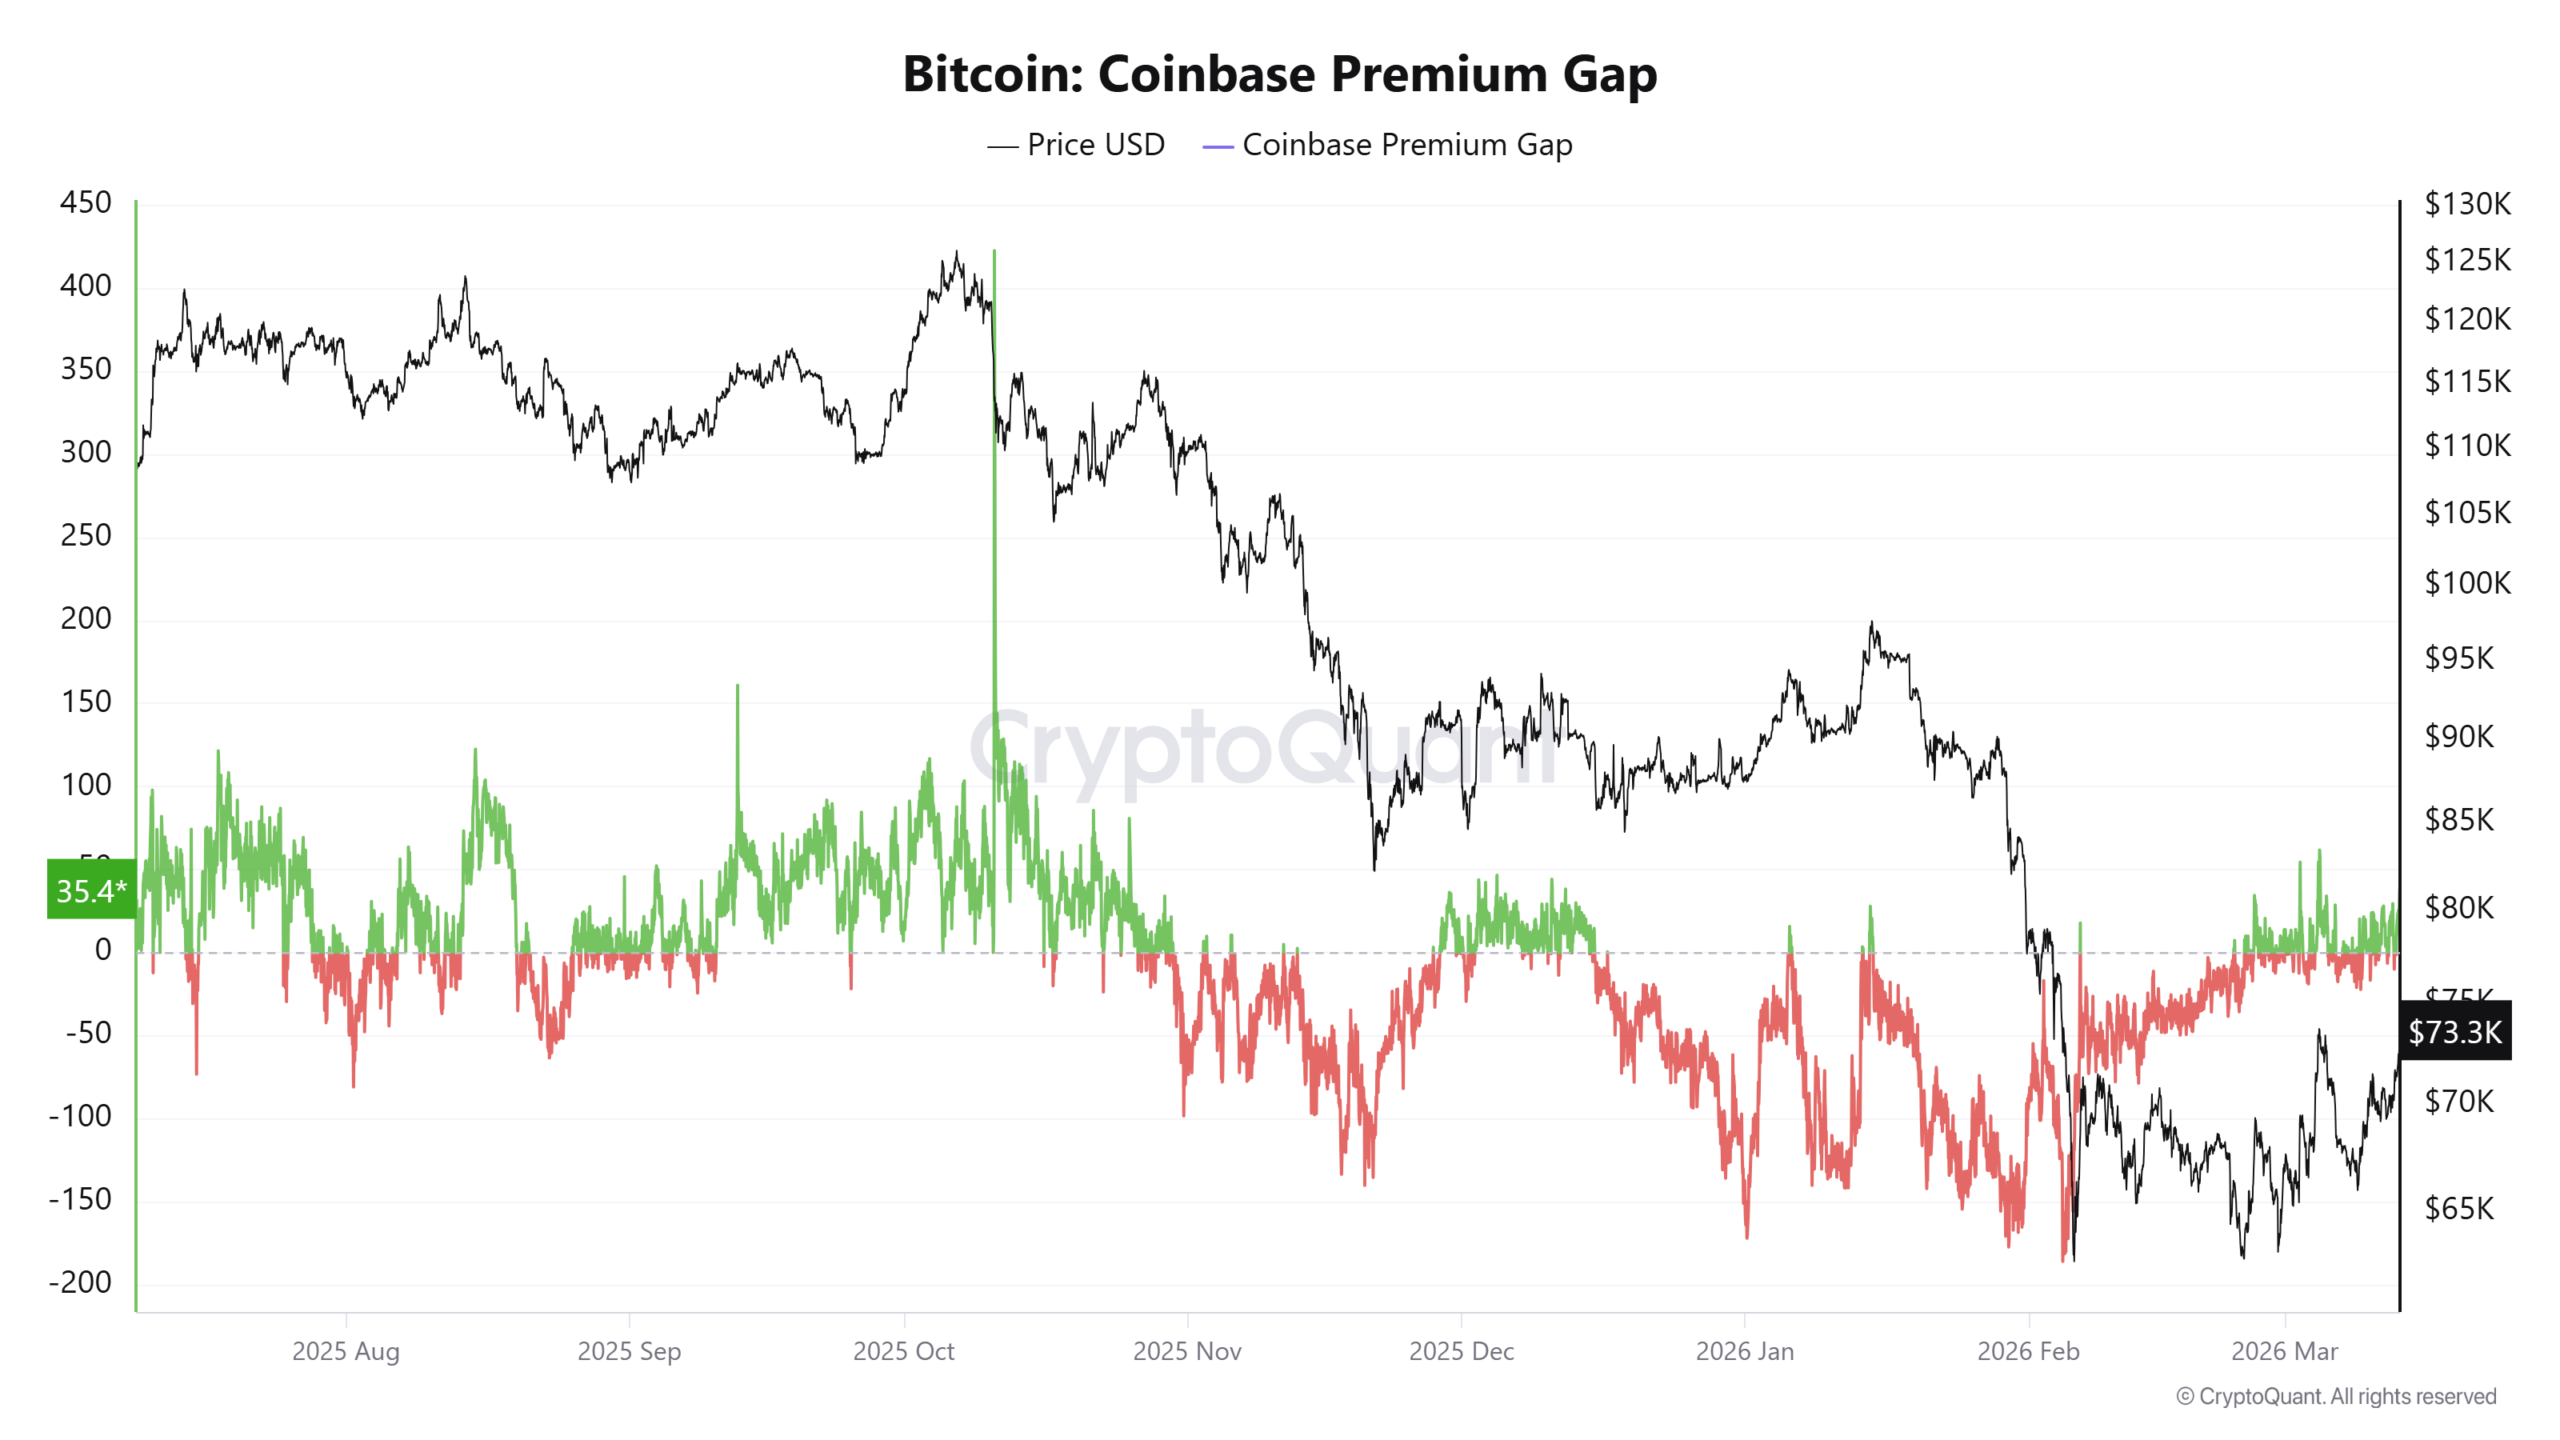
The Coinbase premium indicator has shifted positive for the first time in approximately ten weeks, registering +35.4. This development indicates strengthening buying activity from U.S.-based spot market participants, marking a reversal from the extended selling pressure observed throughout much of 2026.
Exchange-Traded Fund Demand and Institutional Accumulation Drive Support
Spot Bitcoin ETF net capital inflows have surpassed $1.9 billion during the previous three-week period. March independently has attracted $1.34 billion, positioning ETFs for their first monthly net positive performance since October.
Strategy expanded its holdings by 11,042 BTC this week utilizing its STRC financing mechanism, contributing sustained market demand.
Total liquidations reaching $371 million during the past 24 hours demonstrated activity across both trading directions. Short position liquidations dominated at $207 million compared to $163 million from long positions.
Trump communicated via Truth Social that he deliberately avoided targeting Iran’s oil infrastructure “for reasons of decency” while warning he would “immediately reconsider” should Iran persist in obstructing the Strait of Hormuz.
Iranian officials responded that any assault on energy installations would provoke retaliatory strikes against U.S.-affiliated facilities throughout the region.
The Federal Reserve convenes March 17–18. CME FedWatch tool indicates a 95%+ probability of maintaining current rates at 3.5%–3.75%, though market participants will scrutinize the dot plot projections and Chair Powell’s press conference remarks for any indication of evolving rate trajectory.
Crypto World
Ethereum (ETH) Price: Strong On-Chain Signals Emerge as Whales Accumulate and Staking Reaches New Heights

Key Takeaways
- Accumulation wallets now hold 6.5 million more ETH than in January, representing a 32% increase
- Total staked ETH reached an unprecedented 37.85 million, accounting for over 30% of circulating supply
- Major whale address deployed $152.81 million into ETH purchases during a three-day window
- Spot Ethereum ETFs in the United States saw $185.4 million in consecutive net inflows over three sessions
- Breaking above $2,200 resistance could trigger a rally toward $2,600 and beyond
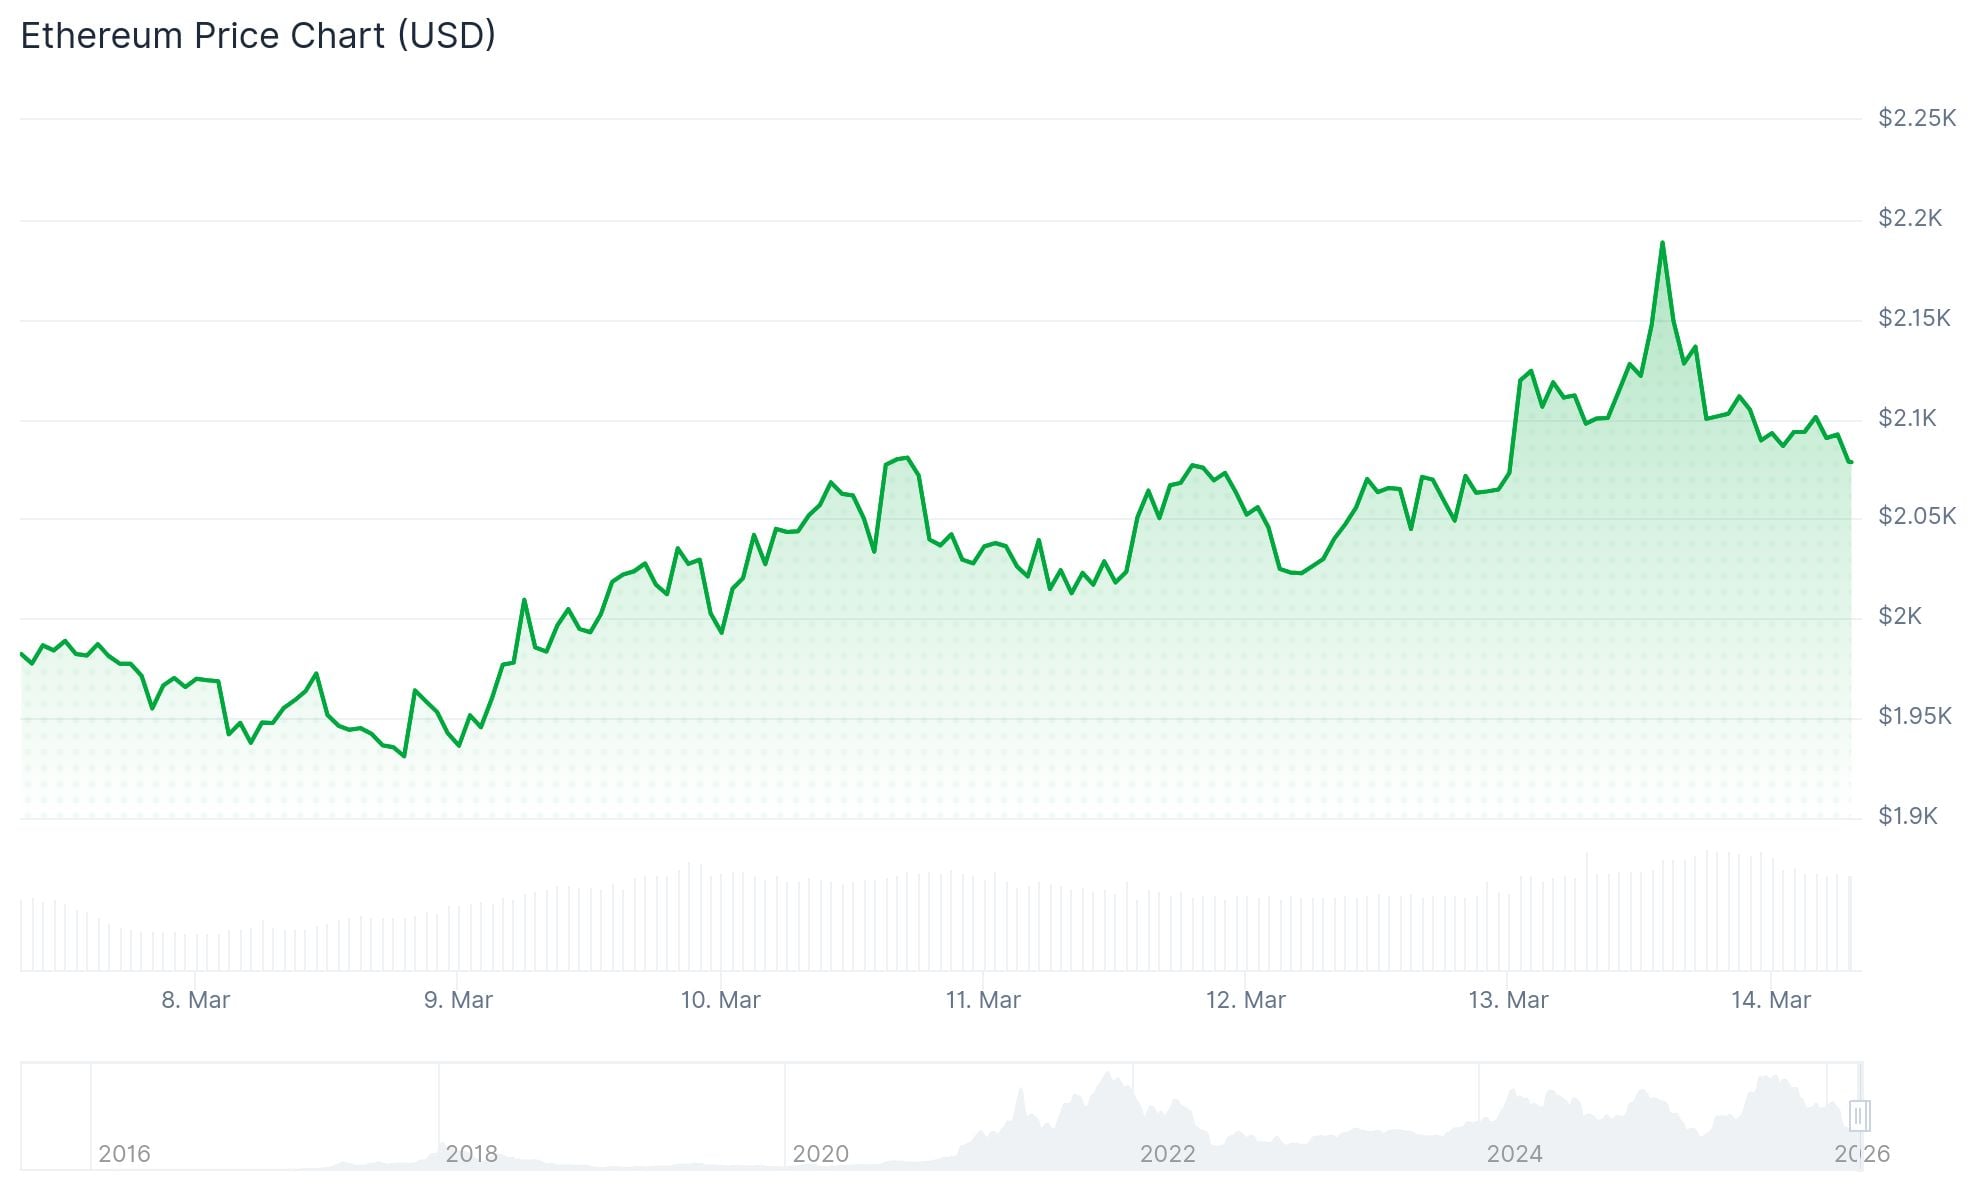
Ethereum currently trades in the $2,078–$2,090 range, representing a roughly 30% decline from its yearly opening price of $2,990. The current trading zone sits immediately beneath a critical resistance area spanning $2,100 to $2,200 that has prevented upward momentum throughout the past month.
While price action appears bearish on the surface, blockchain metrics reveal a contrasting narrative beneath.
ETH balance in accumulation wallets — defined as addresses with zero selling history — has surged from 20.1 million to 26.55 million ETH since the start of January. This represents an addition of 6.5 million ETH, marking a 32% expansion.
Daily additions to these non-selling addresses peaked at 1.14 million ETH in November 2025. Throughout 2026, the average daily inflow has maintained at 200,000 ETH, with Thursday witnessing a notable surge exceeding 350,000 ETH.
Staking Milestone and Large-Scale Accumulation
The amount of staked ETH hit an unprecedented peak of 37.85 million this week. This milestone represents more than 30% of Ethereum’s total circulating supply. Increasing staked supply withdraws tokens from active circulation and demonstrates conviction in long-term holding strategies.
ETH balances on centralized exchanges dropped to a multi-year bottom of 3.46 million, creating additional pressure on available liquidity.
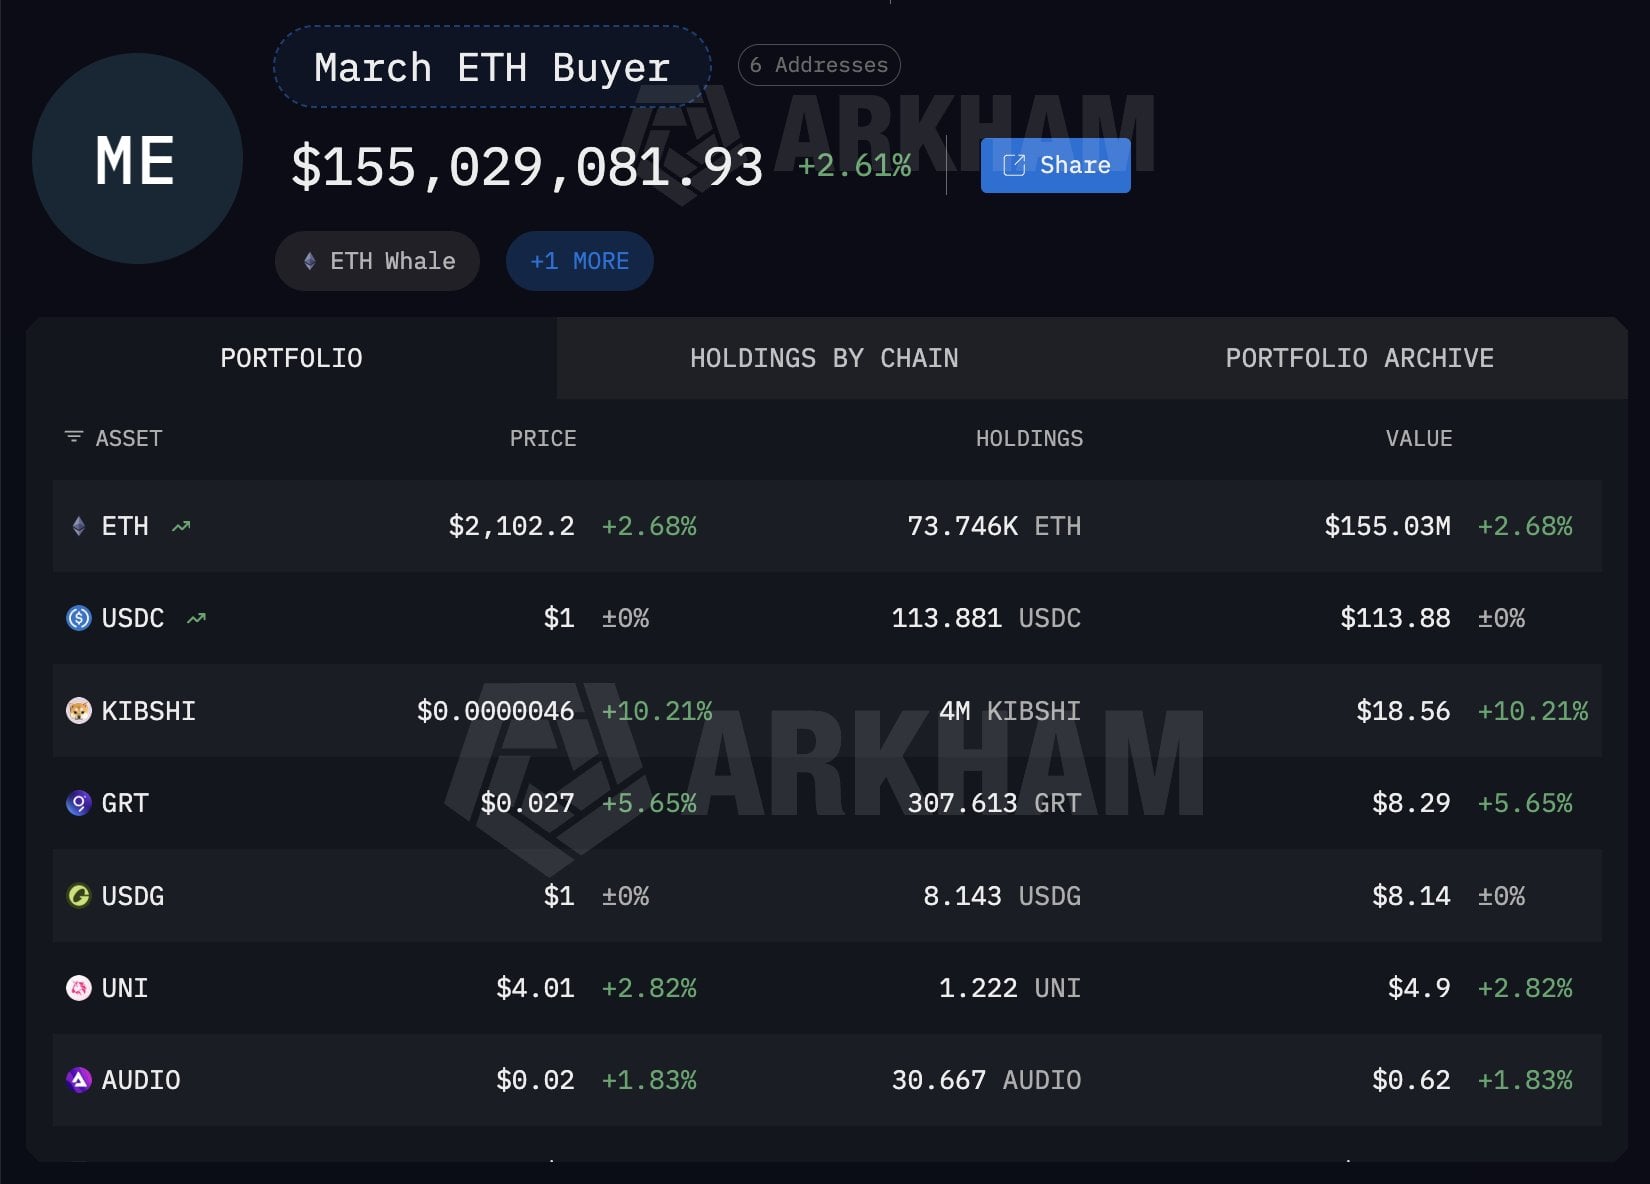
A substantial wallet address, labeled “0x8E3” on Arkham’s blockchain tracking platform, accumulated roughly $152.81 million worth of ETH during a three-day period. The entity controlling this wallet remains unidentified. Possibilities include a high-net-worth individual, institutional trading desk, or corporate treasury.
Large holder addresses controlling between 10,000 and 100,000 ETH increased their collective holdings by 540,000 ETH throughout the previous five trading sessions, based on CryptoQuant’s tracking data.
Spot Ethereum ETFs in the United States registered $185.4 million in cumulative net inflows spanning three consecutive trading days from Tuesday through Thursday, according to SoSoValue metrics. The ETH Coinbase Premium Index simultaneously climbed to levels not observed since early December.
Critical Resistance and Support Zones
Ethereum’s open interest expanded to 13.67 million ETH on Friday, marking the highest reading since January 30. Funding rates have oscillated between positive and negative territory throughout this timeframe.
ETH momentarily pushed above $2,166 before encountering rejection at the 50-day exponential moving average. Bulls must decisively breach that barrier and subsequently target $2,370, with $2,750 as the next objective.
Trading analyst Daan Crypto Trades highlighted that the $2,100–$2,200 zone has functioned as a pivotal price region throughout the past two years. When ETH successfully reclaimed this territory in May 2025, it surged 24% within a week. The June 2025 breakout catalyzed a massive 126% rally culminating at $4,950.
On the bearish side, the $1,750–$1,850 range represents crucial support that must hold. A decisive breakdown below this zone could potentially drive ETH toward $1,000, based on technical analyst projections. The Relative Strength Index currently registers at 52 with an ascending Stochastic Oscillator positioned in the mid-60s.
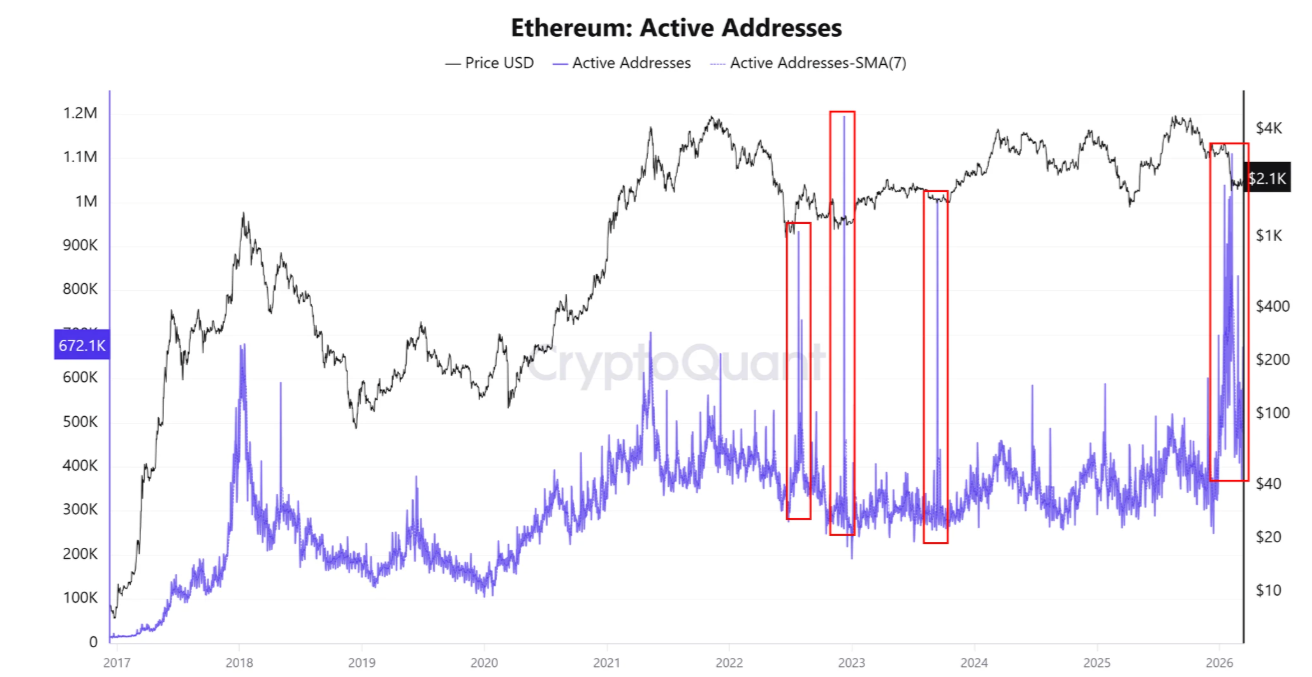
Daily active addresses climbed to 1.1 million during February, the highest reading since December 2022, featuring a dramatic 7-day surge of 80% to reach 672,170.

TLDR:
- Altcoin dominance breakout nears confirmation after five years of downtrend compression and strengthening higher-low structure across the macro chart.
- A bullish MACD crossover on the higher timeframe reflects improving momentum conditions previously seen before major altcoin expansion cycles.
- ALTS token price jumped to $0.00001147 after a sudden spike, stabilizing above earlier consolidation near $0.00001002.
- Altcoin dominance approaching long-term resistance with bullish MACD crossover suggests growing momentum, potentially signaling the start of a new altcoin market expansion phase.
Altcoin dominance breakout signals are forming as long-term market compression approaches a critical resistance area.
Analysts tracking macro charts note improving momentum while altcoin liquidity conditions gradually shift across the broader cryptocurrency market.
Five-Year Downtrend Structure Approaches Critical Resistance
The macro chart shows altcoin dominance trending lower since the previous market peak. A descending resistance line connects several lower highs across multiple years. This pattern has defined the extended consolidation period within the broader crypto market.
Recent price movement now compresses directly beneath that long-term resistance line. The structure also shows gradually forming higher lows. Such compression patterns often appear before major volatility expansions.
The tightening range suggests weakening selling pressure across the altcoin market. Liquidity conditions appear to be stabilizing after several years of contraction. Market participants are closely monitoring the resistance level for potential breakout signals.
A post shared by Crypto Patel on X described the setup. The analyst noted that a five-year downtrend on altcoin dominance approaches structural breakout conditions. The message also referenced improving higher-timeframe momentum indicators.
Momentum Indicators Reflect Possible Market Cycle Transition
The chart includes a momentum indicator panel positioned below the dominance structure. The MACD line currently approaches a bullish crossover on the higher timeframe. Such signals often precede broader shifts in market momentum.
Historical observations show similar crossover patterns during earlier altcoin expansion phases. When those signals were confirmed, altcoins produced large valuation increases. Liquidity rotated away from larger assets into smaller digital tokens.
The chart also marks a previous phase labeled “Altseason Start.” That period coincided with expanding altcoin market share.
Traders commonly associate those phases with strong performance across alternative cryptocurrencies.
The current MACD configuration suggests improving market conditions once again. Momentum appears to be gradually strengthening after prolonged consolidation. Market confirmation, however, still depends on a clear breakout above resistance.
ALTS Token Price Surges After Intraday Liquidity Spike
Short-term market activity also reflects volatility within smaller tokens. The ALTS token traded near $0.00001147 following a sharp intraday surge. Data displayed through CoinMarketCap recorded a 24-hour increase near 14.5%.
Earlier trading activity showed the token consolidating near $0.00001002. Price remained largely unchanged during most of the session. Such behavior often indicates limited liquidity and subdued participation.
Later in the session, a sudden vertical price movement occurred. The token briefly approached levels near $0.000016 before retracing part of the move. Rapid spikes like this typically emerge within thin order books.
After the surge, the price stabilized above the earlier consolidation range. Maintaining levels above $0.000010 now forms a short-term reference zone. Future sessions will determine whether the movement represents sustained demand or temporary volatility.

Bitcoin extended gains above $73,000 on Friday, stabilizing near a long-standing floor around $70,000 as macro data and geopolitical tensions shape risk appetite. The move followed a US GDP release showing the economy grew just 0.7% in the fourth quarter of 2025, keeping recession fears on the radar into 2026 and complicating the Federal Reserve’s policy path. A surge in energy markets, with oil hovering near $119.50 a barrel amid ongoing Middle East tensions, added to the backdrop of inflation concerns. Against that backdrop, institutional appetite for crypto exposure remained evident as spot BTC ETFs registered ongoing inflows, signaling a persistent but cautious demand from a risk-off to risk-on rotation.
Key takeaways
- Bitcoin clears the $73,000 level and holds the 70,000 area as weak US data and geopolitical tensions weigh on risk assets.
- The 50-day correlation with the Nasdaq 100 sits near 84%, complicating BTC’s role as a hedge in a slowing economy.
- Spot Bitcoin ETF inflows persisted for four consecutive days, totaling about $583 million, but price action cooled as flows reversed in the following days.
- Oil prices surge to around $119.50, adding inflationary pressure and potentially constraining retail crypto investment amid higher energy costs.
- Corporate exposure remains a factor, with MicroStrategy (MSTR) reported to have accumulated substantial exposure via a yield-bearing STRC instrument, underscoring continued institutional nuance in crypto demand.
Tickers mentioned: $BTC, $MSTR, $STRC
Sentiment: Neutral
Price impact: Neutral. The move higher reflects continued demand in a risk-off to risk-on rotation, but broader macro headwinds keep the path forward uncertain.
Market context: The latest price action sits within a broader environment of rising yields, stickier inflation concerns, and mixed liquidity signals. Traders are weighing softening domestic growth against geopolitical frictions that keep energy prices elevated and risk sentiment bifurcated across traditional equities and crypto assets.
Why it matters
The ongoing tension between weak macro growth and available liquidity underscores a delicate balance for crypto markets. Bitcoin’s recent momentum suggests that investors remain willing to allocate capital to scarce assets even as the macro picture remains unsettled. Yet the backdrop of a 0.7% expansion in US Q4 2025 and a 4.26% yield on the 10-year Treasury signals a high-stakes environment where risk assets can swing on every new data point. The observed correlation with major equity indices, particularly the Nasdaq, indicates that BTC is not operating in a vacuum and that cross-asset risk considerations continue to mold price action.
Institutional demand also remains a central theme. The presence of spot BTC ETF inflows points to a structural interest in crypto exposure among larger investors, even as price-driven dynamics can erode or amplify those inflows in the short term. The anecdote about MicroStrategy’s exposure via a yield-bearing instrument further highlights how corporate balance sheets are increasingly intersecting with digital-asset dynamics. For market participants, this blend of macro headwinds, policy moves, and institutional involvement means crypto markets could remain sensitive to shifts in liquidity and regulatory signals while pursuing longer-term diversification goals.
Finally, energy markets and inflationary pressures cannot be ignored. With oil costs holding at elevated levels, consumer spending and risk appetite are mutually influenced by energy prices, which can indirectly affect asset classes including crypto. The convergence of these forces—macro data, geopolitical risk, and institutional activity—helps explain why BTC has shown resilience yet remains encased in a broader trend that favors caution rather than a straightforward breakout.
What to watch next
- Whether BTC can sustain a move above $70,000 and test higher levels, or if price action prints new tests around earlier consolidation ranges such as $64,000.
- Upcoming macro releases, including quarterly GDP updates and inflation data, that could recalibrate bets on rate paths and risk appetite across assets.
- Trends in spot BTC ETF inflows to determine whether fresh liquidity returns or remains episodic, and how that interacts with price action.
- Energy-market developments and geopolitical headlines that could further influence energy prices and the macro backdrop for crypto investments.
Sources & verification
- US Commerce Department GDP release for Q4 2025 and subsequent revisions.
- TradingView charts showing US 10-year Treasury yields and BTC/USD price movements.
- CoinGlass data on US-listed spot Bitcoin ETF net inflows.
- Public policy announcements related to energy purchases (e.g., Russian oil) and related market reactions.
- Market commentary mentioning MicroStrategy (MSTR) and the yield-bearing STRC instrument.
Market reaction and key details
Bitcoin (CRYPTO: BTC) traded with renewed vigor after crossing the $73,000 mark, a milestone that reinforced a weekly floor just above $70,000. The move occurred in a backdrop of softer-than-expected US growth, with the Commerce Department’s fourth-quarter figures showing a 0.7% expansion, a pace that traders interpreted as a potential prelude to a longer horizon of accommodative or selective tightening by policymakers. Alongside the growth data, the benchmark 10-year yield rose to 4.26%, signaling that investors demanded higher compensation for risk as liquidity conditions evolved. The combination of weaker growth signals and higher yields often tilts capital toward scarce assets, a dynamic that has historically supported non-yielding stores of value like BTC in times of macro uncertainty.
Oil markets moved in tandem with these macro shifts, with West Texas Intermediate futures touching levels near $119.50 per barrel as the market digested policy moves and regional tensions. A notable development cited by policymakers involved the temporary authorization of purchasing Russian oil stranded at sea—a move that briefly tempered risk-on impulses but also underscored the fragility of energy markets in an age of geopolitical risk. Against this backdrop, equities fluctuated, with the S&P 500 futures retreating to updated lows as energy prices spiked, only to rebound in subsequent sessions as risk sentiment stabilized to some degree.
From an institutional standpoint, the appetite for Bitcoin exposure remained evident through ETF flows. Reports indicate four consecutive days of net inflows into spot BTC ETFs, totaling approximately $583 million, highlighting ongoing demand from regulated investment vehicles. Yet, the price reaction in the following days suggested that such inflows may be more reflective of price-driven positioning rather than a deterministic signal for sustained upside. In parallel, attention to corporate crypto bets persisted, with MicroStrategy (MSTR) reportedly accumulating substantial exposure via a yield-bearing_STR_C instrument, illustrating how large corporate entities are integrating digital assets into their treasury strategies—even amid a broader market backdrop that remains cautious and data-dependent.
The price action also reaffirmed a relatively high correlation with tech equities, with Bitcoin’s 50-day correlation to the Nasdaq 100 hovering in the upper-80s. This linkage implies that BTC is not entirely insulated from broader equity dynamics, especially when macro risk remains elevated and investors reassess cyclicality within risk assets. The net effect is a market that’s simultaneously buoyed by liquidity-driven inflows and girded by structural headwinds—an environment where a breakout, if it occurs, will likely require a sustained shift in risk sentiment and macro clarity rather than a single positive data point.
Looking ahead, market participants will be watching how the macro narrative evolves: GDP revisions, inflation prints, and policy signals from central banks around the globe. While the recent activity hints at a cautious bullish tilt for Bitcoin, observers stress that the bear market’s structure—characterized by consolidation and tests of major supports—remains a dominant frame for pricing. Investors should calibrate expectations to the possibility that near-term gains could be scrappy and contingent on a broader realignment of liquidity, growth expectations, and geopolitical risk factors.
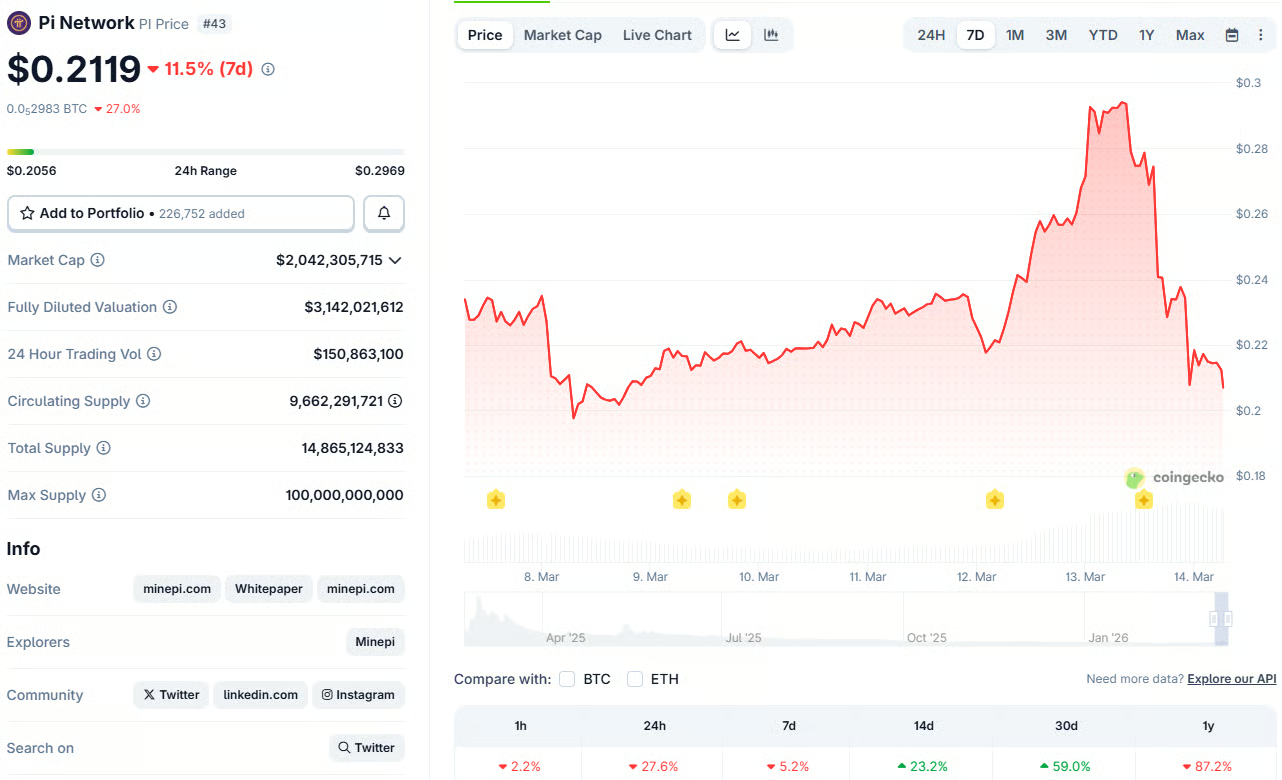
PI was violently rejected at $0.30 and it’s the poorest performer today from the larger-cap alts.
Although its vast community is preparing to celebrate the so-called Pi Day today, the ecosystem’s underlying token experienced one of its most painful corrections, driving it south by 30% in less than 24%.
This crash came even after reports that the Core Team had successfully implemented a crucial upgrade, whose deadline was March 12.
v20.2 Update Completed?
The team behind the controversial project announced its first protocol migration for the year to v19.6 on February 21. The next one, v19,9, was successfully migrated on March 4, and they explained that v20.2 will be implemented by March 14. However, they tightened the deadline to March 12 a few days later.
Although the second deadline passed on Thursday, there’s no official update from the team regarding its status. However, multiple reports from accounts designated to cover Pi news have asserted that it was successfully migrated. v20.2 is not a routine technical update; it’s a mandatory protocol adjustment designed to strengthen the network and ensure it can support rising demands and utilization.
The team promised that security, scalability, and reliability of the blockchain infrastructure should be enhanced following its completion.
PI Plummets
The project’s native token became the most significant gainer over the past few days. Yesterday alone, it skyrocketed by 30% to its highest price level since late November at almost $0.30. Perhaps a large portion of these gains was driven by the implemented updates and the promise of the following one. However, there was another big reason behind PI’s wild run – the official listing on the veteran US exchange Kraken.
Similar listings tend to boost the underlying token as it helps to legitimize it and increase liquidity. However, this significant rise in PI’s price has come to a halt as the asset has wiped out almost all recent gains and has plummeted to $0.21. In fact, it has even turned red on a weekly scale, dropping by over 11%.
You may also like:
Today’s crash appears to be a classic ‘sell-the-news’ moment, in which the underlying asset rockets as the hype builds and crumbles after the update/listing becomes official.
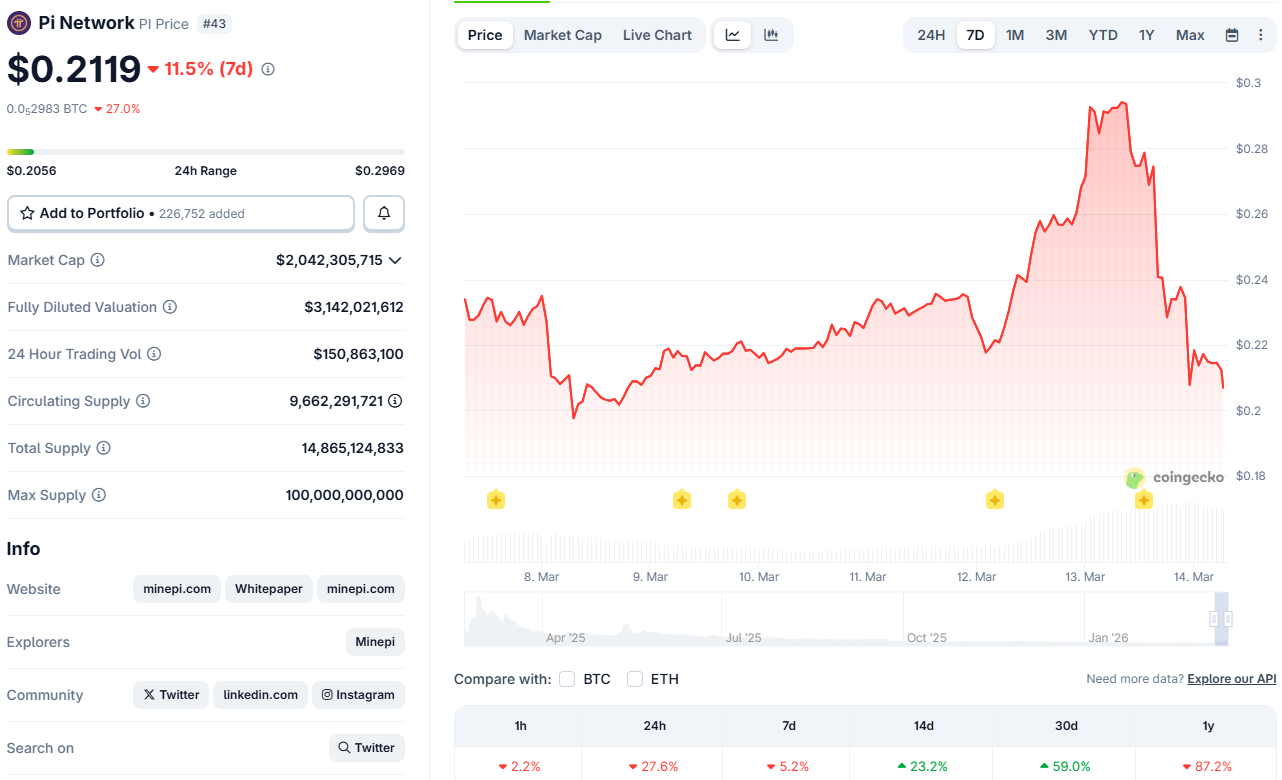
The upcoming token unlock schedule is quite high over the next few days, with 17 million and 16 million coins to be released on March 17 and 20, respectively, which could increase immediate selling pressure. However, the following three weeks are expected to be calmer, with the average number of tokens to be unlocked decreasing to under 4.5 million per day.
Binance Free $600 (CryptoPotato Exclusive): Use this link to register a new account and receive $600 exclusive welcome offer on Binance (full details).
LIMITED OFFER for CryptoPotato readers at Bybit: Use this link to register and open a $500 FREE position on any coin!
Disclaimer: Information found on CryptoPotato is those of writers quoted. It does not represent the opinions of CryptoPotato on whether to buy, sell, or hold any investments. You are advised to conduct your own research before making any investment decisions. Use provided information at your own risk. See Disclaimer for more information.
TLDR:
- Meta plans to cut over 20% of its 79,000-person workforce, potentially eliminating around 16,000 jobs.
- Meta’s Avocado model has missed its deadline three times and now trails Google, OpenAI, and Anthropic on benchmarks.
- Meta is reportedly exploring a temporary deal to license Google’s Gemini to power its own AI products.
- Meta has committed up to $135 billion in 2026 capex and $600 billion in data center spending through 2028.
Meta layoffs are under scrutiny after Reuters confirmed plans to cut over 20 percent of the company’s roughly 79,000 employees.
About 16,000 jobs could be at risk under the reported plan. The move comes as Meta ramps up AI spending to between $115 and $135 billion in 2026.
However, the company’s own AI model has faced multiple delays. Meta is also reportedly considering licensing a competitor’s technology in the interim.
Model Delays Cast Doubt on the AI Replacement Thesis
Meta’s next-generation AI model, internally codenamed Avocado, has been delayed from March to at least May 2026. Internal benchmarks showed the model falling behind Google’s Gemini 3.0, OpenAI, and Anthropic in key areas.
Those areas include reasoning, coding, and writing performance. The delay comes at a particularly sensitive time for the company.
The delay is not a one-off event. The model has slipped three separate times from its original 2025 release target. Each delay pushes back Meta’s ability to prove that AI can handle work previously done by large teams.
Social media analyst @shanaka86 captured the tension in a widely shared post. He wrote: “Mark Zuckerberg is about to fire 16,000 humans because he believes AI can replace them. His own AI cannot replace Google’s.”
He called this contradiction “the entire story of the 2026 tech economy.” Many investors and observers have since amplified the observation online.
Meta’s previous flagship model, Llama 4 Behemoth, was never released publicly at all. Now the company is reportedly discussing a plan to license Google’s Gemini temporarily. That would mean a competitor’s model running inside Meta AI products under Meta’s own branding.
CEO Mark Zuckerberg told analysts earlier this year that he was “starting to see projects that used to require big teams now accomplished by a single very talented person.”
However, the company’s AI technology has not demonstrated that capability in competitive benchmarks. The layoffs appear to be running ahead of the technology they are supposed to depend on.
Acquisitions and Capital Commitments Add Financial Weight to the Strategy
Meta’s capital expenditure for 2026 is projected between $115 and $135 billion. That is nearly double the roughly $72 billion the company spent on infrastructure last year.
Additionally, Meta has committed to $600 billion in total data center spending through 2028. The scale of that commitment makes the AI model delays all the more consequential.
The company has also moved aggressively on acquisitions in a short time. Meta paid $14.3 billion to bring in Alexandr Wang from Scale AI.
It then spent over $2 billion on Manus and an undisclosed amount on Moltbook. Both deals came within recent months, adding to the company’s growing cost base.
The integration of these acquisitions, however, depends on a model that is still unfinished. Manus processes 147 trillion tokens using third-party AI models, not Meta’s own. Moltbook’s agent systems run on a platform called OpenClaw, also external to Meta’s stack.
Meta hired Nat Friedman, the former GitHub CEO, as part of its talent push. The company also recruited top AI researchers with compensation packages reported to exceed $100 million each. Zuckerberg described the goal as building “the highest talent density lab in the industry.”
Meta spokesperson Andy Stone pushed back on the layoff reports. He called them “speculative reporting about theoretical approaches,” with no confirmed plans or timelines.
Meta’s stock still fell 3.83 percent when the news broke. The proposed cuts would be the company’s largest since the 2022–23 efficiency drive, which removed 21,000 positions.
Crypto World
US Carried Out ‘Most Powerful Bombing Raid’ on Iran’s Kharg Island: When Will BTC React?
BTC has remained relatively stable for now, but it tends to react once the futures and legacy markets open.
The US military forces launched a massive attack against one of Iran’s key regions, Kharg Island, which is reportedly responsible for 2% of the global oil supply.
Although the POTUS said he intentionally chose not to bomb any oil infrastructure on the island, he threatened that he might reconsider his decision should Iran “do anything to interfere with the free and safe passage of ships through the Strait of Hormuz.”
The New Attack and BTC Reaction
Trump described the attack as the “most powerful bombing raids in Middle East history.” Although it’s a relatively small island, it is estimated that it manages around 90% of Iran’s crude oil exports and 2% of the global oil supply.
According to the analysts from the Kobeissi Letter, this is a “MAJOR escalation for oil markets.” However, the attack was carried out hours after (almost) all financial markets closed, so the damage has been limited so far. USOIL closed on Friday at just under $100, which is still lower than the Monday peak of nearly $120.
The consequences for bitcoin have also been rather negligible so far. The asset was rejected at $74,000 yesterday, but it remained relatively stable at around $70,000-$71,000 after the attacks. However, similar developments during previous weekends impacted BTC once all other financial markets opened on late Sunday or early Monday. As such, more volatility is probably expected tomorrow evening.
Sentiment Changes
The analytics company Santiment noted that the crowd optimism about the potential ending of the military conflict in the Middle East skyrocketed earlier this week when Trump claimed again that the US was “winning very decisively.” However, the subsequent actions, continued military operations, and new hits have evaporated this optimism.
The analysts said that social dominance around words like ‘war,’ ‘conflict,’ ‘battle,’ or ‘tensions’ is on the rise again, especially since the US and Israel have seemingly different scenarios on how they would like the situation to unfold.
You may also like:
🇮🇷🇮🇱🇺🇸 According to social media data, the optimism that the Iran, Israel, & US conflict would come to an end peaked on Tuesday after Trump’s speech about the US ‘winning very decisively’. But following continued images, videos, and news of retaliation, this hope considerably… pic.twitter.com/mPkSI8m1QO
— Santiment (@santimentfeed) March 13, 2026
Binance Free $600 (CryptoPotato Exclusive): Use this link to register a new account and receive $600 exclusive welcome offer on Binance (full details).
LIMITED OFFER for CryptoPotato readers at Bybit: Use this link to register and open a $500 FREE position on any coin!

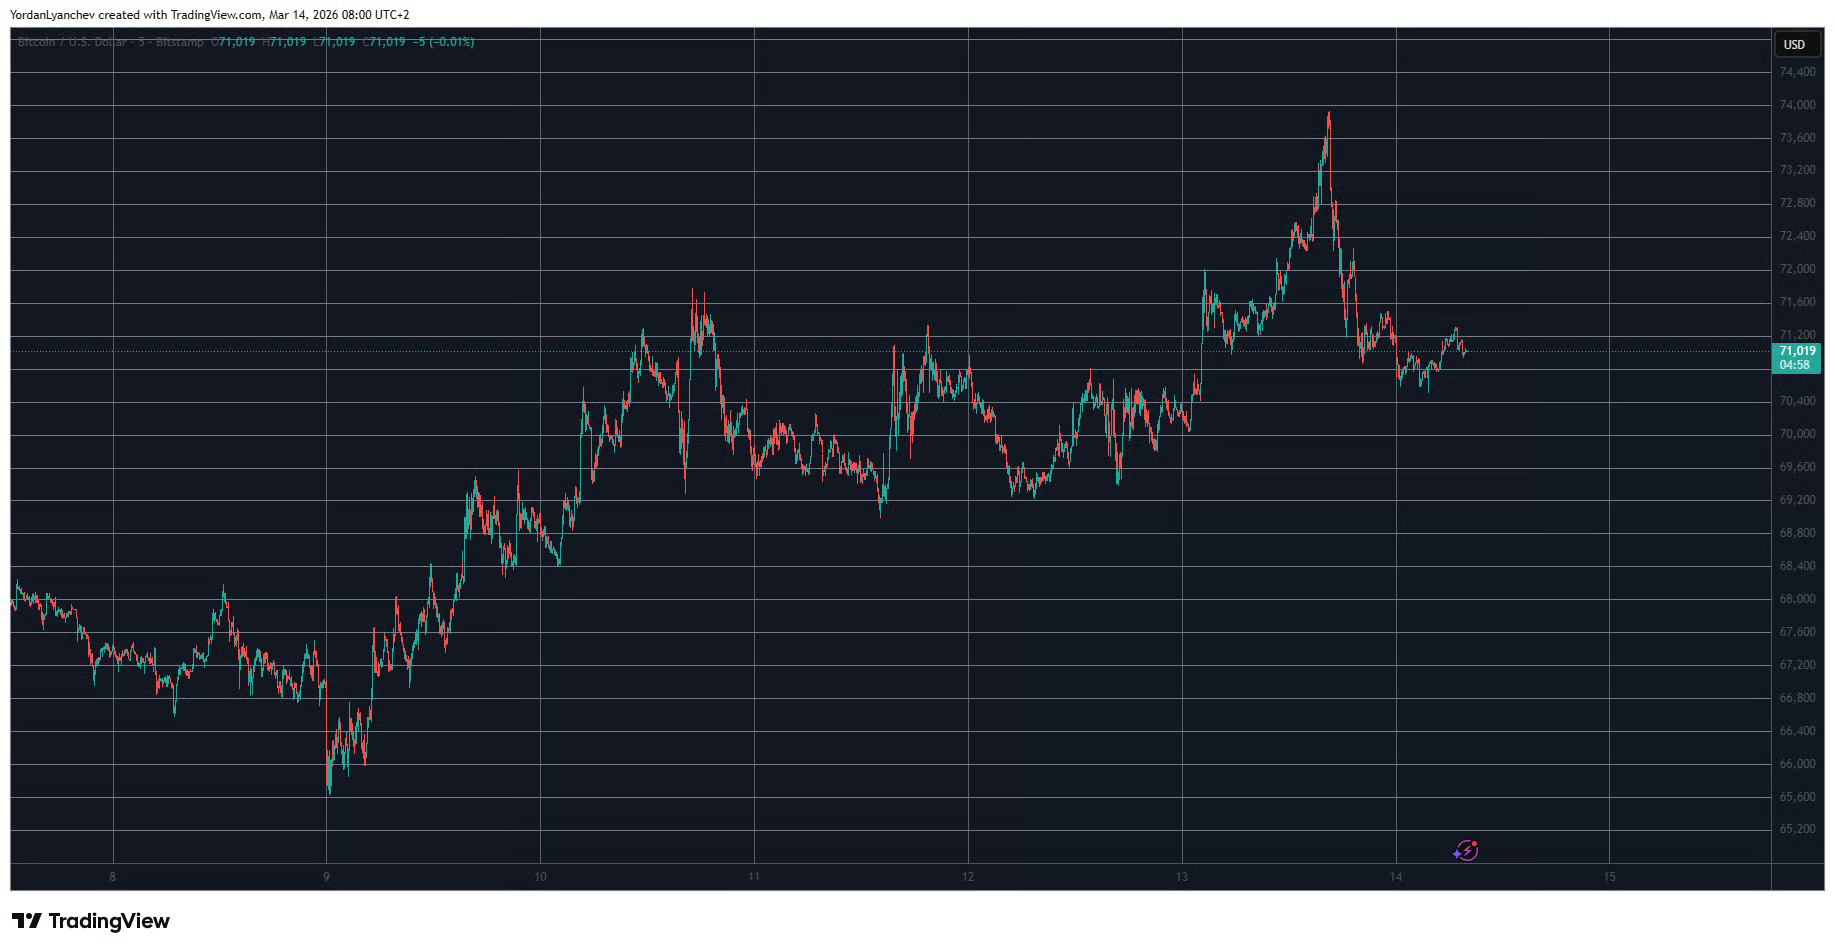
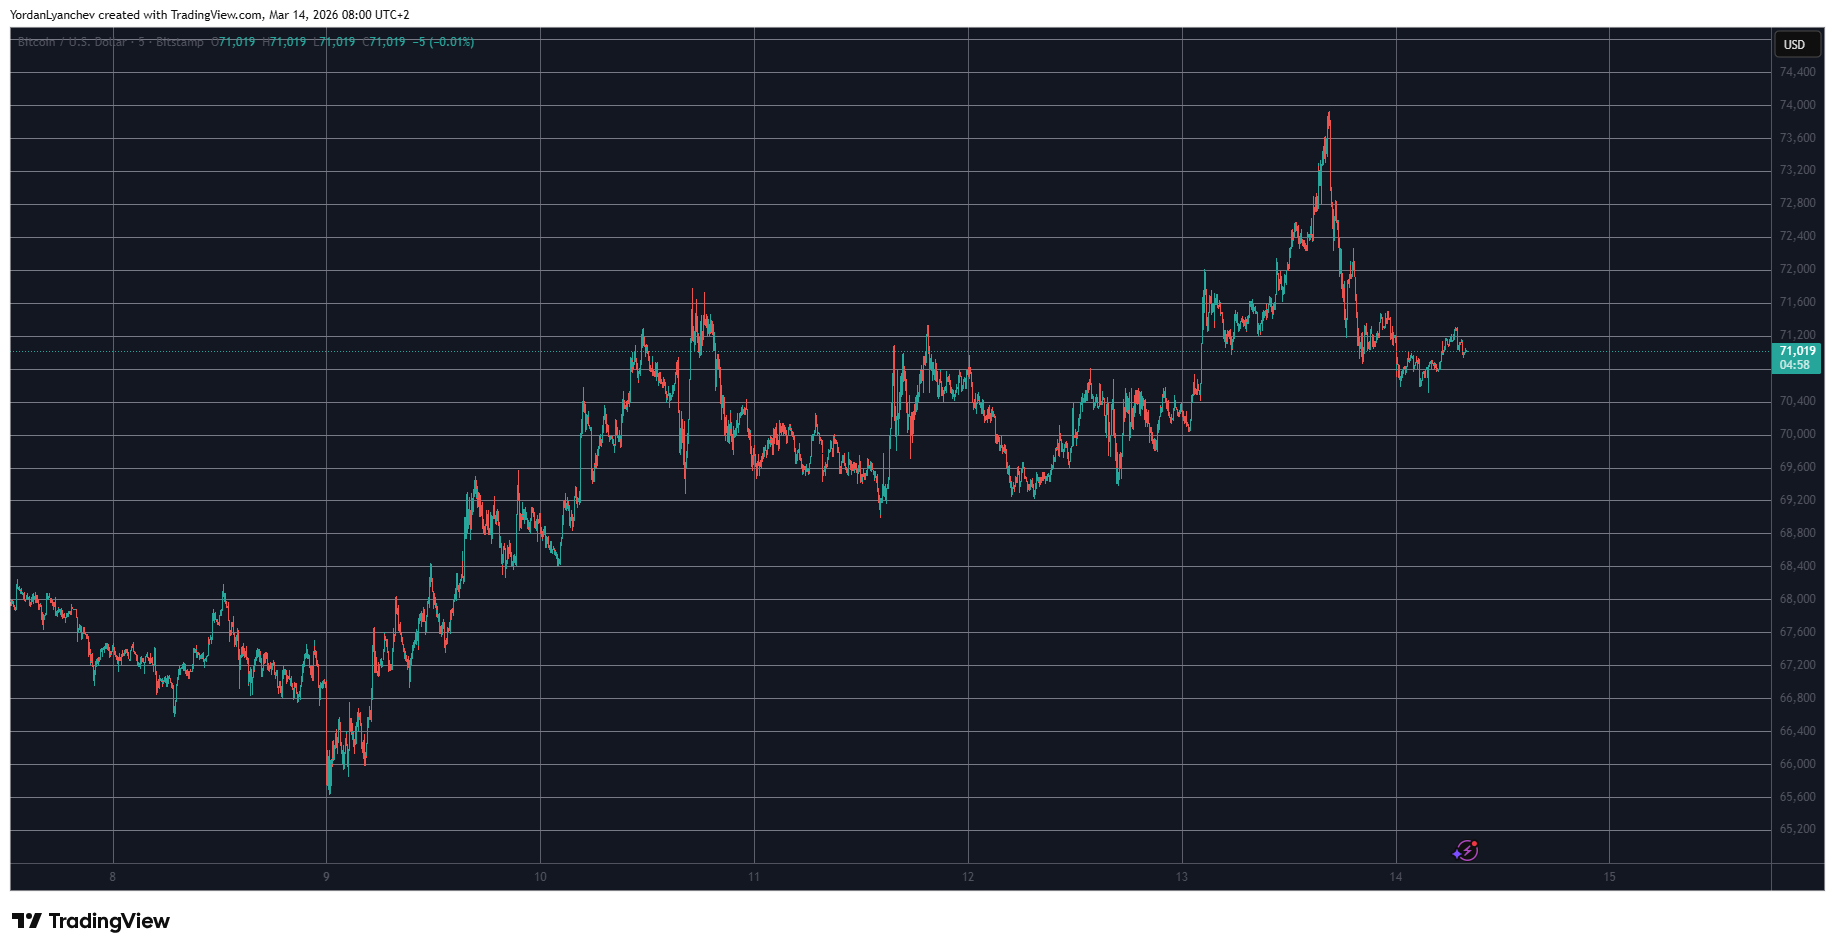
Two weeks into a Middle Eastern war and bitcoin is higher than where it started.
The largest cryptocurrency was trading at $71,000 on Saturday morning, down 0.7% over the past 24 hours after the U.S. bombed military targets on Kharg Island, Iran’s main crude export facility.
The reversal from Friday’s $73,838 high was sharp but contained. Bitcoin gave back 3.5% on the Kharg headlines and stopped. A month ago, a comparable escalation would have triggered a much deeper sell-off.
The weekly numbers tell the resilience story. Bitcoin is up 4.2% over seven days. Ether gained 5.5% to $2,090. Dogecoin added 5%. Solana rose 4.2% to $88. BNB climbed 4.5% to $655. Every major is green on the week despite the war intensifying, not easing.
The market is adapting to the conflict in real time. Early in the war, every headline produced an outsized reaction because nobody could price the tail risk. Now, traders have a framework, where strikes happen, oil spikes and bitcoin dips only to recover again.
The pattern has repeated enough times that the reflexive sell-the-headline impulse has faded. However, the $73,000-$74,000 resistance level stays in place, and has now rejected bitcoin four times in two weeks.
Trump’s language on Kharg Island added a new variable in the markets.
In a Truth Social post late Friday, he said he spared oil infrastructure “for reasons of decency” but would “immediately reconsider” if Iran continued blocking the Strait of Hormuz.
Iran responded that any strike on energy infrastructure would trigger retaliatory attacks on U.S.-linked facilities in the region. That’s a conditional escalation threat that didn’t exist 48 hours ago. If oil infrastructure becomes a target, the supply disruption, which the IEA already called the largest in history, gets dramatically worse.
Meanwhile, the $371 million in liquidations over the past 24 hours reflected the two-way nature of Friday’s session. Short liquidations outpaced longs at $207 million versus $163 million, meaning the initial surge to $73,800 squeezed bears before the Kharg headlines squeezed the longs who had just entered.
Attention now shifts to the Fed meeting on March 17-18. Oil above $100, the largest energy supply disruption in history, and a war entering its third week with no resolution make the stagflation case harder to dismiss.
CME FedWatch still prices a 95%+ probability of a hold at 3.5% to 3.75%, but the dot plot and Powell’s press conference will matter more than the decision itself. Any hint that rate hikes are back on the table would hit risk assets hard, including a crypto market that has spent five months pricing in cuts that keep not arriving.
TLDR:
- Bitcoin saw macro relief as the PCE inflation print came in at ~2.8% YoY, matching expectations and easing pressure on risk assets.
- A U.S. 30-day oil sanction waiver cooled energy markets, reducing inflation fears and boosting investor risk appetite.
- Spot Bitcoin ETFs recorded multiple consecutive inflow days, with BlackRock’s IBIT leading institutional demand signals.
- Dealer hedging near the $75K options strike amplified BTC’s upward move, accelerating the return to the $70K level.
Why Bitcoin just bounced back to $70,000 is a question many market watchers are asking this week. The recovery did not happen by chance, as several converging factors drove the price higher.
Easing inflation data, cooling energy prices, consistent ETF inflows, and strategic derivatives positioning all played a role.
Understanding each of these elements helps explain the mechanics behind this notable price recovery in the cryptocurrency market.
Cooling Macro Pressures Gave Bitcoin Room to Recover
The most immediate reason why Bitcoin bounced back traces directly to the latest inflation data. The Personal Consumption
Expenditures report printed at approximately 2.8% year-over-year, closely matching market expectations. A higher-than-expected reading would have pressured risk assets across the board.
Instead, the in-line result removed a key obstacle that had been weighing on investor sentiment toward Bitcoin.
Energy markets also shifted in a constructive direction around the same time. The U.S. government issued a 30-day waiver permitting select countries to purchase sanctioned Russian oil stranded at sea.
Coordinated global measures, including potential strategic reserve releases, helped stabilize oil prices further. Calmer energy markets reduced broader inflationary fears and encouraged investors to re-enter risk assets.
When both inflation data and energy prices ease simultaneously, risk appetite tends to return quickly. Bitcoin, being a highly sentiment-driven asset, responded swiftly to this improved macro backdrop.
Fewer macro headwinds meant investors faced less resistance in adding exposure to the asset. That clearing of obstacles was a direct catalyst for the move back toward $70,000.
Institutional Demand and Derivatives Positioning Accelerated the Bounce
Beyond macro factors, consistent ETF inflows helped explain why Bitcoin bounced back with such force. Spot Bitcoin exchange-traded funds recorded multiple consecutive days of positive inflows during this period.
BlackRock’s IBIT led the way, reflecting persistent institutional demand through regulated investment vehicles. This steady buying created a reliable floor of support beneath the asset’s price.
Crypto analyst CryptosRus pointed directly to this institutional trend as a driving force. The analyst noted on social media that sustained IBIT inflows signal steady and growing institutional confidence in Bitcoin.
Unlike retail-driven rallies, institutional flows tend to be more deliberate and measured in nature. That consistency adds a layer of structural support that amplifies price recoveries when macro conditions also align.
The derivatives market then added fuel to an already improving situation. Dealer hedging around major options strike prices near $75,000 created additional buying pressure as BTC climbed.
CryptosRus described the overall setup clearly, stating that macro pressure eased while institutional flows stayed strong. Derivatives positioning then accelerated the upward move from there.
The analyst called this combination a classic recipe for Bitcoin momentum to restart. Market participants are now monitoring closely whether Bitcoin can sustain its position above the $70,000 level.

Kristy Sarah Details ‘Internal Bra’ Boob Job After Divorce
USDC Overtakes USDT in Transaction Volume Since 2019 Milestone

F1 2026 China GP LIVE: George Russell favourite in qualifying after thrilling sprint battle with Lewis Hamilton


-
 Tech3 days ago
A 1,300-Pound NASA Spacecraft To Re-Enter Earth’s Atmosphere
-

 News Videos5 days ago
10th Algebra | Financial Planning | Question Bank Solution | Board Exam 2026
-

 Crypto World5 days ago
Paradigm, a16z, Winklevoss Capital, Balaji Srinivasan among investors in ZODL
-

 Business4 days ago
ExxonMobil seeks to move corporate registration from New Jersey to Texas
-
Crypto World4 hours ago
HYPE Token Enters Net Deflation as HyperCore Buybacks Outpace Staking Rewards
-

 Fashion14 hours ago
Weekend Open Thread: Addict Lip Glow
-

 Tech4 days ago
ChatGPT will now generate interactive visuals to help you with math and science concepts
-

 Sports6 days ago
Three share 2-shot lead entering final round in Hong Kong
-

 Sports6 days ago
Braveheart Lakshya downs Lai in epic battle to enter All England Open final | Other Sports News
-

 NewsBeat3 days ago
Residents reaction as Shildon murder probe enters second day
-

 Business6 days ago
Search for Nancy Guthrie Enters 37th Day as FBI Probes Wi-Fi Jammer Theory
-

 Business3 days ago
Search Enters Sixth Week With New Leads in Tucson Abduction Case
-
 NewsBeat4 days ago
Pagazzi Lighting enters administration as 70 jobs lost and 11 stores close across Scotland
-

 Tech5 days ago
Despite challenges, Ireland sixth in EU for board gender diversity
-

 Business5 days ago
Search Enters 39th Day with FBI Tip Line Developments and No Major Breakthroughs
-

 NewsBeat3 days ago
I Entered The Manosphere. Nothing Could Prepare Me For What I Found.
-

 Sports5 days ago
Skateboarding World Championships: Britain’s Sky Brown wins park gold
-

 Crypto World4 days ago
Will Chainlink price reclaim $10 amid volatility squeeze?
-

 Sports5 days ago
Tomorrow’s Top 25 Today: Florida jumps to No. 4; Louisville, Wisconsin enter projected rankings
-

 Sports3 days ago
PWHL, Senators discussing plan to keep Charge in Ottawa