

Crypto World
Bitcoin Eyes Key Support Reclaim as Weekly Close Tops $70K

Bitcoin edged toward a pivotal weekly finish, with traders watching a potential close above the $70,000 mark that would also reclaim a critical long-term indicator. The setup sits at a crossroads as macro risk remains in play and buyers test a sequence of technical levels that have defined the market for months. A close above $70,000 would not only validate a momentum shift on the weekly chart but would also put the price back above a notable trendline that has guided price action for much of this cycle. The broader backdrop remains mixed, with oil hovering near the century mark and geopolitical tensions contributing to risk-off sentiment during parts of the session.
Bitcoin (BTC) inched higher on Sunday as bulls sought to seal a weekly close above $70,000. The Sunday move followed a week of choppy action and strategic positioning by market participants who are evaluating whether this level can establish a renewed leg higher. The weekly picture matters because it encompasses a longer time horizon, and a break above the level could signal renewed confidence among buyers who have watched multiple attempts to push past the zone fail to sustain momentum. On the charts, Bitcoin was flirting with a reset of momentum after testing highs near the $72,000 area intraday before retreating, a pattern that traders described as a necessary consolidation before another move higher.
Data viewed by traders show that BTC remained on track for a seventh consecutive green daily candle, setting up the potential for the best daily finish in over a week if bidding holds into the close. The price managed to stay above two critical guardrails on the weekly timeframe: the 200-week exponential moving average (EMA) and a level associated with the 2021 all-time high around $68,300, followed by the $69,400 mark. These zones have historically served as magnets for price, attracting buyers when the market swings back toward them after excursions toward local highs. A sustained hold above these levels would be interpreted by many analysts as a sign that the long-term support structure remains intact even in the face of short-term volatility.
Analysts highlighted that recent price corrections have reflected routine risk-off behavior rather than a shift in the longer-term narrative. In a recent analysis, Michaël van de Poppe noted that the market could see a minor pullback as CME gap closure activity picks up around the weekend, but he projected a continued grind toward the next major resistances in the $75,000–$80,000 area if the momentum persists. The reflection aligns with a price action pattern in which buyers defend key levels and push the market higher on renewed demand, even as profit-taking emerges at local highs.
“Markets are turning back upwards again, probably we’ll see a slight pullback later today for CME gap closing appetite, but other than that, I would assume we’ll continue to grind upwards to the resistances at $75-80K.”
In a separate acknowledgment of the intraday dynamics, van de Poppe had previously forecast that the price would revisit Friday’s CME close around $71,325, underscoring the notion that short-term moves may oscillate within a defined corridor before the next directional breakout. As of the current update, BTC had logged a weekly gain of more than 8%, with March performance hovering near a 6.7% increase, underscoring the persistence of buyers seeking to reassert control after a period of volatility. A chart overview from CoinGlass capturing weekly returns corroborates the broader narrative of a risk-on tilt within a cautious macro environment. CoinGlass data show the week-to-date strength in the asset, even as macro risk factors remain in flux.
Macro turmoil spoils Bitcoin “relief rally”
Beyond the price action, macro and geopolitical factors continued to shape trader sentiment. While some participants hoped for a relief rally in calmer macro conditions, the backdrop remained precarious. Oil markets provided a parallel narrative, with WTI crude oil flirting with the $100-per-barrel mark as traders weighed supply shocks and demand dynamics. The persistent tension between risk-on and risk-off impulses has left Bitcoin oscillating between cautious optimism and a more defensive posture as investors digest global developments and central bank trajectories.
Market watchers such as Kyle Doops emphasized that, on a mid-term horizon, Bitcoin appears to be trading within a defined band. He highlighted a mid-term trading range defined by a longer-term market mean near $78,400 and a realized price baseline around $54,400, suggesting that price action tends to revert toward these anchors after excursions toward the upper and lower boundaries. In his assessment, whenever Bitcoin edges above $70,000, sellers re-emerge to take profits rather than trigger panic selling, reinforcing the view that the market has become comfortable with orderly, measured gains rather than sharp, outsized moves. These observations align with the broader theme of a market that has found a measure of discipline even as headlines around energy markets and global tensions continue to dominate the narrative.
Why it matters
The ongoing test of the $70,000 threshold matters for several reasons. First, a weekly close above that level would bolster the case for a renewed longer-term uptrend by reclaiming a major psychological and technical barrier that has capped upside in recent months. It would also validate the relevance of the 200-week EMA as a benchmark for long-term support, potentially reducing the probability of a rapid retrace as market participants reassess risk posture. For traders, a sustained close above the level could translate into a more constructive setup for those eyeing a move toward the upper end of the historically significant resistance corridor in the low-to-mid $80,000s, while still considering the structural dynamics shaped by macro headwinds.
Second, the price action underscores the interplay between technical patterns and macro realities. Even as Bitcoin demonstrates resilience, macro catalysts—most notably commodity markets and geopolitical risk—continue to influence risk appetite. In this context, a constructive weekly close could act as a spark for renewed liquidity and ETF considerations, though investors must remain mindful of potential overhangs from policy signals and energy prices. The evolving macro environment suggests that the market could enter a phase where patience and disciplined risk management become as important as any immediate price target.
Finally, the narrative around price discovery remains tethered to disciplined risk-control behavior among market participants. The repeated observation of profit-taking at local highs indicates a maturation in market behavior, where investors are more deliberate about entries and exits rather than chasing sensational moves. In a landscape where macro risk remains persistent, the ability to navigate the timing of entries and exits will likely be as important as predicting the next directional move.
What to watch next
- Watch for a weekly close above $70,000 and whether the price can sustain a hold above the 200-week EMA on a weekly basis.
- Monitor CME-related dynamics near the closing price around $71,325 and any subsequent gap-closing activity.
- Observe price action toward the $75,000–$80,000 resistance zone if momentum persists beyond the weekly close.
- Keep an eye on macro catalysts, particularly oil prices hovering near $100 and any geopolitical developments that could affect risk sentiment.
Sources & verification
- TradingView price data for BTCUSD, including the weekly candle count and interactions with the 200-week EMA.
- Analyses and social posts from Michaël van de Poppe discussing CME gaps and potential resistance targets around $75,000–$80,000.
- Kyle Doops’s commentary on the mid-term trading range anchored by a long-term mean near $78,400 and a realized price around $54,400.
- CoinGlass weekly return data illustrating the ~8% weekly gain and March gains of ~6.7% for Bitcoin.
- The referenced chart perspectives and historical levels, including the 200-week EMA around $68,300 and the $69,400 level tied to the 2021 all-time high.
Bitcoin price action and near-term outlook
As the week unfolds, the market’s trajectory hinges on whether Bitcoin can cement a weekly close above the $70,000 threshold and maintain a foothold above the 200-week EMA. The combination of technical support at long-standing levels and the persistence of bullish momentum on the daily chart creates a scenario in which a breakout could invite further upside toward the next major resistance bands. Yet the price action has repeatedly shown that the move higher can be met with measured profit-taking, particularly around round-number levels and at pivotal intraday highs near the $72,000 territory. The balance between demand and supply will likely define the near-term trajectory as traders weigh macro risk against the potential for a sustained look at higher targets.
In sum, Bitcoin is navigating a window of opportunity that could shape the narrative for the coming weeks. A successful close above the critical levels would reinforce the case for a renewed bullish phase, while a failure to sustain gains could bring the market back into a rangebound mode that tests patience and risk management alike. The next few sessions will be telling as the market absorbs macro cues, on-chain signals, and traders’ evolving appetite for risk.

Crypto World
Injective Flips Bearish Structure After Monthly Order Block Holds: What’s Next for INJ?

TLDR:
- Injective (INJ) price fell nearly 95% from its peak before stabilizing at a higher-timeframe demand zone.
- A strong rebound of roughly 4500% followed the reaction from the monthly order block support area.
- Analysts identified a market structure shift after the asset broke its long-term lower-high trend.
- Liquidity targets near $16, $35, and $53 remain visible if higher-timeframe demand continues holding.
The Injective (INJ) price is drawing attention after analysts identified a macro structural shift on the monthly chart. The asset recorded a sharp 95% decline before rebounding from a higher-timeframe demand zone, suggesting renewed accumulation interest.
Deep Market Correction Resets Injective Structure
The Injective (INJ) price experienced a major correction after reaching its previous cycle peak. The decline erased nearly 95% of its value during the broader market downturn.
Such drawdowns are common in cryptocurrency cycles. Many digital assets undergo deep retracements before stabilizing at lower valuation levels.
These periods usually remove leveraged positions and speculative activity. As liquidity exits the market, long-term investors often begin evaluating discounted entry zones.
In the case of the Injective (INJ) price, the extended correction placed the asset inside a large monthly expansion zone. Price remained under pressure before eventually reaching a higher-timeframe demand region.
Technical analysts identify such areas as zones where institutional accumulation previously occurred. Markets frequently react when price returns to those levels.
This perspective reflects how many market participants interpret deep corrections during long market cycles.
Strong Demand Reaction Points to Potential Expansion
Injective (INJ) price reacted strongly once it reached the monthly order block. The market moved upward rapidly after touching the demand zone.
The rebound produced an expansion estimated at roughly 4500% from the local bottom. Such displacement often signals strong buying pressure entering the market.
Large bullish candles following a demand test usually indicate liquidity absorption. This occurs when buyers absorb sell orders positioned near support.
Analysts also identified a market structure shift on the monthly timeframe. Earlier price action formed a pattern of lower highs and lower lows.
That structure changed once the market invalidated the previous bearish pattern. The shift indicated a possible transition toward macro accumulation.
After the strong rally, the Injective (INJ) price entered a corrective phase. Markets often consolidate after impulsive moves to create new liquidity zones.
Traders are now watching whether weekly higher lows develop inside the demand area. Sustained support would strengthen the bullish structure already visible on the chart.
Liquidity targets above the market appear near $16, $35, and $53. These zones align with previous resistance levels and potential stop clusters.
For now, the Injective (INJ) price remains near a key structural region. Market participants continue tracking higher-timeframe support for further confirmation.

Crypto World
Bitcoin Eyes Critical Support Levels as Analysts Stay Bullish and Saylor Signals More Institutional Buying
TLDR:
- Bitcoin rejected the $74,040 high and is currently holding support at the $70,500 price level this week.
- Analyst Lennaert Snyder stays cautiously bullish with stop losses secured above the $73,900 resistance zone.
- A liquidity sweep below $68,950 is viewed as a potentially stronger bullish setup than a direct breakout move.
- MicroStrategy holds 738,731 BTC at a $75,863 average entry as Saylor signals continued Bitcoin accumulation ahead.
Bitcoin is drawing attention from traders and major institutions heading into this week. The cryptocurrency is trading at $71,369.32 after a notable price rejection near the $74,040 high.
Market participants are keeping a close eye on two key support levels right now. The broader outlook stays cautiously bullish, though some short-term price swings remain possible.
Both retail and institutional players are actively adjusting their positions for what lies ahead.
Bitcoin Price Action and Key Levels to Watch
The recent price move saw Bitcoin take out buy-side liquidity on an attempt to break the $74,040 level. After that push, the price met a sharp rejection and pulled back to hold near $70,500. Traders are now watching closely to see if that support holds in the coming days.
Crypto analyst Lennaert Snyder weighed in on the current price setup via social media. He stated his short positions are secured and described himself as “cautiously bullish” for the week ahead. His stop losses are placed above the $73,900 high, reflecting a risk-managed approach to the trade.
The central question among traders is whether Bitcoin holds at $70,500 or dips to sweep liquidity near $68,950. Snyder noted that a liquidity sweep below $68,950 could actually produce a stronger bullish outcome. Either way, he sees both price scenarios as carrying a bullish tone in the near term.
Should a sweep below $68,950 play out, traders will look for reversal signals before entering long positions. Alternatively, a clean break above the $74,040 high could trigger continuation trades. The overall market structure supports a watchful but optimistic stance as the week unfolds.
MicroStrategy and Saylor Signal Further Bitcoin Accumulation
MicroStrategy’s Michael Saylor is once again pointing toward more Bitcoin buying in the near future. His latest public signal, “Stretch the Orange Dots,” is widely seen as a reference to extending the company’s acquisition timeline. The message was shared as the market continues to trade below MicroStrategy’s average entry price.
The company’s Bitcoin treasury now totals 738,731 BTC based on the most recent available data. This makes MicroStrategy one of the largest corporate Bitcoin holders anywhere in the world.
The firm has built up this position through a consistent long-term accumulation strategy across several market cycles.
MicroStrategy’s average entry price for its Bitcoin holdings stands at $75,863 per coin. At the current trading price of $71,369.32, the company carries unrealized losses on its overall position. Despite that, the firm has shown no signs of reducing its holdings through past market downturns.
Saylor’s fresh signal comes at a time when the broader market stands at a critical price level. Corporate accumulation has been a recurring theme in recent Bitcoin market cycles.
MicroStrategy’s continued buying stance reflects long-term institutional commitment that has remained firm through market volatility.
Crypto World
Tesla Terafab: Elon Musk’s $25 Billion Chip Factory That Could Disrupt the Semiconductor Industry
TLDR:
- Tesla’s Terafab targets 1 million monthly wafer starts by 2030, nearly matching TSMC’s current output capacity.
- The $20–25B chip factory covers logic, memory, and advanced packaging under one roof at 2nm scale.
- Tesla’s AI5 chip is reportedly 3x more efficient than Nvidia’s Blackwell at under 10% of the cost.
- Jensen Huang warns Tesla may underestimate the years of expertise required to run a leading-edge fab.
Terafab, Tesla’s newly announced semiconductor manufacturing project, is set to begin construction within seven days.
The initiative targets 2-nanometer process technology and will cover logic chips, memory, and advanced chip packaging under one roof.
Tesla has put the estimated cost at between $20 billion and $25 billion. The move comes as chip demand from Tesla’s AI, robotics, and automotive programs outpaces current supply. Musk warned about this constraint for months, calling it a direct threat to Tesla’s broader ambitions.
Tesla Sets Target of One Million Wafer Starts Monthly by 2030
Tesla’s wafer production targets are substantial by any industry measure. The company aims to reach one million wafer starts per month by 2030.
TSMC, the world’s leading chipmaker, currently produces around 1.42 million wafers each month. Tesla, therefore, wants to nearly match the output of the most advanced foundry on the planet.
Musk addressed the strategy directly in a recent statement. He noted that Tesla plans to start small, make early mistakes, then build a much larger operation.
The Terafab facility targets the 2-nanometer process node. That is the same standard that TSMC and Samsung are racing to achieve.
Tesla holds over $44 billion in cash and investments on its balance sheet. That reserve provides the financial base to fund the project.
The facility will house logic chips, memory, and advanced chip packaging in one location. This approach gives Tesla direct control over its chip supply chain.
As reported by MilkRoad AI, Musk confirmed that drone footage will document the construction live on X. The public will watch the project develop in real time.
Tesla’s AI5 chip, currently made by Samsung in Texas, is reportedly three times more power-efficient than Nvidia’s Blackwell. It also reportedly costs less than 10% of comparable Nvidia pricing.
Industry Experts Weigh In on the Complexity of Building a Chip Fab
Not everyone in the industry views Terafab with the same confidence. Nvidia CEO Jensen Huang publicly stated that Musk may be underestimating the difficulty involved.
Process expertise of that kind takes years to build. No company, he noted, develops that level of engineering capability overnight.
Beyond construction, leading-edge semiconductor manufacturing carries enormous technical risk. Cleanroom engineering, process chemistry, and supply chain coordination must all function with precision.
Even established players like Intel have faced delays at the leading edge. Tesla, as a newcomer to fab operations, faces a steep learning curve ahead.
Tesla’s case, however, centers on supply chain control rather than ambition alone. Even with TSMC and Samsung running at full capacity, chip supply remains short of what Tesla requires.
Autonomous vehicles, humanoid robots, and AI supercomputers all need a steady flow of advanced silicon. Without that supply, Tesla’s expansion roadmap faces real constraints.
Terafab could reshape Tesla’s identity as a company if it succeeds. The automaker would shift from being a chip buyer to a chip producer.
That transition would fundamentally change how the business operates. Construction is set to begin within the week, with global attention already fixed on the project.


Leah Callon-Butler recently wrote that crypto’s rock-and-roll era is over, and she’s mostly right about the arc. But I lived inside the music industry when rock and roll actually died, and there’s more to the story.
I was a product lead at Universal Music during the torrent era. I sat in the rooms where executives decided to sue grandmothers instead of building Spotify. I watched them spend more on lawyers than on artists. And eventually, I got fired for pointing out that we’d already lost.
So when someone uses rock and roll as a metaphor for what’s happening in digital assets, I know what the metaphor actually contains.
Here’s what the rock and roll era ending actually looked like from the inside. The loudest, most exciting part of the culture died while the boring infrastructure underneath it quietly became the thing that mattered. The rock stars disappeared. The streaming executives took over. And the audience grew even as the culture grew less interesting.
Callon-Butler frames this as a kind of mourning. The cypherpunk dream was diluted by ETFs and institutional custody. The laser eyes meme worn by presidents. And yeah, I understand the grief. I felt it watching Universal Music pivot from breaking artists to optimizing playlists.
But here’s where the music industry parallel actually gets useful, and nobody talks about this part.
The labels survived. They wrapped streaming and called it innovation. They went from fighting Napster to owning equity in Spotify. The same executives who wanted to destroy file sharing ended up profiting from the infrastructure file sharing forced into existence. The establishment absorbed the revolution and rebranded it.
That’s what’s happening right now with digital assets. JP Morgan is doing what Universal did with streaming. They’re wrapping the thing they fought and calling it a product. And just like with music, the audience is going to get bigger, the infrastructure is going to get better, and the culture is going to get less interesting. That part Callon-Butler nails.
But the part she misses is what happened next in music. Something the establishment couldn’t absorb.
While Universal was busy becoming a streaming company, ten thousand teenagers with blogs and bedroom studios were building something labels couldn’t wrap. The Swedish death metal kid. The Brazilian baile funk producer. The Detroit techno archaeologist. They didn’t know about each other. They didn’t even know Universal mattered. They just wanted to document what they loved.
And collectively, without any coordination, they created something institutions couldn’t replicate: infinite specificity. Every possible taste has its own ecosystem. Every microgenre has its own distribution channel. The monoculture dissolved into something so granular that no corporate structure could reassemble it.
The rock and roll era is obviously over. The question is what’s being built in the quiet spaces where the institutions aren’t looking.
Stablecoins are moving value across borders for people who’ve never heard of DeFi. Tokenized assets are creating markets in places where traditional finance never bothered to show up. Self-custody tools are getting quietly better while everyone’s distracted by ETF inflows. The boring infrastructure that makes the next wave possible.
I grew up in Argentina. I watched a government freeze bank accounts overnight and tell people their dollars were now worth a third of what they were yesterday. That experience teaches you something about money that stays with you forever. And it teaches you that the people who build the plumbing during the quiet periods are the ones who matter when things get loud again.
Callon-Butler asks whether crypto will stay weird. I’d reframe the question. The music industry stayed weird. It just stopped being weird in the places the executives were watching. The weirdness migrated to the edges, to bedroom producers, niche communities, and distribution channels that didn’t need permission.
Crypto’s rock-and-roll era ending is the most bullish thing that can happen to the industry. It means the adults showed up, and the adults bring capital that doesn’t leave when the vibes change. Crypto needs boring institutional plumbing. And that’s exactly what’s being built right now.
But somewhere out there, some kid in Lagos or Buenos Aires or Beirut is building something on these rails that nobody in a boardroom has imagined yet. They don’t even know the establishment exists. They just need the infrastructure to work.
That’s the beginning of the interesting part.

Global markets faced a real-time stress test as the 2026 Iran crisis escalated, amplifying concerns about energy flows and liquidity. Traders watched as risk sentiment swung and traditional safe-haven dynamics were tested in ways not seen for years. While gold initially benefited from demand for security, Bitcoin weathered the shock with pronounced volatility followed by a partial rebound, highlighting its evolving role in the risk-off landscape. The Strait of Hormuz, through which a substantial share of global oil moves, emerged as a pivotal flashpoint, reminding investors that energy disruption can rapidly reframe macro drivers. The episode underscored how macro forces—dollar strength, inflation expectations and bond yields—can override crisis-driven flows for both conventional assets and digital ones.
Key takeaways
- The 2026 Iran conflict produced a broad market shock, underlining how geopolitical events can reallocate capital across traditional and crypto assets as traders reassess inflation threats and supply-chain resilience.
- Gold initially climbed on safe-haven demand but later retreated as the U.S. dollar strengthened and Treasury yields rose, illustrating how macroeconomic forces can eclipse crisis-driven buying in the near term.
- Bitcoin experienced sharp intraday volatility but demonstrated resilience by rebounding after the initial drawdown, signaling a growing role as an alternative hedge amid liquidity shifts.
- The strength of the U.S. dollar acted as a dominant driver for both assets, as demand for dollar liquidity tended to suppress non-yielding instruments during periods of stress.
- The episode highlighted a structural divergence between traditional safe-haven assets and digital stores of value, inviting investors to rethink the “digital gold” narrative in the context of evolving liquidity and regulatory landscapes.
Tickers mentioned: $BTC
Market context: The episode fits within a broader framework of liquidity crunches, risk-off sentiment, and macro-driven price discovery that continue to shape both precious metals and crypto markets in times of geopolitical tension.
Why it matters
The Iran crisis offered a rare, real-world test of the long-held claim that Bitcoin can act as a safe-haven asset alongside gold. In the opening phase of the conflict, markets repriced risk across assets as traders sought liquidity and hedges amid rising energy concerns and potential supply shocks. While gold’s bid strength reflected its status as a centuries-old reserve asset, the subsequent pullback—at least in the short term—demonstrated how a strengthening dollar and higher yields can erode even the most trusted crisis hedges. This dynamic is instructive for investors who previously treated gold as an almost guaranteed ballast in crisis periods and who are now increasingly considering how digital assets might complement traditional portfolios under pressure.
Bitcoin, often described as “digital gold,” showed a more complex reaction. The asset moved with broad market liquidity and sentiment rather than reacting solely to geopolitical headlines. After a volatile start, Bitcoin (CRYPTO: BTC) staged a recovery that underscored its growing liquidity depth and investor interest as an option for diversification in stressed environments. The price path—marked by intraday declines followed by partial recoveries—illustrates how Bitcoin remains tethered to overall risk appetite and market ability to absorb shocks rather than acting as a pure hedging instrument on its own. This evolving behavior matters for institutions and retail participants weighing how digital assets fit into a risk-management toolkit during geopolitical disruptions.
The crisis also illuminated the role of macro drivers beyond geopolitics. As energy markets priced in potential disruption to flows through the Strait of Hormuz, crude prices surged and broader stock indices retreated. At the same time, the dollar’s strength emerged as the prevailing force in determining relative value across assets. When the dollar strengthens, non-yielding assets—like gold and Bitcoin—face headwinds as capital seeks dollar liquidity and yield-bearing instruments. This interplay between macroeconomics and geopolitics helps explain why neither asset delivered a unidirectional, sustained safe-haven rally in the conflict’s initial phase.
In the longer horizon, the episode emphasizes a nuanced distinction between established safe havens and newer digital instruments. Gold’s entrenched role in central banks’ portfolios and its long-standing history of crisis hedging continue to confer credibility. Bitcoin, by contrast, benefits from growing adoption and a broader, more diverse set of drivers—network usage, regulatory developments, and market structure improvements—that collectively influence its reaction to broader risk shifts. The narrative is not a binary of one asset outperforming another during crises; it is a testimony to the evolving landscape where traditional stores of value and digital assets coexist as components of diversified risk management.
To ground this analysis in verifiable facts, the crisis highlighted concrete data points: about 20% of the world’s oil moves through the Strait of Hormuz, a chokepoint that amplifies energy-price sensitivity during geopolitical tensions; the market saw gold prices rise initially but later retreat as the U.S. dollar strengthened and U.S. Treasury yields rose; Bitcoin traded a wide range before stabilizing in a mid-$70,000 vicinity in early March. Central-bank dynamics also surfaced, with gold reserves measured around 36,000 metric tons among major holders, reflecting the enduring importance of official sector demand in precious metals markets. The broader takeaway remains: while Bitcoin is carving out a legitimate, evolving role in the risk-off spectrum, it has not yet settled into a predictable safe-haven pattern like gold, and its behavior is increasingly tied to liquidity conditions and investor sentiment across asset classes.
What to watch next
- Monitor how Bitcoin (BTC) trades in response to fresh geopolitical headlines and any shifts in global risk appetite over the coming weeks.
- Track oil prices and energy-market developments tied to Hormuz-related disruption fears, as these will influence inflation expectations and macro liquidity conditions.
- Watch central-bank communications and gold reserve updates, particularly from major holders, as these can affect the relative appeal of gold as a crisis hedge.
- Observe regulatory signals and policy developments affecting cryptocurrencies in major jurisdictions, which can alter liquidity and institutional participation.
Sources & verification
- Energy data showing roughly 20% of world oil passes through the Strait of Hormuz (EIA): https://www.eia.gov/todayinenergy/detail.php?id=65504
- Oil price and market reaction coverage during the Iran-related escalation (Reuters): https://www.reuters.com/business/energy/oil-soars-25-gold-drops-iran-war-jolts-global-commodity-markets-2026-03-09/
- Euro area central-bank gold holdings and related data (ECB): https://www.ecb.europa.eu/press/other-publications/ire/html/ecb.ire202506.en.html#:~:text=Global%20holdings%20of%20gold%20by%20central%20banks%20now%20stand%20at%2036%2C000%20tonnes
- Bitcoin price commentary and milestones during late February and early March 2026 (Cointelegraph): https://cointelegraph.com/news/bitcoin-price
- “Store of value” debates and Bitcoin-led analyses cited in related Cointelegraph features (e.g., https://cointelegraph.com/features/can-bitcoin-really-be-a-store-of-value-what-pension-funds-are-starting-to-discover)
- Discussion on Bitcoin as a store of value amid policy shocks referenced in NYDIG coverage (https://cointelegraph.com/news/bitcoin-acts-store-of-value-amid-trump-policy-chaos-nydig)
What the article shows: A closer look at the crisis and crypto
Bitcoin (CRYPTO: BTC) is increasingly seen as a hedge option beyond its role as a payment network and speculative asset. Yet the Iran crisis underscores that its safe-haven credentials are not unconditional. The asset’s success in cushioning portfolios will depend on liquidity, market depth, and the trajectory of macro indicators such as dollar strength and interest rates. Gold’s steadiness as a traditional crisis hedge remains a touchstone for risk managers, while Bitcoin’s evolving dynamics suggest a more nuanced, hybrid function within diversified strategies.
As the market digests the 2026 Iran shock, investors will be watching whether BTC proves its ability to absorb shocks with less volatility than risk assets or if liquidity constraints continue to dictate its price path. The divergence between gold and Bitcoin in this episode does not diminish the potential for both to coexist as components of a resilient portfolio, but it does recalibrate expectations for how these assets respond under extreme geopolitical stress and macro uncertainty.
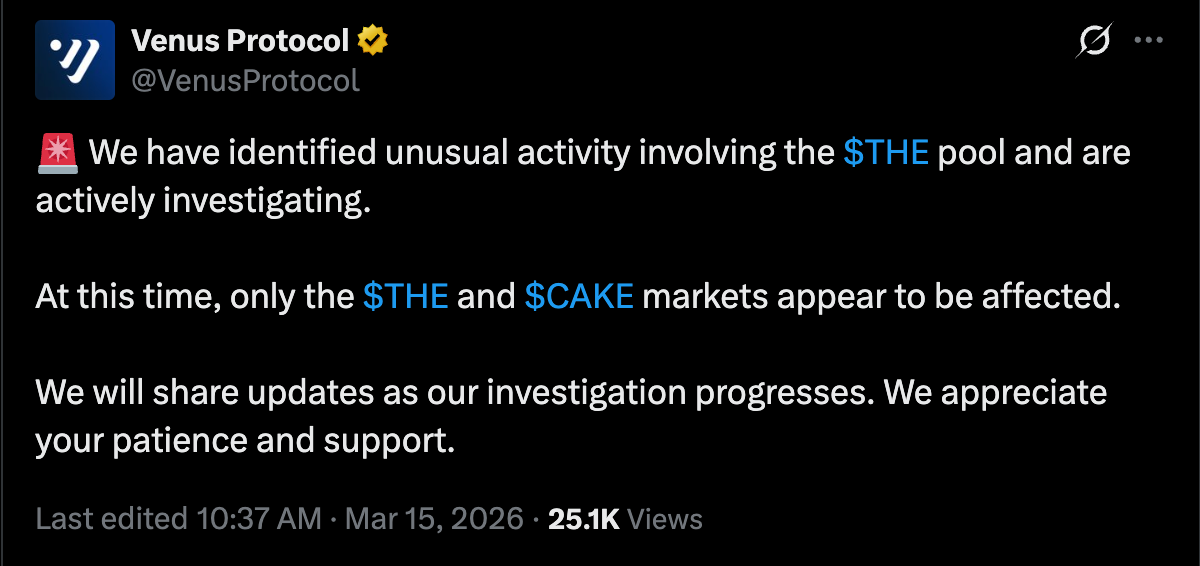
Venus Protocol, a decentralized lending and borrowing platform, said on Sunday it had detected suspicious trading activity in the liquidity pool for the Thena (THE) token, the native cryptocurrency of the Thena decentralized finance platform.
The unusual trading activity only affected pools for the Cake (CAKE) token, the native cryptocurrency of the PancakeSwap decentralized exchange, and the Thena token, according to an announcement from Venus Protocol. The Venus team said:
“As we continue to investigate the unusual activity in the THE pool, we are taking precautionary action by pausing all THE borrows and withdrawals effective immediately, to prevent any further misuse. This will remain in effect until the investigation is concluded.”

The suspicious trading activity is suspected to be a supply cap attack that was executed in two phases: a steady accumulation of about 84% of the total THE token market cap, coupled with a lending attack, according Allez Labs, which was identified by Venus Protocol as its risk manager.
The Venus exploiter used the Theta token as collateral to borrow 6.67 million CAKE tokens, 1.58 million USDC (USDC), 2,801 BNB (BNB) — the native token of the BNB chain — and 20 Bitcoin (BTC), Allez Labs said.
Out of caution, withdrawals and borrowing for other tokens, which have low liquidity on the platform, were also temporarily halted, Allez Labs said. The total amount lost in the attack is now over $3.7 million, according to Wu Blockchain.
At the time of publication, THE was trading at $0.2255 apiece, down more than 17% in the last 24 hours, according to pricing data on CoinMarketCap.com.

Cointelegraph reached out to Venus Protocol but did not obtain a response by the time of publication.
The incident highlights the cybersecurity and code exploit threats faced by crypto users and decentralized finance platforms, as the sector grows and security threats that cause financial loss become increasingly sophisticated.
Related: February crypto losses hit lowest level since March 2025, says PeckShield
Monthly crypto losses from hacks fall in February, as attackers pivot to social engineering scams
The value lost in crypto-related hacks fell to $49 million in February, the lowest level in nearly a year, according to blockchain security firm PeckShield.
Despite the reduction in total value lost to hacks and code exploits during February, there was an uptick in phishing and social engineering scams.

“The majority of individual attacks targeted private users through phishing attacks, malicious signatures, and address poisoning scams,” according to a report from blockchain intelligence platform Nominis.
Phishing scams often use fake websites, which feature addresses that are nearly identical to legitimate domain names. These fraudulent websites have malware designed to steal private keys for cryptocurrencies or other sensitive information.
Magazine: ‘SEAL 911’ team of white hats formed to fight crypto hacks in real time

Though we’re still waiting on a lot of the formal rulemaking and proposed rulemaking from the federal securities and commodities regulators, last week’s memo is another sign that the SEC and CFTC are at least serious about signalling these efforts are coming.
You’re reading State of Crypto, a CoinDesk newsletter looking at the intersection of cryptocurrency and government. Click here to sign up for future editions.
The narrative
The U.S. Securities and Exchange Commission and the Commodity Futures Trading Commission formally agreed to work more closely together to explain how they’d oversee crypto and other issues.
Why it matters
The agencies continue to signal that their past regulatory turf war has ended, and laid out a an explanation of how they’ll jointly approach rulemaking — a welcome sign for the crypto industry.
Breaking it down
The SEC and CFTC signed a memorandum of understanding last week aimed at combining their regulatory approaches to the digital asset and other emerging technology sectors. According to the memo, the agencies will regularly hold joint meetings, share data and otherwise communicate their efforts to oversee the digital asset sector.
“More than aligning our rules, a harmonized framework also demands coordinating our responses to the firms that operate within it, including those that have questions of interpretation or request exemptive relief,” SEC Chair Paul Atkins said in prepared remarks earlier this week.
The chief suggestion here: That the SEC and CFTC will coordinate how they’re both defining a digital asset as a security or a not-security, in a way they didn’t two years ago.
One of the goals of the memo is for the agencies to “clarify product definitions through joint interpretations and rulemakings,” it said.
The memo also said the agencies would update their regulatory frameworks for regulated companies across a number of areas, including clearing and margin, trade data and intermediaries, among others.
This harmonization effort may extend beyond just crypto — the regulators are considering moving into one office building (the SEC’s), Bloomberg reported.
While the SEC and CFTC are making efforts to merge their approaches to the sector, the agencies and broader industry participants are still waiting to see what happens with the market structure bill currently working its way through the Senate. Senate Majority Leader John Thune told Punchbowl News that he did not expect the bill to work through the Senate before the “April time period” earlier this week.
Congress is just a week out from its two-week Easter break, meaning even if the Senate Banking Committee’s members come to an agreement to move the bill forward, sheer logistics mean the Senate is unlikely to have time to get to the bill in the immediate future. While I’m not sure how much this will affect the Senate’s work on market structure, it’s also worth noting that lawmakers are still negotiating a bill to fund the Department of Homeland Security, and President Donald Trump has said he wants Congress to pass the Safeguard American Voter Eligibility Act (SAVE Act) before he would sign any other bill. Neither of these efforts seem likely to pass immediately however, reporting suggests.
This week
- There are no hearings scheduled as of press time. My colleague Jesse Hamilton and I will be at the Digital Chamber’s conference in Washington. Come say hi!
If you’ve got thoughts or questions on what I should discuss next week or any other feedback you’d like to share, feel free to email me at [email protected] or find me on Bluesky @nikhileshde.bsky.social.
You can also join the group conversation on Telegram.
See ya’ll next week!
TLDR:
- U.S. oil companies are projected to earn $63 billion in additional cash flow in 2025 alone.
- Oil prices surged from $70 to over $100 per barrel following the U.S.-Iran conflict on Feb. 27.
- Exxon and Chevron are keeping capital spending flat, directing profits to wealthy shareholders instead.
- Economists now place the probability of a U.S. recession at 25% as energy-driven inflation rises fast.
Oil prices have surged past $100 per barrel after hostilities between the U.S. and Iran began on February 27. The spike has positioned U.S. oil companies to record some of their highest profits in years.
American consumers are absorbing sharply rising costs at the pump. The situation has drawn attention to where the financial windfall is going. Major producers like Exxon and Chevron are projected to benefit the most.
Oil Companies Hold Spending Flat While Profits Climb
Oil prices climbed from $70 to over $100 a barrel after the conflict disrupted global supply routes. The Strait of Hormuz carries around 20% of the world’s total oil. Disruptions there have created what analysts call the most severe supply shock in recent history.
Historically, higher oil prices have prompted energy companies to expand drilling and output. That process typically pushes prices lower by adding more supply to the market.
However, major producers are not following that pattern this time. Companies like Exxon and Chevron have kept capital spending flat despite record-high prices.
According to BullTheoryio, these companies are not hiring more workers or building more rigs. Every extra dollar paid at the pump is being retained as profit rather than reinvested.
This represents a break from historical industry behavior. The strategy reflects a clear preference for capital discipline over expansion.
U.S. oil companies are on track to generate $63 billion in additional cash flow this year alone. Of that, 45% is going directly back to shareholders.
Exxon alone is projected to earn between $25 billion and $30 billion in extra revenue. Chevron is expected to record an additional $12.5 billion in gains.
Consumers Face Recession Risk as Wealth Gap Widens
Gas prices rose approximately 40 cents in a single week after the conflict escalated. That jump has strained household budgets already under pressure from broader inflation.
High energy costs lift prices for groceries, rent, and electricity. Economists now place the probability of a recession at around 25%.
Since 2022, the five largest oil majors have collectively earned $467 billion in profit. That figure covers several years of elevated energy prices before this conflict began. The current surge adds to what is already the most profitable run in the industry’s recent history.
BullTheoryio noted President Trump’s remark that the U.S. “makes a lot of money” when oil prices rise. Critics argue, however, that those gains are concentrated among corporations and large investors.
The broader public sees little direct financial benefit from higher crude prices. Most returns flow to institutional shareholders.
The current situation reflects a structural shift in how energy profits are distributed. Oil companies are prioritizing shareholder returns over reinvestment, which limits any new supply from entering the market.
With less drilling activity, downward pressure on prices remains low. Consumers are therefore left with little short-term relief from rising costs.


Researchers are warning that Ethereum dust attacks have surged, with USDT and USDC transfers seeing major spikes.
Analysis of the 90 days before and after the December 3 Ethereum Fusaka upgrade indicates a steep rise in the number of address poisoning scams.
Stablecoin transactions on Ethereum are among the biggest hits with this ever-rising problem.
Dust Transfers Explode After Fee Reductions
Researcher Wise Crypto says that dust attacks went up sharply all over the Ethereum ecosystem. They wrote on X on March 13 that there had been a huge increase, especially in stablecoin movements.
The number of USDT transfers under $0.01 went up by 612%, from about 4.2 million to 29.9 million. A similar thing happened with USDC, where the number of transactions went from 2.6 million to 14.7 million, a 473% increase. Dust transfers that were mostly in ETH and DAI went up by 470% and 62%, respectively. The first one saw 65.2 million new transfers.
Address poisoning campaigns insert fake addresses whose beginning and ending characters are nearly similar to genuine ones into the victim’s trading history, hoping users will copy them when sending funds. Often, because wallet interfaces display only shortened addresses, the spoofed entries will appear genuine.
In one case, on-chain investigator Specter reported a victim losing $50 million in an address poisoning attack in late December 2025. Another blockchain enthusiast reported a case where a single wallet address lost more than $388k in those attacks while replying to Wise Crypto’s post.
Analysts at Etherscan attribute the problem to Ethereum’s Fusaka upgrade, which relatively improved the network’s scalability while reducing the fees, hence cutting the costs of sending dust transfers. As a result, attackers can run campaigns at much higher volumes than before.
You may also like:
Industrialized Scams Target High-Value Wallets
In a study of periods between July 2022 and June 2024, security researchers found there were over 17 million phishing attempts targeting about 1.3 million users of the Ethereum network. The result was over $79 million in losses.
The method relies on scale rather than precision, with analysts indicating that in some cases, dozens of poisoning transactions will occur within minutes of a single legitimate stablecoin movement. In fact, an X user known as Nima reported receiving over 89 notifications after merely two stablecoin transfers, in a show of the efficiency of automated scripts.
Only one of every ten thousand dust transfer attempts is successful, according to a study cited by Etherscan. Hence, by sending millions of such transactions, malicious actors are playing a long-term numbers game.
The block explorer explained in the post:
“A single successful attack involving a large transfer can easily cover the cost of thousands of failed attempts.”
According to Wise Crypto, the best defense remains simple: always verify the full destination address before sending funds and avoid copying wallet addresses directly from transaction history.
Binance Free $600 (CryptoPotato Exclusive): Use this link to register a new account and receive $600 exclusive welcome offer on Binance (full details).
LIMITED OFFER for CryptoPotato readers at Bybit: Use this link to register and open a $500 FREE position on any coin!
TLDR:
- Strategy holds 738,731 BTC and may be buying roughly 30,000 Bitcoin per week at its current pace.
- Saylor links 5% Bitcoin network ownership to a $1M price, a threshold now just 11 weeks away by volume.
- Acquiring 7.5% of Bitcoin’s total supply, tied to a $10M price target, could happen by late September 2026.
- If accumulation outpaces original models, Bitcoin’s repricing timeline may compress well beyond early forecasts.
Bitcoin accumulation by Strategy, formerly known as MicroStrategy, has outpaced even its own executive chairman’s expectations.
Michael Saylor’s long-term price targets are now being weighed against a timeline far shorter than originally projected.
Strategy currently holds 738,731 BTC on its balance sheet. Analysts are watching closely as the company’s weekly buying rate raises fresh questions. The key question is how soon Saylor’s supply-squeeze thesis could begin to take real shape.
Strategy Approaches Critical Bitcoin Network Ownership Thresholds
Saylor has stated that acquiring 5% of Bitcoin’s 21 million total supply would drive the price to $1 million per coin. That level equates to approximately 1.05 million BTC. He has further linked the 7.5% threshold, around 1.575 million BTC, to a Bitcoin price of $10 million per coin.
In a post on X, analyst David Lawrence noted that Strategy may have purchased roughly 30,000 BTC this week alone.
At that run rate, the company could reach the 5% ownership threshold in approximately 11 weeks. Furthermore, the 7.5% mark could arrive as early as the end of September 2026, roughly six months away.
However, most market observers agree that Bitcoin reaching $1 million within 11 weeks is not a realistic expectation.
Saylor originally framed those price predictions as long-term projections spanning 10 to 20 years. The accumulation timeline and the price appreciation timeline, therefore, are not expected to align in the near term.
Even so, the pace of Strategy’s buying campaign has caught many in the Bitcoin community off guard. Few analysts had built models where critical Bitcoin network thresholds could be approached within a single calendar year. The market is now actively adjusting those assumptions.
Bitcoin Supply Squeeze Could Compress the Repricing Timeline
Withdrawing 1.5 million BTC from active circulation places direct pressure on Bitcoin’s available supply. When tens of billions of dollars flow into the network consistently each week, the supply-demand balance begins to tighten. Over time, that tightening has historically preceded upward price moves in Bitcoin.
Saylor has additionally projected a 29% compound annual growth rate for Bitcoin over the next 21 years. That forecast was originally built around a more gradual accumulation pace.
Now that Strategy’s buying speed is outrunning those assumptions, the repricing timeline may also move faster.
The relationship between supply reduction and Bitcoin’s price response has clear precedent in market history. Previous halving cycles showed that constrained supply, combined with strong and sustained demand, consistently led to notable price appreciation.
Strategy’s institutional purchasing replicates that same pressure, though through market buying rather than protocol-level supply changes.
As a result, the next six months will serve as a live test of Bitcoin’s reaction to aggressive accumulation. If Strategy maintains this pace, some of Saylor’s long-term projections may arrive earlier than the 21-year window originally envisioned. That would mark a fundamental shift in how the market prices Bitcoin’s scarcity over time.

S&P 500: An End In Sight (Technical Analysis)
Injective Flips Bearish Structure After Monthly Order Block Holds: What’s Next for INJ?
‘Have you ever seen this?’ Rules needed after Tour pro’s ball falls in hole


-
 Tech5 days ago
A 1,300-Pound NASA Spacecraft To Re-Enter Earth’s Atmosphere
-
Crypto World2 days ago
HYPE Token Enters Net Deflation as HyperCore Buybacks Outpace Staking Rewards
-

 News Videos6 days ago
10th Algebra | Financial Planning | Question Bank Solution | Board Exam 2026
-

 Business5 days ago
ExxonMobil seeks to move corporate registration from New Jersey to Texas
-

 Crypto World6 days ago
Paradigm, a16z, Winklevoss Capital, Balaji Srinivasan among investors in ZODL
-

 Fashion2 days ago
Weekend Open Thread: Addict Lip Glow
-

 Tech5 days ago
ChatGPT will now generate interactive visuals to help you with math and science concepts
-
Sports1 day ago
Why Duke and Michigan Are Dead Even Entering Selection Sunday
-

 NewsBeat4 days ago
Residents reaction as Shildon murder probe enters second day
-

 Business5 days ago
Search Enters Sixth Week With New Leads in Tucson Abduction Case
-
 NewsBeat6 days ago
Pagazzi Lighting enters administration as 70 jobs lost and 11 stores close across Scotland
-

 Tech6 days ago
Despite challenges, Ireland sixth in EU for board gender diversity
-

 Business1 day ago
US Airports Launch Donation Drives for Unpaid TSA Workers as Partial Government Shutdown Enters Fifth Week
-

 NewsBeat4 days ago
I Entered The Manosphere. Nothing Could Prepare Me For What I Found.
-
Crypto World1 day ago
Coinbase and Bybit in Investment Talks: Could Bybit Finally Enter the US Crypto Market?
-

 Business6 days ago
Search Enters 39th Day with FBI Tip Line Developments and No Major Breakthroughs
-

 Sports6 days ago
Skateboarding World Championships: Britain’s Sky Brown wins park gold
-

 Business1 day ago
Country star Brantley Gilbert enters growing non-alcoholic beer market
-

 Crypto World5 days ago
Will Chainlink price reclaim $10 amid volatility squeeze?
-

 Sports4 days ago
PWHL, Senators discussing plan to keep Charge in Ottawa

