

Crypto World
Bitcoin Falls to $58K as Bear Pressure Builds; $50K Key Level

Bitcoin slid below the $60,000 mark on Thursday, a move that drew attention to fresh downside technical risk and underscored how sensitive crypto remains to swings in broader financial markets. The drop followed weakness in megacap technology stocks, which dampened overall risk appetite and added pressure to BTC as it approached another critical psychological level.
From a charting perspective, the selloff has also helped activate multiple bearish patterns. Analysts say the combination of a breakdown below $60,000 and the completion of two separate setups on lower timeframes increases the odds of a move toward—and potentially through—the $54,000 area in the coming days.
Key takeaways
- BTC’s break below $60,000 has wiped out its June gains and triggered fresh technical downside scenarios.
- A four-hour “rounded top” structure appears to have completed, with a projected target just under $54,000.
- On the daily chart, a bear-flag breakdown points to the same $54,000 zone, strengthening the bearish case.
- Glassnode’s MVRV pricing bands align with the $54,000 area as an important potential support level.
Why $60,000 losing momentum matters
On Thursday, BTC/USD fell as much as 4.8% and traded down to an intraday low near $58,000, according to the market moves referenced in coverage of Bitcoin’s weakness. Importantly for traders, that decline did not stop at a minor dip—by moving below $60,000, Bitcoin broke a widely watched psychological threshold.
With the broader market in a fragile posture, that kind of level loss often changes how participants position. Instead of treating the area as “support to defend,” many traders reframe it as a level that must now be reclaimed to prevent further downside follow-through.
Rounded top breakdown points to a repeat target
The most direct technical argument for additional selling comes from the four-hour chart. Coverage notes that the price action completed what appears to be a rounded top pattern on that timeframe. In technical analysis, a rounded top forms when upward momentum gradually weakens, eventually shifting the asset from an uptrend into a downtrend that resembles an inverse “U” shape.
The pattern’s signal becomes actionable when the market breaks below the structure’s “neckline,” the support area that marks the base of the formation. After that breakdown, analysts typically estimate a downside objective by measuring the distance from the top of the formation to the neckline and projecting that same distance downward from the breakdown point.
Using that method, the measured downside target for Bitcoin is described as sitting just under $54,000, implying roughly an 8.9% drop from current prices at the time of reporting. The key point for readers is not the exact precision of the number, but the directional clustering: if multiple independent setups converge on the same zone, traders often treat that area as the next likely “decision point” on the chart.
Daily bear-flag adds weight to the $54,000 zone
To make the bearish case stronger, the article also points to confirmation from the daily chart via a bear-flag breakdown. Bear flags generally emerge after a sharp decline, followed by a period of consolidation that resembles a flagpole-and-flag structure. When price later breaks out downward from that consolidation, the pattern is often treated as implying that the prior down-move can extend.
In this case, the bear-flag breakdown is stated to project an identical move toward the $54,000 zone. That matters because it reduces the probability that $54,000 is merely a one-off technical estimate. Instead, two different pattern frameworks—rounded top on one timeframe and bear flag on another—are both pointing to the same region, which tends to attract concentrated positioning from market participants who follow chart-based signals.
On-chain confirmation: MVRV bands highlight potential support
Beyond pure price patterns, the coverage also turns to on-chain analysis from Glassnode, focusing on MVRV pricing bands. MVRV compares Bitcoin’s current market price with its realized price—the average price at which coins last moved on-chain. Put simply, these bands are often used to gauge whether BTC is trading in unusual profit or loss territory relative to where holders last established their cost basis.
As of Wednesday, the article states that Bitcoin traded near $60,997, while the 1.0 MVRV band—shown in green—sat around $53,390. That level closely matches the technical downside target near $54,000. When on-chain bands and chart objectives overlap, it can suggest a confluence area where demand might emerge, particularly if sellers start to encounter holders sitting at less favorable positioning.
However, the same framework also warns that a deeper decline could bypass that support. The article notes that if selling intensifies, Bitcoin could test the 0.8 MVRV band (shown in blue) near $42,700. Historically, it says, major bear-market bottoms have tended to form around that lower band—where unrealized losses become more extreme and capitulation risk rises.
For investors and active traders, this creates a more structured “map” of scenarios: $54,000 is framed as a near-term target and potential support test, while the $42,700 area is presented as a lower-bound zone to watch if the market fails to stabilize before then.
Readers should watch for whether Bitcoin can reclaim and hold above $60,000 after the breakdown, since that would challenge the bearish pattern narratives. If BTC instead keeps pressing lower, the next key question becomes whether $54,000 holds as a confluence support area—or whether conditions deteriorate enough to push price toward the deeper MVRV band levels.

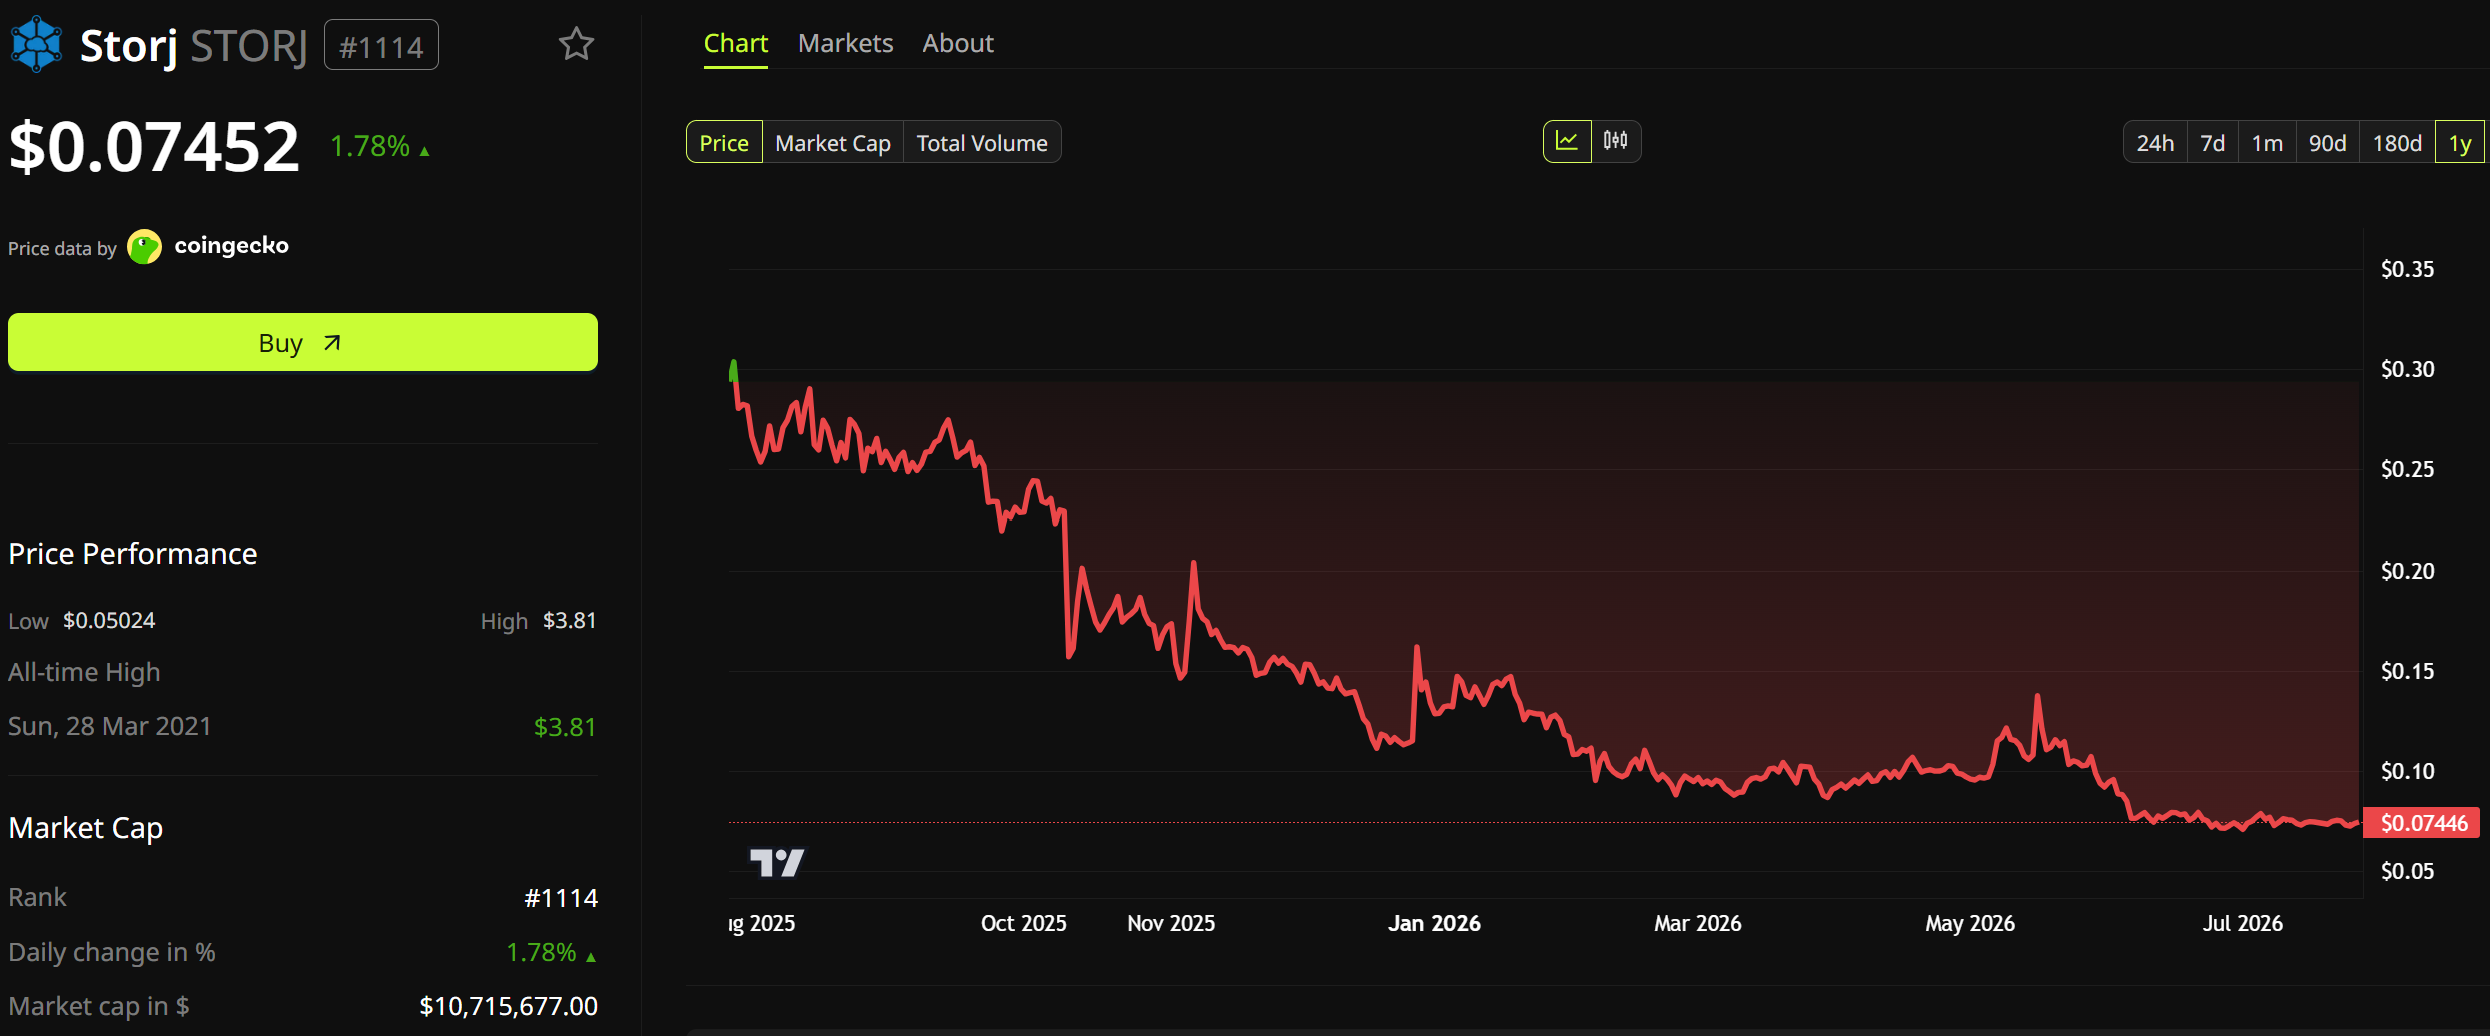
Storj filed for bankruptcy protection on Sunday. The company says its network still works and STORJ tokens still work. Its owner made similar promises nine months ago.
Storj now wants to hand token holders a slice of the rebuilt company. But a judge must approve that. And creditors get paid first.
Why Storj Filed Chapter 11
Storj Labs filed in a federal bankruptcy court in West Virginia. The case number is 5:26-bk-00512.
Follow us on X to get the latest news as it happens
Chapter 11 is not a shutdown. It lets a company keep trading while a court helps it clear its debts.
Storj says those debts are old. They came from an earlier phase of the business. The company cannot grow its way out of them.
“The business underneath is strong and right-sized. What holds it back are legacy obligations from an earlier chapter.”
That was Kaloyan Raev, Storj’s director of software engineering. He also signed the letter to token holders, not Chief Executive Colby Winegar.
What It Means for STORJ Holders
Nothing changes for the token today, Storj says. Data still moves across tens of thousands of storage locations in more than 100 countries.
The company plans to offer holders equity in the new Storj. Equity means part-ownership. The rules for who qualifies have not been written yet.
Those rules will matter. About 143.8 million STORJ trade freely out of 425 million in total. Two-thirds of the supply sits elsewhere.
Bankruptcy also has a payment order. Creditors come before owners. Storj’s letter to token holders admits it can promise intent, not results.
The Warning Sign From October
Inveniam Capital Partners announced it was buying Storj on Oct. 22, 2025. It promised no changes to contracts, pricing, or leadership.
“We’re particularly excited to integrate the STORJ token into our ecosystem, driving greater utility and alignment across our platforms.”
That was Patrick O’Meara, Inveniam’s chairman and chief executive. STORJ traded near $0.1872 that day. It has fallen about 60% since.

A closer warning came this month. MVMT Labs filed Chapter 11 in Delaware on July 15. Its Movement (MOVE) token hit a record low of $0.00964 ten days later.
STORJ has held up so far. It trades near $0.0745, up 1.5% on the day. Volume is $5.6 million and market value is $10.7 million.
The wider sector is soft too. Storage and infrastructure tokens have lagged even as network usage grew.
Storj says it will share court dates as they land. But the fine print of the equity offer will decide what holders actually get.
The post Storj Chapter 11 Raises the Biggest Question for STORJ Token Holders appeared first on BeInCrypto.
Some analysts say Bitcoin (BTC) could reach $200,000 if the CLARITY Act becomes law. That is a very big if. Seven roadblocks now stand between the bill and a Senate vote.
The CLARITY Act would decide which US agency polices crypto. It has sat on the Senate’s to-do list since June 1 without a vote.
Why $200,000 Depends on One Bill
Start with the number. It describes one scenario, not a firm forecast. Research desk FM Intelligence sees Bitcoin between $135,000 and $200,000 over the next year. It gives that outcome one-in-four odds, and only if the bill is signed before the November midterms. Its main case is far lower at $95,000 to $130,000, per its published scenarios.
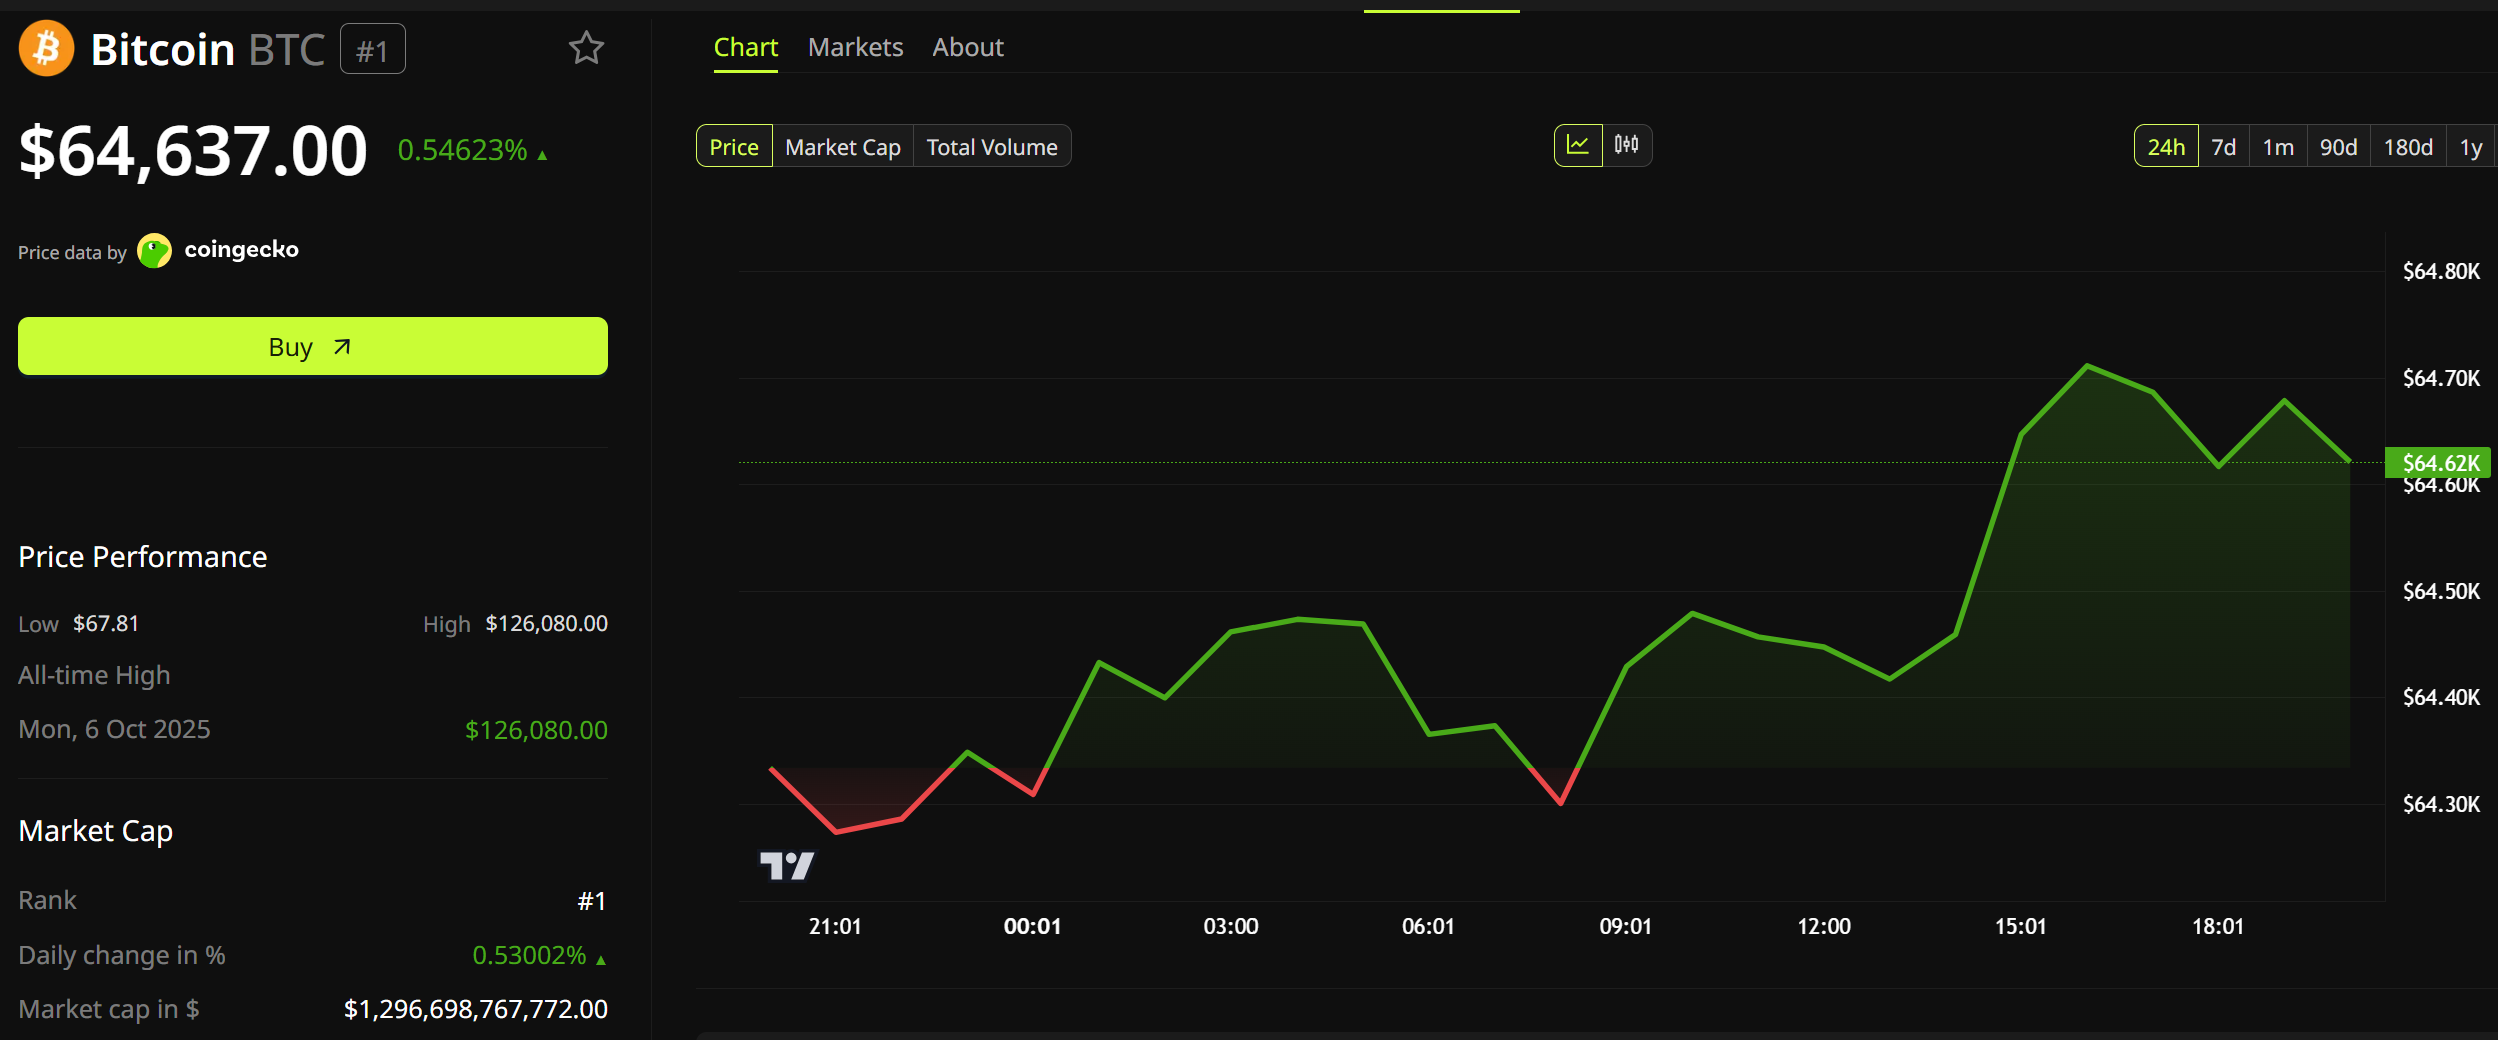
Now look at the gap. Bitcoin trades at $64,671, up 0.48% in a day, with a market value of $1.29 trillion.

Reaching $200,000 means the Bitcoin market price would need to roughly triple. It already sits about 49% below its record of $126,080, set on October 6, 2025.
Sentiment has turned this month, though. Treasury Secretary Scott Bessent said on July 21 that Congress was on the “1-yard line.” Bitcoin jumped toward $67,000, ending roughly 15% above its early July low.
“The formal passage of the Clarity Act into law will be the ultimate catalyst, sparking a new bull market as institutional allocators race to gain exposure out of a fear of missing out,” Forbes reported, citing CK Zheng of ZX Squared Capital.
CK Zheng once ran risk for Credit Suisse. He now runs the hedge fund ZX Squared Capital.
Wall Street Has Already Priced In Some Failure
Big banks have moved the other way. Citi cut its 12-month Bitcoin target to $82,000 on July 1. That was its second cut of 2026. The bank opened the year expecting $143,000, then trimmed that to $112,000 in March.
Its target has fallen 43% this year. Each time, Citi blamed the stalled bill rather than Bitcoin.
Alex Saunders leads the bank’s macro and decentralized finance (DeFi) research. He warned in March that the window for US legislation was closing.
Standard Chartered is warmer but still modest. Geoffrey Kendrick kept its year-end target at $100,000 in mid-July, which would need a 55% climb.
7 Roadblocks in the Bill’s Way
The following roadblocks make the case for what may make the Clarity Act not get the passage analysts are wagering their passage best on.
1. The senators blocking it are not crypto opponents
Seven Democrats rejected the current text in a joint statement on July 22. They are Catherine Cortez Masto, Angela Alsobrooks, Cory Booker, Ruben Gallego, John Hickenlooper, Mark Warner and Raphael Warnock.
Here is the surprise. All seven voted for the GENIUS Act, the stablecoin law, in June 2025.
That bill passed 68-30 with 18 Democrats behind it, Senate records show. Trump signed it into law weeks later.
Elizabeth Warren voted against it and remains opposed today. She was never a winnable vote, so she is not the obstacle.
The wall is built from proven crypto supporters.
2. Republicans cannot reach 60 without them
Senators can stall any bill by refusing to end debate. Breaking that stall takes 60 votes. Republicans hold 53 seats, so seven must come from Democrats.
3. Trump earned $1.4 billion from crypto
Senate Banking’s minority staff reviewed the President’s financial disclosures. They found more than $1.4 billion in crypto income for 2025 alone.
World Liberty Financial, the Trump family’s DeFi venture, supplied $799 million. The $TRUMP meme coin added another $636 million.
4. Only Trump’s Justice Department could enforce the new rules
Republicans released fresh ethics language on July 22, and Trump agreed to it. Ranking Member Warren says it has holes.
State attorneys general could not enforce it, she argues. The rules would also expire once Trump leaves office.
“Donald Trump raked in more than $1.4 billion from cryptocurrency ventures, and this bill does nothing to prevent him from vacuuming up his next $1.4 billion in crypto profits… This bill should be dead on arrival,” said Senator Elizabeth Warren.
Follow us on X to get the latest news as it happens
5. The real deadline is August 7
The Senate’s summer break starts August 10, its own calendar shows. Friday, August 7 is therefore the last working day before members head home.

6. September offers only 14 working days
Senators return on September 14. They leave again on October 5 to campaign for the midterms.
That leaves 14 scheduled working days. It is a thin window for a bill that took a year to negotiate.
7. The House may reject the Senate’s version
Chairman Tim Scott moved the bill through committee 15-9 on May 14. The Senate then swapped in its own text.
The House passed a different version 294-134 in July 2025. It must now accept the 300-page Senate draft text or negotiate a compromise.
The Trap at the Center of the Bill
Traders have turned optimistic quickly. On Kalshi, the odds of passage before April 2027 jumped to 52% from 33% in one week.

Yet the bull case contains a trap. Bitcoin needs the bill signed before the midterms. The unresolved fight is over how much the President may keep earning from crypto.
Passing it would hand Trump a win weeks before voters decide control of Congress. Blocking it costs Democrats little, since the hurdles facing the bill run out the clock anyway.
Seven senators who already backed crypto once must decide whether this version is worth the price.
The post Analysts See Bitcoin at $200,000 on CLARITY Act Passage, But 7 Roadblocks Remain appeared first on BeInCrypto.

Sberbank, Russia’s largest bank, says it plans to roll out cryptocurrency trading infrastructure by Dec. 1, including a “digital depository” designed to record customers’ crypto ownership and handle transactions largely outside the public blockchain.
Interfax reported that the depository will track rights in clients’ cryptocurrency positions and process most transfers off-chain, while Sberbank will also run active wallets for deposits, withdrawals, and client-initiated transfers.
Key takeaways
- Sberbank’s scheduled Dec. 1 rollout would add a regulated-style custody and settlement layer, using a digital depository to record ownership and process transactions off-chain.
- Russia’s crypto market framework is progressing toward an effective date of Sept. 1, 2026, defining regulated participant categories and expanding central bank oversight.
- Regulatory preparation is unfolding alongside intensifying EU and UK sanctions affecting crypto-asset service providers linked to Russia-related activity.
- Investors and market participants should watch how Russia’s central bank sets licensing rules and eligibility for which assets can be offered through intermediaries.
Sberbank’s digital depository: custody and off-chain settlement
According to Interfax, the digital depository will serve as the core component of Sberbank’s planned infrastructure. It is intended to maintain records of customers’ cryptocurrency rights and to account for transactions outside the main blockchain.
The state-affiliated press service quoted Alexander Vedyakhin, Sberbank’s first deputy chairman of the management board, explaining that the depository would also support transfers requested through “active wallets.” In other words, customers’ interactions—depositing, withdrawing, and moving crypto via the bank—would be handled through a banking-operated system that mirrors custody and payment workflows more than traditional on-chain exchange mechanics.
The practical implication is that, if implemented as described, Sberbank could reduce reliance on direct peer-to-peer blockchain settlement for everyday client movements, instead concentrating transaction processing and ownership accounting inside the bank’s infrastructure.
Russia’s regulated crypto framework heads toward 2026
The Sberbank announcement arrives as Russia’s legislators have advanced the country’s first comprehensive crypto market framework. Earlier in the month, lawmakers completed final readings on a bill intended to bring crypto trading, custody, and settlement into a regulated financial system.
Earlier coverage from Cointelegraph noted that the bill would grant the Bank of Russia broad oversight of the regulated market. That oversight would include determining which crypto assets may be offered via licensed intermediaries and issuing implementing regulations.
Cointelegraph’s reporting also highlighted that the central bank has established liquidity thresholds for participating in the regulated market. Those thresholds include an average market capitalization above 5 trillion rubles (about $64 billion) and an average daily volume above 1 trillion rubles (about $12.8 billion) over a two-year period.
Once the framework takes effect, it establishes five categories of regulated market participants: crypto exchanges, brokers, asset managers, custodians, and exchange service providers. The framework is set to define what market participants can do—such as buying, selling, holding, and exchanging crypto assets—as of the effective date, Sept. 1, 2026.
Infrastructure rollout meets tightening sanctions environment
While Russia builds out domestic infrastructure, external compliance pressure continues to rise. The move toward a working crypto system inside Russia is unfolding as the European Union expands sanctions targeting Russia amid its war on Ukraine.
Last week, the EU listed cryptocurrency exchange HTX (formerly Huobi Global) among sanctioned entities. In a Thursday decision, the European Council amended earlier measures “in view of Russia’s actions destabilizing the situation in Ukraine,” adding HTX to a list of 18 entities “providing crypto-assets services or payment services established outside of the Union that are significantly frustrating the purpose of the prohibitions” against Russia.
Earlier, Cointelegraph reported that EU officials said they would prohibit Belarusian nationals and residents from owning, controlling, or managing crypto exchanges and digital asset service providers, aligning the approach with the EU’s Markets in Crypto Assets (MiCA) framework.
The sanctions on HTX were not limited to the EU. The UK government imposed similar measures in May, stating there were “reasonable grounds to suspect” HTX supported Russia’s government by using financial services and funds facilitated by sanctioned entities.
For market participants, the key tension is that Russia is tightening domestic regulation while many foreign-facing crypto service providers remain exposed to sanction risks and compliance constraints. That gap can shape where liquidity flows, which counterparties can operate with certain clients, and how banks and exchanges structure their services.
What to watch next: licensing mechanics and depository operations
Sberbank’s planned digital depository—alongside the broader Russia framework set for Sept. 1, 2026—puts the spotlight on implementation details. Readers should watch how the Bank of Russia operationalizes licensing requirements, how asset eligibility is defined under the liquidity thresholds, and whether bank-operated off-chain custody and transfer accounting becomes a model for other regulated intermediaries.
Outside Russia, the sanctions trajectory suggests that cross-border partnerships and access to international payment rails may remain a moving target for crypto businesses tied to the region.
It was less than a year ago when the Ethereum validator exit queue had stretched for 45 days as millions of tokens waited to be unlocked from staking.
Today, that queue has completely emptied out, while the number of ETH actually staked continues to grow to a new record.
No One Wants to Unstake ETH
Current data from ValidatorQueue shows that there are zero ETH waiting to be unstaked from the network. This means that if anyone decides to unstake their altcoin holdings, they can do so immediately, subject only to the protocol’s normal withdrawal process.
This is a significant turnaround from Q3 last year, when the exit queue had swelled to roughly 2.6 million coins. Validators were forced to wait up to 45 days before they could withdraw their holdings. At the time, Ethereum co-founder Vitalik Buterin defended the extensive period, arguing that it’s an important element of the network’s defense.
The narrative has completely flipped now. ValidatorQueue shows that over 2.5 million ETH is currently waiting to enter staking, translating into an estimated activation delay of nearly 44 days. Investors are willing to wait for a month and a half just to begin earning staking rewards on their ETH holdings.
This shifted imbalance suggests that investors are confident in Ethereum’s long-term outlook to remain strong despite the year-to-date price retracement. It also removes one of the most significant concerns from last year – that millions of staked ETH could suddenly flood exchanges if validators decide to cash out.

Record ETH Is Locked
The broader staking picture has also continued improving as the total number of active validators securing the network has neared 900,000. Almost 41 million ETH is currently staked, which is equivalent to roughly 33.6% of the entire circulating supply. This is the highest percentage in the network’s history, and it means that every one out of three ETH is locked in staking rather than sitting on exchanges or actively circulating.
Tom Lee’s Bitmine remains a leader in this field, having staked over 4.9 million tokens through its institutional platform MAVAN.
Although staked ETH is not permanently removed from supply, it is generally considered less liquid because validators must go through Ethereum’s withdrawal process before they receive access to those holdings.
However, Merlijn The Trader reported a rather intriguing and unexpected twist. The record amount of staked ETH comes even as staking rewards are down to 2.62% per year from 3.05% and issuance has increased from 0.757% to 0.842%.
The post Nobody Wants to Unstake Ethereum Anymore: Here’s Why It’s a Big Deal appeared first on CryptoPotato.

People shared private chats with Claude. Then strangers found those Claude chats indexed by Google, wallet details and all.
The chats also held access keys, CVs and company files. Anthropic, the company behind Claude, had not addressed the matter as of this writing.
Claude Chats Indexed by Google, Explained
A Reddit thread over the weekend showed the problem. One simple search brought up page after page of shared Claude chats.
People in the thread blamed a missing “noindex” tag. That tag tells Google to hide a page. The real cause looks different. Anthropic’s robots.txt file tells search engines to skip its share pages.

Here is the catch. Google will not open a blocked page. So it never sees the hide tag inside.
Picture a locked door with a note taped behind it. Nobody gets in. Nobody reads the note either.
Google can still show the web address. Other sites link to it, so Google knows it exists. Google just cannot see what sits on the page. Its own guide spells this out.
That fits the screenshots going round on X. Under each Claude link, Google said “No information is available for this page.” Bing showed a similar line.
So the chats never appeared in search previews. But anyone who spotted a link could click it and read the lot.
What the Share Button Really Does
Claude chats are private by default. That changes only when a user clicks Share.
Share builds a public web page. It holds every message sent up to that moment.
Two things stay out, according to Anthropic’s own help pages. Uploaded files are not included. Nor is raw data pulled in by connected tools.
Team and Enterprise accounts cannot share in public at all. This one lands on free, Pro and Max users.
Old links sit under Settings, Privacy, then Shared chats. Click Unshare to kill one.
Why Crypto Users Should Care
Developers flagged it, noting that wallet details and login credentials sat among the results, with some allegedly being able to read strangers’ chats through Brave Search.
For crypto, the stakes differ. A leaked password can be changed. A leaked private key cannot, as BeInCrypto has shown in past private key leak losses.
Small wallets are already the main target. Chainalysis counted 158,000 personal wallet hacks in 2025. Those hit 80,000 people and cost $713 million.
The 2022 figure was 54,000. None of it is tied to AI chats. It simply shows where thieves now spend their time.
More traders also connect AI to wallets to move funds and check code. Researchers have flagged tools that could expose wallet seed phrases as well.
One caution belongs here. Nobody has confirmed a seed phrase or a working key in the indexed chats. Nobody has reported stolen funds either.
Some developers pushed back too. Those pages were public by choice, they argued.
What Happens Next
The pages have gone from search. They have not gone away. Anyone with a saved link can still open the chat. Only the owner can stop that, by unsharing.
This has happened before. Google indexed just under 600 Claude chats in September 2025, as Forbes reported. OpenAI had dropped its own public sharing option a month earlier. It now faces a ChatGPT data sharing lawsuit.
A clean fix exists. Let Google open the share pages, then add the hide tag there.
Whether Anthropic does it will decide if this happens a third time.
The post People Found Crypto Wallet Data in Claude Chats Indexed by Google appeared first on BeInCrypto.

The U.S. Commodity Futures Trading Commission (CFTC) has issued another warning to prediction market operators, urging them to ensure that contract “self-certifications” are detailed and product-specific when event contracts cover a wide range of outcomes.
In an advisory published Friday, the CFTC said that—despite ongoing policy discussions and proposed rulemaking for prediction markets—operators may still certify certain event contracts as compliant with the Commodity Exchange Act and applicable CFTC regulations under the existing self-certification framework, so long as they follow the statutory requirements.
Key takeaways
- The CFTC warned that platforms should not use broad, template-style self-certifications for events contracts that cover many permutations.
- According to the agency, “self-certified” submissions must include the terms and conditions for each proposed variation and a concise explanation of compliance for the product as structured.
- The latest advisory echoes a prior CFTC warning earlier this year about overly generalized filings.
- The guidance arrives shortly before the CFTC’s July 27 deadline for comments on proposed rule amendments tied to public interest determinations for certain event contracts.
Why the CFTC is pushing back on template certifications
The CFTC’s Friday notice focused on how operators describe and certify event contracts under the agency’s jurisdiction. The regulator highlighted concerns with the number of instances where platforms have “self-certified” event contracts without providing sufficient detail for each version of the product.
In particular, the CFTC criticized submissions that do not include, for each proposed permutation of the contract, the terms and conditions and a concise explanation and analysis addressing compliance with respect to the product’s terms, the underlying commodity, and the product’s regulatory compliance.
As the CFTC put it in its July 24 announcement, the guidance “reiterates that broad, template-style certifications should not be submitted.” The agency framed this as a compliance issue rather than a change to the underlying legal concept of self-certification.
A repeat warning earlier this year
This is the second time in 2026 that the CFTC has flagged the same type of problem. In March, the Commission issued an earlier warning about submissions that were “overly generalized,” again indicating that template-level descriptions are not adequate when contracts are structured to cover a broad range of event outcomes.
By issuing a follow-up advisory in July, the CFTC effectively signaled that its concerns are ongoing and that it expects operators to make practical adjustments to how they document certifications—especially for contracts with multiple permutations rather than a single, narrowly defined instrument.
The practical takeaway for platforms is straightforward: if an operator is certifying a wide slate of event outcomes under one certification approach, the filing must still be organized in a way that maps to each contract variation and explains how the design fits regulatory requirements.
Advisory timing ahead of public interest rulemaking
The advisory landed just days before the July 27 deadline for submitting comments on the CFTC’s proposed rule amendments related to public interest determinations for certain event contracts that fall under the Commodity Exchange Act’s enumerated activities.
While the Friday guidance largely addresses self-certification behavior, the timing matters because it underscores that multiple regulatory strands for prediction markets are moving at once: day-to-day product certification practices, and longer-term rules for determining when specific types of event contracts should be evaluated or restricted on public interest grounds.
The CFTC has proposed amendments that outline how it determines whether certain event contracts are contrary to the public interest. In the agency’s proposal, it would apply a three-step analytical framework to evaluate contracts, including those involving activities such as terrorism or assassination, as well as gaming-related considerations tied to the enumerated activities listed in the Commodity Exchange Act.
If those proposed amendments are adopted, the CFTC said they would reshape parts of the regulatory landscape for prediction markets by clarifying the evaluation method used for specific contract types. Legal analysis cited in the source notes that the proposal could represent a meaningful shift in how prediction markets are assessed from a public interest standpoint.
What operators and traders should watch next
For prediction market operators, the CFTC’s warning increases pressure to ensure certification workflows produce filings that are not only legally sufficient but also detailed enough to match each contract permutation and the underlying product structure. Investors and traders should watch for how platforms revise their certification documents—and whether the CFTC’s public interest rule amendments, due to be shaped by the July 27 comment process, later alter the types of event contracts that can be listed or how they are evaluated for regulatory compatibility.
The S&P 500 rose 8.28% this year. However, ten of its own stocks lost more than 40%.
Both things are true at once. Investors are paying almost anything for AI. They are dumping whatever they think AI will kill.
AI Fear Crushed Software and Consulting Stocks
The damage is concentrated. Software, consulting and advertising names fill the bottom of the Slickcharts list.
It started in February. Anthropic released a new AI model. Enterprise software stocks sold off hard. Traders called it the SaaS-pocalypse.
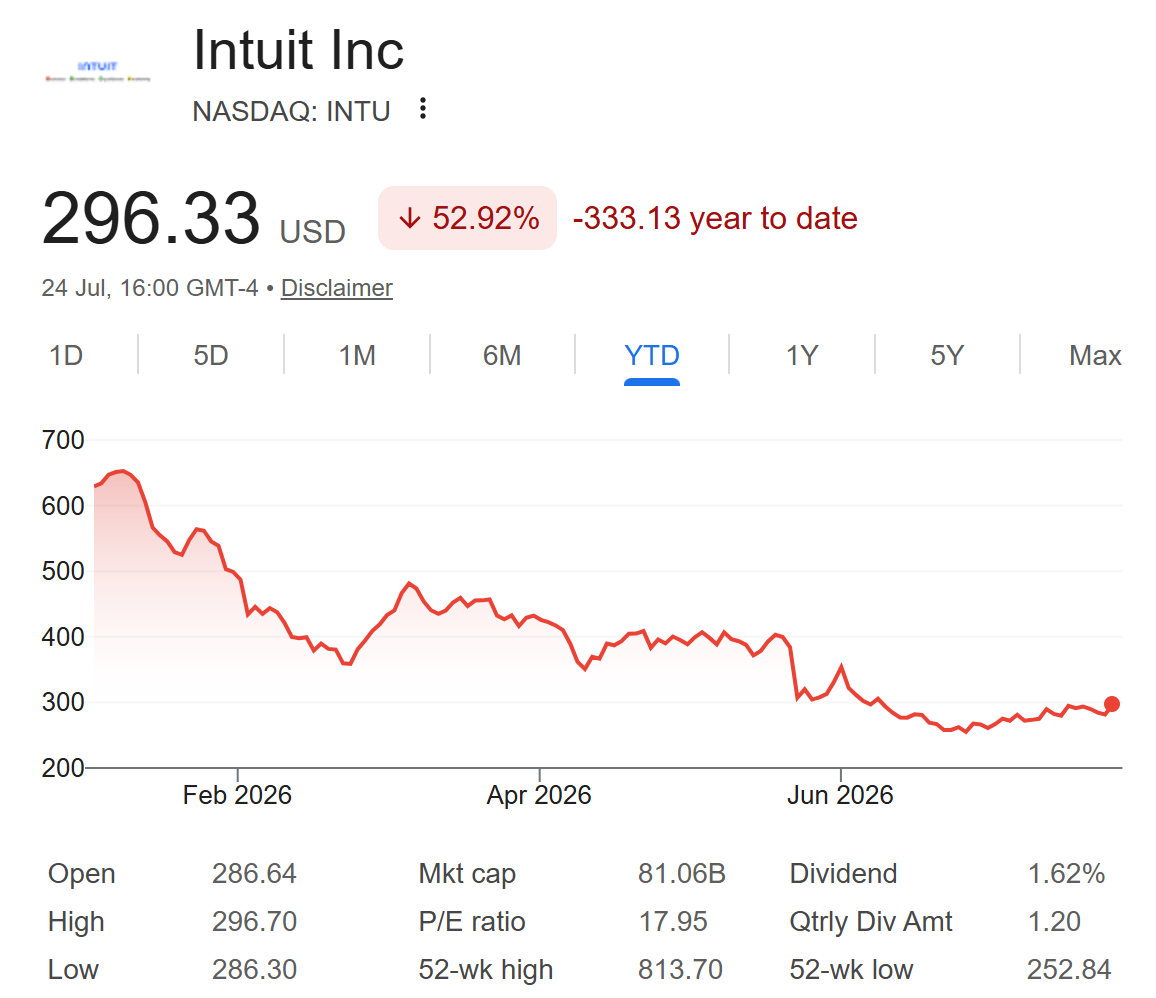
Intuit (INTU) is the clearest victim, down 55.27%. It owns TurboTax, which brings in about a quarter of company revenue and profit.

Then cheap AI tax tools arrived. Goldman Sachs analyst Gabriela Borges cut her price target in June to $276, down from $519.
Intuit moved fast. It cut 17% of staff, roughly 3,000 jobs. It also lowered its TurboTax forecast.
The company is now worth about $88 billion, Forbes reported. A year earlier it was worth more than $219 billion.
Accenture (ACN) tells a similar story, down 45.21%. Clients are spending on AI instead of consultants.
New client orders slipped to $19.3 billion from $19.7 billion. Accenture cut its sales growth forecast to between 3% and 4%. The stock fell almost 18% in one day.
Cognizant (CTSH), Gartner (IT) and The Trade Desk (TTD) each lost 44% to 55%. All three sell work that AI can copy.
But the Two Biggest Losers Had Nothing to do with AI
Here is the twist. The two worst stocks fell for old-fashioned reasons.

CoStar Group (CSGP) is down 58.86%, the weakest in the index. Its problem is spending, not AI.
CoStar owns Homes.com, a property listings site. In January it said the site will not cover its own costs until 2029. Profit is not expected until 2030.
The core business is fine. Revenue jumped 23% to $897 million last quarter. Profit was just $3 million.
Investors lost patience. In February, hedge fund D.E. Shaw told CoStar to quit or shrink Homes.com. It said the move could unlock more than $10 billion. CoStar called the campaign “activism malpractice.”
Shareholders backed the board in June. Nasdaq had already dropped the stock from its Nasdaq-100 index in May.
Boston Scientific (BSX) is down 53.59%. It simply grew slower than promised.
In February it expected sales to grow 10% to 11%. By April it cut that to between 6.5% and 8%.
A rival explains why. Medtronic said its heart device sales rose 124% in the United States. It took “an additional 8 points of U.S. share.”
Then bad news piled up. Boston Scientific recalled its Accolade pacemakers. Regulators tied the fault to four deaths and 2,557 serious injuries. It also agreed to buy Penumbra for $14.5 billion.
Where the Money Went Instead
Chip and memory makers took it. Sandisk (SNDK) is up 505.17% this year. Dell Technologies (DELL) rose 247.55%. Micron Technology (MU) gained 222.68%.

Small investors piled in too, feeding the AI capex boom through chip funds. A narrow group of winners now drives the whole index, as data on AI stocks driving gains shows.
Everything else got punished for any slip. Expensive stocks fell hardest when forecasts came down, a danger flagged in recent earnings bubble warnings.
CoStar and Boston Scientific both report results this week. Those numbers will show whether investors were right or just impatient.
The post 10 Stocks Lost Over 40% in 2026 as Investors Dumped Everything AI Might Kill appeared first on BeInCrypto.


The crypto industry, naturally, is urging passage. The common refrain online is that Clarity includes some investor protection rules and creates some structure for crypto products, while not passing the bill would mean there are no investor protections.
If the bill is to pass the Senate before summer recess begins, the first thing to watch for is a motion to proceed on Monday or Tuesday. This kicks off the formal process. If the motion to proceed is filed by Wednesday, one individual following the process said, that would still give the Senate enough time to vote on the bill before August 7, the last day of the summer session.
If the motion to proceed ripens — meaning it’s been an hour into the second day after the motion is filed, according to the Congressional Institute, a not-for-profit organization — there can be a cloture vote, most likely on the amendment in the nature of a substitute (i.e. the new text of the bill). If that passes, there can be another cloture vote later on for the actual passage of the bill.
“Recess deadlines are powerful tools,” Kristin Smith, the president of the Solana Policy Institute, told CoinDesk.
On a practical note, what this most likely means is we’ll see the motion to proceed Monday or Tuesday, two industry sources told CoinDesk, with a possible vote late next week.
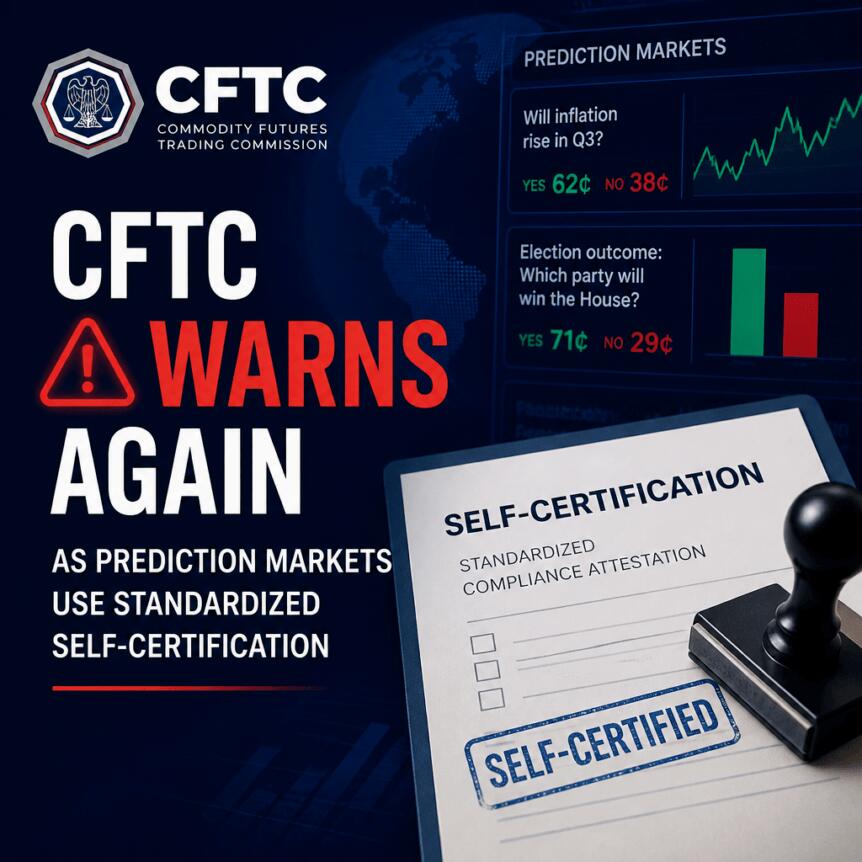
The US Commodity Futures Trading Commission (CFTC) has issued another warning to prediction market operators, urging them to follow its rules when certifying event contracts that cover a wide range of possible outcomes. The regulator said some platforms are submitting “self-certified” listings without providing the specific terms and compliance analysis required for each contract permutation.
In an advisory released on July 24 and published as part of a Friday notice, the CFTC reiterated that—despite ongoing policy discussions and proposed rulemaking—operators may still self-certify certain event contracts as compliant with the Commodity Exchange Act (CEA) and CFTC regulations, as long as they do so within the statutory self-certification framework.
Key takeaways
- The CFTC warned that broad, template-style self-certifications for event contracts are not acceptable for listings under its jurisdiction.
- Operators are expected to submit the terms and conditions for each proposed permutation, along with concise explanations tied to the product and the relevant commodity and compliance requirements.
- The advisory underscores the regulator’s view that generalized submissions have been a recurring issue, with a similar warning issued earlier this year.
- The latest move comes just before a public comment deadline tied to the CFTC’s proposed amendments on public interest determinations for certain event contracts.
Why the CFTC is pushing back on “self-certified” event contracts
According to the CFTC’s July 24 announcement, the agency has observed multiple instances where event contracts are being self-certified by platforms without supplying the full details the CFTC says it needs. Specifically, the regulator criticized submissions that do not include the terms and conditions of each proposed permutation, nor a concise explanation and analysis explaining how the product’s terms and conditions relate to compliance expectations.
The advisory frames this as a compliance execution problem rather than a blanket prohibition on prediction market products. The CFTC emphasized that operators can certify certain event contracts without seeking prior commission approval, but they must do so properly under the self-certification structure established by law and CFTC regulations.
In the regulator’s words, broad, template-style certifications should not be submitted. The CFTC’s concern is that generalized paperwork makes it harder to evaluate whether each individual contract listing complies with the CEA and applicable CFTC requirements—particularly when a contract covers a wide swath of events and permutations.
A warning issued twice in 2026
The July 24 advisory is not the first time the CFTC has flagged the issue this year. The agency referenced a similar warning on March 12, again targeting overly generalized submissions. By issuing the guidance for a second time, the CFTC is effectively signaling that it expects corrective action and that it views continued template-style filings as a repeated compliance failure.
For operators, this matters because self-certification is often treated as a faster path to listing products compared with seeking affirmative approval. If the CFTC continues to find that filings lack the required detail, platforms may face heightened regulatory scrutiny, which can translate into delays, requests for additional information, or more direct enforcement consequences—especially for contracts built around broad event categories.
Regulatory timeline: comments due before rule amendments
The advisory arrives shortly before the CFTC’s July 27 deadline for submitting comments on proposed rule amendments related to how the agency conducts public interest determinations for certain event contracts.
Those proposed amendments aim to clarify how the CFTC determines whether specific event contracts are contrary to the public interest under the CEA. The CFTC described the approach as a three-step analytical framework intended to evaluate contracts based on their involvement in certain enumerated activities—such as terrorism, assassination, or gaming—so that only appropriate contracts are listed for trading.
The proximity between the self-certification warning and the comment period is likely not accidental. For prediction market businesses, the next regulatory phase could change how contracts are assessed for public interest risks even if self-certification remains available in some circumstances. Operators will therefore need to reconcile two parallel expectations: submit sufficiently detailed self-certifications now, while also preparing for potential changes in the CFTC’s public interest evaluation standards later.
What changes for operators: from templates to permutation-specific filings
The practical thrust of the CFTC’s message is straightforward: when an event contract can take many forms—or when it is designed to cover numerous permutations—operators need documentation that matches that complexity. The CFTC’s criticism centered on certifications that do not provide, for each proposed permutation, the terms and conditions and a concise compliance explanation tailored to the product’s conditions, the underlying commodity, and applicable compliance considerations.
That means the template approach that may be common for scaled product development—where only a few parameters are varied across listings—could be viewed by the CFTC as insufficient when the certification is expected to demonstrate compliance for each unique configuration.
For market participants such as traders and liquidity providers, the filing quality issue may not directly change how contracts trade day-to-day, but it does affect listing stability and regulatory risk. If contract certifications are challenged, the availability of products could be disrupted, and participants may face sudden changes in trading access or contract availability.
Legal practitioners have also pointed to how the pending amendments could alter the regulatory landscape. Earlier coverage noted that law firm Ropes & Gray said the CFTC’s proposed changes could “rewrite the rulebook” for prediction market contracts, reflecting how significant the public interest determination framework could be if adopted.
What to watch next
With comments due July 27 on the proposed public interest determinations framework, prediction market operators should expect follow-on developments that could refine what the CFTC considers acceptable contract listings and how self-certification must be documented. The key question ahead is whether operators will update certification practices to avoid template-style submissions and how the CFTC will translate its three-step framework into enforceable guidance if the proposed amendments move forward.


KB Kookmin Bank will launch a blockchain payment service for import and export companies in August.
The bank will initially process US dollar payments for those clients over JPMorgan’s Kinexys network. It announced the plan on July 26.
South Korean Bank Moves Dollar Trade Payments Onto JPMorgan Blockchain
Kinexys is JPMorgan’s blockchain unit, formerly known as Onyx. It runs institutional payments, tokenization, and digital asset settlement.
The platform has processed more than $4 trillion since its launch. Average daily transactions exceed $7 billion.
The service will initially support dollar remittances to 10 countries, including South Korea, according to local media reports. The list covers the US, Singapore, Saudi Arabia, India, Thailand, Qatar, the United Arab Emirates, Bahrain, and South Africa. Korean branches and KB Kookmin’s Singapore office will offer the service.
Follow us on X to get the latest news as it happens
This comes just days after KB Kookmin was selected for a government-backed deposit token payment project. The Ministry of Science and ICT and the Korea Internet & Security Agency run the program.
Whether other Korean lenders adopt Kinexys will test how far tokenized deposits reach beyond JPMorgan’s clients.
Subscribe to our YouTube channel to watch leaders and journalists provide expert insights
The post South Korea’s Biggest Bank Taps JPMorgan Blockchain for Trade Payments appeared first on BeInCrypto.

MONEY SMP FINALE ** (SEASON 6)

Labour Now On Course To Win Next UK General Election

Mario Hezonja back in NBA, signs deal with Cavs


-

 Fashion2 days ago
Weekend Open Thread: Brooks Brothers
-

 Crypto World6 days ago
Grayscale Files For Worldcoin ETF, WLD Registers Sharp Rise
-
 Tech6 days ago
Sail Virtually Aboard The “Itanic” With IA-64 Emulator
-
 Tech6 days ago
Turtle Beach Command Series KB7 review: a nifty screen-equipped gaming keyboard
-

 NewsBeat6 days ago
Unregistered fitter used Gas Safe logo on business flyers
-
 Business5 days ago
New Jersey voter registration controversy explained: How 6,600 noncitizens got on the rolls, and what happens next
-

 NewsBeat5 days ago
How a former Blue Peter presenter stunned America’s Got Talent judges
-
 Entertainment5 days ago
Johnny Depp’s R-Rated Gothic Cult Classic Gets New Release Ahead of Sydney Sweeney Remake
-

 Tech6 days ago
Watch Flock Safety CEO Garrett Langley discuss the future of surveillance at TechCrunch Disrupt 2026
-

 Crypto World4 days ago
Ethics, other provisions in crypto Clarity Act to be further discussed
-
 NewsBeat6 days ago
Shanghai science forum photos show China’s AI and robotics advances in rivalry with US
-
 Crypto World6 days ago
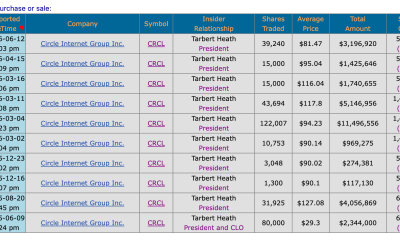
Circle’s President Sold Over 360,000 Shares, The Filings Explain Why
-

 Tech7 days ago
Subway Sandwich Computers Get a Second Life as Gaming Machines
-

 News Videos3 days ago
The Peugeot Family: How 200 Years of an “Old Money” Dynasty Died in A Boardroom
-
 Sports1 hour ago
Commonwealth Games boxing: Jadumani Singh seals dominant 5-0 win over Pakistan’s Sumama Rehman to enter quarter-finals | Commonwealth Games News
-

 Sports3 days ago
2026 3M Open leaderboard: Scottie Scheffler finds putter in Round 1, sits three back
-

 Fashion3 days ago
16 Dresses for the High Summer Event
-

 Tech6 days ago
The 35 Best Board Games for Family Game Night
-

 Entertainment7 days ago
Stephen Colbert Returns to Social Media After Late Show End
-

 Crypto World6 days ago
Andrew Cuomo joins OKX board as crypto exchange expands in U.S.
You must be logged in to post a comment Login