Crypto World
Bitcoin: Futures Momentum vs Spot Market Reality

Rising oil prices amid risks to shipping through the Strait of Hormuz have strengthened global inflation expectations. According to the Pentagon, clearing the strait could take at least six months, sustaining uncertainty in commodity markets and weighing on risk assets overall — a category that typically includes cryptocurrencies.
At the same time, institutional demand for Bitcoin remains resilient. As of 20 April, spot ETFs recorded five consecutive days of inflows, with daily volumes around $238 million, while Strategy (formerly MicroStrategy) executed its largest purchase since late 2024, acquiring 34,164 BTC worth $2.54 billion. However, analysts at CryptoQuant note that the current price momentum is being driven primarily by the perpetual futures market, while spot demand is declining. A similar pattern was observed in January ahead of the correction from $98,000, suggesting that the market remains vulnerable.
Technical picture

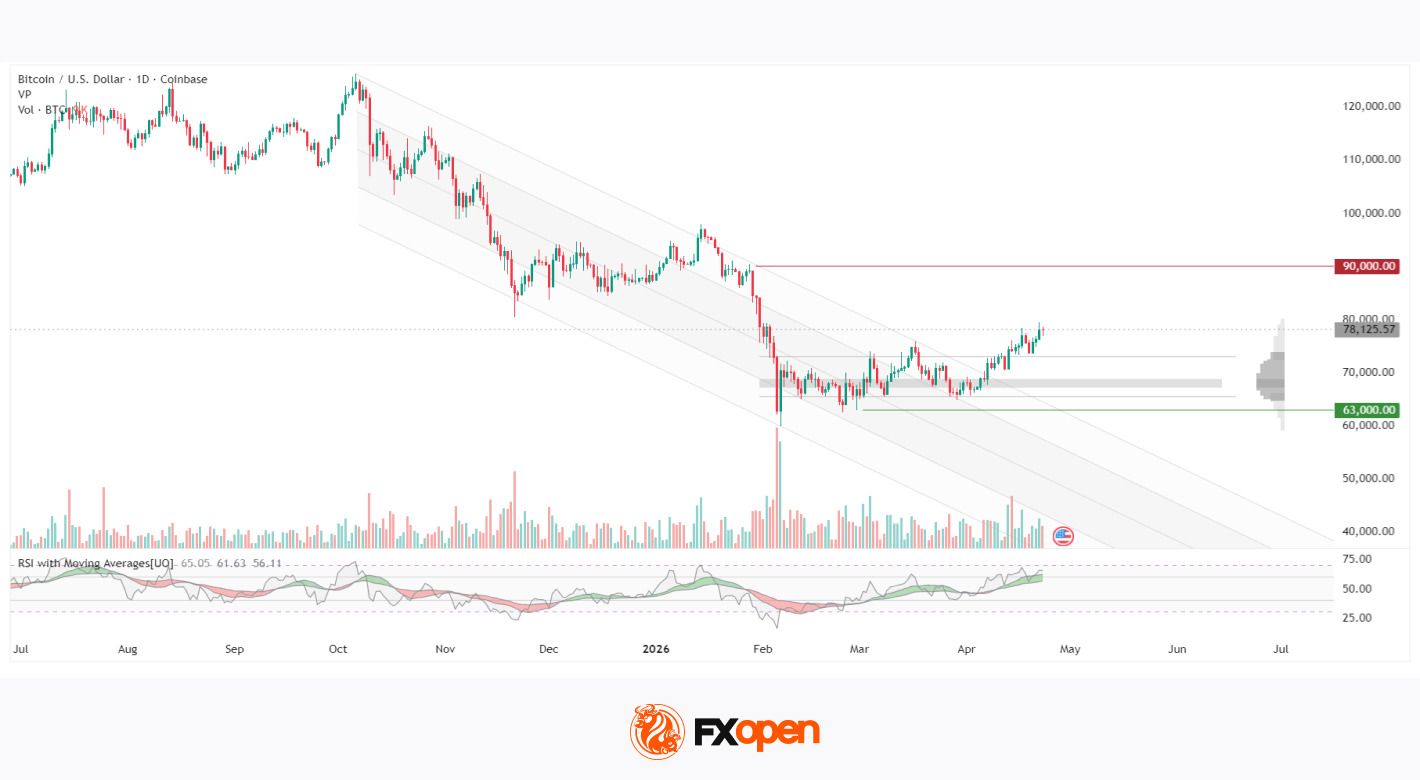
Since October 2025, Bitcoin has been trading within a descending parallel channel, with the lower boundary tested in February 2026 when the price fell to around $60,000 amid exceptionally high trading volumes typical of a selling climax. Following this low, the market shifted into recovery mode, and in the first half of April 2026, the price broke above the upper boundary of the channel and managed to hold above it.
At the same time, the price moved beyond the upper edge of the horizontal volume zone between $65,000 and $73,000, where most trading activity had been concentrated in previous months. This zone now lies below current levels. The nearest resistance is seen at $90,000, while support stands at $63,000. The RSI with moving averages shows readings of 64 / 61 / 56 — the oscillator remains above both moving averages, which are trending upwards, indicating ongoing buying pressure. Vertical volume in recent sessions remains moderate, with no clear signs of acceleration.
Summary
The horizontal volume zone has shifted below the current price, signalling a structural tilt in favour of buyers. The RSI remains above its moving averages, confirming bullish pressure, though recent trading volumes do not yet indicate a strong acceleration in momentum. Resistance at $90,000 and support at $63,000 define the key range within which the next phase of market structure is likely to develop.
FXOpen offers the world’s most popular cryptocurrency CFDs*, including Bitcoin and Ethereum. Floating spreads, 1:2 leverage — at your service (additional fees may apply). Open your trading account now or learn more about crypto CFD trading with FXOpen.
*Important: At FXOpen UK, Cryptocurrency trading via CFDs is only available to our Professional clients. They are not available for trading by Retail clients. To find out more information about how this may affect you, please get in touch with our team.
This article represents the opinion of the Companies operating under the FXOpen brand only. It is not to be construed as an offer, solicitation, or recommendation with respect to products and services provided by the Companies operating under the FXOpen brand, nor is it to be considered financial advice.
You must be logged in to post a comment Login