

Crypto World
Bitcoin Has Already Spent 42 Days Building Its Bottom, This Metric Says

Bitcoin (BTC) has been counting down to its next bottom for nearly two months, a classic onchain metric suggests.
Key points:
- BTC supply in loss passed 50% for the first time this bear market in early June.
- In previous bear markets, that event sparked a countdown to a new BTC price macro bottom.
- Separate data hints that the bull market’s “emotional premium” has now gone.
Supply in loss countdown already Bitcoin’s second-longest
In its H1 2026 Round-Up report, crypto research company K33 Research flagged more than 50% of the BTC supply now being held at a loss.
A typical bear-market feature, supply in loss has become a yardstick for progress toward macro bottoms for BTC/USD.
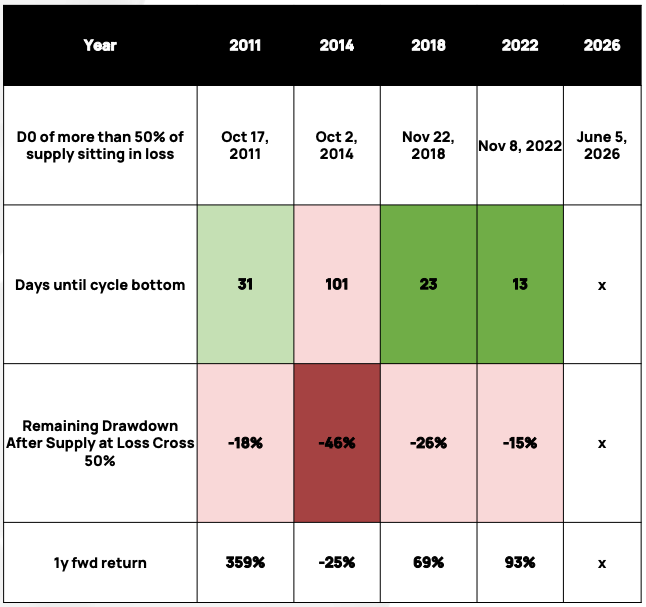
K33 data shows that once supply in loss passes the 50% mark, the bottom has come no more than 101 days later. Bear markets have provided various time frames, with the shortest bottom “window” lasting just 13 days in 2022.
The 2018 bear market required 23 days to reach its floor, while in 2014, Bitcoin continued to decline for 101 days after the 50% supply-in-loss mark was hit.
In 2026, supply in loss repeated standard bear-market behavior, crossing 50% on June 5. Since then, 42 days have elapsed, making this year’s bottom window Bitcoin’s second-longest ever.
BTC supply in loss and days until bear-market bottom (screenshot). Source: K33 Research
In accompanying commentary, K33 observed that returns over the year following the phenomenon “tend to be very solid.”
Earlier this month, Axel Adler Jr., a contributor to onchain analytics platform CryptoQuant, estimated that supply in loss was around two months away from levels that correspond to bear-market bottoms.
CryptoQuant data puts supply in loss at 46% as of July 17.
“Distribution of capital” teases silver lining
Continuing, CryptoQuant eyed what it described as “rare” readings from Bitcoin investor cost-basis models.
Related: Bitcoin $107K buyers providing ‘early signals’ of 2026 bear-market bottom: Glassnode
The realized cap variance (RCV) model, which measures the difference between realized cap and market cap, currently sits in the bottom six percent of its historical range.
“Instead of tracking price alone, it isolates the variance between realized cap and market cap relative to its own rolling history, capturing how stretched or compressed investor cost basis has become versus current valuation,” contributor Crazzyblockk explained in a QuickTake blog post on Thursday.
“When that variance compresses into deeply negative z-score territory, the emotional premium built during rallies has largely been priced out. The metric doesn’t read narrative, it reads the distribution of capital.”
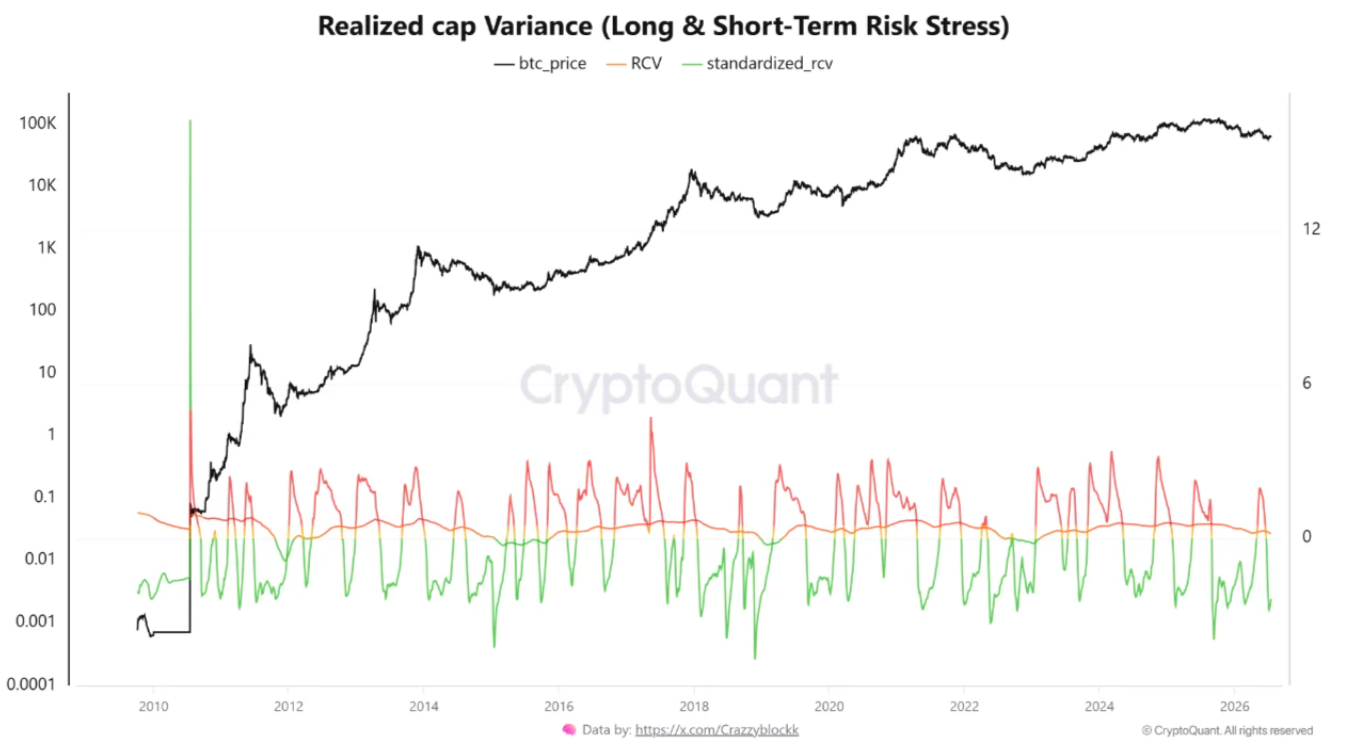
Bitcoin RCV data (screenshot). Source: CryptoQuant
At -2.35, standardized RCV’s Z-score is once again pointing to the final stages of the Bitcoin bear market.
“Every prior stretch where the model spent extended time below a -2.0 z-score, late 2018, mid-2022, early 2015, preceded forward twelve-month returns north of 75%,” the post noted.
“The most extreme reading in this dataset, -4.68 in November 2018, landed almost exactly on Bitcoin’s cycle bottom near $3,792.”



“The real prize is the yen side of onchain settlement, one of the most strategic positions in Asian finance over the coming decade, and that is exactly what SBI is building toward,” he added.
One technical limitation remains. JPYSC does not yet support withdrawals to external wallets.
“Regarding JPYSC, its use is currently limited to accounts within SBI VC Trade, and it does not yet support withdrawals to external wallets or remittances and settlements via public blockchains,” the spokesperson said.
For now, that limits JPYSC’s use outside SBI’s own platform. Investors cannot yet move the stablecoin to external wallets or use it to settle transactions across public blockchains.
Sota Watanabe, CEO of Startale Group, which works with SBI Holdings on JPYSC, said the company’s continued investment in digital assets reflects what he sees as growing institutional confidence in blockchain infrastructure.
“SBI Holdings’ continued commitment to digital assets likely signals confidence in the future architecture of global finance,” Watanabe told CoinDesk.
He said blockchain is increasingly being viewed as financial infrastructure rather than an emerging technology, adding that Japan is well-positioned to lead the sector due to its regulatory framework and financial institutions.
SBI expansion
SBI agreed to buy Tokyo-based cryptocurrency exchange Bitbank for around $289 million in June. The acquisition is expected to close in October, subject to regulatory approval. SBI previously acquired crypto exchange Bitpoint in 2022. The firm also led a $76 million Series C funding round for institutional exchange EDX Markets and a $25 million Series C round for crypto risk manager Gauntlet, the spokesperson said.
Crypto World
ether.fi Partners with Nexus Mutual to Protect Against ETH Slashing at Institutional Scale
[PRESS RELEASE – London, United Kingdom, July 17th, 2026]
ether.fi, the leading onchain neobank for digital asset management, has selected Nexus Mutual to provide crypto’s largest-ever ETH Slashing Cover. The cover protects ether.fi‘s validators against up to 15,000 ETH worth of slashing penalties.
As ether.fi continues to see rapid adoption from both retail and institutional audiences, securing industry-leading protection against slashing risk for ether.fi users is critical. Over the last year, ether.fi has been systematically strengthening their stack across infrastructure, risk management, operational security and real-time defense systems.
Since ether.fi operates one of the largest validator sets on Ethereum, slashing is a real tail risk for them. By working with Nexus Mutual, ether.fi has mitigated this with protection that kicks in to secure against validator losses. This cover was calculated to protect ether.fi in even the most extreme scenarios and represents more than all historical losses from ETH slashing combined.
“We’ve always believed the safest protocols will ultimately win. That’s why we’ve invested heavily in audits, operational security, staking architecture, and now the largest insurance program in the industry. We are excited to partner with Nexus Mutual to make this a reality,” said Mike Silagadze, Founder & CEO of ether.fi.
“We’ve known the ether.fi team since before it was ether.fi, and they’ve been focused on risk from day one. Covering their users for up to 15,000 ETH in slashing penalties is a historic step, and we’re proud they chose Nexus Mutual to take it with them,” said Hugh Karp, Founder of Nexus Mutual.
About ether.fi
ether.fi is the leading onchain neobank for digital asset management. With $6B+ in AUM across Cash (crypto card), Stake (restaking), and Liquid (liquid restaking derivatives), ether.fi has established category dominance in crypto neobanking. It’s the rare institutional-grade product built for consumer adoption.
About Nexus Mutual
Nexus Mutual is the first crypto insurance alternative. Since 2019, they have covered more than $7 billion against smart contract hacks, slashing, and other digital asset risks. As the industry leader, they have become a trusted partner for everyone from individuals to institutions to help manage onchain risk.
The post ether.fi Partners with Nexus Mutual to Protect Against ETH Slashing at Institutional Scale appeared first on CryptoPotato.
Solana price has fallen nearly 4% to about $74 after a rejection near $77, as a global technology sell-off and leveraged long liquidations have pushed traders toward caution.
Summary
- Solana price tests $74 support after losing its rising trendline and facing weak four-hour momentum.
- A recovery above $76.50 could trigger short liquidations and drive SOL toward $78–$80.
- Losing $74 would expose the daily Supertrend support at $69.60 and deepen downside risks.
According to data from crypto.news, Solana (SOL) price extended its decline on July 17 after failing to hold above the $76.50–$77 resistance area. Selling accelerated as semiconductor shares led losses across global markets, with Nasdaq 100 futures down 1.8%, Japan’s Nikkei 225 off 4%, and Taiwan’s benchmark plunging more than 6%.
The drop can partly be attributed to the rout due to doubts over stretched artificial intelligence valuations and leveraged retail positions.
Strong U.S. data added pressure on speculative assets. Initial unemployment claims fell to 208,000 from 216,000, while June retail sales rose 0.2%. The 10-year Treasury yield climbed toward 4.60%, and the dollar strengthened, raising the cost of holding high-beta assets such as Solana.
Institutional demand has provided only limited relief. U.S. spot Solana exchange-traded funds attracted $8.36 million on July 6, their strongest daily intake in almost two months, per data from SoSoValue. However, the inflow was not enough to prevent SOL from retreating from its early-July high near $83.
Solana price can rebound if bulls reclaim $76.50
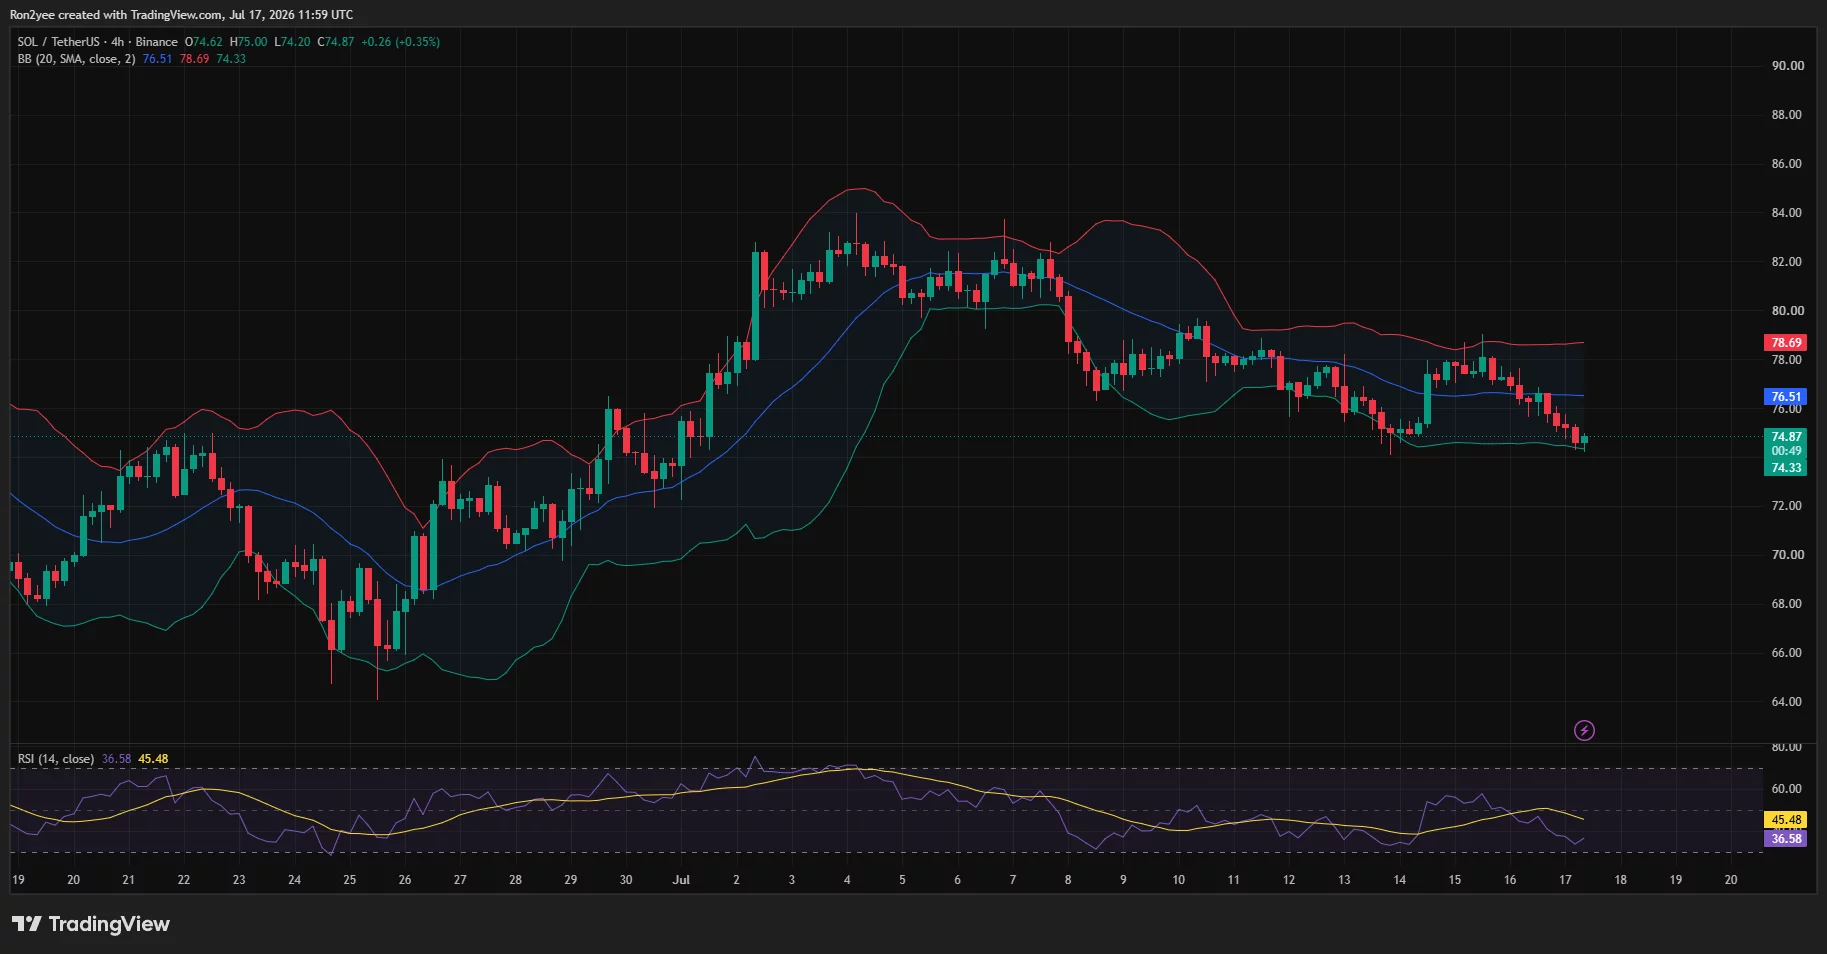
On the 4-hour chart, SOL trades near $74.87 and has reached the lower Bollinger Band at $74.33. The middle band at $76.51 now serves as immediate resistance, while the upper band sits at $78.69. A 4-hour close above the midpoint would give buyers another chance to test the $78–$80 region.
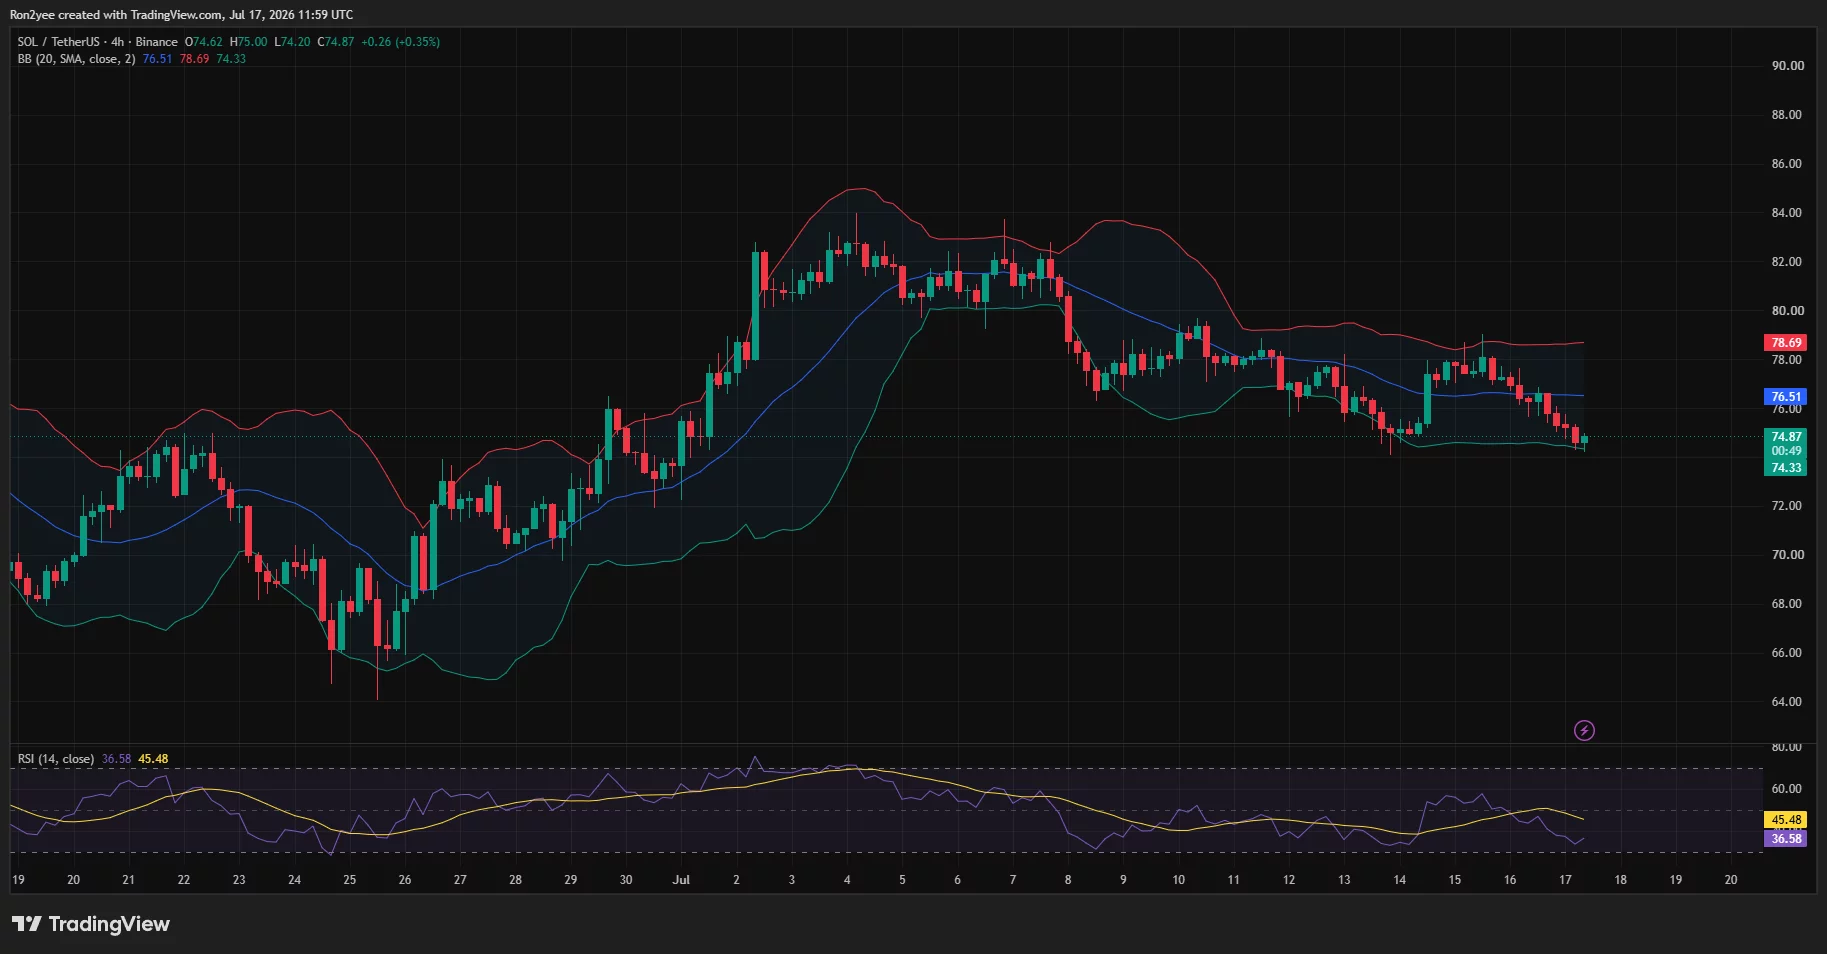
Momentum remains weak but is approaching levels where relief rallies can develop. The 4-hour relative strength index has dropped to 36.58, below its signal average of 45.48 but still above the oversold threshold of 30. Price has also formed a sequence of lower highs since its July 4 peak near $83.
According to crypto analyst SatoshiOwl, SOL has reached a support area after breaking beneath an ascending trendline.
“Hold here and we could see a relief bounce back toward $78–$80. Lose it, and a deeper flush becomes much more likely.”
Ali Charts offered a longer-term counterpoint, noting that the TD Sequential indicator has produced a buy setup on Solana’s monthly chart. The analyst described it as a potential early warning of a macro trend change, although the monthly setup requires confirmation from shorter time frames.
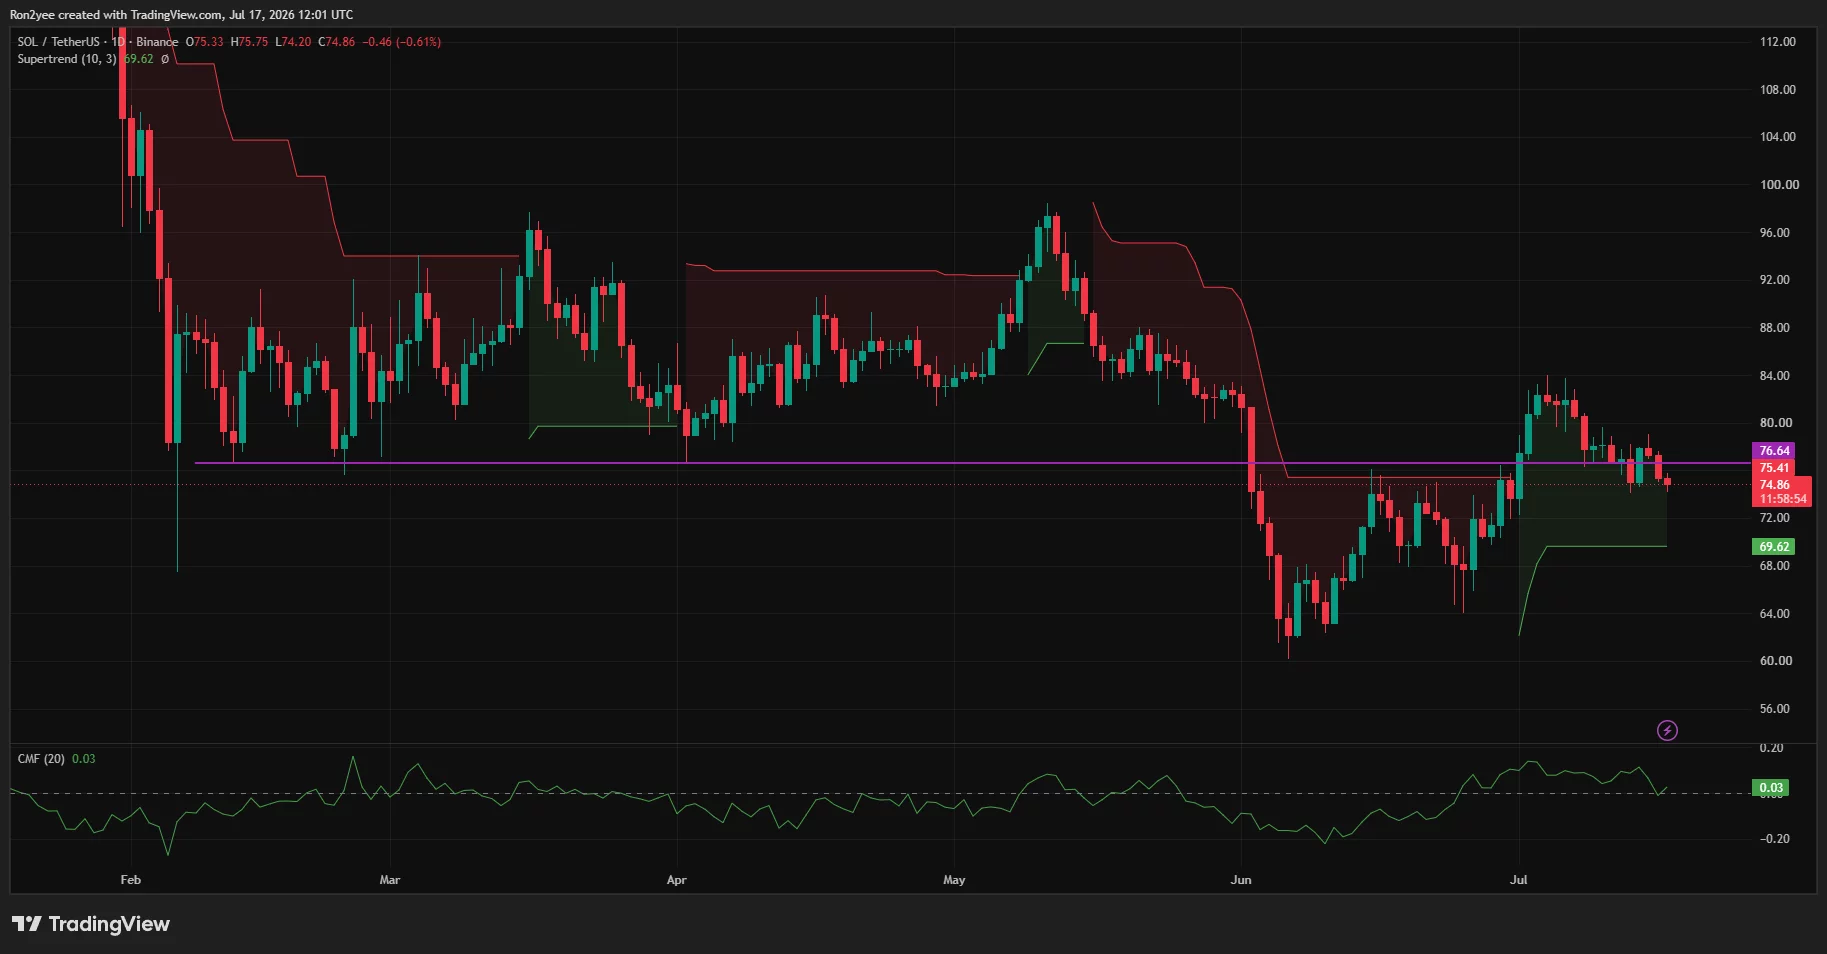
The daily chart remains constructive above the Supertrend support at $69.62. Chaikin Money Flow stands at 0.03, which shows that capital flow is still marginally positive despite the latest sell-off. SOL must first recover the former horizontal support at $76.64 before the daily structure can improve.
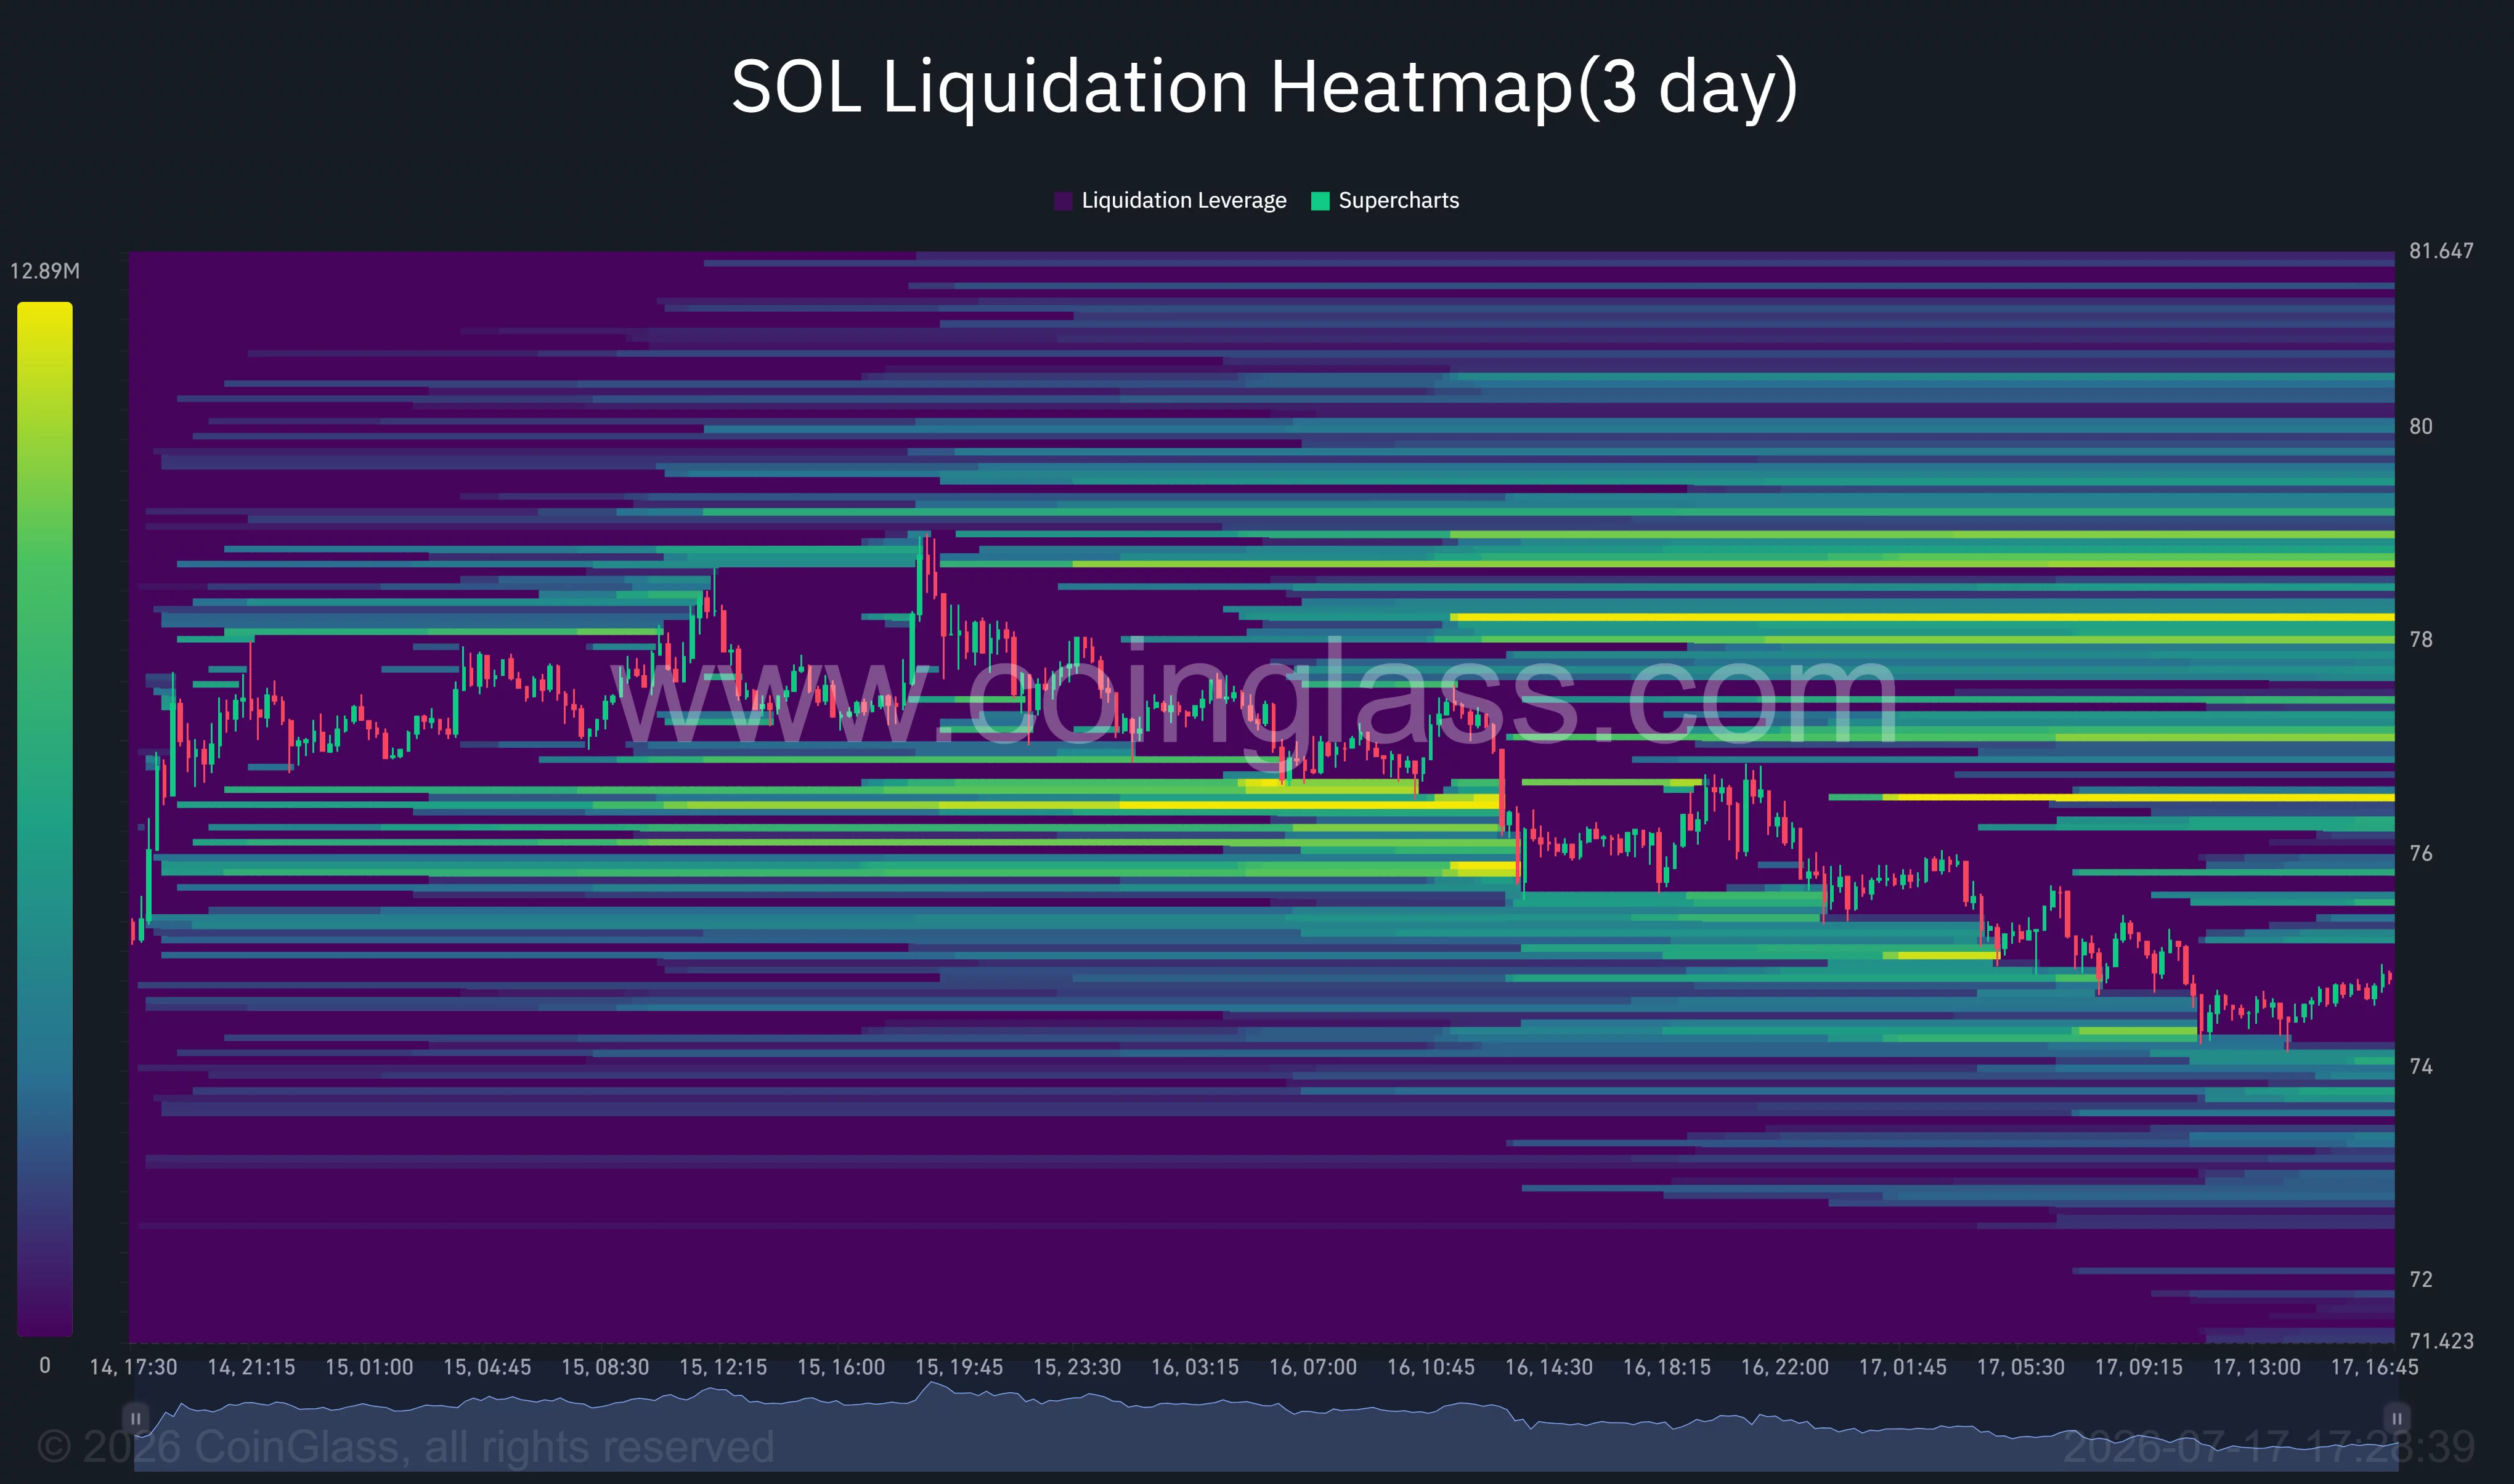
CoinGlass’ three-day liquidation heatmap places the nearest large pools of leveraged positions above the market. Dense clusters sit near $76.50–$76.70, $78, and $78.70, making those levels possible price magnets if SOL rebounds. A move through $76.70 could liquidate short positions and accelerate a recovery toward $78.
A break below $74 would expose the $69.60 support zone
Downside risk will rise if SOL closes decisively below the $74–$74.30 area. The heatmap shows less concentrated liquidity immediately beneath the current price, leaving room for a quicker decline toward $72 before the daily Supertrend level near $69.62 comes into play.
A loss of $69.62 would invalidate the remaining bullish daily setup and expose the June recovery base between $64 and $66. Macroeconomic pressure could deepen that move if Treasury yields continue higher, technology shares extend their decline, or renewed U.S.-Iran tensions lift oil prices and reduce demand for risk assets.
For now, SOL remains caught between weak four-hour momentum and positive daily capital flow. Bulls need $76.50 back to target the liquidity stacked near $78–$80, while a failure to protect $74 would place the $69.60 trend support at risk.
Disclosure: This article does not represent investment advice. The content and materials featured on this page are for educational purposes only.
More than $1 out of every $10 of the world’s tokenized US Treasuries is issued by a company incorporated in the British Virgin Islands.
That places the small Caribbean territory behind only the United States as a key jurisdiction for the rapidly growing asset class, according to BVI Finance.
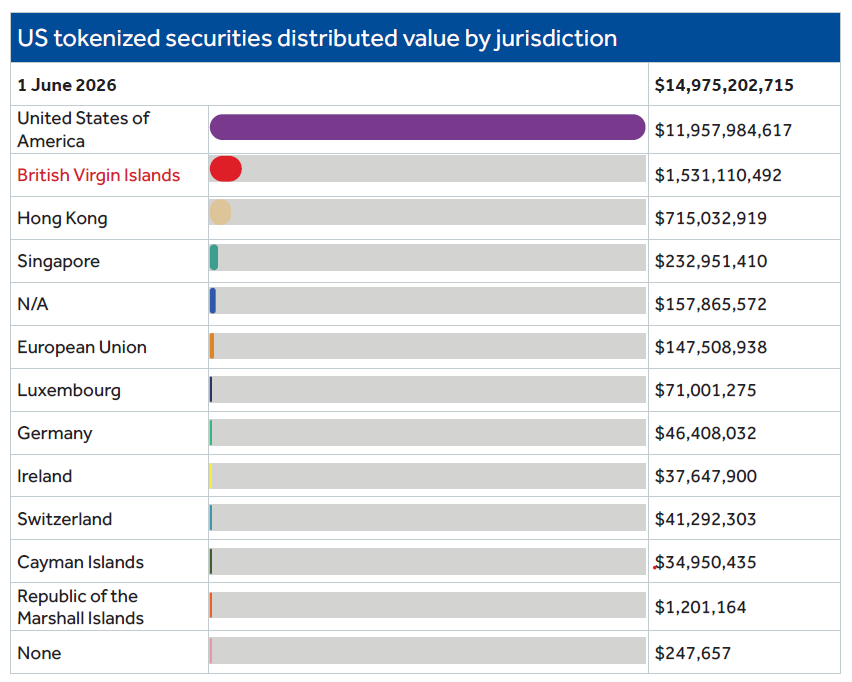
BVI Finance’s Destination Digital report in June found that BVI entities accounted for approximately $1.5 billion of the $14.98 billion global market for tokenized US Treasuries as of June 1.
A growing list of digital asset firms now call the British Virgin Islands home, including Kraken’s parent company, Payward, Bitstamp (recently acquired by Robinhood), 1inch and Bitfinex.
The territory boasts a stablecoin market cap of about $1.2 billion held in BVI-linked addresses and has roughly 28,000 stablecoin asset holders.
More than 25 virtual asset service providers (VASPs) have been approved under the BVI’s VASP regime, and, according to Bernstein Research, the Islands host 305 tokenized securities — the highest count for any single jurisdiction in the RWA.xyz dataset.
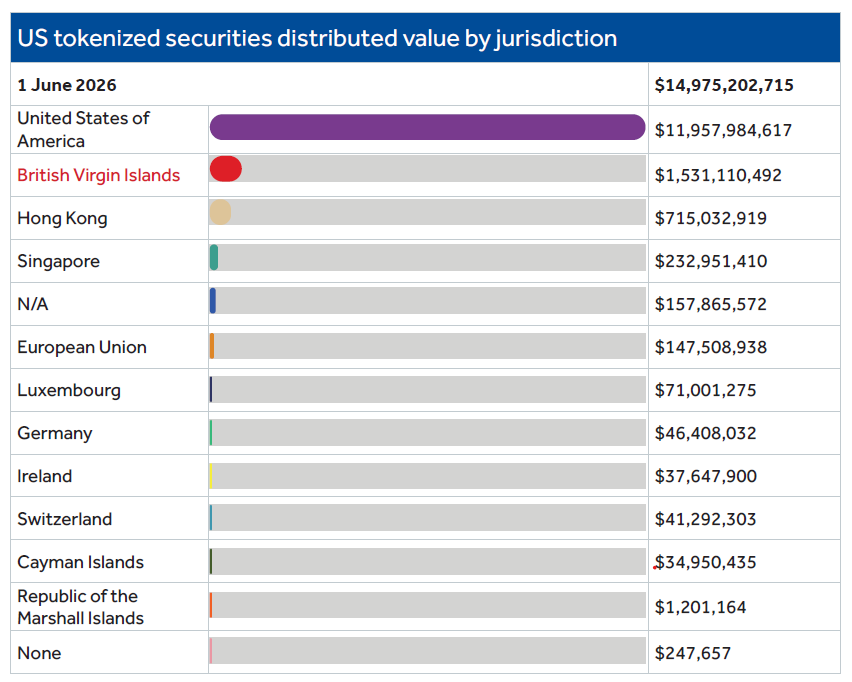
US tokenized securities distributed value by jurisdiction. Source: Destination Digital
The statistics suggest the Virgin Islands has become one of the world’s top crypto hotspots, but the reality is a little more nuanced.
Tokenized assets are designed to be borderless, and crypto projects often have the choice of which offshore jurisdiction to incorporate in.
In most cases, digital asset companies aren’t physically relocating to the Virgin Islands; they’re simply using the territory to incorporate legal entities, such as token issuers, treasury vehicles, holding companies or special purpose vehicles (SPVs).
Crypto companies aren’t just choosing BVI for tax reasons
Andrew Jowett, a partner at Appleby (BVI) Ltd who advises digital asset businesses on corporate structuring, told Cointelegraph that clients researching the BVI typically compare several jurisdictions, such as the Cayman Islands, United Arab Emirates, Singapore and Switzerland.
Despite long-held assumptions about offshore Caribbean tax havens, tax neutrality is no longer the primary driver.
Related: Dubai crypto market hits 50 licensed firms after new VARA approval
“The overriding factor for choosing the BVI has been digital asset regulation and not tax,” Jowett said. The British overseas territory does have attractive tax policies, and imposes no corporate income tax or capital gains tax on BVI companies.
But all the leading crypto hubs now have favorable crypto tax policies, meaning it’s no longer the deciding factor.
The Cayman Islands imposes no corporate income tax or capital gains tax, and the UAE has zero personal income tax or federal corporate tax on qualifying free zone entities.
“Tax neutrality is table stakes,” said Saeed Al-Marri, chief executive of digital asset infrastructure firm Ethra, which is incorporated in the BVI. He added that the BVI provides legal certainty and clarity, factors he said will determine which jurisdictions survive institutional adoption.
LTP is an institutional digital asset infrastructure provider that operates regulated entities in the BVI, Hong Kong, Australia and the UAE. Its founder and chief executive, Jack Yang, told Cointelegraph that while favorable taxation is relevant for cross-border structures, it is secondary to legal and regulatory certainty as tokenization moves further into institutional finance.
“A tax-neutral structure that cannot pass review by banks, custodians, auditors, investment committees, or regulators has limited practical value,” he said.
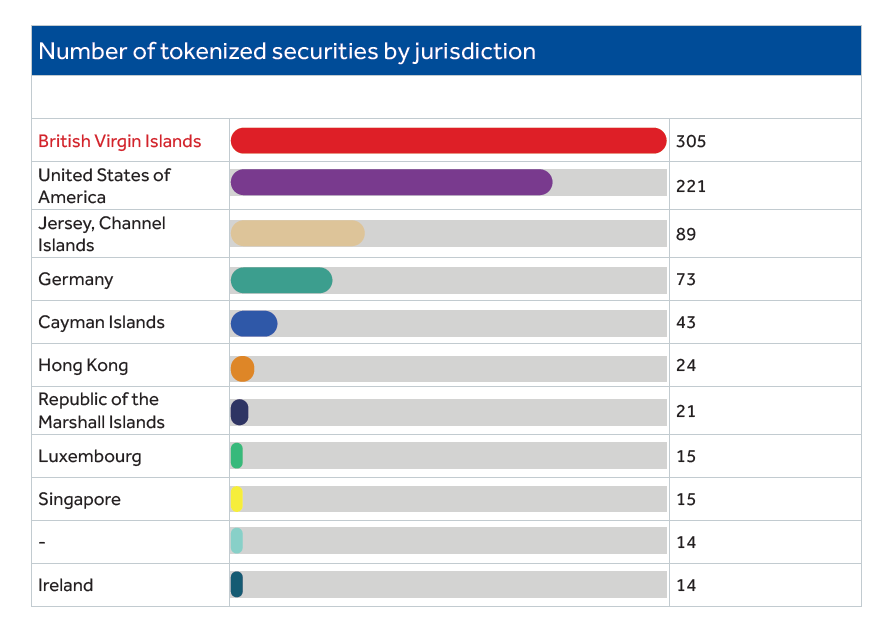
Number of tokenized securities by jurisdiction. Source: Destination Digital
Orest Gavryliak, chief legal officer at decentralized exchange aggregator 1inch, which is incorporated in the BVI, said that more and more decentralized finance (DeFi) protocols are choosing jurisdictions that provide predictable rules, rather than simply the lowest tax burden.
“Jurisdiction isn’t exactly becoming irrelevant, but its role is changing,” Gavryliak told Cointelegraph. “Protocols are increasingly weighing factors such as regulations, institutional credibility and long-term sustainability.”
Crypto hubs now compete on legal infrastructure
Jurisdictions vying to be “crypto hubs” like Singapore and the UAE increasingly compete via favorable legal infrastructure and licensing regimes, such as Singapore’s Payment Services Act and Dubai’s Virtual Assets Regulatory Authority (VARA) rulebooks.
The BVI introduced the Virtual Assets Service Providers Act (VASP Act) in 2023, overseen by the BVI Financial Services Commission (FSC).
Compared with many larger financial centers, it offers a speedy turnaround, responds to VASP applications within six weeks and aims to complete the review process within six months, according to BVI Finance and FSC guidance.
Jowett said beyond favorable tax regimes, clients prioritize “ease of launch” and efficient corporate structuring, which has long been part of the BVI’s appeal. Companies can be set up quickly, the legal framework is flexible, and ongoing reporting is generally lighter than in onshore jurisdictions.
Related: Cayman Islands Web3 foundations jump 70% as CARF reporting rules arrive
The Virgin Islands has also historically been favored because it offers more corporate confidentiality than many larger financial centers.
While BVI companies are still subject to anti-money laundering (AML) and know-your-customer (KYC) requirements, beneficial ownership information is held by registered agents rather than a public register, which reduces disclosure requirements.

British Virgin Islands. Source: Destination Digital
However, none of the companies interviewed by Cointelegraph cited tax neutrality or greater corporate confidentiality as deciding factors for incorporating in the BVI, pointing instead to legal certainty, regulatory clarity and corporate flexibility.
Incorporating, not physically relocating to the Virgin Islands
Yang told Cointelegraph that LTP does not employ full-time staff “on the ground.” Instead, the entity is overseen by its board and supported by staff from elsewhere in the LTP group.
The same distinction can be seen elsewhere in the industry. Kraken’s parent company, Payward, is incorporated in the BVI, but the exchange’s operations are primarily based in the United States, while 1inch’s team and operations are spread across multiple jurisdictions.
The BVI isn’t winning the race to attract glitzy headquarters or large-scale engineering teams. Instead, it has become the legal home for many digital asset businesses, while much of the work happens elsewhere. For jurisdictions competing to attract the industry, that just may be enough.
Magazine: Singapore isn’t a ‘crypto hub’ — it’s something better: StraitsX CEO


Japanese financial services group SBI Holdings has acquired a majority stake in Holdbuild, the parent company of Singaporean crypto platform Coinhako, after receiving regulatory approval from Singapore’s central bank.
The approval from the Monetary Authority of Singapore (MAS) enabled SBI to acquire company shares from existing shareholders through a capital injection, making Coinhako a consolidated subsidiary of SBI, the company announced on Thursday.
Coinhako holds a Major Payment Institution license under MAS through its subsidiary, Hako Technology Pte. Ltd. SBI announced its intent to acquire a majority stake in the Singaporean crypto exchange in February.
SBI said it plans to combine Coinhako’s customer base and regional network with its own financial services and digital asset businesses, including its JPYSC stablecoin initiative.
Related: Coinbase Ventures tops crypto VC list for H1 2026
Financial terms of the transaction were not disclosed. SBI did not immediately respond to Cointelegraph’s request for details on the deal.
The acquisition is part of SBI’s broader expansion in digital assets. Earlier this month, the company led a $76 million Series C funding round for institutional crypto exchange EDX Markets. It also shared plans to acquire Bitbank for $289 million, aiming to create one of Japan’s largest crypto exchanges.
SBI deepens crypto industry involvement in Asia
SBI described Singapore as a key hub in its digital asset strategy and said the acquisition would strengthen its presence in Southeast Asia. SBI said it plans to hold its first overseas branch managers’ meeting in Singapore this summer to strengthen its local business foundation.
SBI has accelerated its digital asset expansion in recent months through acquisitions, investments and tokenization initiatives. This week, the company partnered with Ondo Finance to bring tokenized Japanese stocks and integrate its JPYSC stablecoin for settlement and collateral.
In February, SBI and Startale Group unveiled Strium, a layer-1 blockchain focused on tokenized securities and real-world assets. The network is designed to support 24/7 trading, tokenized equity settlement and institutional financial applications as SBI expands its digital asset infrastructure across Japan and overseas markets.
Magazine: Dubai tops Asian crypto hubs, Taiwan passes crypto laws: Asia Express
XRP remains under pressure across both its USDT and BTC trading pairs, with the broader market structure still favoring sellers. While the token has managed to stabilize above nearby support on the dollar chart, its Bitcoin pair continues to print lower highs and lower lows, highlighting persistent relative weakness.
Ripple Price Analysis: The USDT Pair
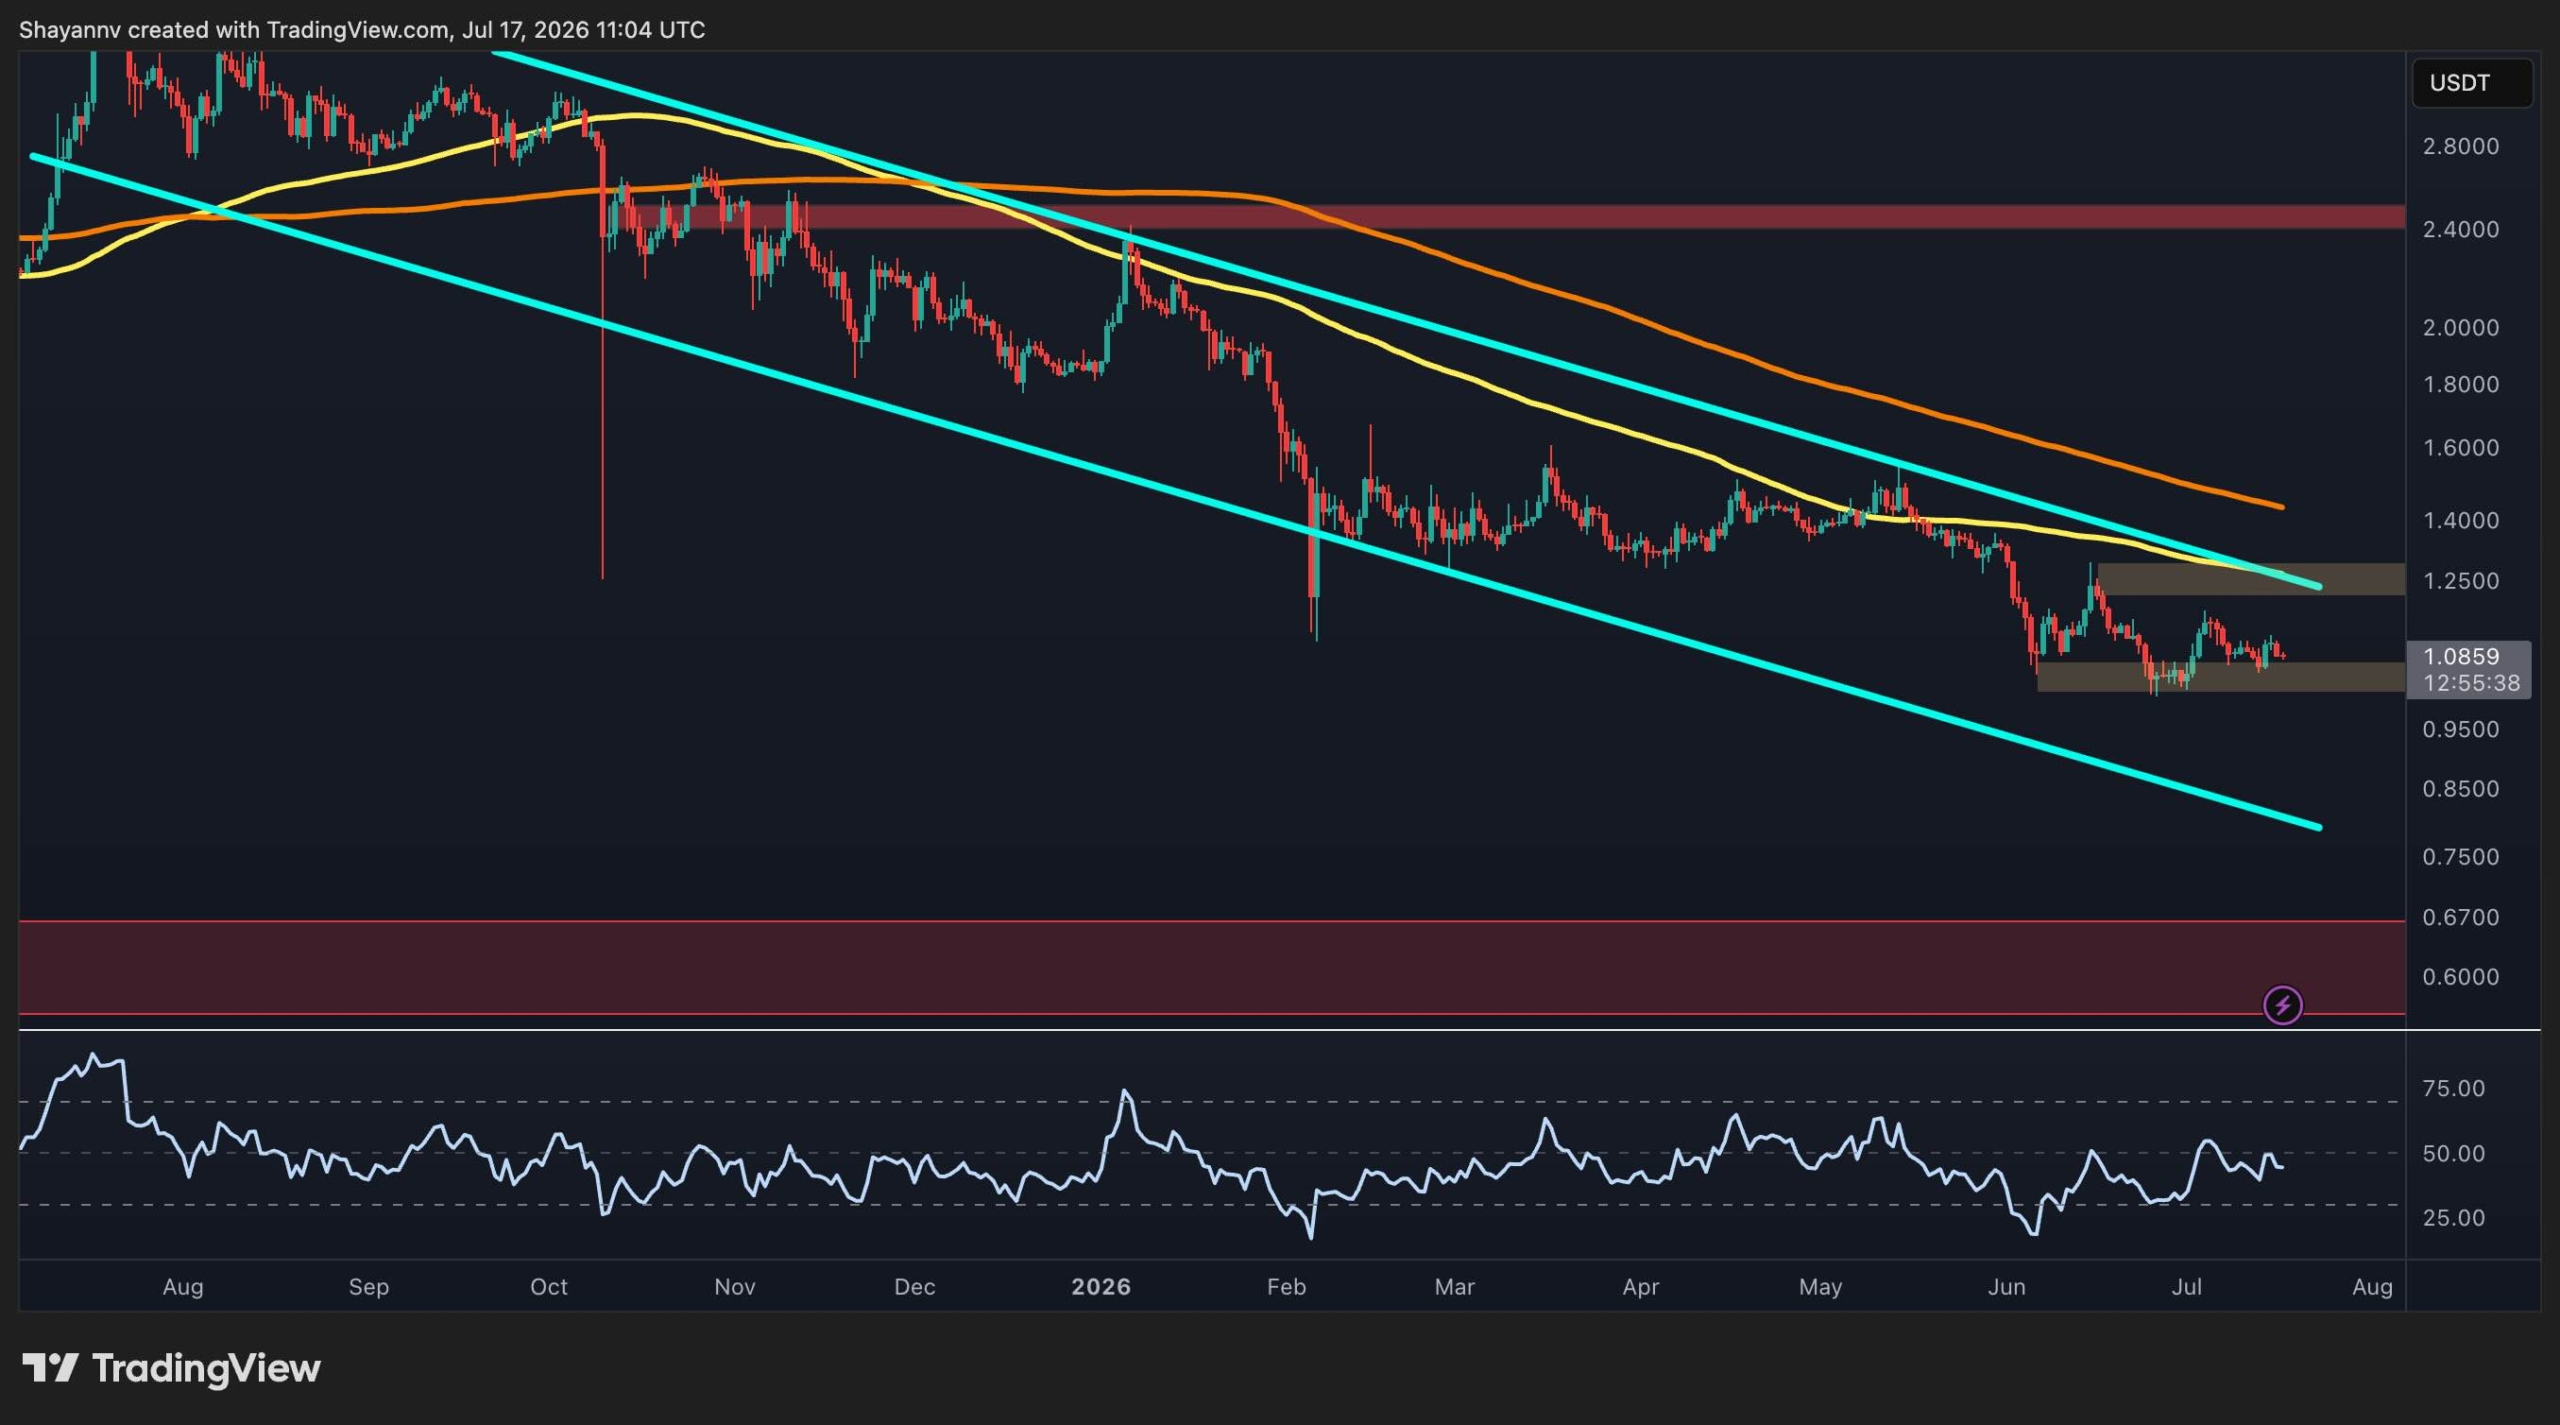
The daily chart shows XRP trading around $1.08 after an extended decline within a well-defined descending channel. Although the asset has recently moved sideways instead of extending its losses, the broader trend remains bearish as it continues to trade below both the 100-day and 200-day moving averages. These levels are also sloping downward, reinforcing the prevailing negative momentum.
Following the sharp breakdown in June, XRP has established a consolidation range between the $1 support zone and the $1.25 resistance area. Buyers have repeatedly defended the lower boundary, but every recovery attempt has been rejected before reclaiming the declining 100-day moving average or breaking above the channel’s higher boundary, indicating that bullish momentum remains limited.
A breakout above the $1.25 resistance would be the first sign that buyers are regaining control and could expose the descending channel’s upper boundary as the next major hurdle. Until then, the broader structure continues to favor further downside, with a loss of the $1 support opening the door toward significantly lower demand zones.
The RSI is hovering near the neutral 50 level, reflecting the current balance between buyers and sellers after weeks of heavy selling pressure. However, without a decisive bullish breakout, the indicator does not yet suggest a meaningful shift in trend.
The BTC Pair
The XRP/BTC daily chart paints an even weaker picture. The pair has remained inside a long-term descending channel for nearly a year while consistently trading beneath both the 100-day and 200-day moving averages, highlighting sustained underperformance against Bitcoin.
After several failed recovery attempts during May and June, XRP/BTC has finally dropped below the key horizontal support around 1,720 sats. This level has repeatedly attracted buyers over the past few months, but each rebound has produced another lower high, signaling that selling pressure continues to dominate.
On the upside, the next important resistance sits around the 1,850 sats region, where previous support has turned into resistance. A move above this area would improve the short-term outlook, but the descending channel and the 200-day moving average near 2,000 sats remain the primary barriers to a broader trend reversal.
Meanwhile, the RSI remains below the midpoint, suggesting that momentum still favors the sellers. Unless XRP/BTC can reclaim key resistance levels and break its long-term bearish structure, the pair appears vulnerable to another test of the channel’s lower boundary, which is now located around 1,500 sats.

The post Ripple Price Analysis: Weakening XRP Momentum Raises Risk of a Sub-$1 Drop appeared first on CryptoPotato.


ECB’s Piero Cipollone said stablecoin adoption could erode bank deposits, but the digital euro will keep banks at the center of payments.


The part that rattles valuations is the license. K3 is open-weight, with the full model due for public release on July 27. Anyone will be able to download it, run it on their own hardware, and pay nobody.
Anthropic released Fable 5 last month, and OpenAI shipped GPT-5.6 a week ago, both closed and metered. The assumption underwriting hundreds of billions of dollars in AI infrastructure spending is that frontier capability stays scarce, expensive and American.
A free Chinese model at the top of a coding leaderboard is a direct argument against that.
Meanwhile, Moonshot’s domestic rivals took it worst, with Z.ai falling about 27% and MiniMax about 16%.
For crypto, the headwinds run through the tape rather than through anything onchain. Bitcoin has spent this entire week taking direction from semiconductors.
Last Friday, it rose 4% on the day South Korea’s Kospi jumped 8% and SK Hynix priced $26.5 billion of American depositary shares. This Friday, it fell because a model release in Beijing made the same trade look expensive.
There is, however, a more concrete exposure underneath.
Bitcoin miners have spent two years repositioning themselves as AI data center landlords, signing long-term leases with model developers on the assumption that demand for training and inference compute keeps rising.
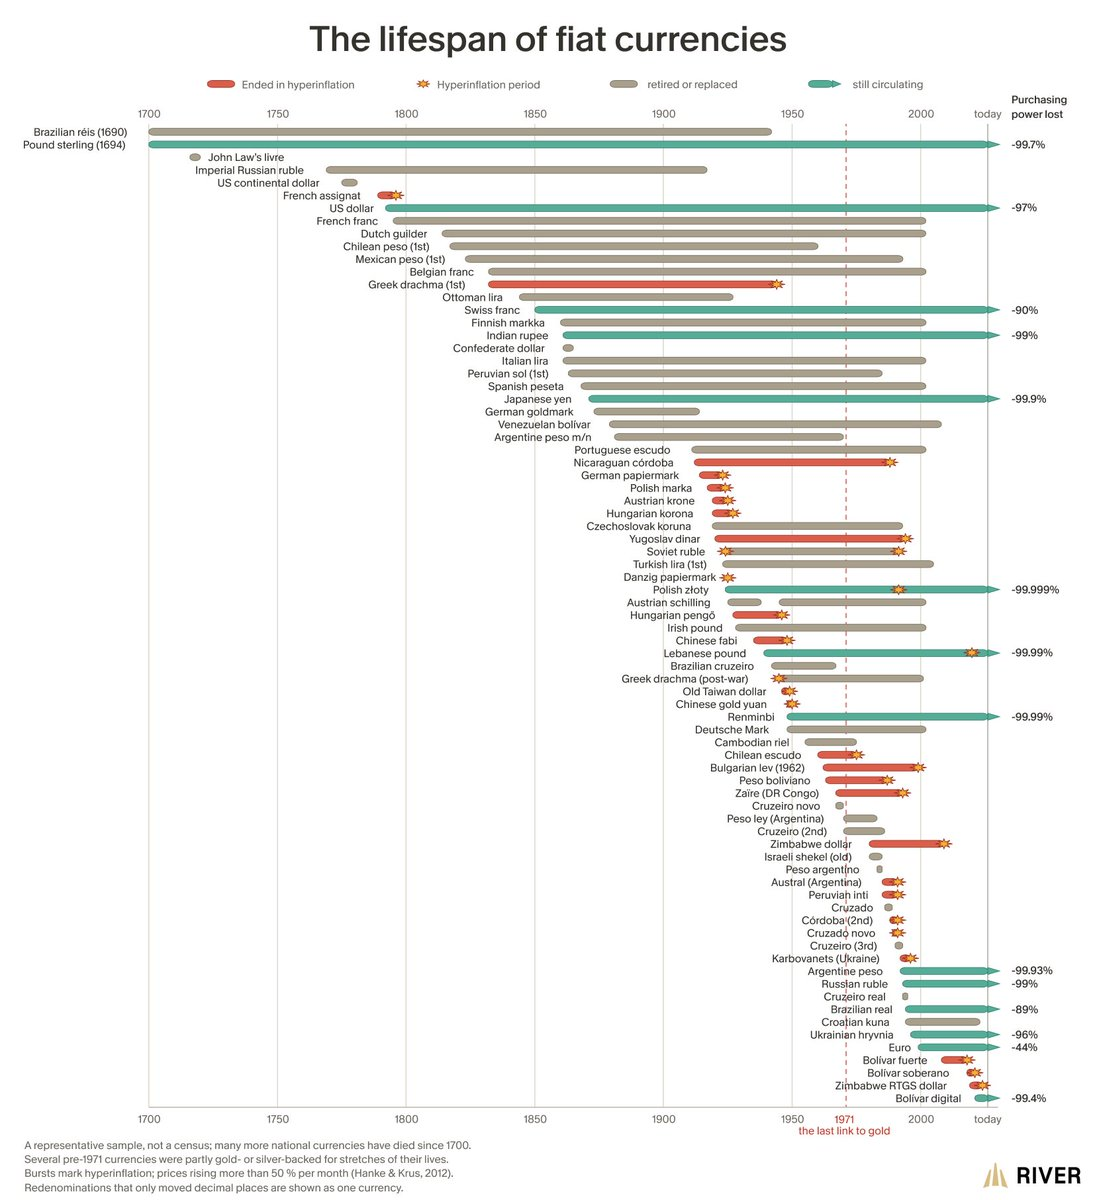
Michael Saylor is making the case for Bitcoin (BTC) with a history lesson. The MicroStrategy chairman shared River research tracking over 60 government currencies since 1700. His point is simple. Paper money keeps failing, and Bitcoin was built to fix that.
River, a Bitcoin financial services firm, published the chart this week. It claims the average fiat currency lasts just 27 years.
326 Years of Fiat History Behind Saylor’s Bitcoin Pitch
The chart tells a grim story. Dozens of currencies died in hyperinflation, defined by economists Steve Hanke and Nicholas Krus as prices rising by more than 50% in a month.
Germany’s papiermark (or Paper Mark) went that way in 1923. Hungary’s pengő followed in 1946, when prices doubled roughly every 15 hours. Zimbabwe’s dollar collapsed in 2008.
The survivors did not do much better. The US dollar has lost 97% of its buying power. The British pound is down 99.7%, and the Japanese yen 99.9%. Even the euro, the youngest and best performer, has lost 44% since 1999.
River is upfront about the chart’s limits. It calls the data a representative sample, not a census, and notes many pre-1971 currencies had partial gold backing. That year gets its own dashed line, marking when the dollar cut its final tie to gold.

“Fiat currency is the problem. Companies, institutions, securities, and technologies that strengthen Bitcoin are part of the solution. We can debate ideas without mistaking allies for enemies,” Saylor commented.
Follow us on X to get the latest news as it happens
Notably, Michael Saylor’s next-decade Bitcoin outlook calls the pioneer crypto a digital property whose strength lies in its base layer barely changing. He sees Bitcoin as scarce global capital for final settlement, not mainly for everyday payments.
His bigger bet is that Bitcoin will support a new financial system built on digital capital, credit, and money.
River Says Most Cryptocurrencies Fail the Same Test
River’s warning is not just about fiat. The firm says the average cryptocurrency does not even last a year. Nearly all of them fall to zero when priced in Bitcoin.
“All of these currencies suffer from the same problem: Centralized power and an infinite money supply. Bitcoin was designed to outlast all fiat currency,” the firm said in its post.
Meanwhile, not everyone agrees that Bitcoin’s design is settled. StarkWare CEO Eli Ben-Sasson recently challenged Bitcoin’s fixed cap, arguing lost keys will shrink the usable supply forever.
Chainalysis estimated that up to 3.79 million BTC were already unrecoverable by 2017. Supporters rejected his 4% issuance fix, since 95.5% of all Bitcoin now exists.
The market adds a twist to Saylor’s pitch. Bitcoin trades near $63,252, down about 47% in a year.

MicroStrategy still holds 843,775 BTC, the largest corporate stash, even after selling 3,588 BTC this month, its biggest sale since 2022.
History says fiat money fades. The coming months will test whether investors still believe Bitcoin is the escape.
The post MicroStrategy’s Saylor Pitches Bitcoin Bull Case With 300 Years of Fiat History appeared first on BeInCrypto.
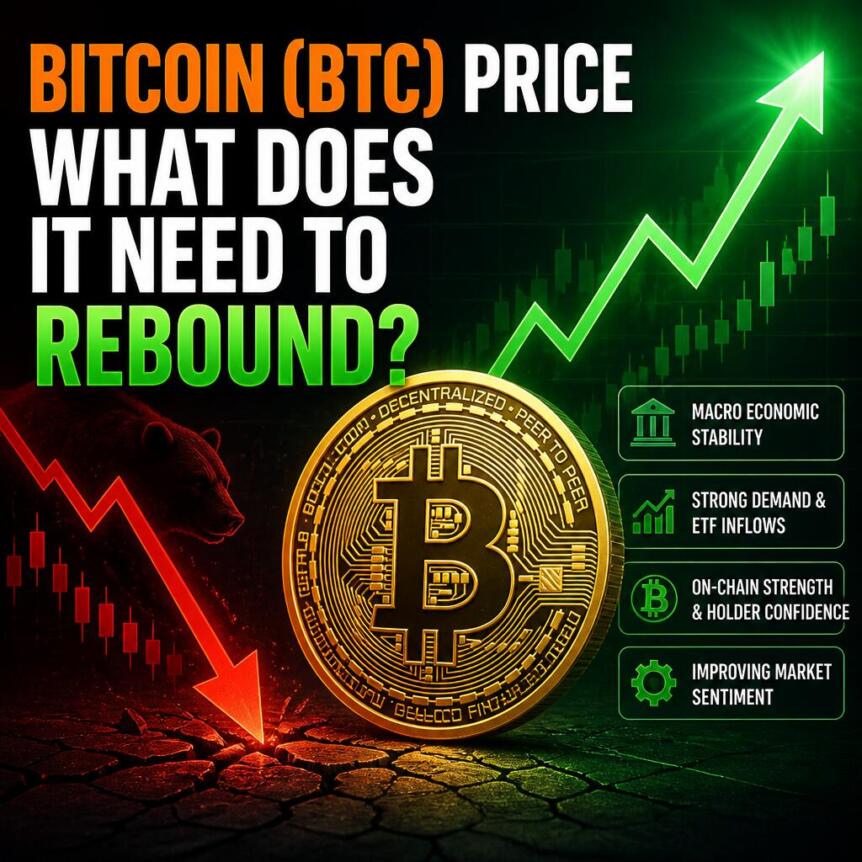
Bitcoin (BTC) endured a brutal first half of 2026, dropping to a multi-year low of $57,717 on July 1, a level not seen since September 2024. The flagship cryptocurrency has declined over 30% so far this year and is trading around $63,300 at the time of writing.
Improving macro conditions and whale accumulation briefly pushed BTC above $65,000 this week. However, it fell back into the red, highlighting the fragility of its recovery during current market conditions.
Bitcoin (BTC) Recovery On Shaky Ground
Bitcoin (BTC) has endured a difficult few months, falling to its lowest level since September 2024 on July 1, when it plunged to a low of $57,717. The flagship cryptocurrency has declined over 30% during the first half of 2026, and chances of a recovery remain low until ETF inflows rebound and prevailing macroeconomic conditions improve. BTC also faces the prospect of a deeper decline as investors pivot to AI stocks.
BTC extended its decline for a third day after Tuesday’s rebound and has slipped below $63,000 after stalling around the $65,000 level. While the flagship cryptocurrency has struggled, the S&P 500 and Nasdaq are trading at record levels. This may suggest that the decline is BTC-specific. However, several factors are at play, including geopolitical tensions and crypto-specific factors like ETF outflows, liquidations, and Strategy’s decision to leverage some of its BTC holdings.
What’s Keeping Bitcoin (BTC) Price Action Subdued
Bitcoin (BTC) has been in the doldrums since the start of the year. The flagship cryptocurrency has been declining since hitting its all-time high in October 2025. The bullish narrative around President Trump’s victory and a crypto-friendly administration quickly faded as key crypto-specific legislation stalled. The delay in establishing a strategic Bitcoin reserve and passing the CLARITY Act has had a significant impact on investor sentiment and laid bare the friction between the banking sector and the crypto industry.
Institutional demand, one of the primary drivers of BTC’s rally to its all-time high, has also declined. According to data from CoinMarketCap, spot Bitcoin ETFs recorded total net inflows of $21.4 billion in 2025. In comparison, they have recorded around $5.8 billion in net outflows year-to-date, a distinct shift in investor sentiment and weakening institutional demand.
Artificial Intelligence (AI) and the threat of quantum computers have also impacted investor sentiment and price action. Capital rotation into AI stocks and initial public offerings of companies like SpaceX, OpenAI, and Anthropic has also pulled BTC lower.
Additionally, Strategy’s decision to sell some of its BTC to fund a dollar reserve has dealt a psychological blow to the market and directly put pressure on the asset’s price. The Bitcoin treasury company has authorized selling up to $1.25 billion in BTC and has already executed two sales. The company sold 32 BTC in May for $2.5 million before liquidating 3,588 BTC for $216 million in July. Unsurprisingly, the large sale was a shock to the market, and the flagship cryptocurrency fell nearly 4% in the aftermath of the transaction.
Can Bitcoin (BTC) Price Action Recover
BTC’s recovery hinges on several factors. The passage of the CLARITY Act could be a significant boost for the market. It establishes a clear market structure to regulate the industry and could boost institutional confidence and drive adoption. The bill has advanced from the Senate Banking Committee but faces a crucial test on the Senate floor.
Spot Bitcoin ETF demand is crucial for a sustainable recovery. ETFs have registered substantial outflows so far as investors pulled capital. However, heavy outflows have slowed as sell-side pressure declines. After recording substantial outflows in June, Bitcoin ETFs have recorded considerable inflows in July, a sign that institutional interest could be returning.
BTC registered a sharp bounce after US CPI data revealed inflation declined 0.4% month-on-month in June, the first monthly decline in six years. Headline inflation fell from 4.2% to 3.5%, while core CPI fell to 2.6%. However, inflationary risks remain thanks to renewed US-Iran tensions. Escalating Middle East tensions could push oil prices higher, raising inflationary risks. The markets have also tempered expectations of a rate hike, with the probability of such a hike falling from 78% to 58%.
Disclaimer: This article is provided for informational purposes only. It is not offered or intended to be used as legal, tax, investment, financial, or other advice.

SBI’s Coinhako deal advances plan for Asia’s first digital asset empire

‘Heartstopper Forever’ Is the Perfect Ending to the Beloved Netflix Series

Go-karting experience now 25% off ‘great for families’ during school summer holidays


-

 Fashion7 days ago
Weekend Open Thread: Nutriplenish Leave-In Conditioner
-
 NewsBeat22 hours ago
London Mayor Sadiq Khan handed a peerage by Keir Starmer alongside 15 other Labour figures… just days before the PM leaves No10
-

 Crypto World2 days ago
CFTC blocks Kalshi from unwinding Michigan trades after court order
-

 Business1 day ago
Nvidia Stock Slips After Big Tuesday Rally as Huang Confirms Vera Rubin Chip Is Now in Production Today
-

 Politics2 days ago
Young campaigners urge incoming PM to act on outdoor junk food ads
-
 Entertainment2 days ago
Disney’s Most Ambitious Failed Star Wars Attraction Is Coming to SDCC
-

 News Videos3 days ago
XRP BOMBSHELL… XRP OMBOARDED FOR TRANSACTIONS!!!
-
 Tech3 days ago
Get Your ESP32 Sunny Side Up With This Solar Dev Board
-

 Crypto World17 hours ago
Injective Submits SEC Transfer-Agent Registration to Onchain Ownership Records
-

 Tech3 days ago
Dark Secrets Emerge When Jailbreaking LLMs
-

 Business1 day ago
Palantir Shares Rise After Expanded Nvidia Partnership and Fresh Analyst Upgrades Ahead of Earnings Day
-
 Sports2 days ago
New Cornerback Enters Vikings Trade Rumor Mill
-

 News Videos7 hours ago
Money | Class 12 Economics | CBSE Board Exam 2026-27
-

 NewsBeat2 hours ago
Registration is now open for March for Men with Kev 2026
-

 Business12 hours ago
Banco Bilbao Vizcaya Argentaria, S.A. (BBVA) Discusses Global Macro Environment and Economic Outlook for Core Markets Transcript
-
 Tech4 days ago
Cloudflare Precursor Watches Your Mouse and Keyboard To Decide If You Are Human
-

 News Videos4 days ago
how to make coin bank box with cardboard #scienceproject #money #diy #shorts
-
 Entertainment2 days ago
Vicki Gunvalson Defends Discussing Heather Dubrow’s Money
-
Crypto World3 days ago
Ripple, Coinbase, Circle Join Linux x402 Foundation to Help Shape AI Payments
-
 Crypto World16 hours ago
Claude Fable 5 Slips to Second in AI Coding Leaderboard
You must be logged in to post a comment Login