Crypto World
Bitcoin is Back at the 200-Week Moving Average After Nearly Three Years

Bitcoin (BTC) has tagged a key bear-market trend line with its drop to four-month lows, with a “decent chance” of a rebound next.
Key points:
- Bitcoin revisits its 200-week simple moving average after trading above it since October 2023.
- The trend line functioned as resistance throughout the 2022 bear-market bottom and rebound.
- Bitcoin’s daily RSI approaches its most oversold since 2020.
Bitcoin bear-market trend line returns after nearly three years
Data from TradingView shows that for the first time since 2023, BTC/USD is back at its 200-week simple moving average (SMA).
The 200-week SMA is a key yardstick during Bitcoin bear markets. The trend line, which has only ever increased with time, currently sits at $61,626.
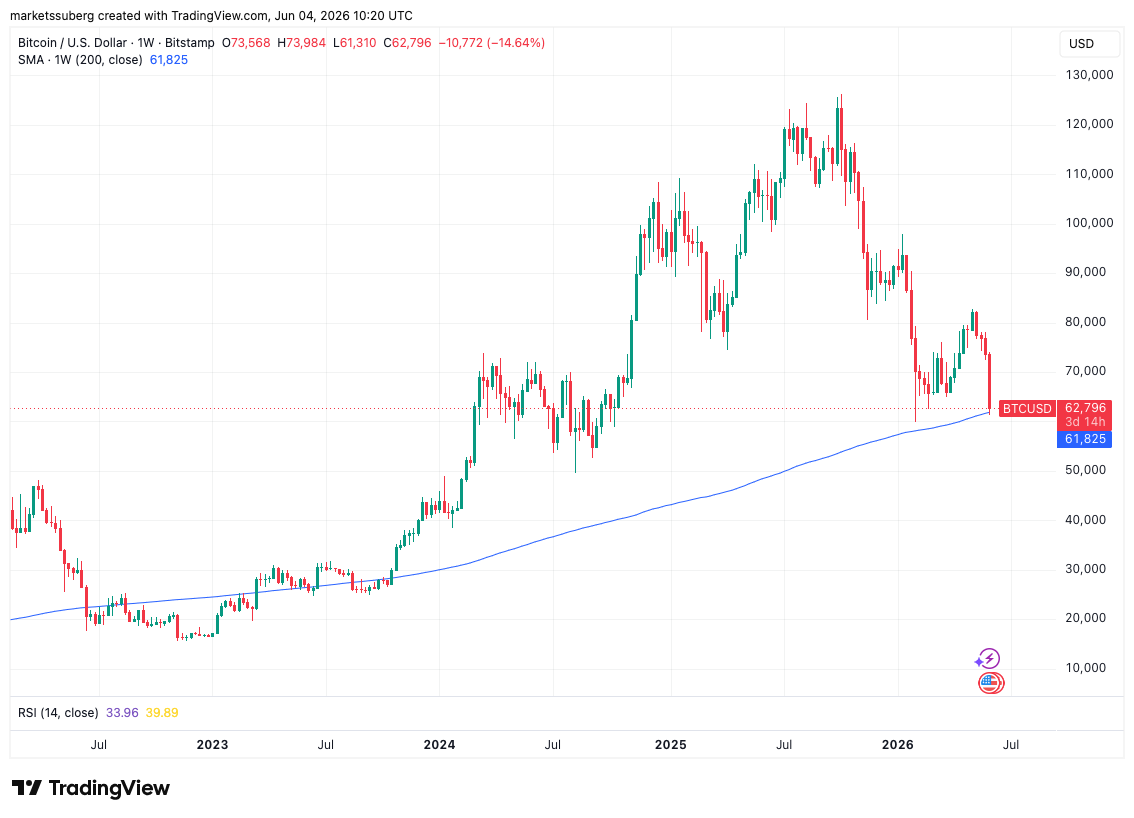

BTC/USD one-week chart with 200SMA. Source: Cointelegraph/TradingView
The last time price interacted with it was in October 2023, but during the 2022 bear market, it functioned as resistance until bulls fully regained control.
Commenting, CollinTalksCrypto, creator of the social media channel of the same name, described the return of the 200-week SMA as a “key milestone.”
“Does it bounce here or keep dropping?” he queried in a post on X.
“My guess is BTC has a decent chance of bouncing soon as it’s been dropping pretty steeply. But honestly it’s anyone’s guess in the short term.”

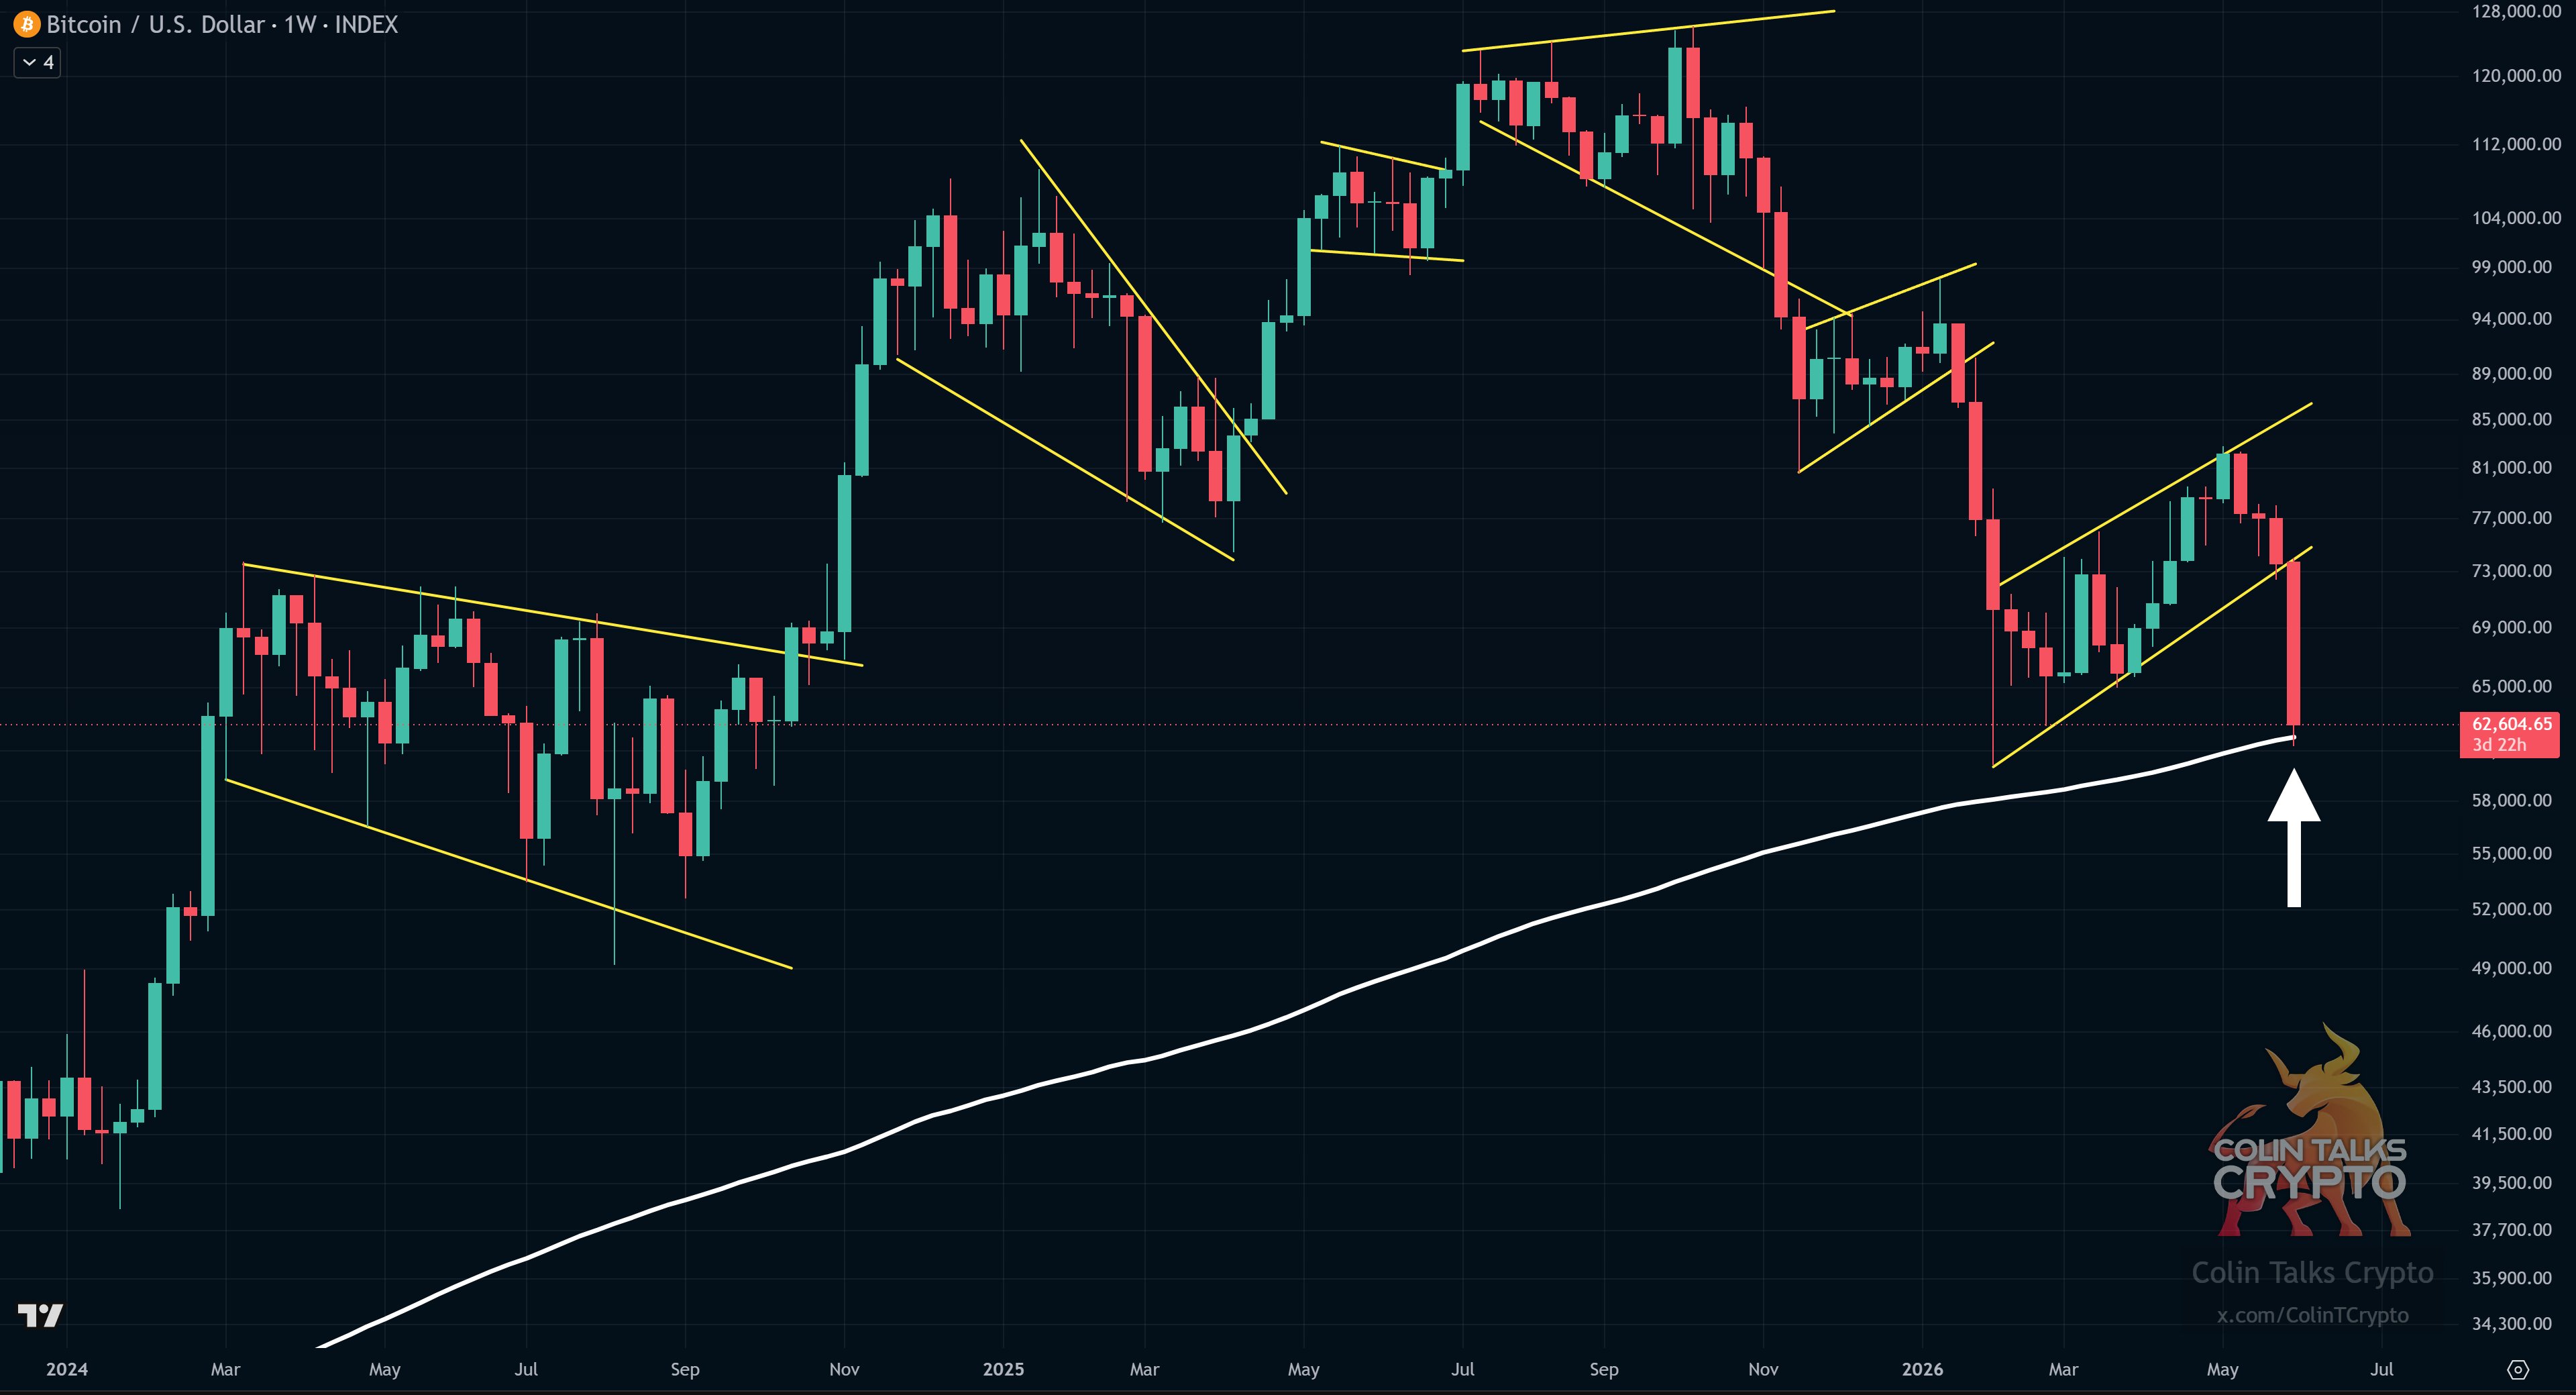
BTC/USD one-week chart with 200SMA. Source: ColinTalksCrypto/X
ColinTalksCrypto included a chart showing various bull and bear flags over the past several years. As Cointelegraph reported, BTC/USD has now copied its bear-flag breakdown from the start of 2026.
He added that the “best bear market entries happen *below* the 200-week MA.”
BTC price sparks more record “oversold” talk
Some optimistic market takes focused on the “oversold” nature of Bitcoin at its latest local lows.
Related: Bitcoin copying 2022 ‘almost perfectly’ as trader sees key support failing
On daily time frames, the relative strength index (RSI) dropped to 17.35, marking its lowest levels since 2020 along with the February drop.
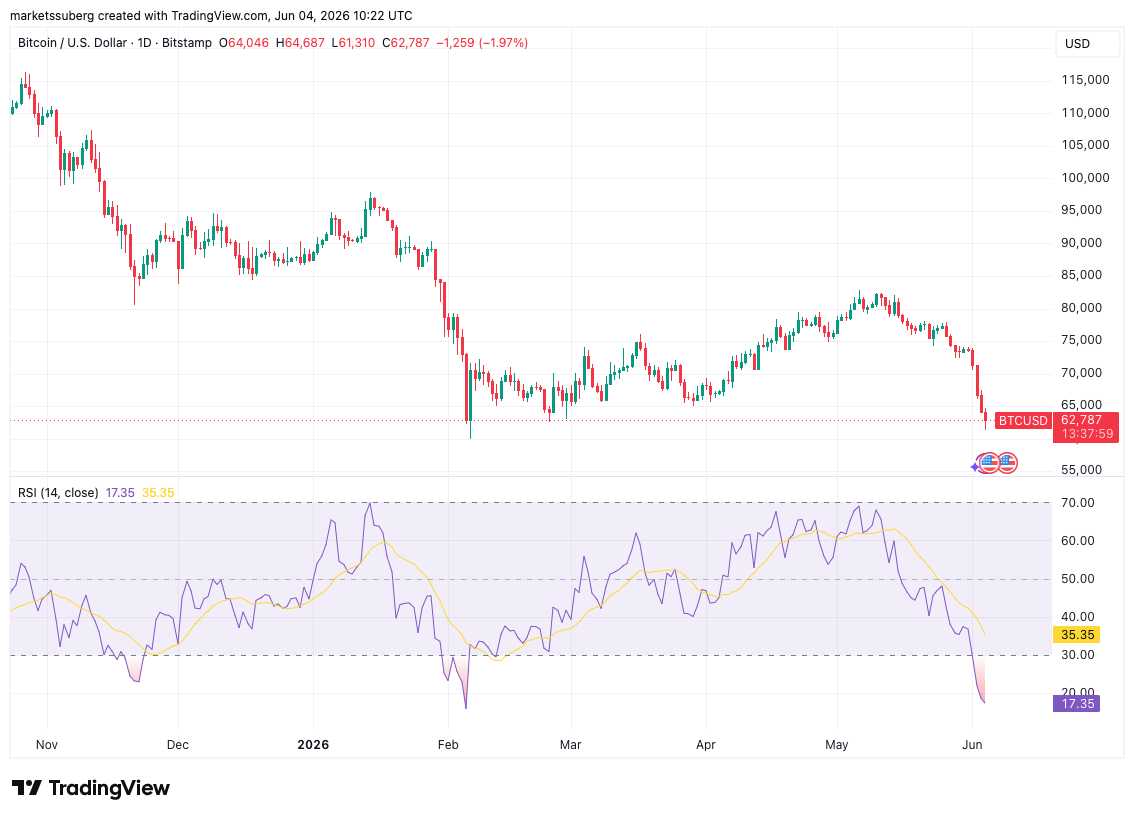
BTC/USD one-day chart with RSI data. Source: Cointelegraph/TradingView
Responding, the X analytics account named after famous economist Frank A. Fetter stressed that BTC/USD was “pretty much the most oversold ever.”
“It’s the area to accumulate your positions, if you have a strong thesis on Bitcoin from here,” crypto trader and analyst Michaël van de Poppe added on the back of both RSI data and the revisit of the 200-week SMA.
Van de Poppe put ongoing questions over Strategy’s corporate debt at the center of short-term price trajectory.
“Aside from that perspective, it’s all about STRC and the depeg; if that flips back upwards, it’s very likely time for Bitcoin to bounce back too,” he added.
“If there’s a constant, continuous downward trend here, we’ll most likely see sub-$60,000 in the markets.”

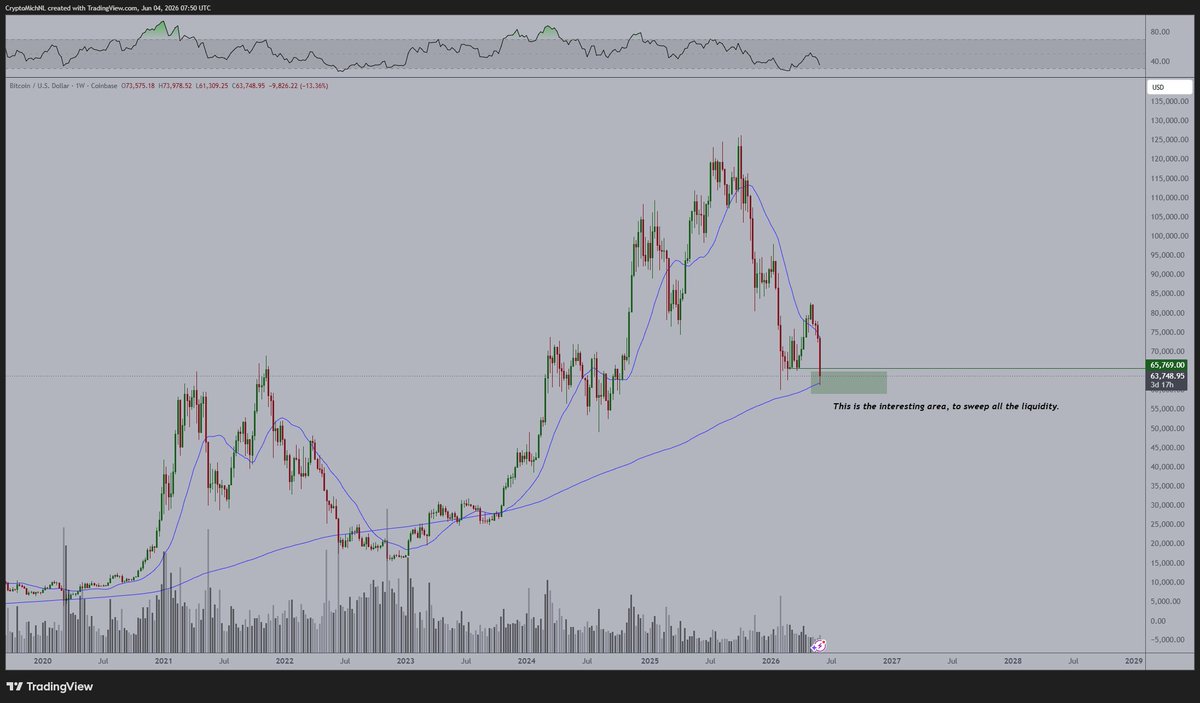
BTC/USD one-week chart. Source: Michaël van de Poppe/X
You must be logged in to post a comment Login