
Crypto World
Bitcoin Miner MARA Moves 1,318 BTC in 10 Hours, Traders Wary of Forced Miner Selling

Bitcoin miner Marathon Digital (MARA) has transferred 1,318 BTC, worth $86.9 million, in 10 hours as Bitcoin slumps to $64K. The miner moved to a mix of three crypto wallets, on-chain data revealed.
Per Arkham, MARA moved a large chunk of 653.773 BTC to credit and trading firm Two Prime, worth about $42.01 million in one transfer. Minutes later, a smaller amount of 8.999 BTC, worth about $578,000, was sent to the same Two Prime-tagged address.
A separate chunk of about 300 BTC was sent to crypto custodian BitGo-linked wallet, split into two transactions, worth roughly $20.4 million at the time.
Besides, MARA also moved 305 BTC to a fresh wallet address, valued at $20.72 million.
Tough Period for BTC Miners
Bitcoin has been crashing so hard in the recent past and is now hovering just above $63,000 at the time of writing, its lowest levels since October 2024.
The plunge has taken a toll on Bitcoin miners, making it far less economical for them. Bloomberg reported Thursday that the mining revenue value per unit of computing power, called the hash price index, has dropped to around 3 cents for each terahash.
Newhedge research notes that a biweekly figure mining difficulty is set to drop by over 13%, one of the largest decreases since China banned mining in 2021.
As a result, shares of major BTC miners tumbled. MARA Holdings slumped more than 18%, while CleanSpark Inc and Riot Platforms Inc fell 19.13 and 14.7%, respectively.
MARA Trading Under Pressure – Here’s Why
MARA stock is down over 30% in the past 5 days, and 34% in the last month, according to Google Finance.
The company’s share performance is also tied to MARA’s latest insider share transactions report. On January 30, 2026, 14,301 shares of common stock were withheld at $9.50 per share to cover his tax liability upon vesting of restricted stock units, per Stock Titan data.
Apart from the headwind from the Bitcoin market downturn, miners have been facing rising power costs largely due to winter storms across the US in late January.
Further, energy-rich BTC mining hubs in Texas and Tennessee faced power outages.
“It is due to the combination of both the sell-off and winter storms,” Harry Sudock, chief business officer at CleanSpark, told Bloomberg.
The post Bitcoin Miner MARA Moves 1,318 BTC in 10 Hours, Traders Wary of Forced Miner Selling appeared first on Cryptonews.


Key Highlights
- The premier DeFi lending platform Aave has deployed to X Layer, the Ethereum Layer 2 network developed by OKX
- Users of OKX Wallet gain immediate access to lending and borrowing functionality without cross-chain asset transfers
- Available assets on X Layer include USDT0, xBTC, xETH, xSOL, with loan-to-value ratios reaching 88% for certain liquid staking token pairs
- With $23.5 billion in TVL, Aave recently achieved the milestone of $1 trillion in aggregate lending volume
- This marks Aave’s 21st blockchain deployment, expanding beyond networks like Ethereum, Arbitrum, and Base
The world’s leading decentralized lending platform, Aave, has officially deployed on X Layer, OKX’s Ethereum Layer 2 solution. This integration provides OKX Wallet users with seamless access to onchain financial services without requiring external wallets or asset bridging between networks.
The cryptocurrency exchange OKX confirmed the integration on Monday. Through the native wallet interface, users can now deposit assets, take out collateralized loans, and generate auto-compounding returns.
“The deployment to X Layer delivers proven, reliable infrastructure to OKX’s Layer 2 environment—fully permissionless, self-custodial, and integrated directly within OKX Wallet,” the exchange stated in an official announcement.
Stani Kulechov, who founded Aave Labs, shared his perspective on the deployment. “This expansion to X Layer bridges Aave’s deep liquidity with an emerging network of users and decentralized applications, simplifying the process of earning yields, borrowing funds, and developing on the platform,” Kulechov explained.
The deployment supports multiple digital assets including USDT0, USDG, GHO, xBTC, xETH, xSOL, xBETH, and xOKSOL. The platform operates without traditional credit verification or centralized intermediaries.
X Layer’s Expanding DeFi Infrastructure
X Layer went live in May 2024. The network currently maintains approximately $25 million in total value locked. Transaction costs average just $0.0005, with blocks produced every second.
Several established DeFi platforms have already integrated with X Layer, including Uniswap, Chainlink, and Stargate. Aave represents the most significant protocol integration thus far.
The Layer 2 network has implemented six specialized “eModes” optimized for its asset composition. These configurations enable loan-to-value percentages as high as 88% for specific liquid staking token combinations.
This development aligns with OKX’s strategic initiative to incorporate DeFi capabilities directly into its wallet infrastructure, mirroring approaches from rivals such as Coinbase and Binance. Last November, OKX introduced integrated DEX trading functionality for Base, Solana, and X Layer within its wallet.
Aave’s Performance Metrics and Growth
Aave maintains approximately $23.5 billion in total value locked distributed across over 20 different blockchain networks. This figure exceeds its nearest rival, Morpho, by more than three times—Morpho currently holds around $10 billion.
In late February, the protocol achieved a historic milestone by surpassing $1 trillion in total lending volume, becoming the first DeFi platform to reach this benchmark.
Revenue generation for Aave topped $6.2 million over the past 30 days, outpacing Morpho’s earnings by more than five times during the identical timeframe.
Cumulative net deposits across Aave exceed $40.4 billion. X Layer represents the protocol’s 21st blockchain integration.
This launch follows an overwhelmingly positive Aave DAO governance vote approving the Version 4 mainnet roadmap, demonstrating ongoing development momentum throughout the protocol ecosystem.

Quick Overview
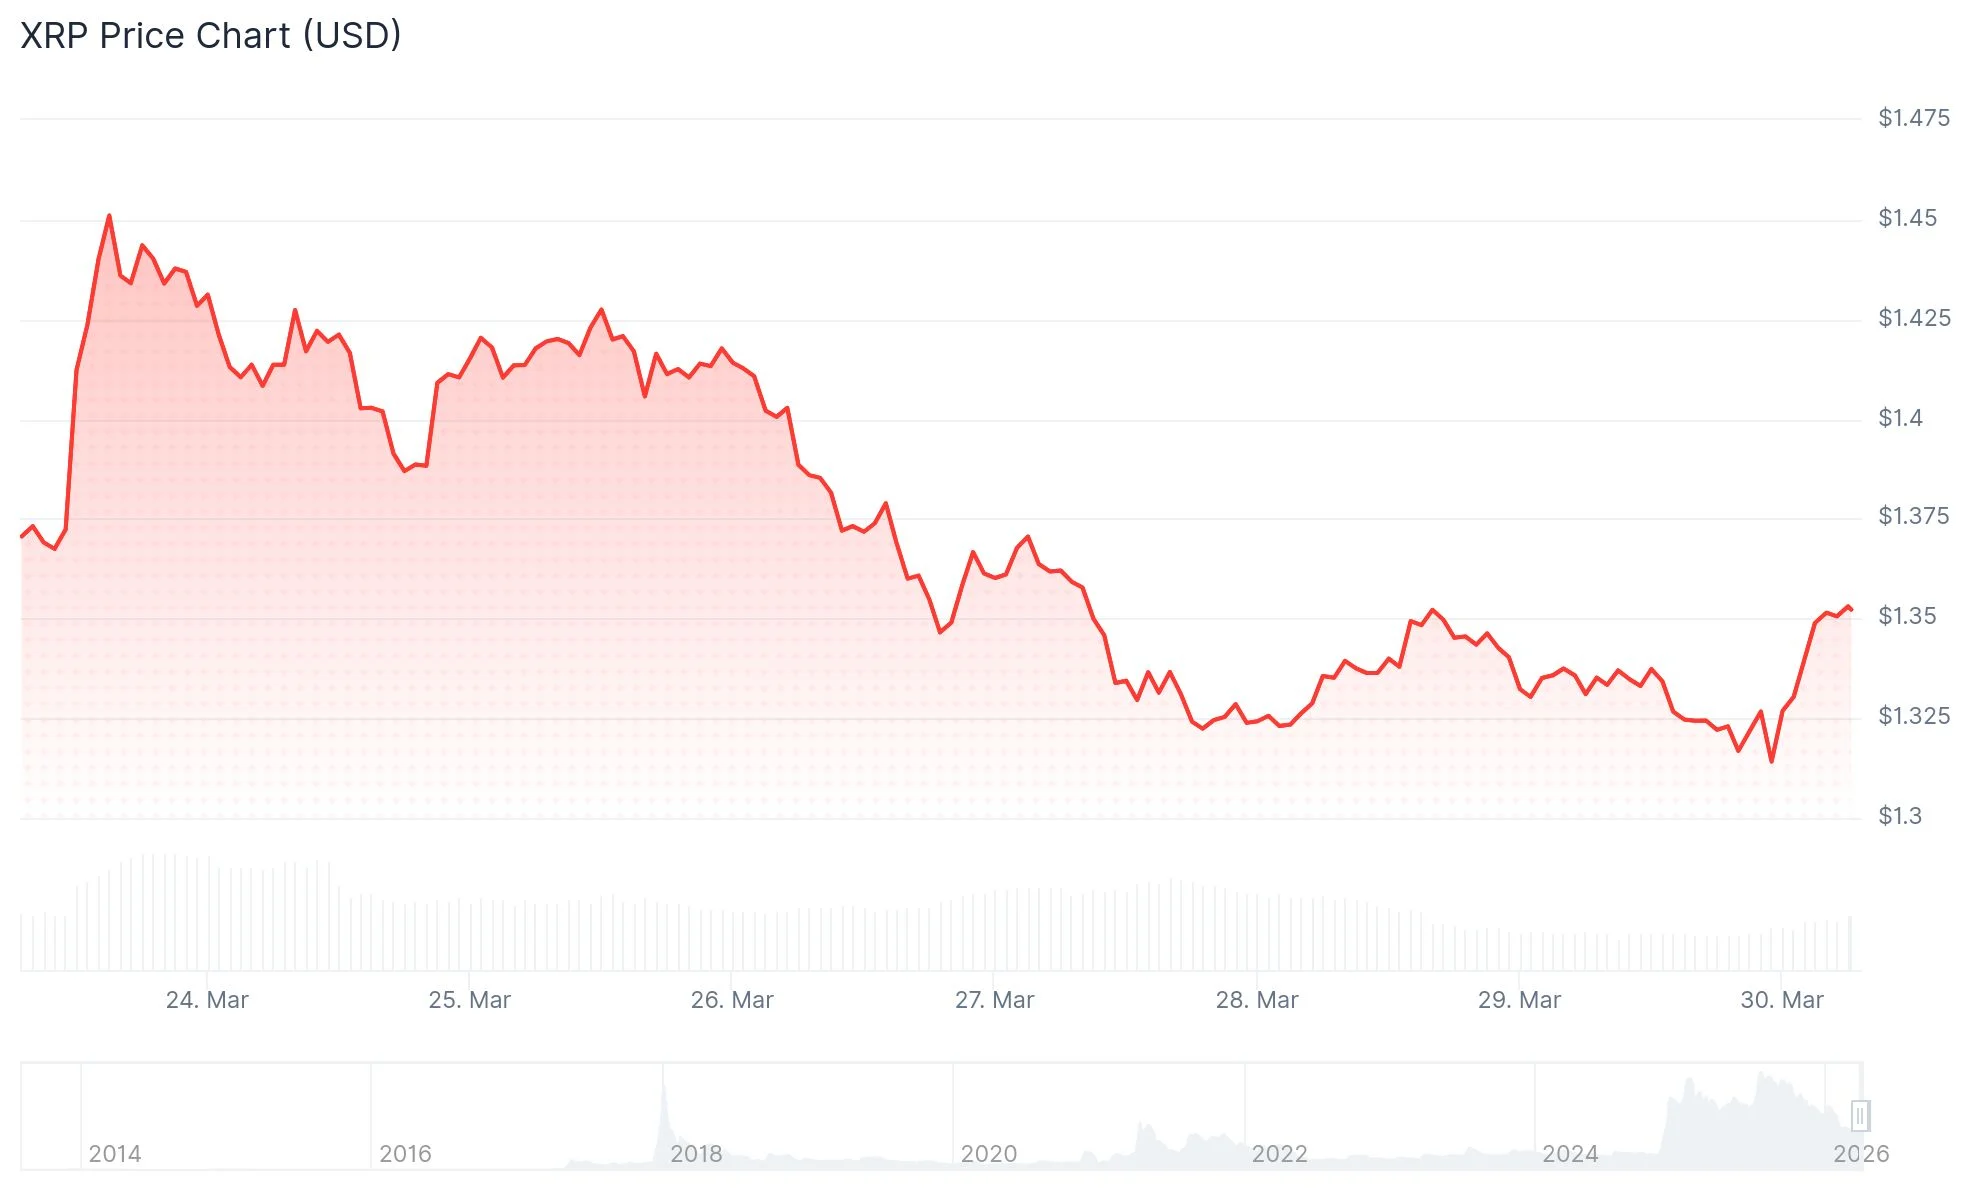
- XRP serves primarily as a payments and cross-border transaction solution, creating a specialized but limited application
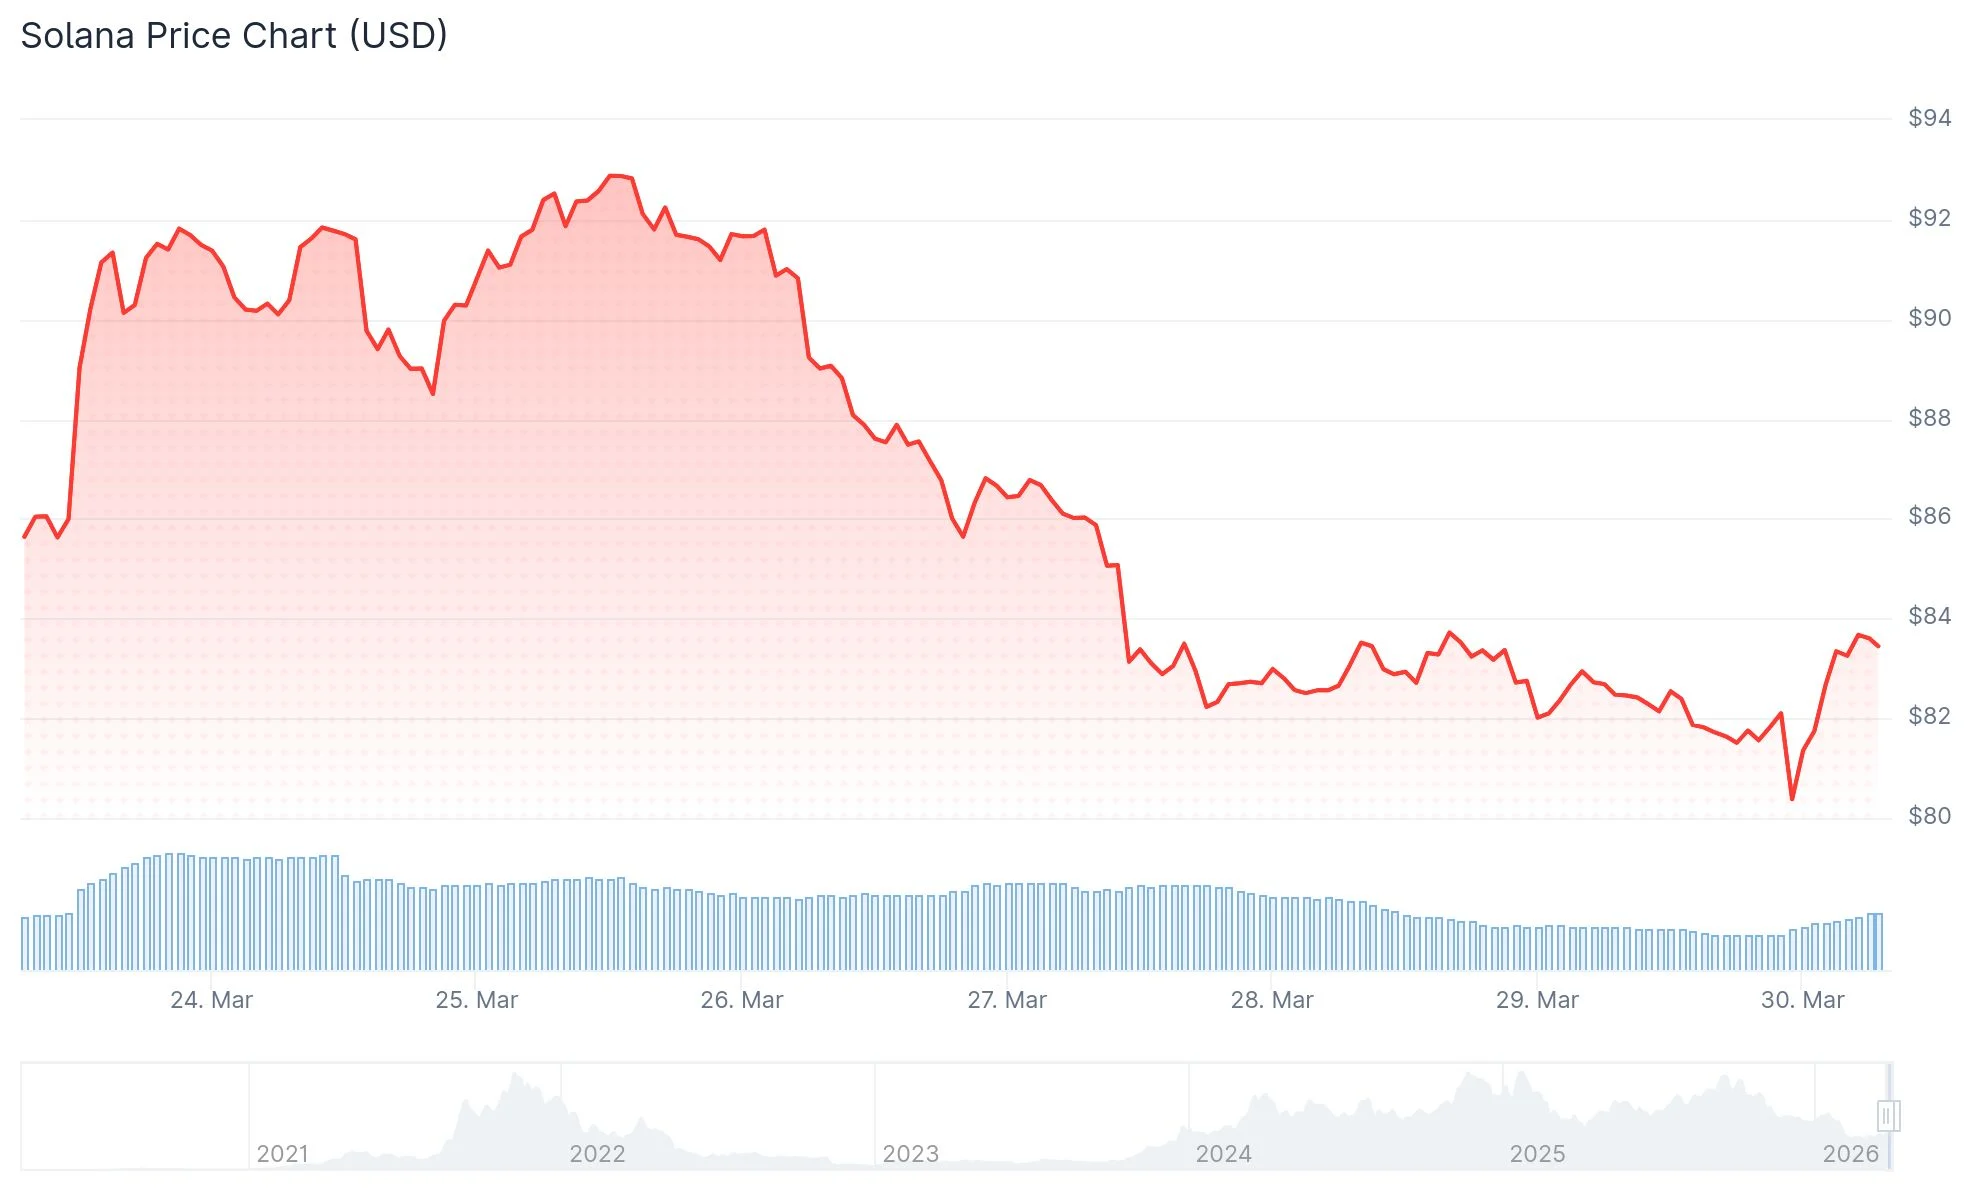
- Solana functions as a versatile blockchain platform supporting DeFi, NFTs, gaming, stablecoins, and Web3 applications, providing diverse expansion opportunities
- Ripple’s substantial XRP reserves continue raising questions among investors monitoring long-term token distribution
- Solana demonstrates superior developer engagement, typically indicating healthier long-term ecosystem vitality
- Both assets involve risk factors, though Solana’s diversified ecosystem provides additional avenues for sustainable growth
When evaluating long-term cryptocurrency investments, XRP and Solana consistently emerge as two of the most discussed assets. Each boasts substantial communities, practical applications, and significant growth potential. However, their fundamental architectures serve distinctly different objectives, making this distinction critical for investors planning three to five-year positions.

Ripple developed XRP specifically for facilitating rapid, cost-effective international money transfers. Conversely, Solana emerged as a comprehensive blockchain infrastructure supporting applications, decentralized finance, trading platforms, and digital asset creation. This fundamental distinction influences every aspect of their respective long-term performance trajectories.
XRP’s primary advantage lies in its focused mission. Ripple has dedicated years cultivating partnerships with banking institutions and payment service providers. This strategic positioning gives XRP legitimate utility within the cross-border finance sector.
Should blockchain-based settlement systems gain widespread adoption among financial institutions, XRP stands positioned to capture significant value. This represents a credible scenario driving many investors’ continued confidence in the asset.
The limitation, however, centers on XRP’s dependence on this singular growth corridor. Should institutional adoption proceed slower than anticipated, investor returns may fall short of expectations.
Solana’s Multi-Faceted Ecosystem Strategy
Unlike XRP’s specialized focus, Solana isn’t confined to a single application. The platform accommodates decentralized financial protocols, stablecoin infrastructure, NFT marketplaces, blockchain gaming, consumer-facing applications, and tokenized traditional assets.
This diversification creates multiple parallel growth trajectories. When activity decreases in one vertical, momentum in alternative sectors can sustain network demand and token value.
Developer engagement represents another domain where Solana demonstrates competitive superiority. Blockchains maintaining robust builder communities typically sustain relevance longer, as developers generate the applications attracting end users.
Elevated developer activity frequently serves as a predictive indicator of sustained platform viability. Measured against this criterion, Solana currently maintains a noticeable advantage over XRP.
Supply Economics and Investment Considerations
XRP employs a transparent supply mechanism. The token doesn’t utilize mining-based inflation, and minuscule amounts of XRP are destroyed with every transaction.
Nevertheless, Ripple’s substantial XRP treasury represents a persistent consideration for certain investors. This lingering supply overhang can constrain confidence regarding long-term price appreciation potential.
Solana incorporates inflationary mechanics into its economic design. However, this inflation receives partial counterbalancing through staking incentives and expanding on-chain economic activity.
As network utilization accelerates, organic demand for Solana can increase through transaction fees and ecosystem expansion. This dynamic provides more fundamental support for the token’s valuation over extended timeframes.
XRP’s primary uncertainties revolve around corporate adoption rates and regulatory framework development. Solana’s challenges relate more to technical execution and network stability, areas that have historically presented concerns.
Solana has recently maintained ecosystem momentum through additional stablecoin partnerships and consumer-oriented product launches, sustaining developer interest as 2025 approaches.
Investment Perspective
For investors prioritizing long-term positioning, Solana presents the more compelling platform investment thesis. While XRP maintains legitimate value within payments and settlement infrastructure, Solana’s expansive ecosystem architecture provides substantially more pathways for sustainable growth.
Key Takeaways
- ETH maintains position near $2,000 following rejection from $2,372 peak recorded earlier this month.
- Long/short ratio reaches 2.4, creating potential squeeze risk as price action remains stagnant.
- Ethereum ETFs listed in the U.S. experienced $92.5 million in withdrawals on March 26.
- Market volatility increased following $14.16 billion Bitcoin options expiration and heightened geopolitical concerns.
- Critical resistance zone positioned at $2,138–$2,151, while breach below $1,980 may trigger deeper corrections.
Ethereum currently changes hands around $2,048 as market participants attempt to defend the psychologically significant $2,000 threshold. Following a rally earlier this month, the cryptocurrency encountered strong resistance approaching $2,372. Subsequently, ETH has remained confined within a consolidation range spanning $1,900 to $2,200.
The asset trades beneath its 50-day exponential moving average positioned at approximately $2,160 and significantly under the 100-day EMA hovering near $2,420. This positioning reinforces a prevailing bearish technical structure.
Daily chart analysis reveals the RSI hovering around 44, registering below the neutral threshold of 50. Meanwhile, the MACD indicator remains beneath its signal line while drifting toward the zero mark. These technical signals collectively suggest diminishing bullish momentum.
Market observers are paying particular attention to the long/short ratio, which has escalated to approximately 2.4. This metric indicates that traders are predominantly positioning for upward movement. However, price action has failed to confirm this sentiment.
An accumulation of long positions without corresponding price appreciation often generates what market participants refer to as a “crowded trade.” Such conditions frequently precipitate a long squeeze scenario, wherein abrupt downward movement compels leveraged long holders to liquidate positions, amplifying downside momentum.
Institutional Withdrawals and Broader Market Dynamics
Data from March 26 shows U.S.-listed Ethereum ETFs registering $92.5 million in net withdrawals. These redemptions occurred within a broader pattern of outflows affecting cryptocurrency exchange-traded products.
According to SoSoValue data, on March 27 (ET), U.S. Bitcoin spot ETFs recorded a total net outflow of $225 million. Meanwhile, Ethereum spot ETFs saw a total net outflow of $48.54 million, marking an eight-day streak of net outflows. pic.twitter.com/ell1RDmAqI
— Wu Blockchain (@WuBlockchain) March 28, 2026
The preceding day witnessed a historic $14.16 billion in Bitcoin options reaching expiration on March 27. Substantial options expiry events frequently introduce volatility into cryptocurrency markets, and this occurrence contributed additional selling momentum across digital assets.
Macroeconomic and geopolitical developments further influenced market sentiment. Escalating crude oil valuations, connected to Iran’s warnings regarding a critical shipping corridor, intensified inflation anxieties. Such conditions typically create headwinds for risk-oriented assets including Ethereum.
Critical Price Thresholds for Traders
Examining resistance levels, $2,138 represents the 23.6% Fibonacci retracement calculated from the $3,402 peak down to the $1,747 trough. The Ichimoku Kijun indicator establishes another barrier at $2,151, with market participants monitoring a decisive close above this region as a potential catalyst for advancement toward $2,380.
Regarding support zones, initial downside defense stands at $1,990. Beneath this threshold, the channel bottom resides near $1,748. A confirmed breakdown through this area could accelerate bearish momentum.
Technical projections suggest ETH will likely consolidate between $1,980 and $2,170 throughout the upcoming five-session period, with probability calculations indicating less than 20% likelihood of upward price movement.
Ethereum $ETH faces a major test at $1,800! pic.twitter.com/7Jv5c8gTI3
— Ali Charts (@alicharts) March 30, 2026
Market analyst Ali Charts communicated via X that Ethereum confronts a “major test at $1,800,” indicating certain technical observers anticipate the possibility of substantially lower price levels should current support structures fail.
Separately, analyst Tom Lee has projected Ethereum could ultimately achieve $62,000, although this long-term forecast lacks a specific timeframe for realization.
With Ethereum ETF withdrawals reaching $92.5 million on March 26, ETH remains anchored near $2,000 while technical indicators continue signaling near-term vulnerability.

The Ethereum Foundation (EF) staked roughly $46.2 million worth of Ether (ETH), according to on-chain data from Arkham Intelligence. The deposit is the organization’s single-largest staking event.
The transaction marks a sharp acceleration in the Foundation’s treasury staking initiative, which launched in late February with an initial deposit of just 2,016 ETH worth approximately $3.8 million.
EF Moves From First Deposit to Record Stake
The EF announced its staking plans on February 24, 2026, outlining a target of approximately 70,000 ETH.
That initial deposit was modest, but the Foundation signaled from the start that further allocations would follow.
At current prices near $2,000 per ETH, the full 70,000 ETH target represents more than $140 million in staked capital.
The $46.2 million deposit reported by Arkham today brings the program significantly closer to that goal.
On-chain tracker Lookonchain also flagged the transaction, noting it surpassed all previous EF staking events by a wide margin.
Why the Foundation Is Staking Instead of Selling
For years, the EF relied on periodic ETH sales to fund operations, a practice that drew consistent criticism from the community.
Every sale created downward price pressure and sparked speculation about the organization’s long-term commitment.
The shift to staking addresses both concerns.
- By locking ETH into validators, the Foundation generates yield without reducing its treasury balance.
- Staking rewards flow back into the treasury to fund protocol research, ecosystem development, and community grants.
The program uses open-source tools from Attestant, acquired by Bitwise Asset Management in 2024. The infrastructure employs distributed signing across multiple jurisdictions and minority validator clients to reduce single points of failure.
Ethereum currently has more than 38 million ETH staked across roughly 1.17 million validators, representing about 30% of the total circulating supply.
A Stronger Signal at a Difficult Time
The record deposit arrives during a turbulent stretch for ETH. Prices fell sharply in early 2026, from above $4,800 in late 2025 to a low near $1,473 in February.
Co-founder Vitalik Buterin sold millions in personal ETH holdings during that period, amplifying community anxiety.
Against that backdrop, the Foundation’s willingness to commit its largest single staking deposit sends a different signal.
Rather than preserving maximum liquidity, the organization is tying up capital directly in network security.
Whether additional deposits follow at this pace will determine how quickly the EF reaches its 70,000 ETH target and how much yield it can generate going forward.
The post Ethereum Foundation Breaks Its Own Record With a $46.2 Million ETH Staking appeared first on BeInCrypto.


Walmart-owned OnePay has added more than a dozen crypto tokens to its platform in response to growing demand from its customers.
Summary
- OnePay expanded its crypto offering with more than a dozen tokens including SUI, Polygon, and Arbitrum following earlier listings such as Solana and Cardano.
- The Walmart-backed platform is building out a super app strategy after launching crypto support with Bitcoin and Ethereum in January.
In an announcement shared with crypto media, OnePay said its offering now includes tokens such as SUI (SUI), Polygon (POL), and Arbitrum (ARB), just days after listing Solana (SOL), Cardano (ADA), Bitcoin Cash (BCH), and PAX Gold (PAXG).
As previously reported by crypto.news, OnePay first announced plans to expand into digital assets last year in a bid to position itself within the emerging “super app” model. The platform subsequently launched in January this year with Bitcoin (BTC) and Ethereum (ETH) as its initial offerings.
“We plan on continuing to expand thoughtfully, prioritizing assets that meet a high bar: demand, liquidity, regulatory clarity and long-term utility,” Ron Rojany, OnePay’s general manager, said in a statement.
According to Rojany, the company intends to focus on building a curated set of assets that aligns with how customers use and manage their money, rather than chasing short-term trends.
OnePay currently offers a digital wallet that customers can use at checkout in Walmart stores and on the company’s website, alongside a broader suite of financial services.
Besides OnePay, a number of other financial and technology giants are racing to develop their own “everything” superapp that would integrate several financial services, including trading, banking, and social networking, into a single platform.
For instance, Coinbase CEO Brian Armstrong recently said that the company was prioritizing the creation of an “everything exchange.” By leveraging its Base network, Coinbase intends to serve as both a consumer-facing gateway and the underlying infrastructure for the broader on-chain economy.
Similarly, Startale Group has launched a super app on Ethereum’s Layer 2 infrastructure to serve as a unified entry point for Sony’s Soneium ecosystem, enabling users to participate in token generation events, airdrops, and reward programs through a single platform.
Ethereum’s native token, Ether (ETH), may decline 40% to $1,200 in the coming weeks, according to a fractal setup shared by analyst Leshka.eth.
Key takeaways:
Ethereum setup flashes bull trap warning
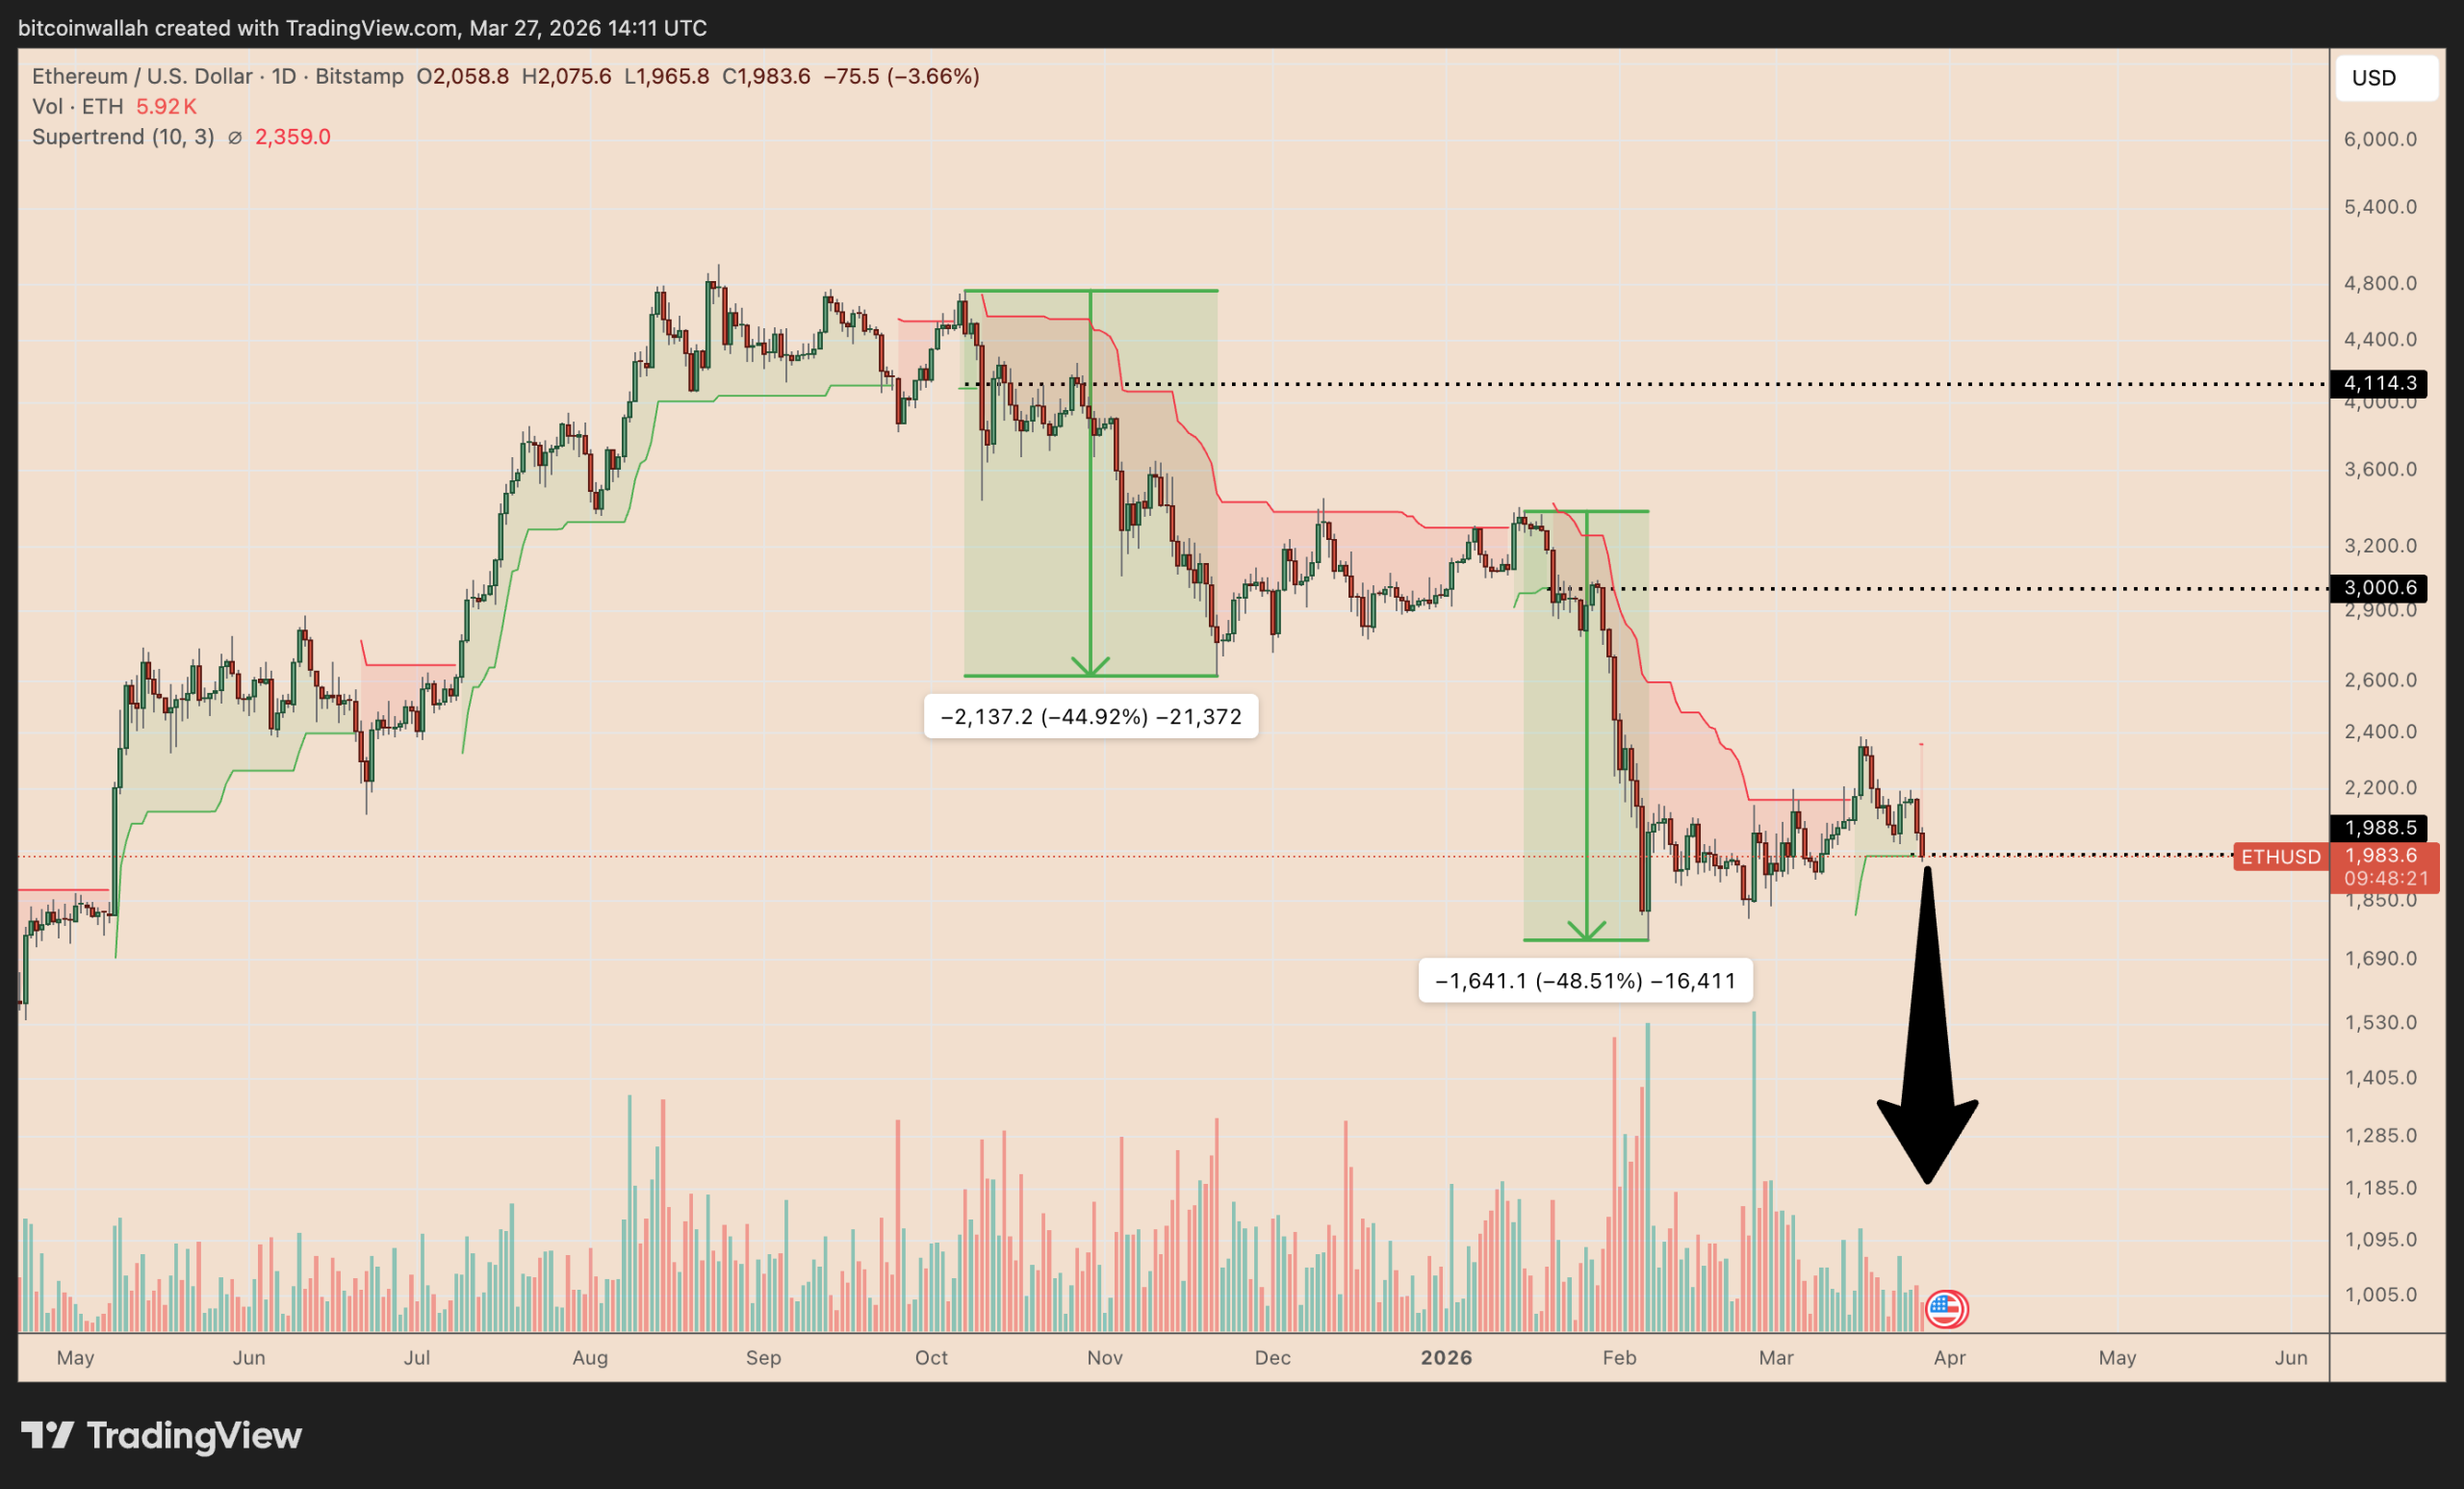
Ethereum’s $1,200 downside target comes from a Supertrend setup on the daily chart, where two earlier bullish flips failed and led to steep breakdowns.
The Supertrend is a simple trend-following line plotted directly on the price chart. It changes color to show the current market direction: green when the trend is rising and red when the trend is falling.
ETH flashed similar bullish flips in October 2025 and January 2026, but neither held.

In both cases, the price moved above the Supertrend’s upper band, which then started acting as support. Once ETH lost that support, the recovery unraveled and the price dropped 45% and 48%, respectively.
“Now the same setup is forming at $1,990,” said Leshka.eth, adding:
“If that level breaks, the next target is the $1,200 zone.”
That aligns with the measured downside target of Ethereum’s prevailing bear flag pattern, as shown below.

The bearish setups are taking shape as Ethereum gives back its March gains against a worsening macro backdrop.
Related: Ether traders see ‘further decline’ as ETH price slips below $2K
Risk appetite has weakened alongside the US–Israel and Iran war, recession fears have risen, and bond traders no longer expect the Fed to cut rates before December 2027.

ETH has fallen more than 17% from its monthly high from over two weeks ago. US spot Ether ETFs have seen roughly $300 million in net outflows over the same stretch.
The apparent demand for Ethereum has also slipped to its lowest in 16 months.
ETH holder accumulation remains weak
Ethereum’s latest rebound has not triggered broad-based accumulation across major wallet cohorts, Glassnode data shows.
For instance, the number of mega-whale wallets holding more than 10,000 ETH has flattened after peaking in late 2025, while the 30-day change has only just crawled back toward neutral after months of decline.

In other words, the biggest holders have not been accumulating aggressively.
The picture looks similar among smaller wallet cohorts.
Ethereum whales holding 1,000 to 10,000 ETH remain below their late-2025 highs, with the 30-day change hovering around flat to slightly negative levels.

Shark addresses holding 100 to 1,000 ETH also continue to trend well below last year’s peaks, suggesting that mid-sized and smaller large holders have not returned as strong buyers either.
Taken together, the data suggest ongoing distribution and weak conviction across key ETH holder cohorts, reinforcing the risk of a deeper drop if $1,990 breaks.
As Cointelegraph reported, one of the few bullish signs for Ethereum include the increasing amount of Ether staked and supply on exchanges falling to ten-year lows.
This article is produced in accordance with Cointelegraph’s Editorial Policy and is intended for informational purposes only. It does not constitute investment advice or recommendations. All investments and trades carry risk; readers are encouraged to conduct independent research before making any decisions. Cointelegraph makes no guarantees regarding the accuracy or completeness of the information presented, including forward-looking statements, and will not be liable for any loss or damage arising from reliance on this content.

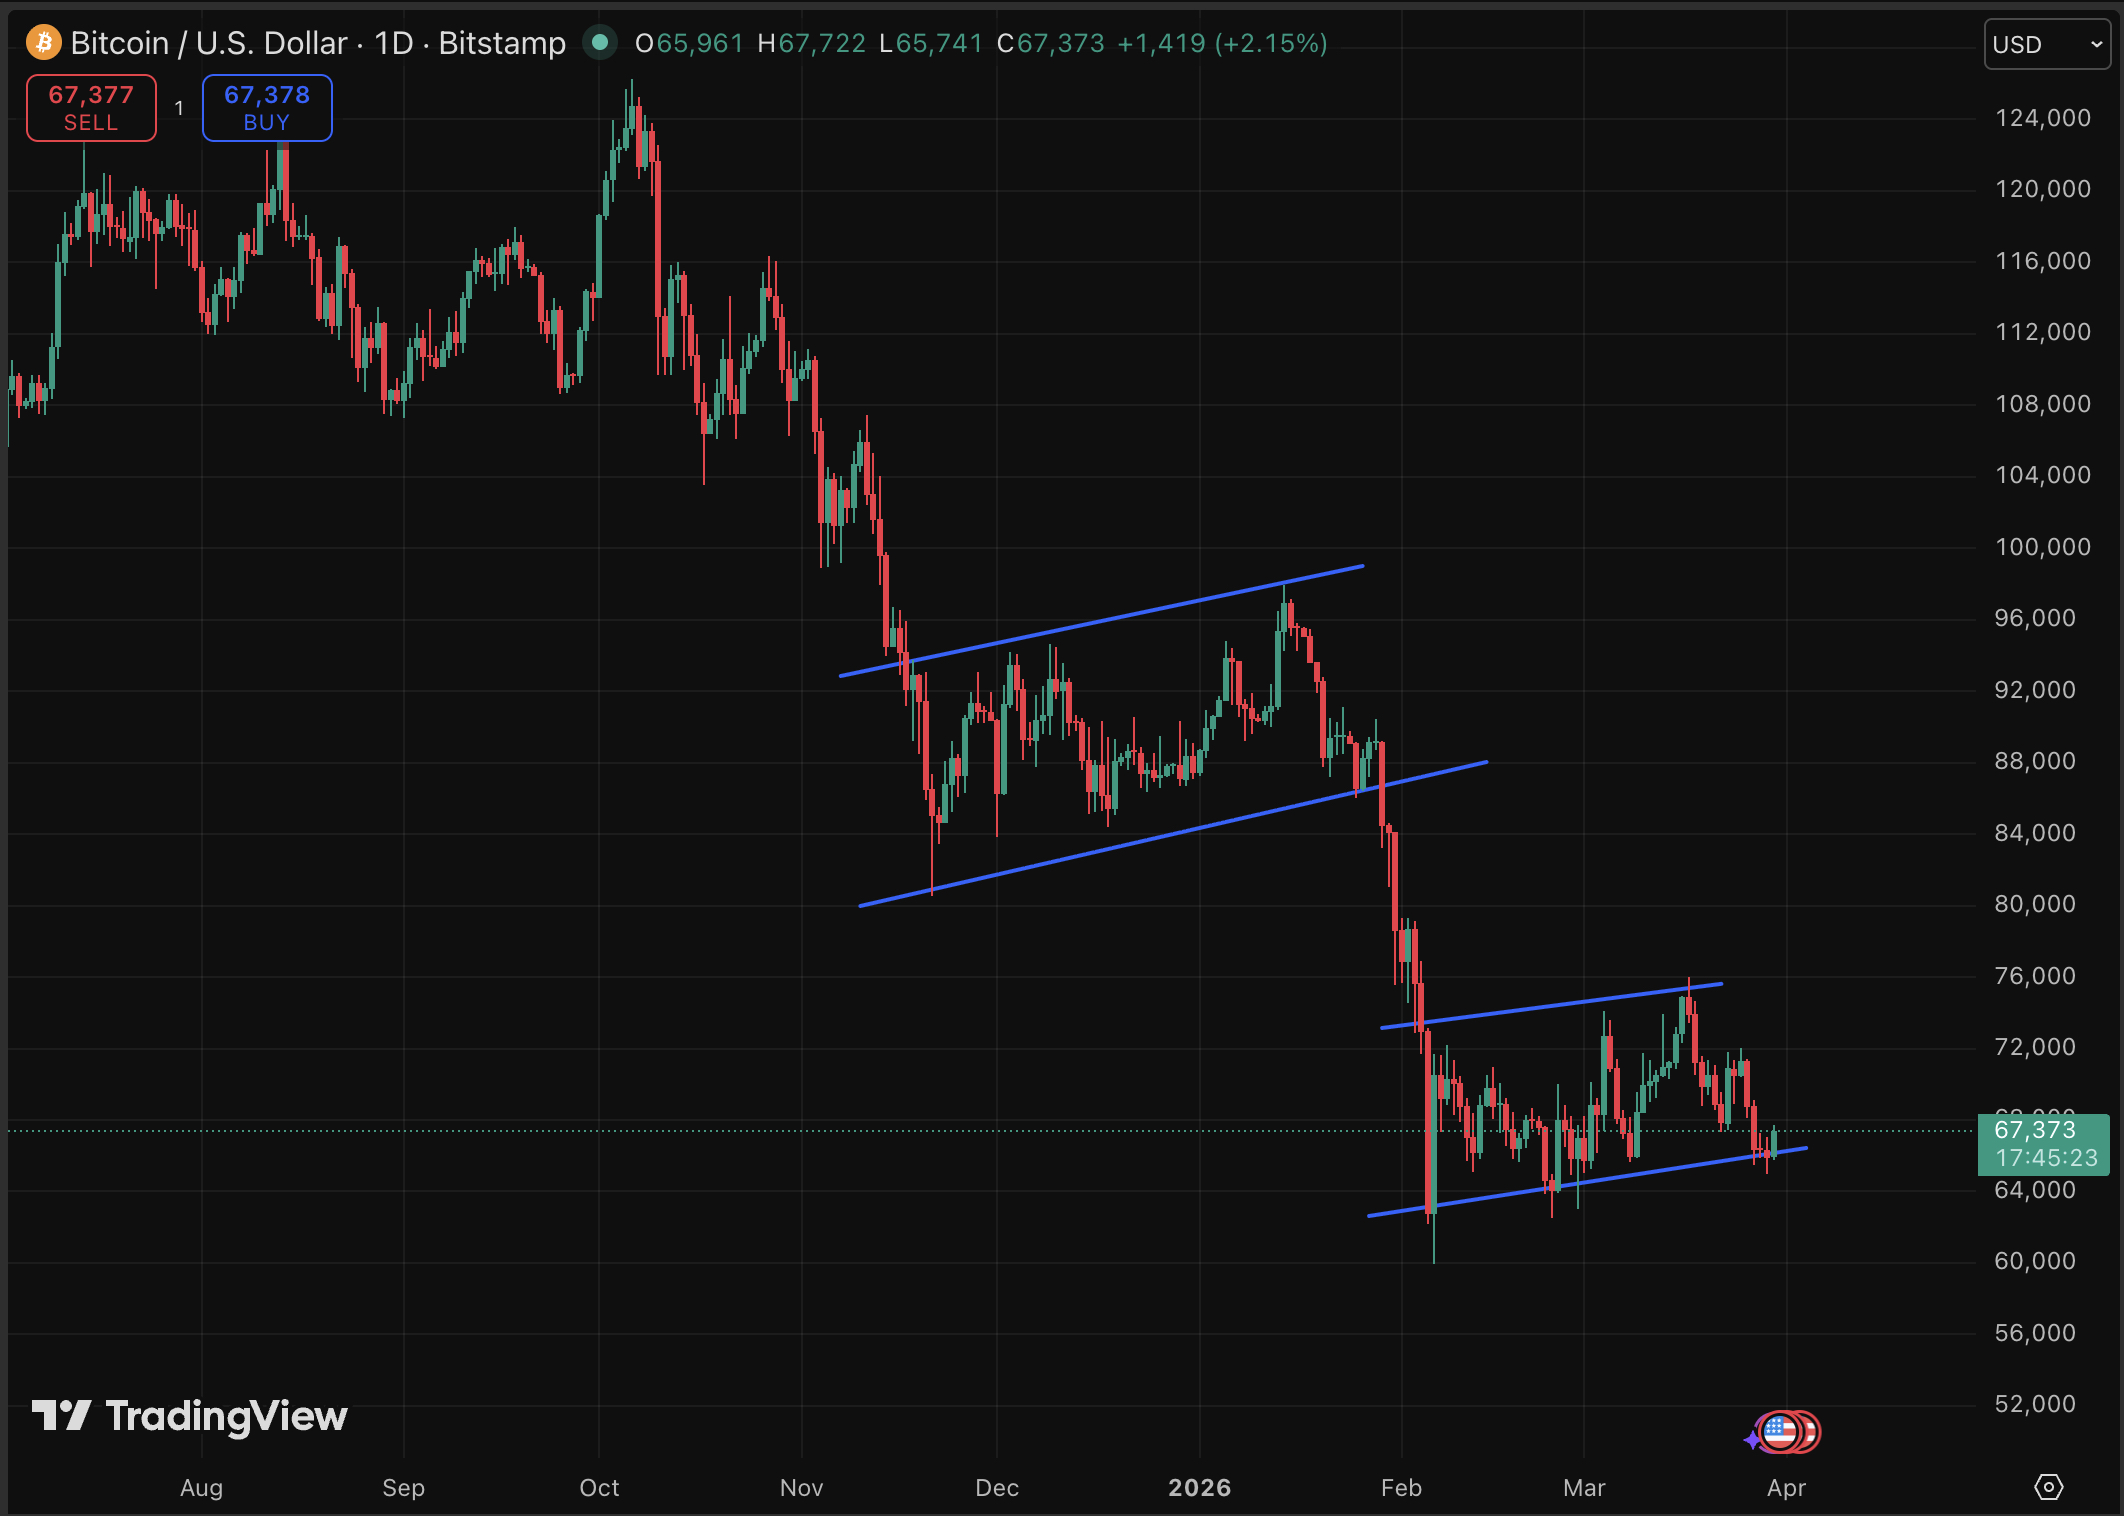
Why is Crypto Up? BTC just bounced above $67,000 from a $65,000 low, a 1.1% run on the day, clinging to gains that look thin against a backdrop of six consecutive red monthly closes.
March has been a grind. Bitcoin ranged from $65,000 on March 2 to a high of $75,000 on March 17, before sliding back to $68,000 by March 23 as U.S.-Iran geopolitical tensions amplified sell pressure. A record $14+ billion in options expiry compounded the volatility, forcing liquidations across the board.
Robinhood’s prediction market for BTC price shows contract activity concentrated at sub-$57,300 levels, a quiet but telling signal of where crowd sentiment actually sits. ETF inflows remain a counterweight, but geopolitical risk is winning the narrative for now. That tension between institutional demand and macro fear sets up a price structure that deserves close attention.
Discover: The best crypto to diversify your portfolio with
Really, Why is Crypto Up? Can Bitcoin Break $120K or Is This A Dead Cat Bounce?
At $67,000, Bitcoin holds a 2.5% gain over 30 days, a move that looks impressive until you stack it against the six red months. The short-term picture is murkier. The March low at $65,000 end of last week, driven by tension-led selling, now serves as the key structural support.
Resistance sits at the $74,400 March high, with it also acting as the psychological ceiling that traders are watching in real time.
Momentum is consolidating rather than accelerating. Volume has not confirmed the weekly uptick, and the slight intraday jump suggests buyers aren’t pressing hard. Rising Treasury yields continue to drain risk appetite, capping upside for speculative assets across the board.
#BTC is showing a key structural signal: — KriptoHolder
Price is rising while Open Interest is declining.
This indicates that the move is not driven by new long positions, but by short liquidations.
• Short squeeze is active
• The market is moving up by clearing out short positions
• Spot… https://t.co/iguy1aboCc pic.twitter.com/KwWEk78NYo
 (@kriptoholder) March 30, 2026
Three scenarios are in play. BTC could hold above $65,000 into the weekly close, ETF flows accelerate, and a push back toward $72,000 becomes viable within days. A rangebound chop between $65,000 and $68,000 could also persist through April as macro uncertainty lingers. But a daily close below $69,000 would invalidate the near-term bullish structure entirely, reopening a retest of March lows.
Extreme Fear sentiment, as flagged by multiple analysts, remains a drag that technical levels alone cannot override.
Discover: The best pre-launch token sales
LiquidChain Targets Early-Mover Upside as Bitcoin Tests Key Levels
Six red months compress capital and patience simultaneously. Traders holding blue-chip positions through this drawdown are questioning whether the next leg up rewards spot holders or whether early-stage infrastructure plays capture more asymmetric upside at this point in the cycle.
LiquidChain ($LIQUID) is a Layer 3 infrastructure project positioning itself as the cross-chain liquidity layer, fusing Bitcoin, Ethereum, and Solana liquidity into a single execution environment. Developers deploy once and access all three ecosystems through a Unified Liquidity Layer, Single-Step Execution, and Verifiable Settlement architecture.
A new layer emerges. Only a few see it first. — LiquidChain (@getliquidchain) March 24, 2026
The future is LiquidChain  ⟁https://t.co/vqvBcdSj94 pic.twitter.com/R7ZeZ0NPGl
That’s a direct response to the fragmentation that makes cross-chain DeFi unnecessarily expensive and slow. The presale is priced at $0.0144, with more than $600K raised to date, early-stage by any measure, especially with 1700% APY rewards as a bonus.
For traders navigating a market that keeps delivering red closes, researching LiquidChain may be worth the time before the presale price moves.
This article is not financial advice. Crypto assets are highly volatile. Always conduct your own research before investing.
The post Why Is Crypto Up? Six Straight Red Months Despite Today’s Bounce appeared first on Cryptonews.


Prediction market usage hit record levels in March, supported by improved accessibility and favourable regulatory developments amid rising interest in political and geopolitical event contracts.
Summary
- Prediction market transactions crossed 191 million in March, with trading volume rising to about $23.9 billion, reflecting a sharp jump from last year.
- Geopolitical and macroeconomic events now drive most activity, while crypto-related markets account for a smaller share of overall trading.
According to a report published by TRM Labs, the prediction market sector has expanded rapidly as Google Finance integrations and increased visibility of live odds across mainstream media.
Prediction markets are platforms that allow users to trade on the outcomes of future events by buying and selling contracts tied to real-world developments.
These markets are now being “increasingly used as real-time indicators of geopolitical and macroeconomic events,” TRM Labs said, adding that their growth has been supported by improved accessibility, evolving regulatory clarity, and integration with mainstream platforms.
Data from Dune Analytics shows that the total number of transactions hit over 191 million in March so far, marking an increase of more than 2,800% from the same period last year.
Meanwhile, monthly notional trading volume stood at roughly $23.9 billion in March, up from $1.9 billion at the same time last year, but still below January’s all-time high by about 12%.
Monthly unique wallets also tripled to around 840,000 by February 2026, a trend that reflects what TRM described as “a broad expansion of the participant base,” rather than just larger bets from existing users.
Much of this activity is being driven by geopolitical events and macroeconomic developments, according to TRM Labs, which now dominate trading volumes across platforms.
“Crypto-native topics, while prevalent, now represent a smaller share of overall activity,” the report added.
On Polymarket, the highest-volume contracts as of Monday were centered on U.S. political outcomes, including party nominations for the 2028 presidential race, and geopolitical questions such as whether Israeli Prime Minister Benjamin Netanyahu will remain in office through year-end.
Growth in the sector has been accompanied by increased scrutiny, with Kalshi and Polymarket facing concerns tied to insider trading and compliance with state gambling laws.
Several U.S. states have launched enforcement actions, arguing that certain event-based contracts resemble unlicensed betting products under local regulations.
How platforms navigate these regulatory challenges and concerns around market integrity will shape the future growth of the sector, according to TRM Labs.
Polymarket and Kalshi have already announced measures to introduce trading guardrails and strengthen market integrity, but the broader regulatory outlook remains unresolved for now.

The bitcoin market has been stuck in a rut for over a month, and investors chasing yields may be partly to blame.
Since mid-February, BTC has traded in a range centred on $70,000. Some observers say counteracting forces have been at play. The Iran war-led haven demand has been supporting BTC around $65,000, while rising U.S. Treasury yields have been holding back big gains beyond $75,000.
But another factor appears to have been quietly keeping bitcoin trapped in its range, and it’s tied to investors using call options to generate additional yield on top of their spot market holdings.
“Throughout Q1, institutional participants have been systematically overwriting calls at higher strikes to harvest premium in a down/sideways market. That activity transferred significant gamma exposure to dealers, who have been hedging by buying into dips and selling into rallies to maintain delta neutrality,” James Harris, CEO at Tesseract, the MiCA-licensed, multi-strategy digital asset manager.
Options are derivative contracts that give you the right to buy or sell the underlying asset, in this case, BTC, at a preset price at a later date. A call option gives the right to buy and represents a bullish market bet. A put option offers protection against price slides in BTC.
Think of it like reserving a concert ticket today for a small fee. You can buy it later at the reserved price, even if the ticket goes up, or sell your reservation to someone else for a profit. The ticket seller, meanwhile, keeps the small fee.
That’s essentially what traders have been doing—they’ve become the ticket sellers. By selling call options, they collect premiums (the fee) while covering the call buyer on potential BTC price rallies. And they do this against their existing bitcoin holdings. That’s called the covered call strategy, a way of generating additional yield on top of spot holdings.
Now you might be wondering: what does this have to do with bitcoin’s range play? The answer lies in knowing that traders have been shorting, or selling, these calls to market makers – the firms that take the other side of these option trades.
By selling these calls, traders have left market makers with a position called positive gamma, which essentially means the market makers are forced to buy BTC as prices fall and sell BTC as prices rise to stay hedged. The result? A range-bound price action.
In other words, yield hunting by investors has been indirectly influencing market inflows in ways that limit price swings.
This also explains the decline in the bitcoin 30-day implied volatility index, BVIV, which stands in contrast to spikes in similar indices tied to equities, bonds and oil. The BVIV has declined 5% to 56% this month.
“The effect has been a mechanical suppression of realised volatility — the DVOL index has compressed by roughly six points this week despite the macro backdrop,” Harris said.
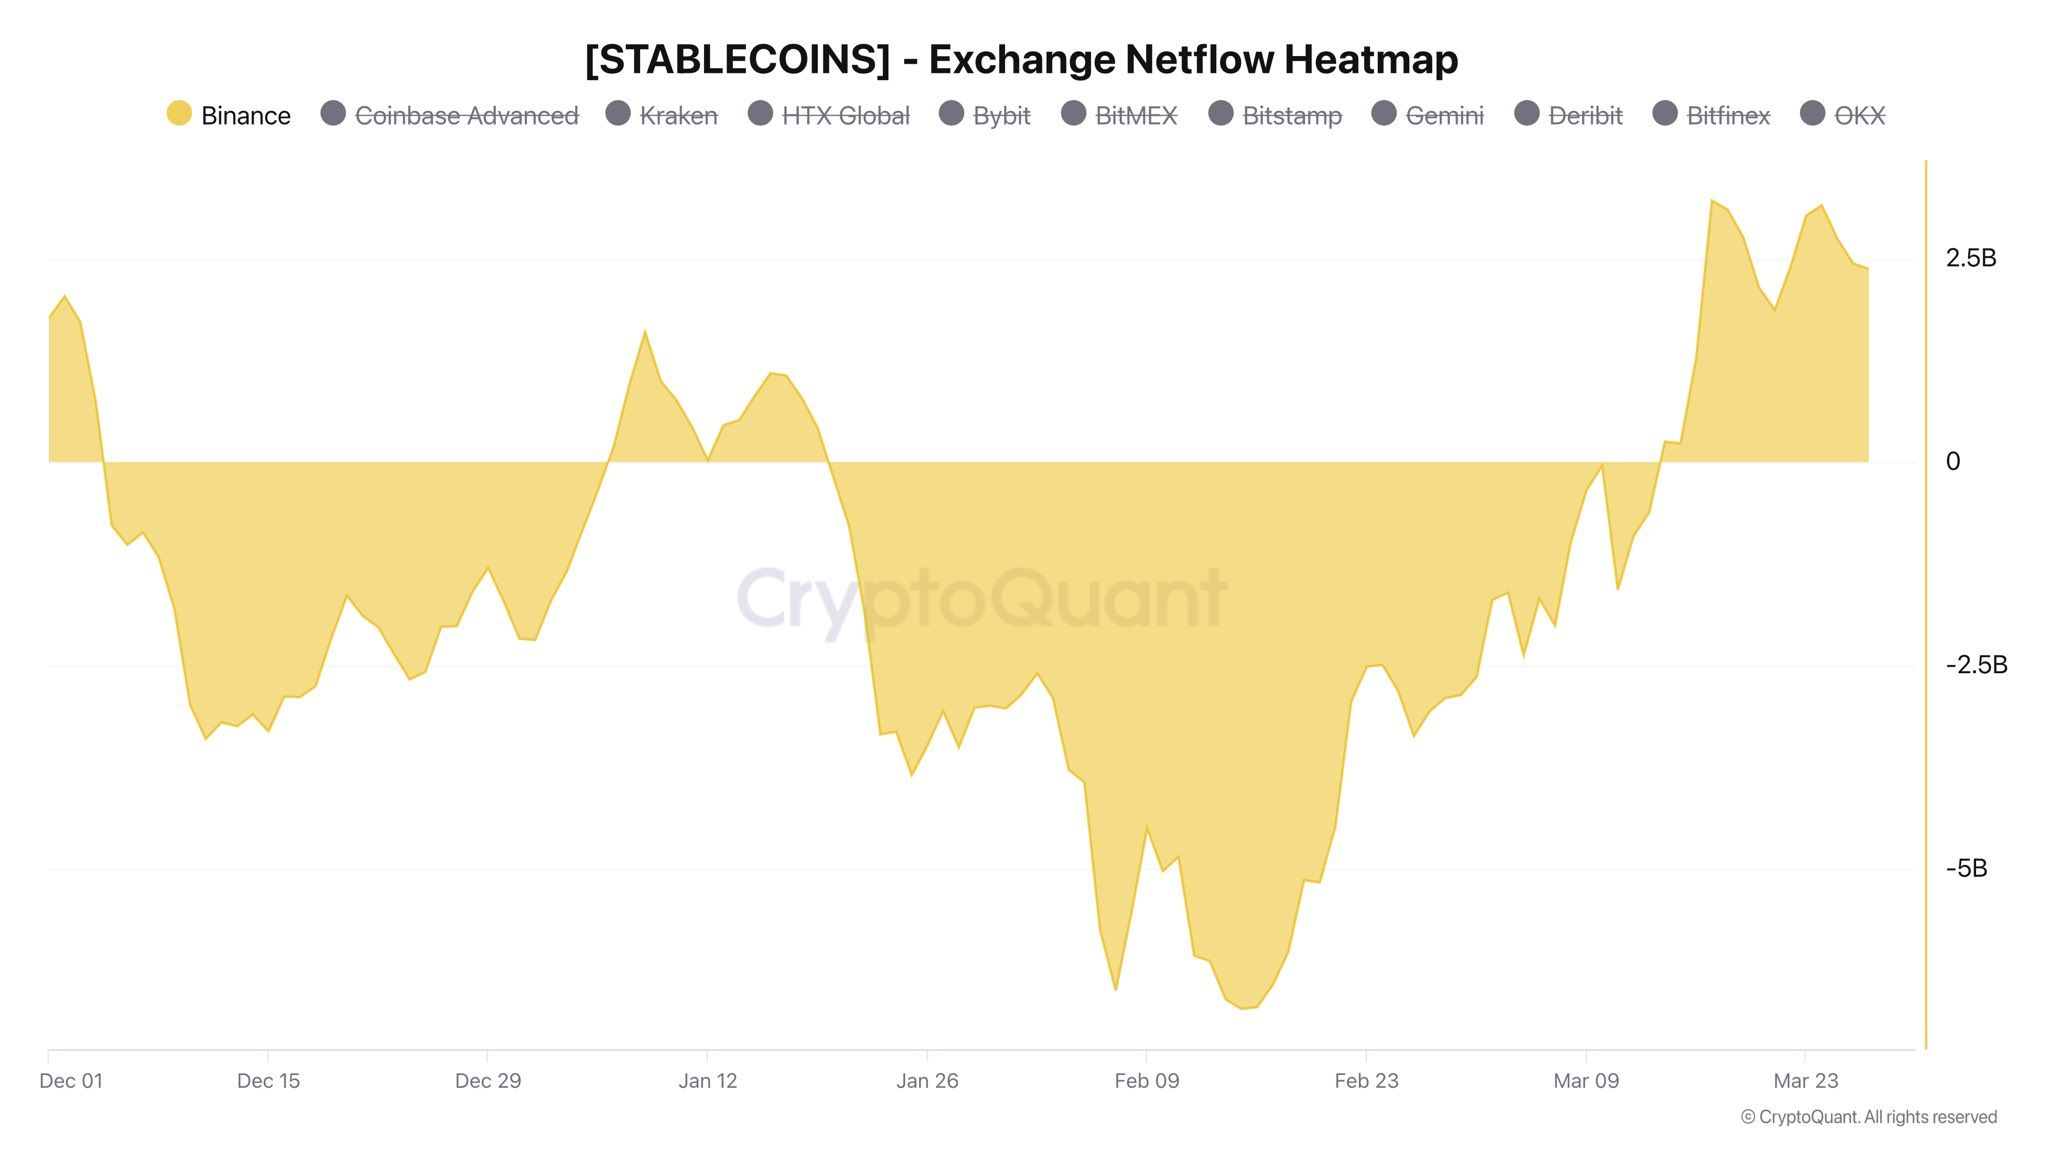
Stablecoin netflows on Binance have turned positive, marking a notable shift in market liquidity.
Analyst Darkfost noted that the exchange, which consistently leads global crypto trading volumes, has moved from recording net stablecoin outflows to net inflows of $2.4 billion.
The reversal follows earlier periods of heavy withdrawals, including $3.4 billion on December 11 and $6.7 billion on February 15.
Follow us on X to get the latest news as it happens
Liquidity Is Back on Binance, but Where Are the Traders?
Stablecoins are widely viewed as deployable capital within the crypto ecosystem, and inflows to exchanges often indicate that traders are preparing to enter positions. However, actual spot trading activity tells a very different story.
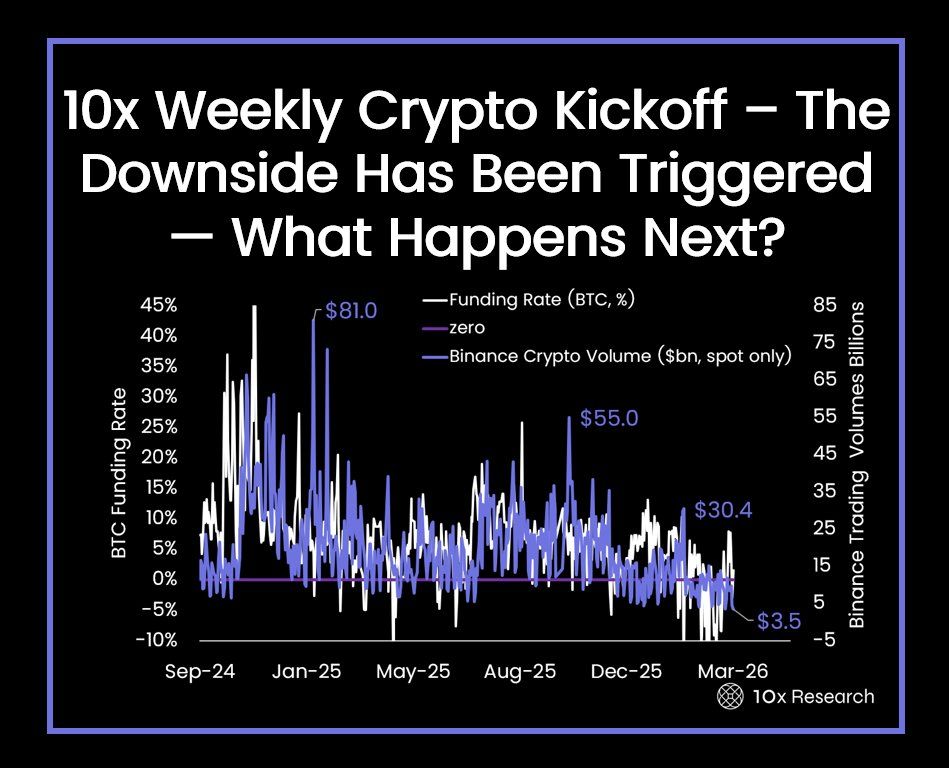
Research firm 10x Research flagged that spot trading volume on Binance has fallen considerably since the beginning of 2025, dropping from $81 billion to just $3.5 billion.
This creates a notable disconnect. Investors are moving stablecoins onto exchanges, yet they are not converting that capital into positions. In effect, liquidity is building, but risk appetite has yet to follow.
“Liquidity support is fading, and as a new gamma profile takes shape, a move through key levels could amplify volatility and trigger outsized price reactions. This is not a market to be complacent in; low liquidation activity and weak volumes mask underlying fragility,” the analysts wrote.
The stance comes amid rising geopolitical tensions and mounting macroeconomic concerns over a potential recession. The ongoing US-Israel war involving Iran has rattled markets, sending oil prices sharply higher while putting pressure on equities.
“The crypto market is not spared, even though it has shown relative resilience over the past few weeks,” Darkfost said.
Thus, the shift from heavy outflows to renewed inflows suggests that capital is re-entering the market. However, until trading activity picks up, the data points to a market defined more by caution than conviction.
Subscribe to our YouTube channel to watch leaders and journalists provide expert insights
The post $2.4 Billion Stablecoin Inflows Hit Binance, But Traders Stay on the Sidelines appeared first on BeInCrypto.
Invesco SteelPath MLP Alpha Fund Q4 2025 Commentary (MLPAX)
Aave Expands to OKX’s X Layer: DeFi Lending Arrives on Ethereum L2 Network
7 Upcoming Romance Shows That You Cannot Miss

Smart energy pays enters the US market, targeting scalable financial infrastructure

Why Israel is blocking foreign journalists from entering

Bitcoin: We’re Entering The Most Dangerous Phase

How Much Money Does He Make Flipping This Mercedes? #shorts #reselling #flipping #money

“This time it’s yo’ money”: Trump’s signature to be added to U.S. paper currency

How and WHAT to invest in! #investing #stockmarket #money #finance #recession #inflation #wallstreet
-
 NewsBeat5 days ago
Manchester United reach agreement with Casemiro over contract clause amid transfer speculation
-

 News Videos4 days ago
Parliament publishes latest register of MPs’ financial interests
-

 Sports7 days ago
Gary Kirsten Accuses Pakistan Cricket Board Of ‘Interference’, Mohsin Naqvi Responds
-

 Sports7 days ago
Remo Stars and Kano Pillars Strengthen Survival Hopes in NPFL
-

 NewsBeat2 days ago
The Story hosts event on Durham’s historic registers
-

 Business3 days ago
Instagram, YouTube Found Responsible for Teen’s Mental Health Struggle in Historic Ruling
-

 News Videos7 days ago
Ch 9 Financial Management Part 1 | Detailed One Shot | Class 12 Business Studies Boards 2026
-
 NewsBeat5 days ago
Tesco is selling new Cadbury Dairy Milk bar and people can’t wait to try it
-
 Entertainment7 days ago
Cynthia Bailey Dishes on ‘RHOA’ Season 17, Discusses Kandi
-

 Tech6 days ago
Samsung will soon let you control smart home devices from your car’s dashboard
-
 Entertainment1 day ago
Lana Del Rey Celebrates Her Husband’s 51st Birthday In New Post
-
 NewsBeat7 days ago
Colombian military plane with 110 soldiers onboard crashes following takeoff
-

 Business6 days ago
More women enter wealth management, but few in advisory roles: study
-

 Fashion6 days ago
Does It Matter What You Wear When You’re Laid Off and Looking?
-

 Fashion7 days ago
Fringe Bags for the Season
-

 NewsBeat5 days ago
Entrepreneurs Forum survey reveals optimism in North East
-

 Business6 days ago
Late-paying firms face multimillion-pound fines under new crackdown
-

 Politics6 days ago
How Media Platforms Balance Performance and Accessibility in Image Delivery
-

 Sports5 days ago
Fantasy Baseball Week 1 Preview: Top sleeper hitters for both five- and 12-day period led by Munetaka Murakami
-
 NewsBeat6 days ago
NASA Artemis II Astronauts enter 14-Day quarantine as moon rocket reaches launchpad
You must be logged in to post a comment Login