Crypto World
Bitcoin price faces $85,000 resistance as oscillator turns negative

Bitcoin price traded near $84,000 on Sep. 26 after retreating about 4% from its weekly high of $87,363. Sell orders clustered above the price, while the daily chart showed BTC holding well above its 20-day midpoint.
Summary
- Bitcoin price traded at $84,008 on Binance at 07:07 UTC, about 3.8% below its weekly high.
- Analysts identified $85,000–$85,800 as the first area of heavy sell orders.
- The 4-hour Supertrend stood at $86,435, above the current price.
- U.S. spot Bitcoin ETFs recorded about $2.39 billion in net inflows from Sep. 21 to Sep. 25
Bitcoin faces sell orders from $85,000 to $85,800
Bitcoin (BTC) price rose to $87,363 earlier in the week before falling back toward $84,000. On Sep. 26, its Binance daily candle showed a high of $84,145 and a low of $83,798 as of 07:07 UTC. The roughly $347 intraday range was much smaller than the move from the weekly peak.
Market commentator Wealthmanager identified a band of sell orders extending from $85,000 to $91,000. The analyst placed the first hurdle at $85,000–$85,800, followed by $88,000, and described $90,000 as the largest wall above the market.
Mister Crypto also identified $85,000 as the level limiting Bitcoin’s recent rebounds. The analyst said a continued stretch below it could precede another decline, while Wealthmanager pointed to $81,000–$82,000 as a possible pullback area if BTC fails to regain $85,000.
Bitcoin would need to climb about $1,000 from the charted price to retest the lower edge of that first sell zone. A move through $85,800 would bring the 4-hour Supertrend level and the weekly high back into focus. The analysts’ order-book readings may change as traders add, fill, or cancel orders.
The drop from $87,363 also followed a sharp gain earlier in the week. CoinGecko showed Bitcoin still higher over seven days on Sep. 26, despite its retreat from the peak. The weekly gain and the decline from the high measure different parts of the same move.
U.S. Bitcoin ETF inflows slow but stay positive
U.S. spot Bitcoin ETFs drew their largest inflow of the week as BTC approached its high. Farside Investors recorded $999 million in net inflows on Sep. 21, including $381.4 million for BlackRock’s IBIT, $289.1 million for ARK 21Shares’ ARKB and $238.8 million for Fidelity’s FBTC.
Net inflows reached another $714.7 million on Sep. 22. IBIT received $350.3 million, and FBTC drew $257.4 million that day. Across the two sessions, U.S. spot Bitcoin ETFs took in about $1.71 billion.
Daily inflows then eased to $346.9 million on Sep. 23, $190.7 million on Sep. 24 and $134.5 million on Sep. 25. The five trading days added up to approximately $2.39 billion in net inflows. Friday’s figure was $864.5 million below Monday’s, but it remained positive as Bitcoin traded below its weekly high.
The Friday total included $97 million for IBIT and $49.3 million for FBTC, partly offset by an $11.8 million outflow from Bitwise’s BITB. U.S. funds will not post a Saturday trading-day flow figure to match Bitcoin’s weekend price action.
U.S. interest rates remain part of the market backdrop. The Federal Reserve raised its target range by 25 basis points to 3.75%–4% on Sep. 16. The rate decision came before this week’s price high and pullback; the ETF figures show that fund inflows continued during the retreat.
Bitcoin’s 4-hour Supertrend turns $86,435 into resistance
On the Binance 4-hour chart, Bitcoin traded at $84,007.73 while the Supertrend stood at $86,434.95. BTC had moved below the indicator after its run toward $87,000. The gap left the Supertrend about $2,427 above the charted price.
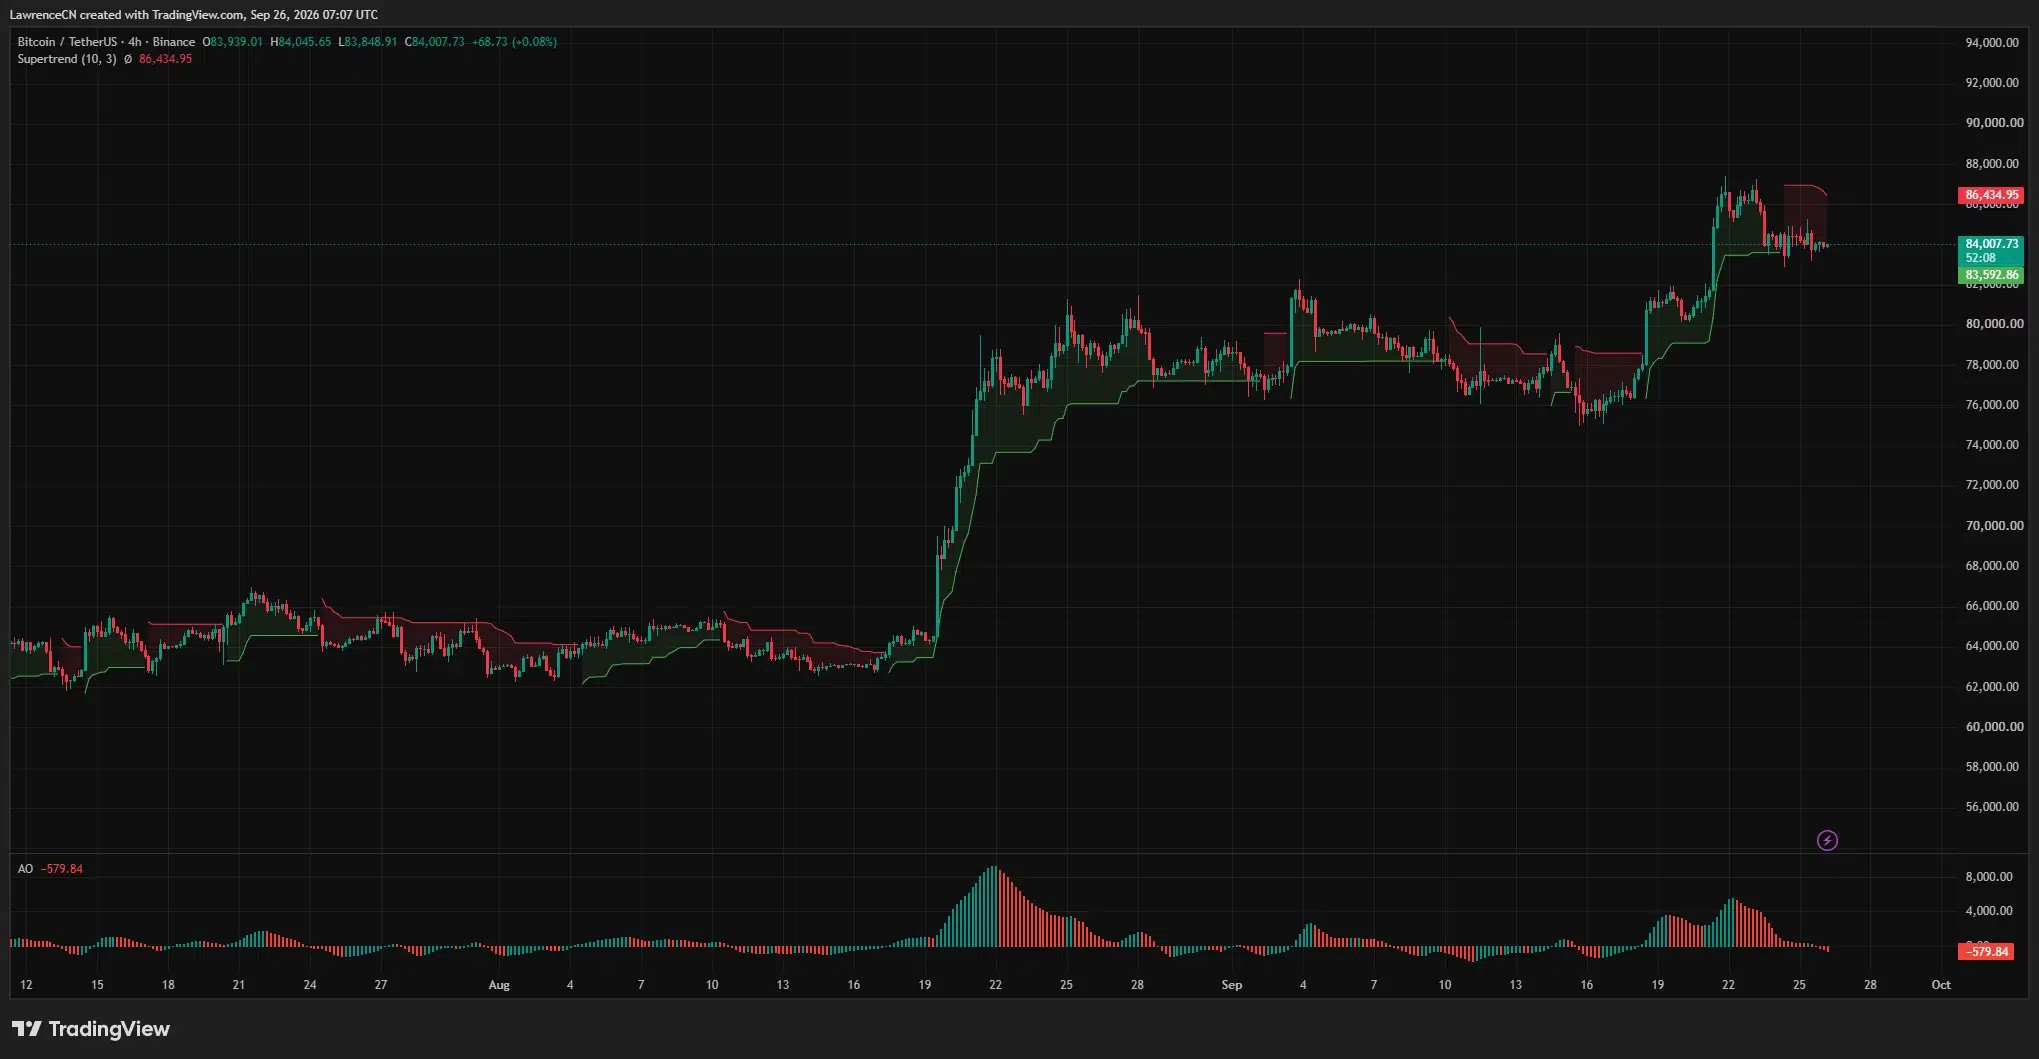

The same chart showed a green support line at $83,592.86, about $415 below BTC. Price had held near $84,000 after falling from the weekly peak, placing that support line close to the lower edge of its latest range.
Bitcoin’s 4-hour Awesome Oscillator read −579.84. The histogram had crossed below zero as its earlier positive bars faded. Together with the Supertrend position, the reading showed weaker momentum on the shorter timeframe than on the daily chart.
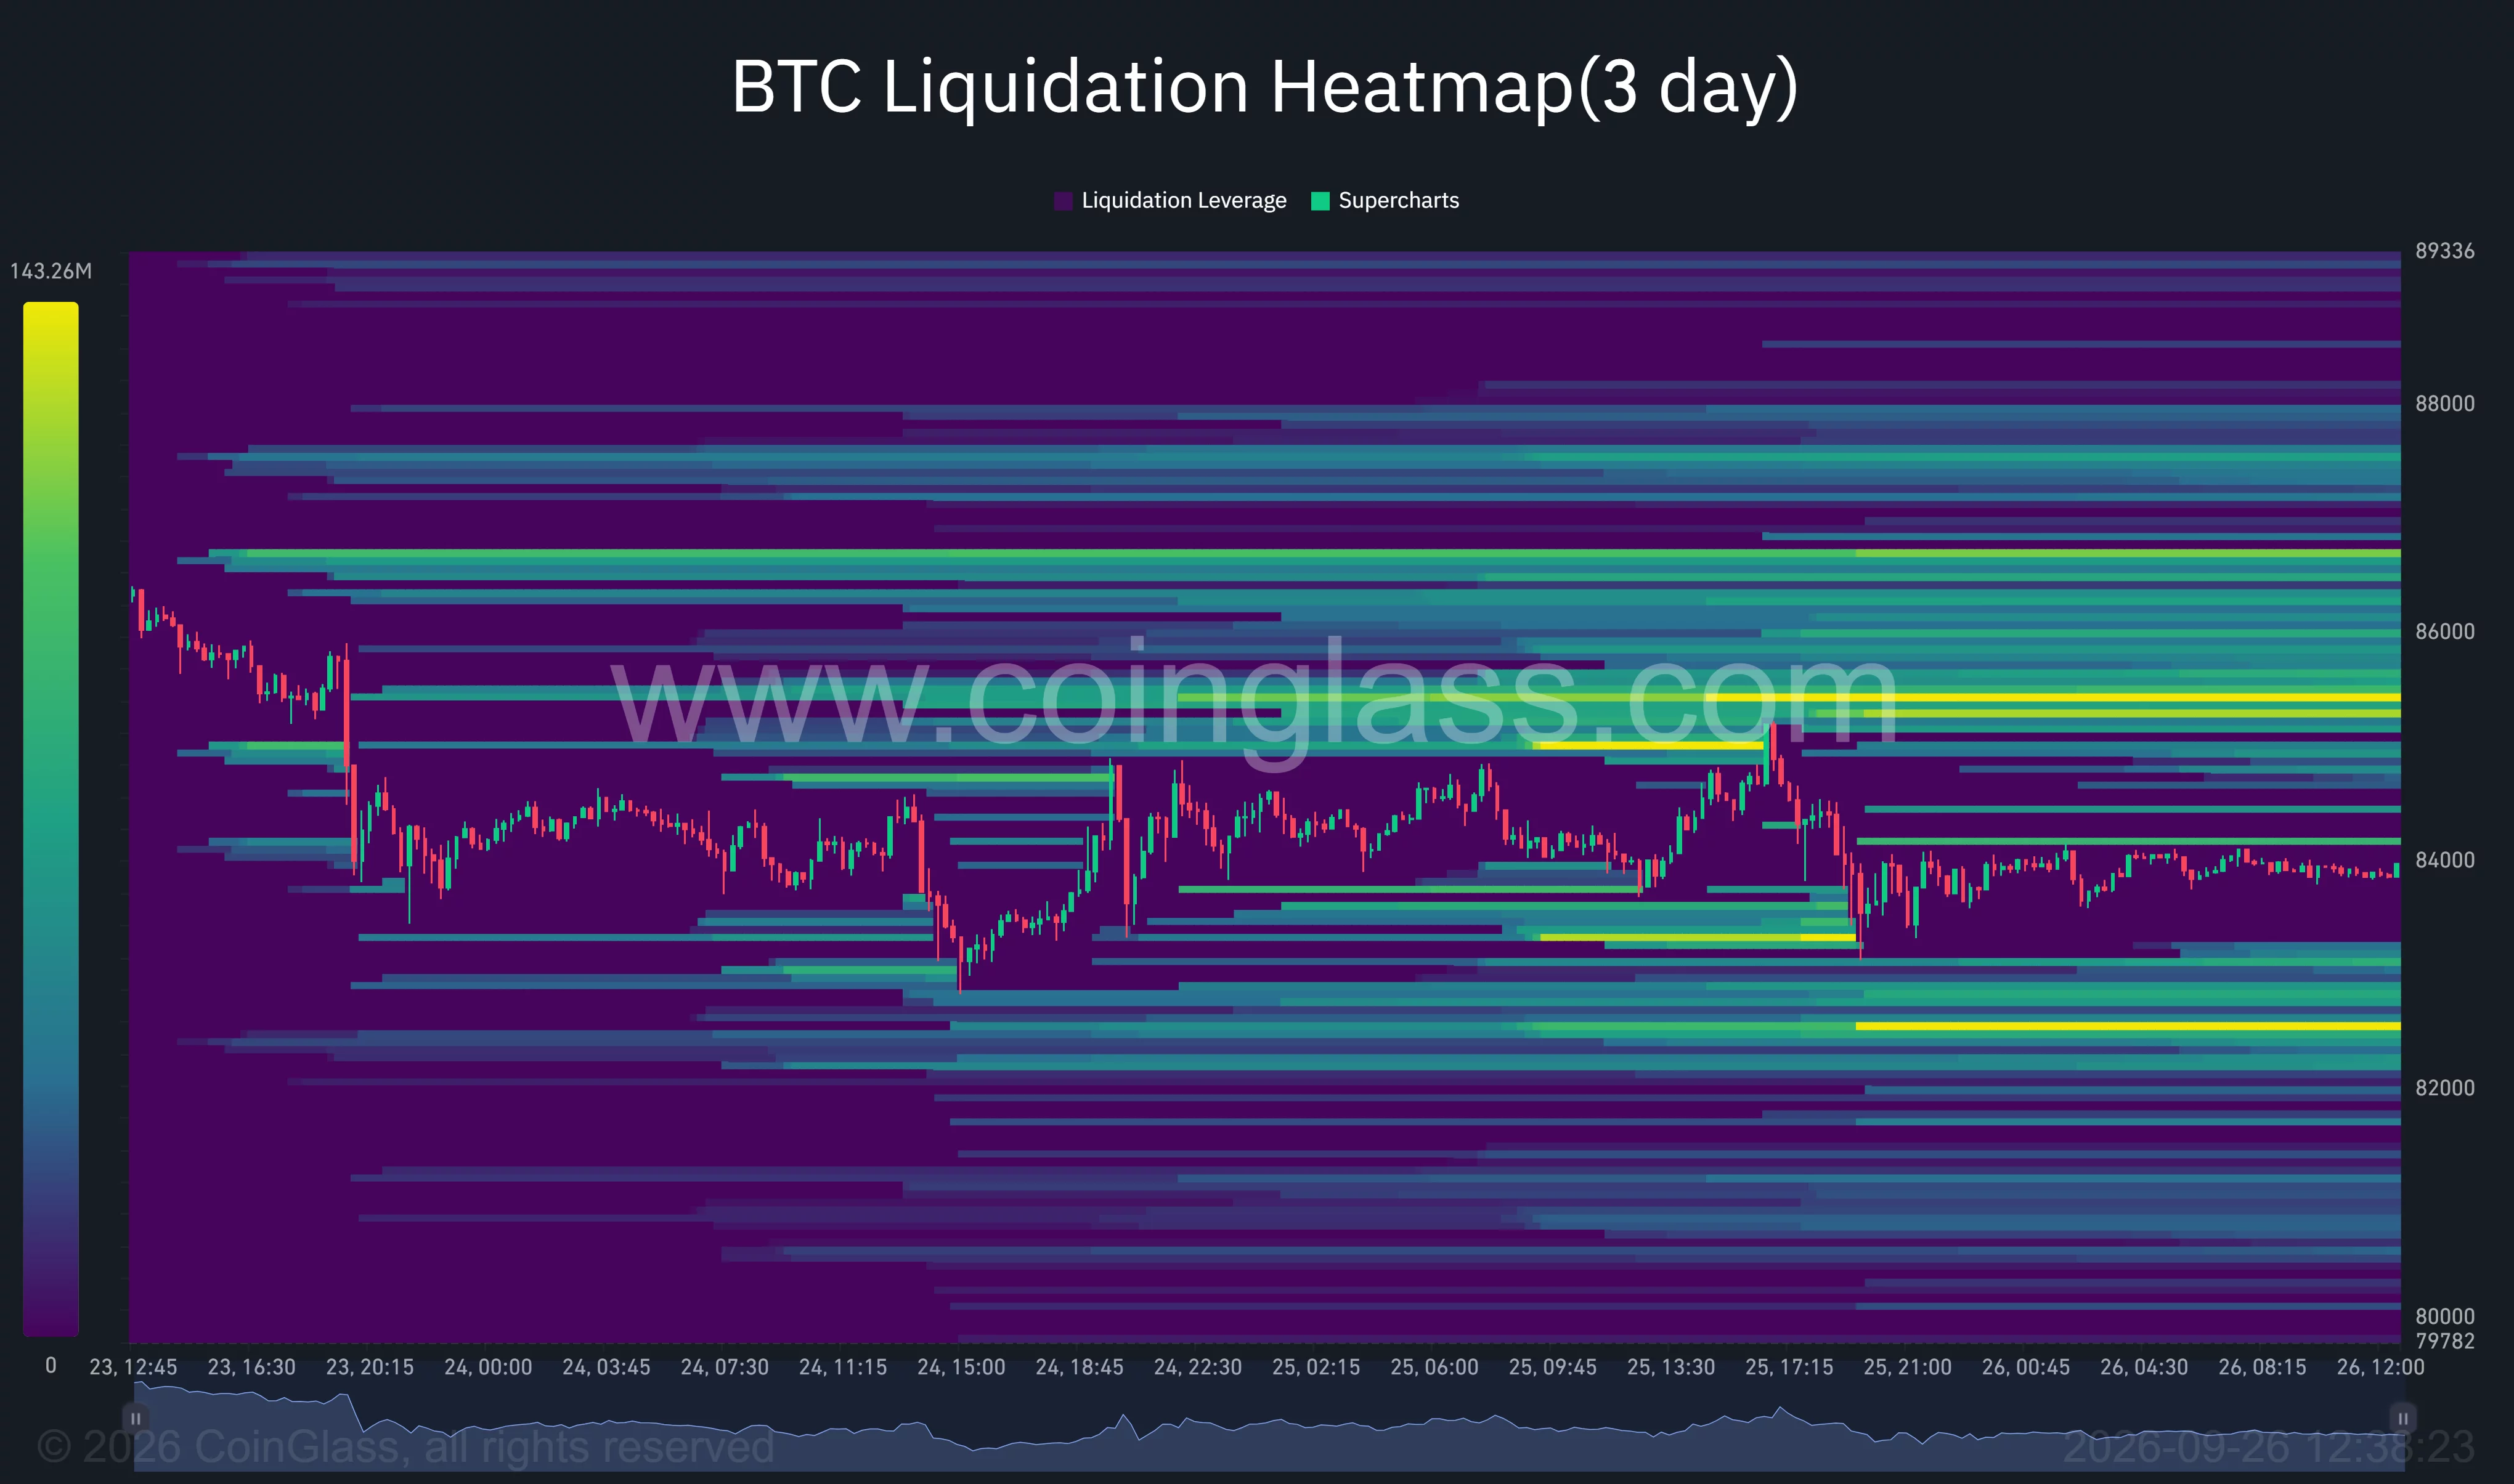
CoinGlass’s three-day liquidation heatmap showed a bright band around $85,000–$85,500, near the sell zone identified by the analysts. Another area of elevated estimated liquidation exposure appeared around $86,500–$87,000. Below the market, a prominent band sat near $82,500, with additional exposure around $83,000–$83,500.
The heatmap places the nearest large concentrations on both sides of Bitcoin’s $84,000 trading area. The bands reflect estimated liquidation levels for leveraged positions. They can shift as positions open and close, so their presence alone does not determine which level price will reach first.
Daily RSI holds above 60 after the pullback
Bitcoin’s daily chart retained stronger readings than its 4-hour chart. The daily relative strength index stood at 63.94, above its moving average of 61.27. RSI remained above the neutral 50 level and below the commonly watched 70 level.
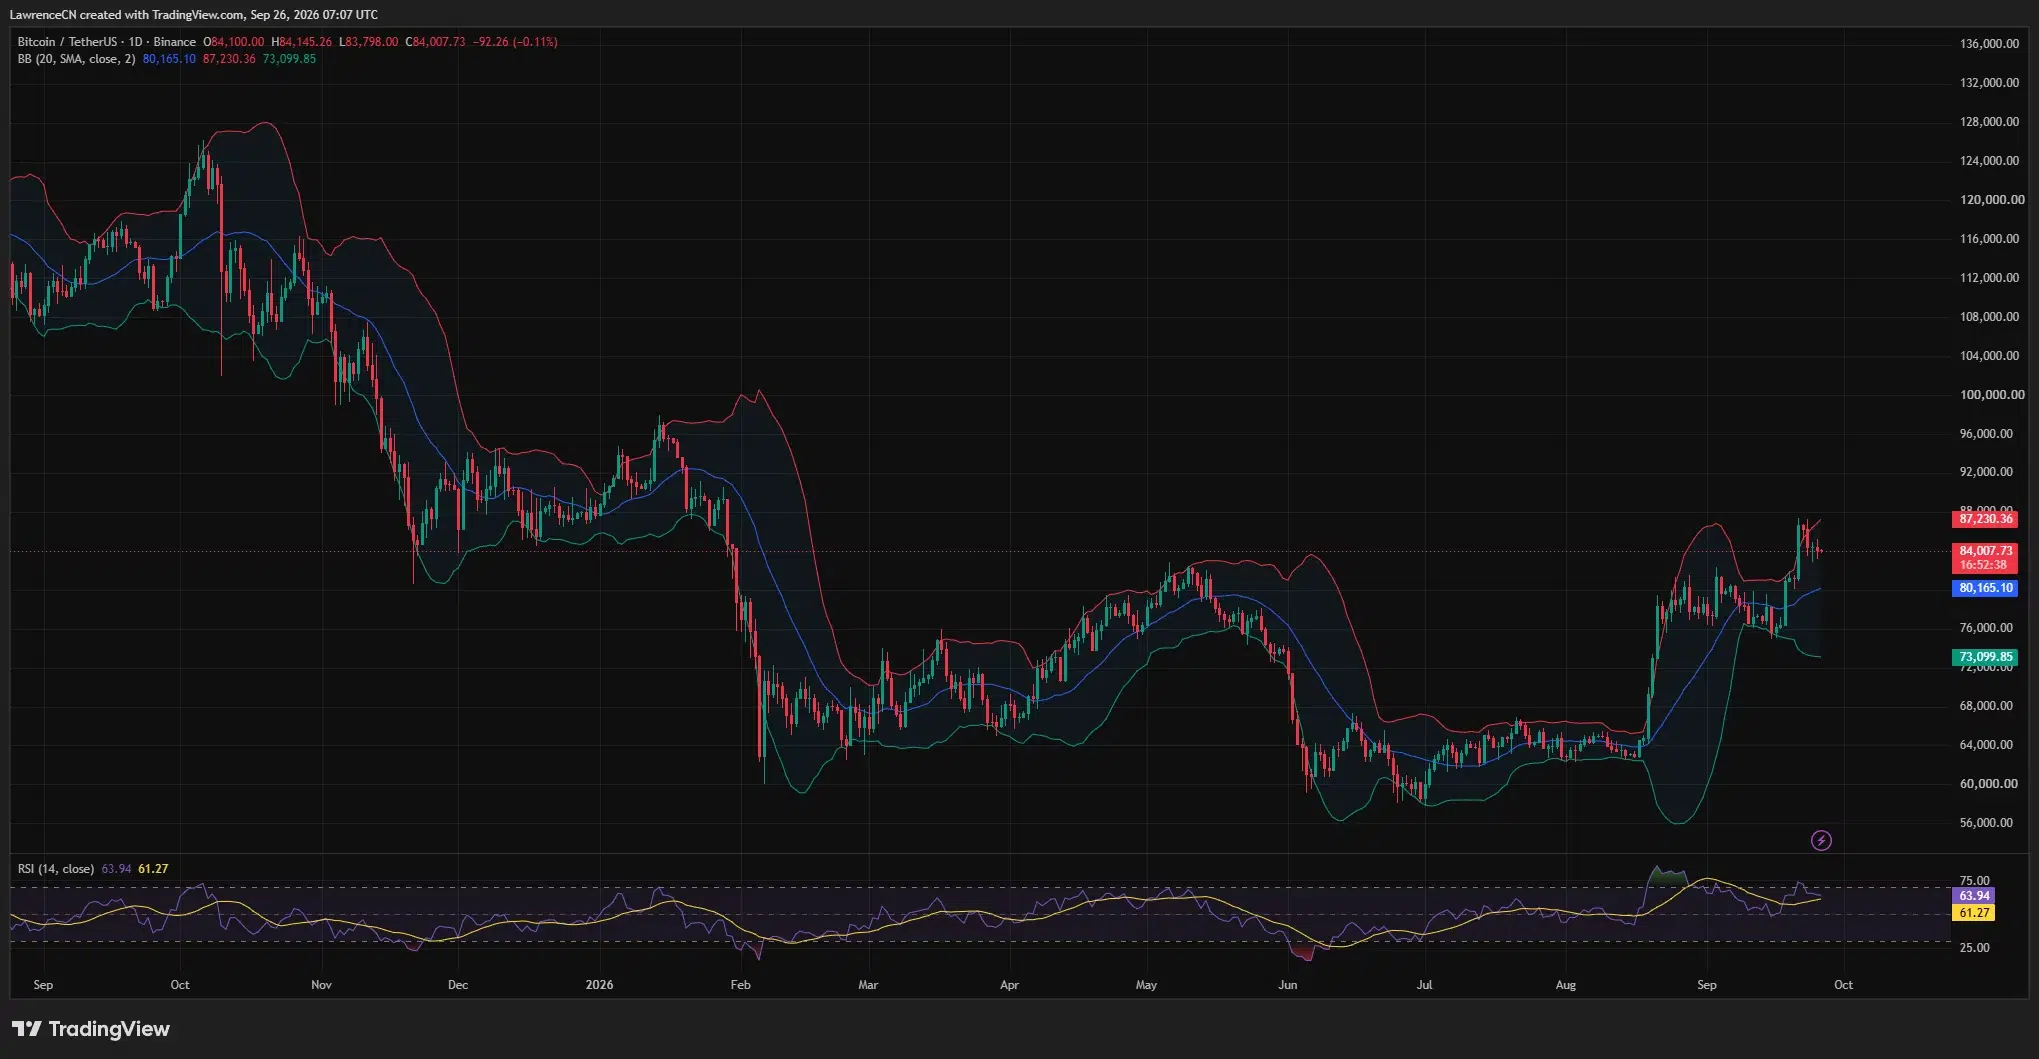
The middle line of the daily 20-period Bollinger Bands stood at $80,165.10. BTC traded roughly $3,843 above it at the charted price. The upper band was $87,230.36, close to the weekly high of $87,363, while the lower band stood at $73,099.85.
Bitcoin briefly traded beyond the upper band near its weekly peak before moving back inside it. Its current position between the upper band and the midpoint leaves $87,230 as a nearby daily chart level above price and $80,165 as a lower one.
The immediate upside sequence starts with the $85,000–$85,800 sell zone. Above it sit the 4-hour Supertrend at $86,435, the upper daily Bollinger Band at $87,230, and the weekly high at $87,363. Wealthmanager’s higher sell-order areas near $88,000 and $90,000 would come into view if BTC clears those levels.
On the downside, the 4-hour support line at $83,593 is closest to the market. The CoinGlass heatmap shows further estimated liquidation exposure around $83,000 and $82,500, followed by the $81,000–$82,000 pullback area identified by Wealthmanager. The daily Bollinger midpoint near $80,165 lies below those shorter-term levels.

Disclosure: This article does not represent investment advice. The content and materials featured on this page are for educational purposes only.
You must be logged in to post a comment Login