

Crypto World
Bitcoin Price Flashes Its Biggest Warning of 2026
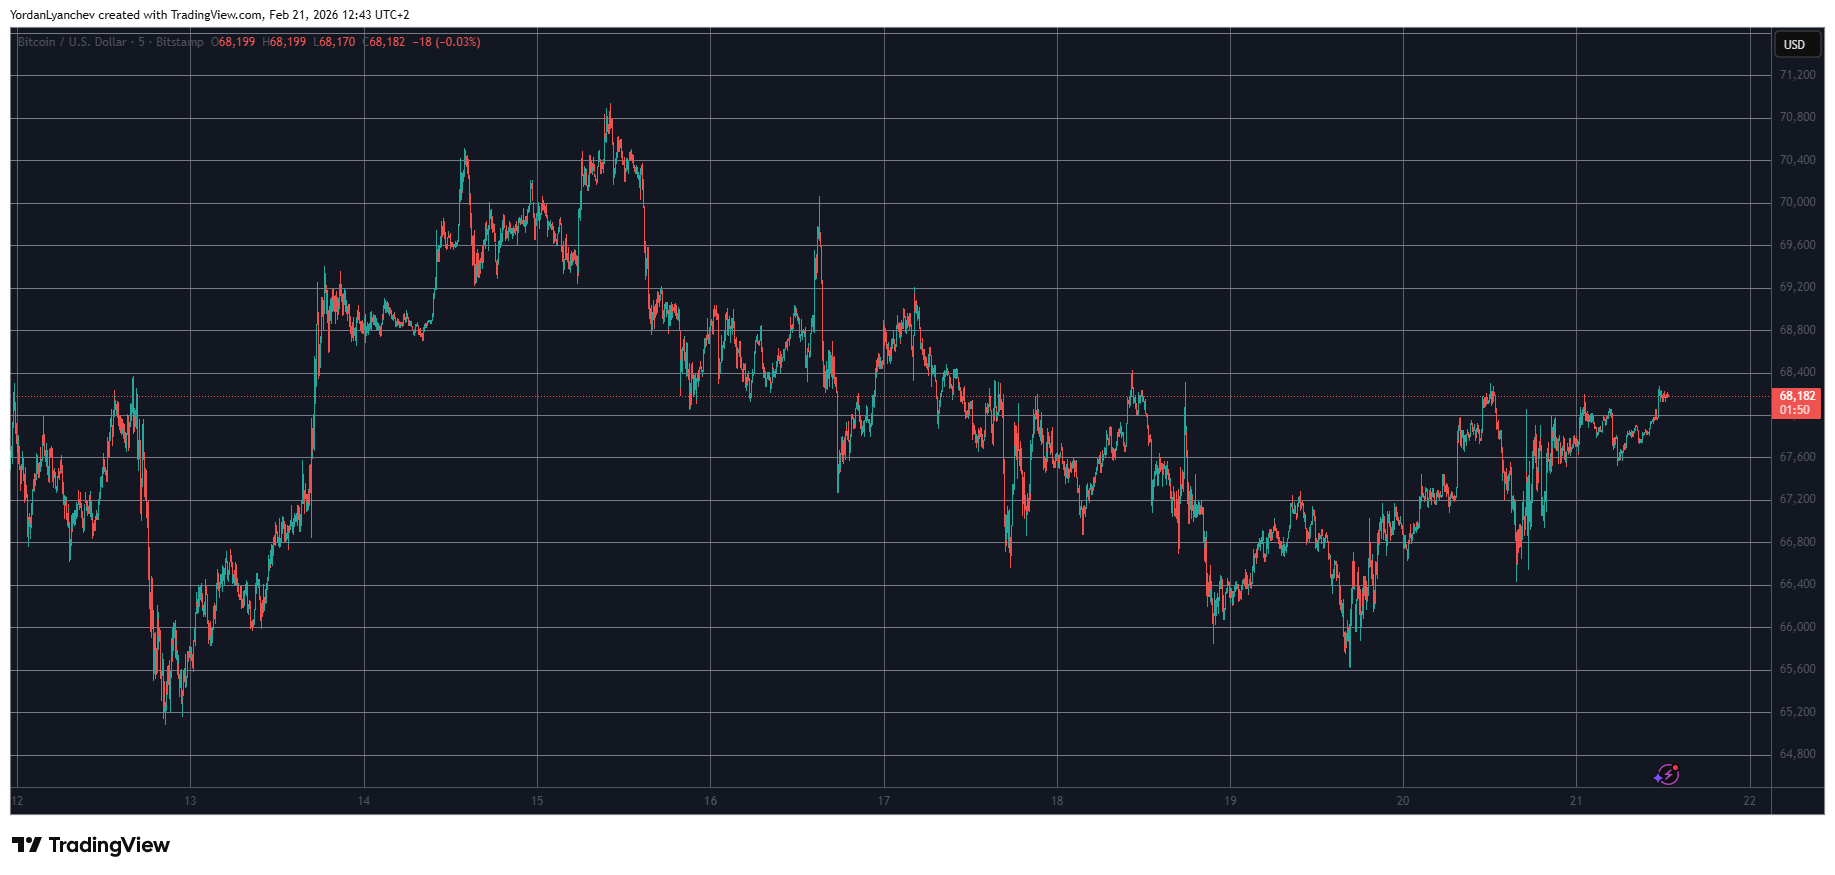
Bitcoin price has rebounded more than 4% since February 19, helping it recover above $68,200. This bounce offered temporary relief after weeks of weakness. However, new technical and on-chain signals now show that Bitcoin may be approaching its most dangerous level of 2026.
A combination of bearish chart structure, heavy supply clusters below price, and rising leverage risk suggests a deeper correction could begin soon.
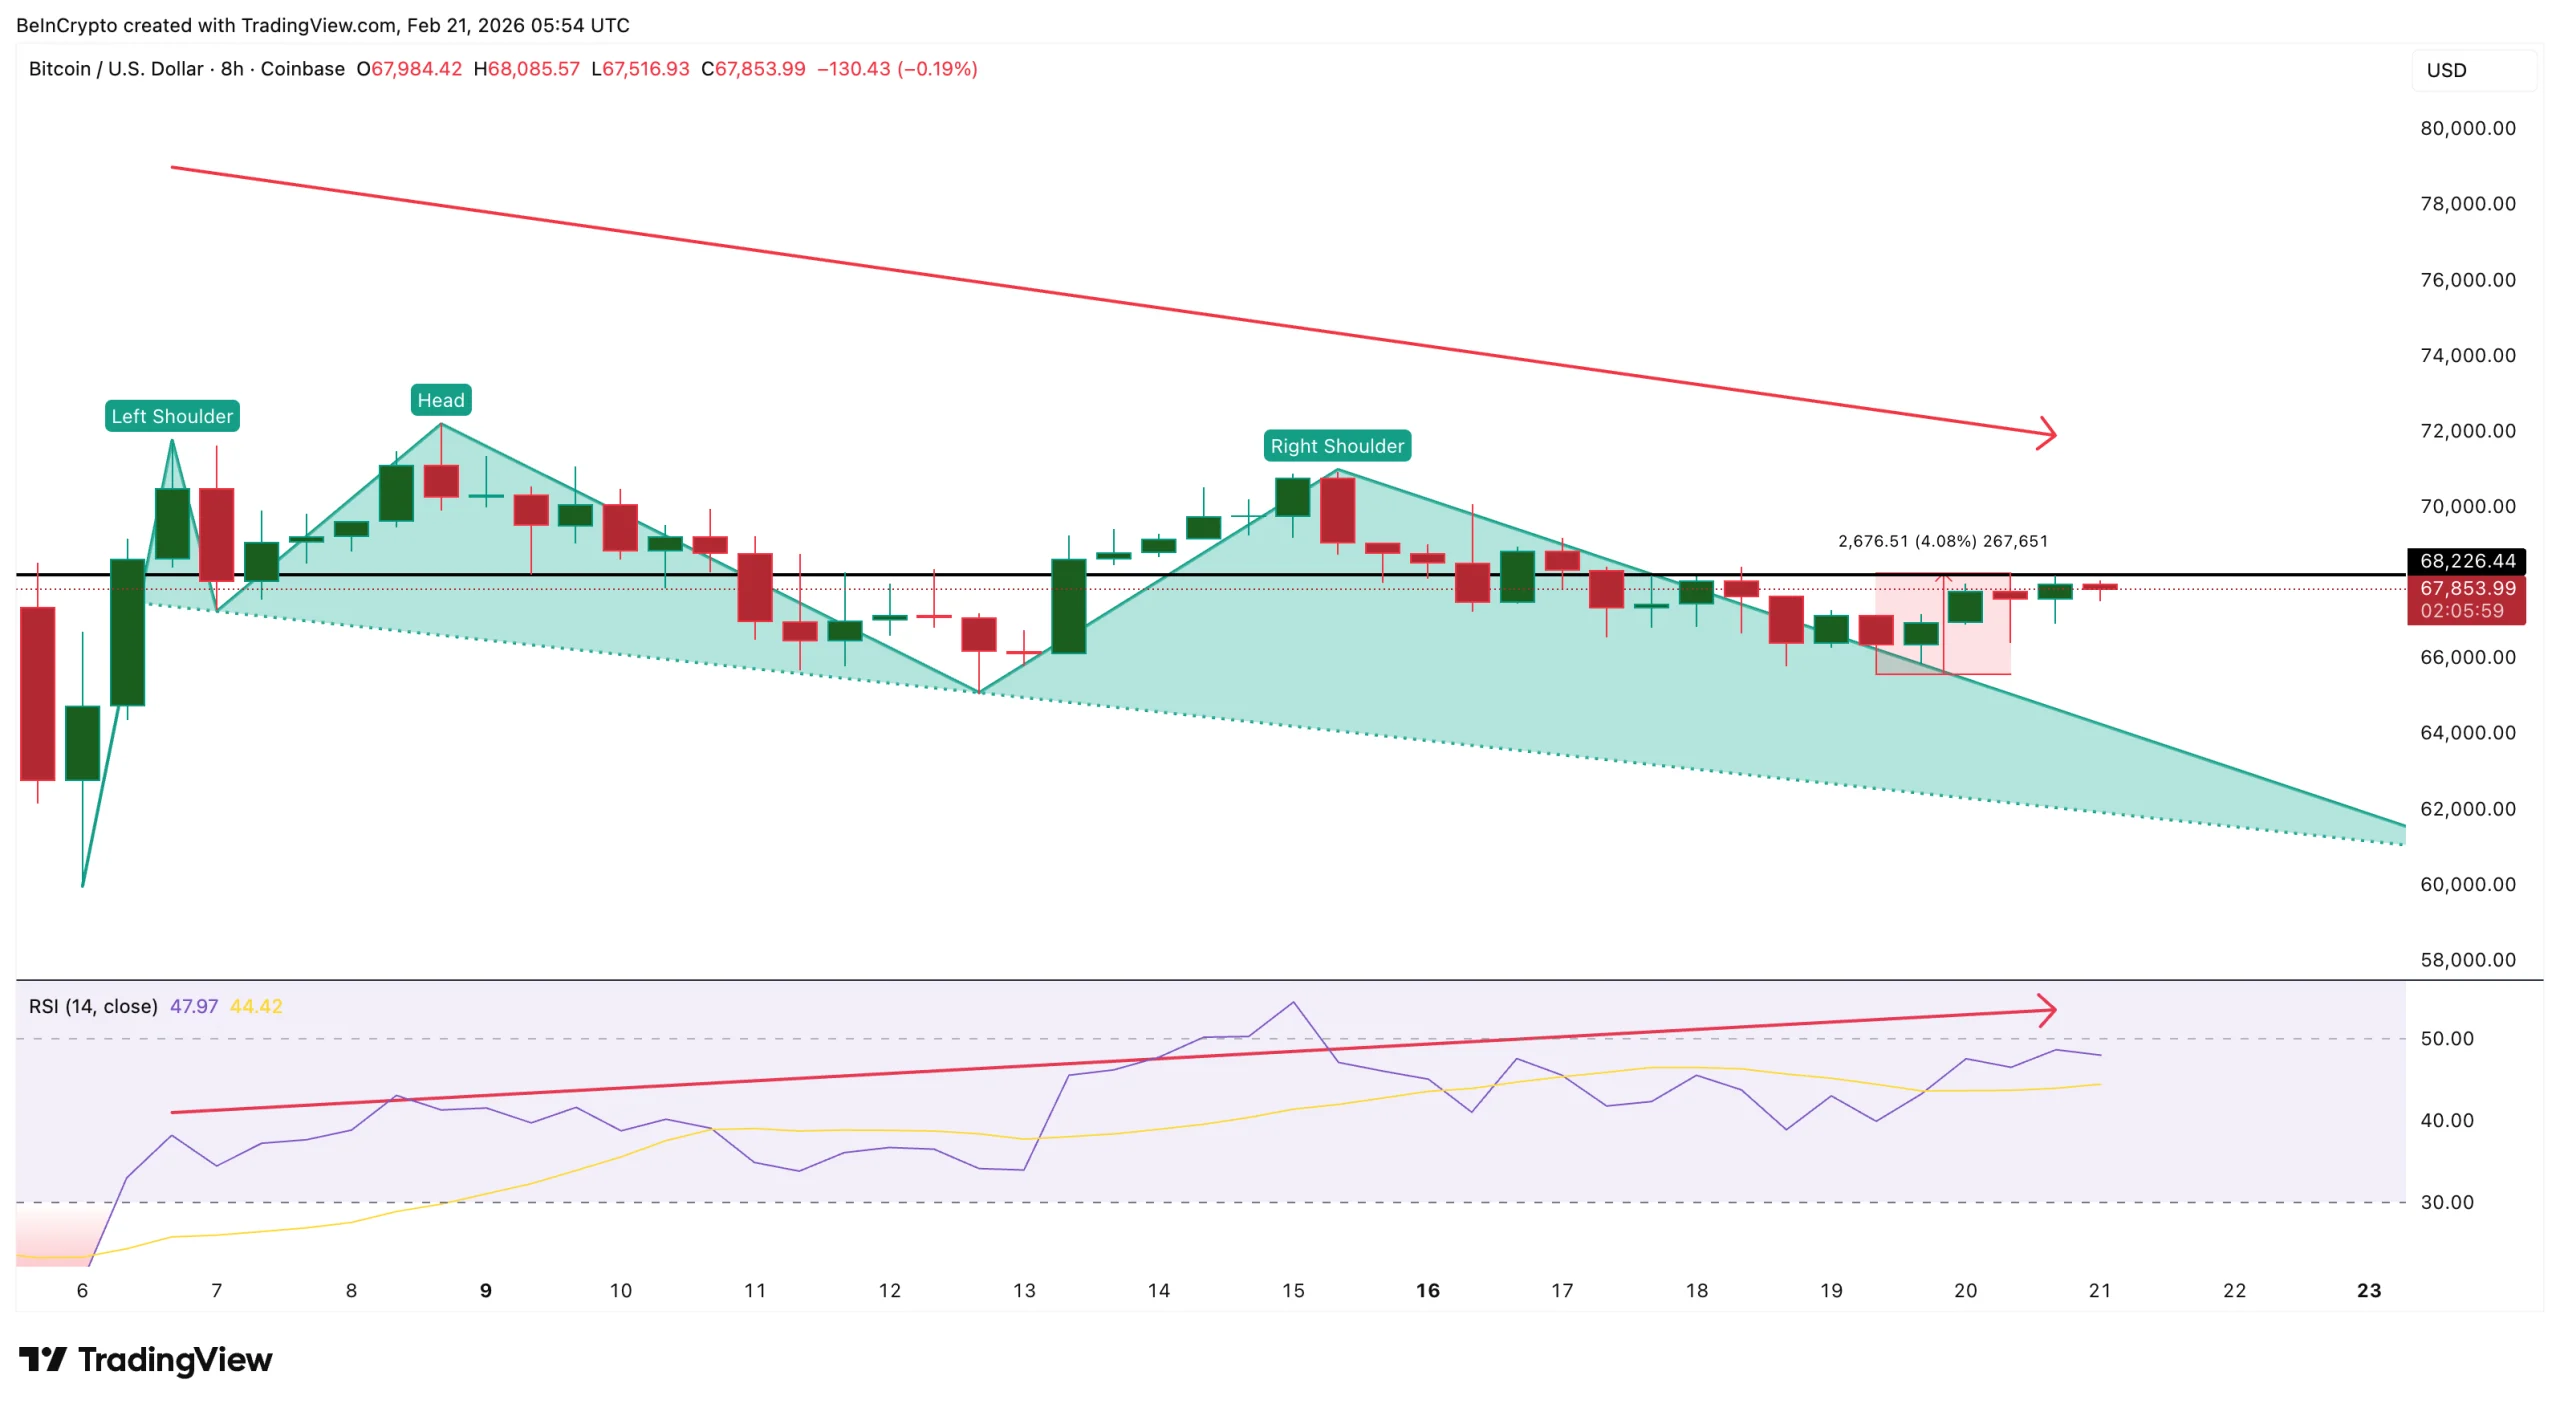
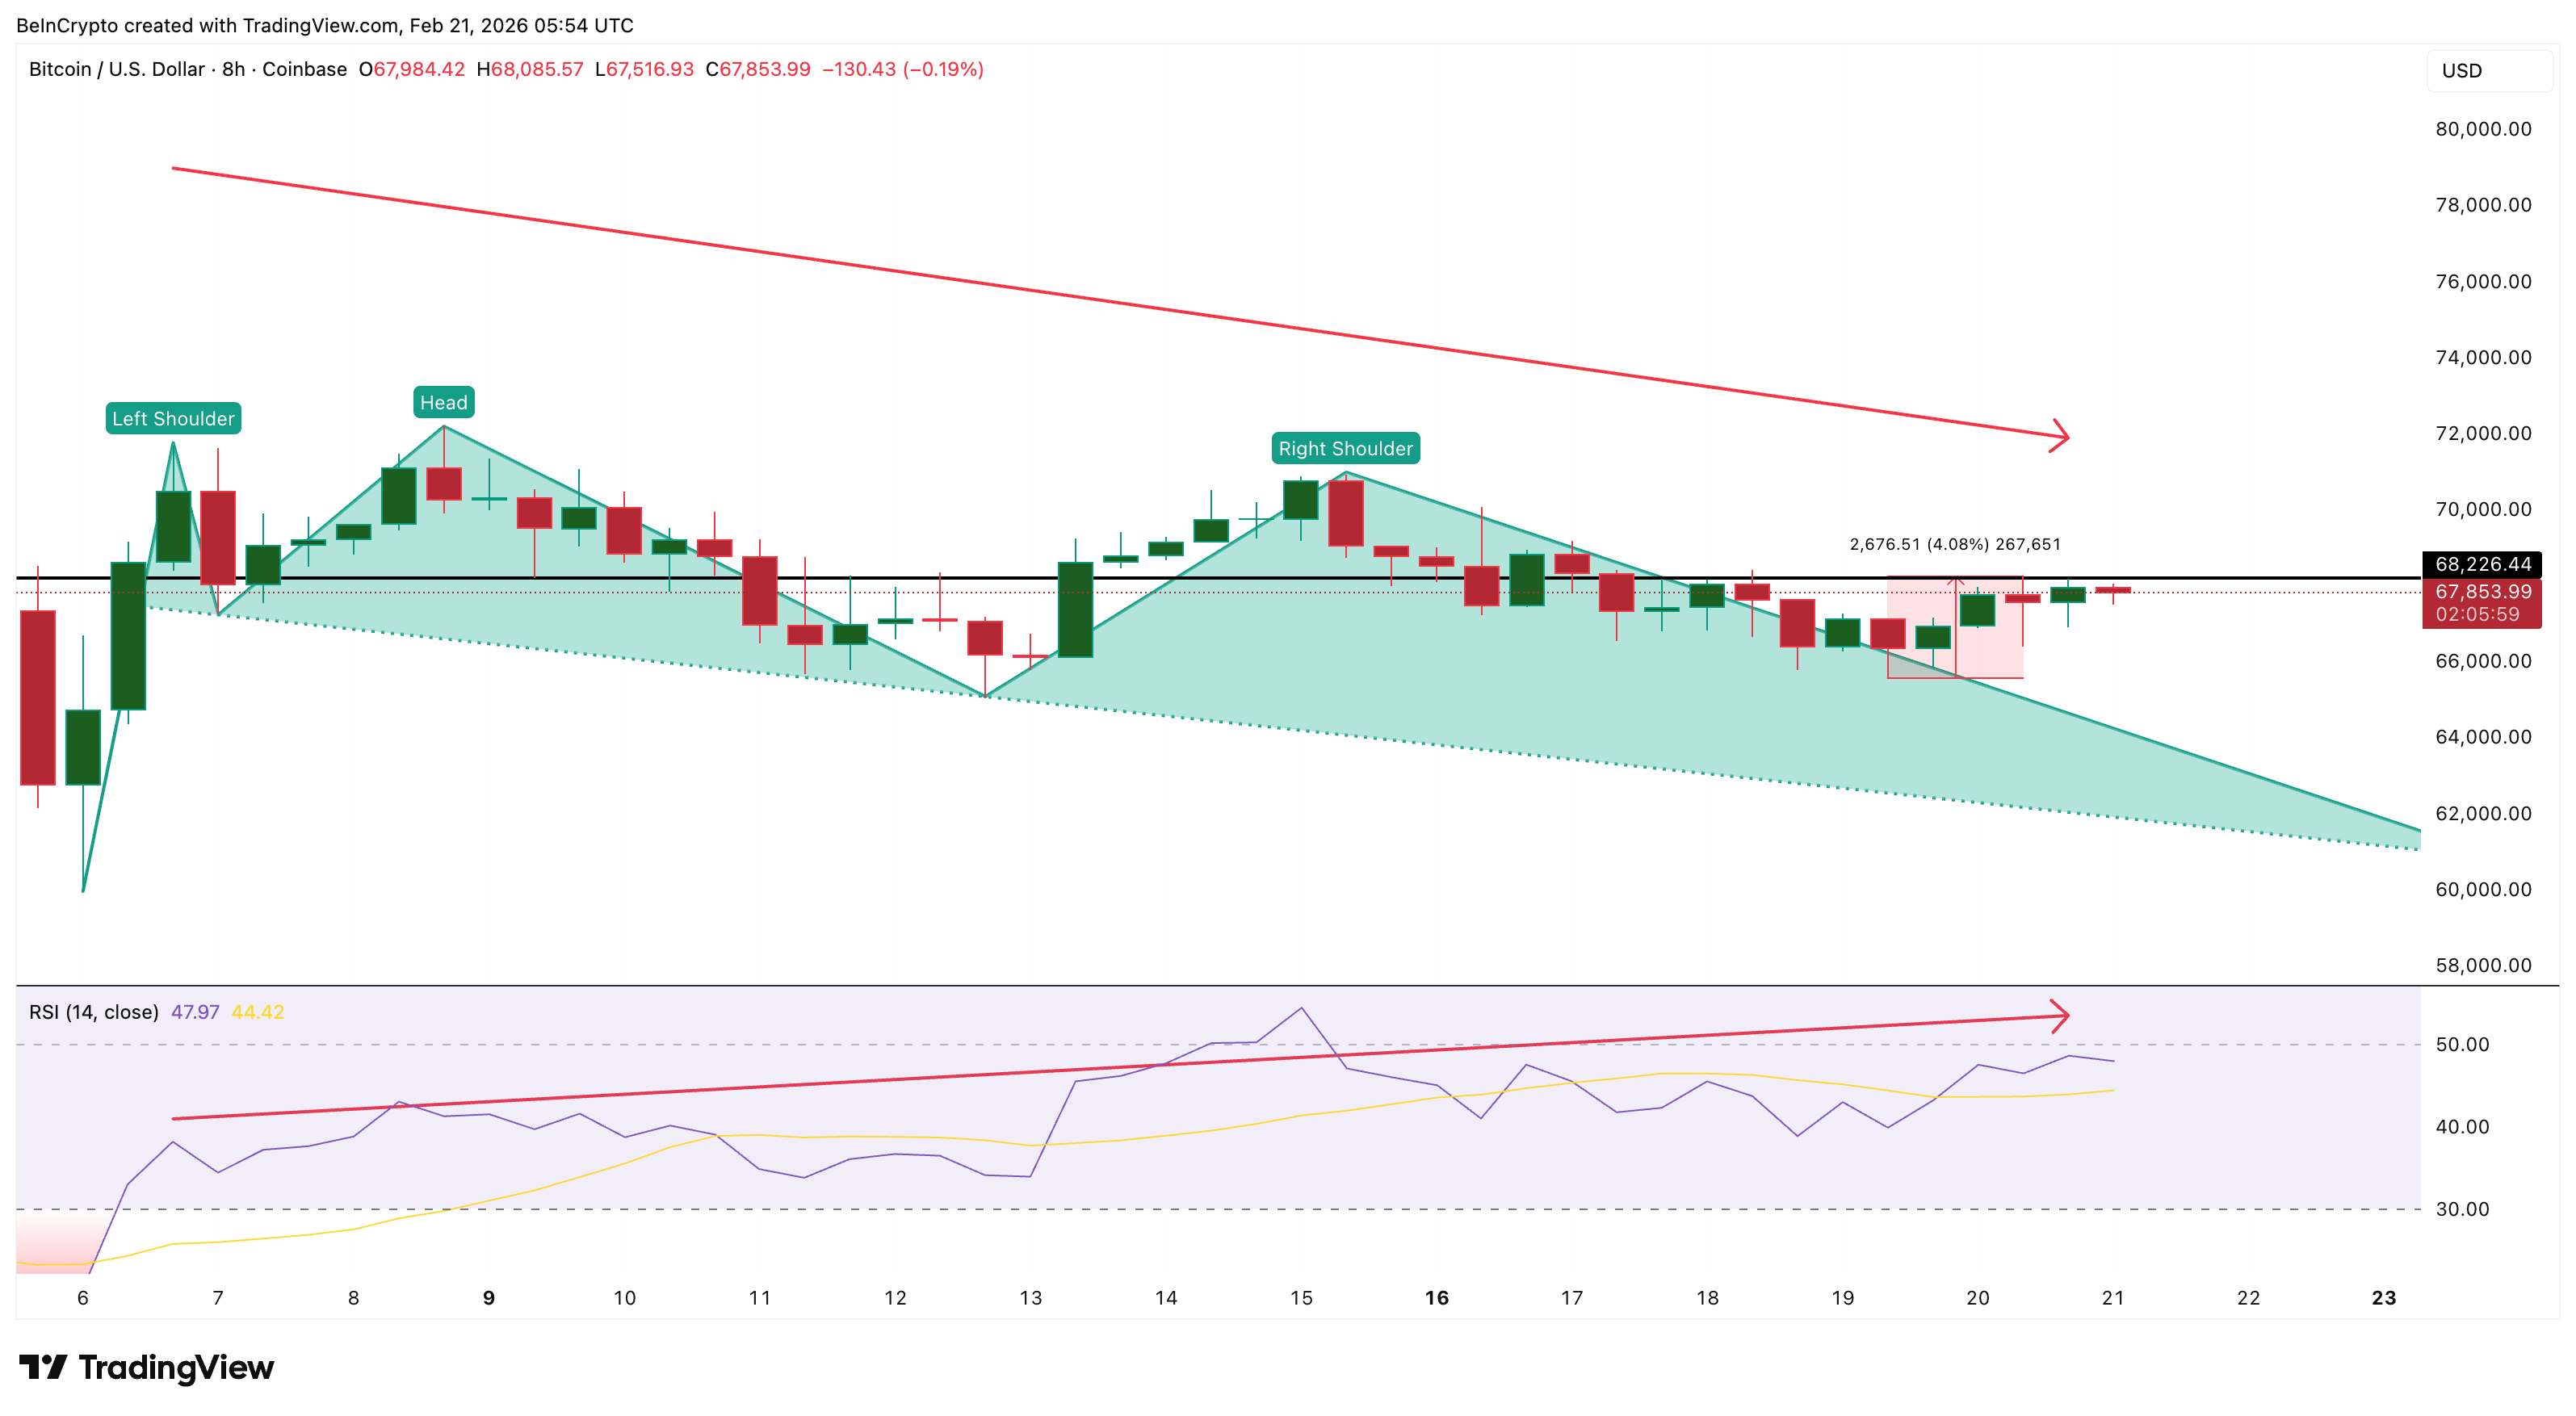
Bitcoin’s 8-hour chart currently shows a head-and-shoulders pattern. This is a bearish reversal structure that forms when price creates three peaks, with the middle peak higher than the others. It signals weakening buying strength and increasing selling pressure.
At the same time, Bitcoin has formed a hidden bearish divergence between February 6 and February 20. During this period, the Bitcoin price created a lower high, meaning the recovery failed to fully regain its previous peak.
However, the Relative Strength Index, or RSI, formed a higher high.
Want more token insights like this? Sign up for Editor Harsh Notariya’s Daily Crypto Newsletter here.
RSI measures buying and selling momentum on a scale from 0 to 100. When RSI rises, but price fails to rise equally, it shows that buying strength is weakening. This pattern often appears before price declines or pullbacks.
The biggest risk now comes from Bitcoin’s on-chain cost basis levels. Data from the UTXO Realized Price Distribution, or URPD, shows that the largest supply cluster sits at above $66,800. This level holds 3.17% of Bitcoin’s total circulating supply.
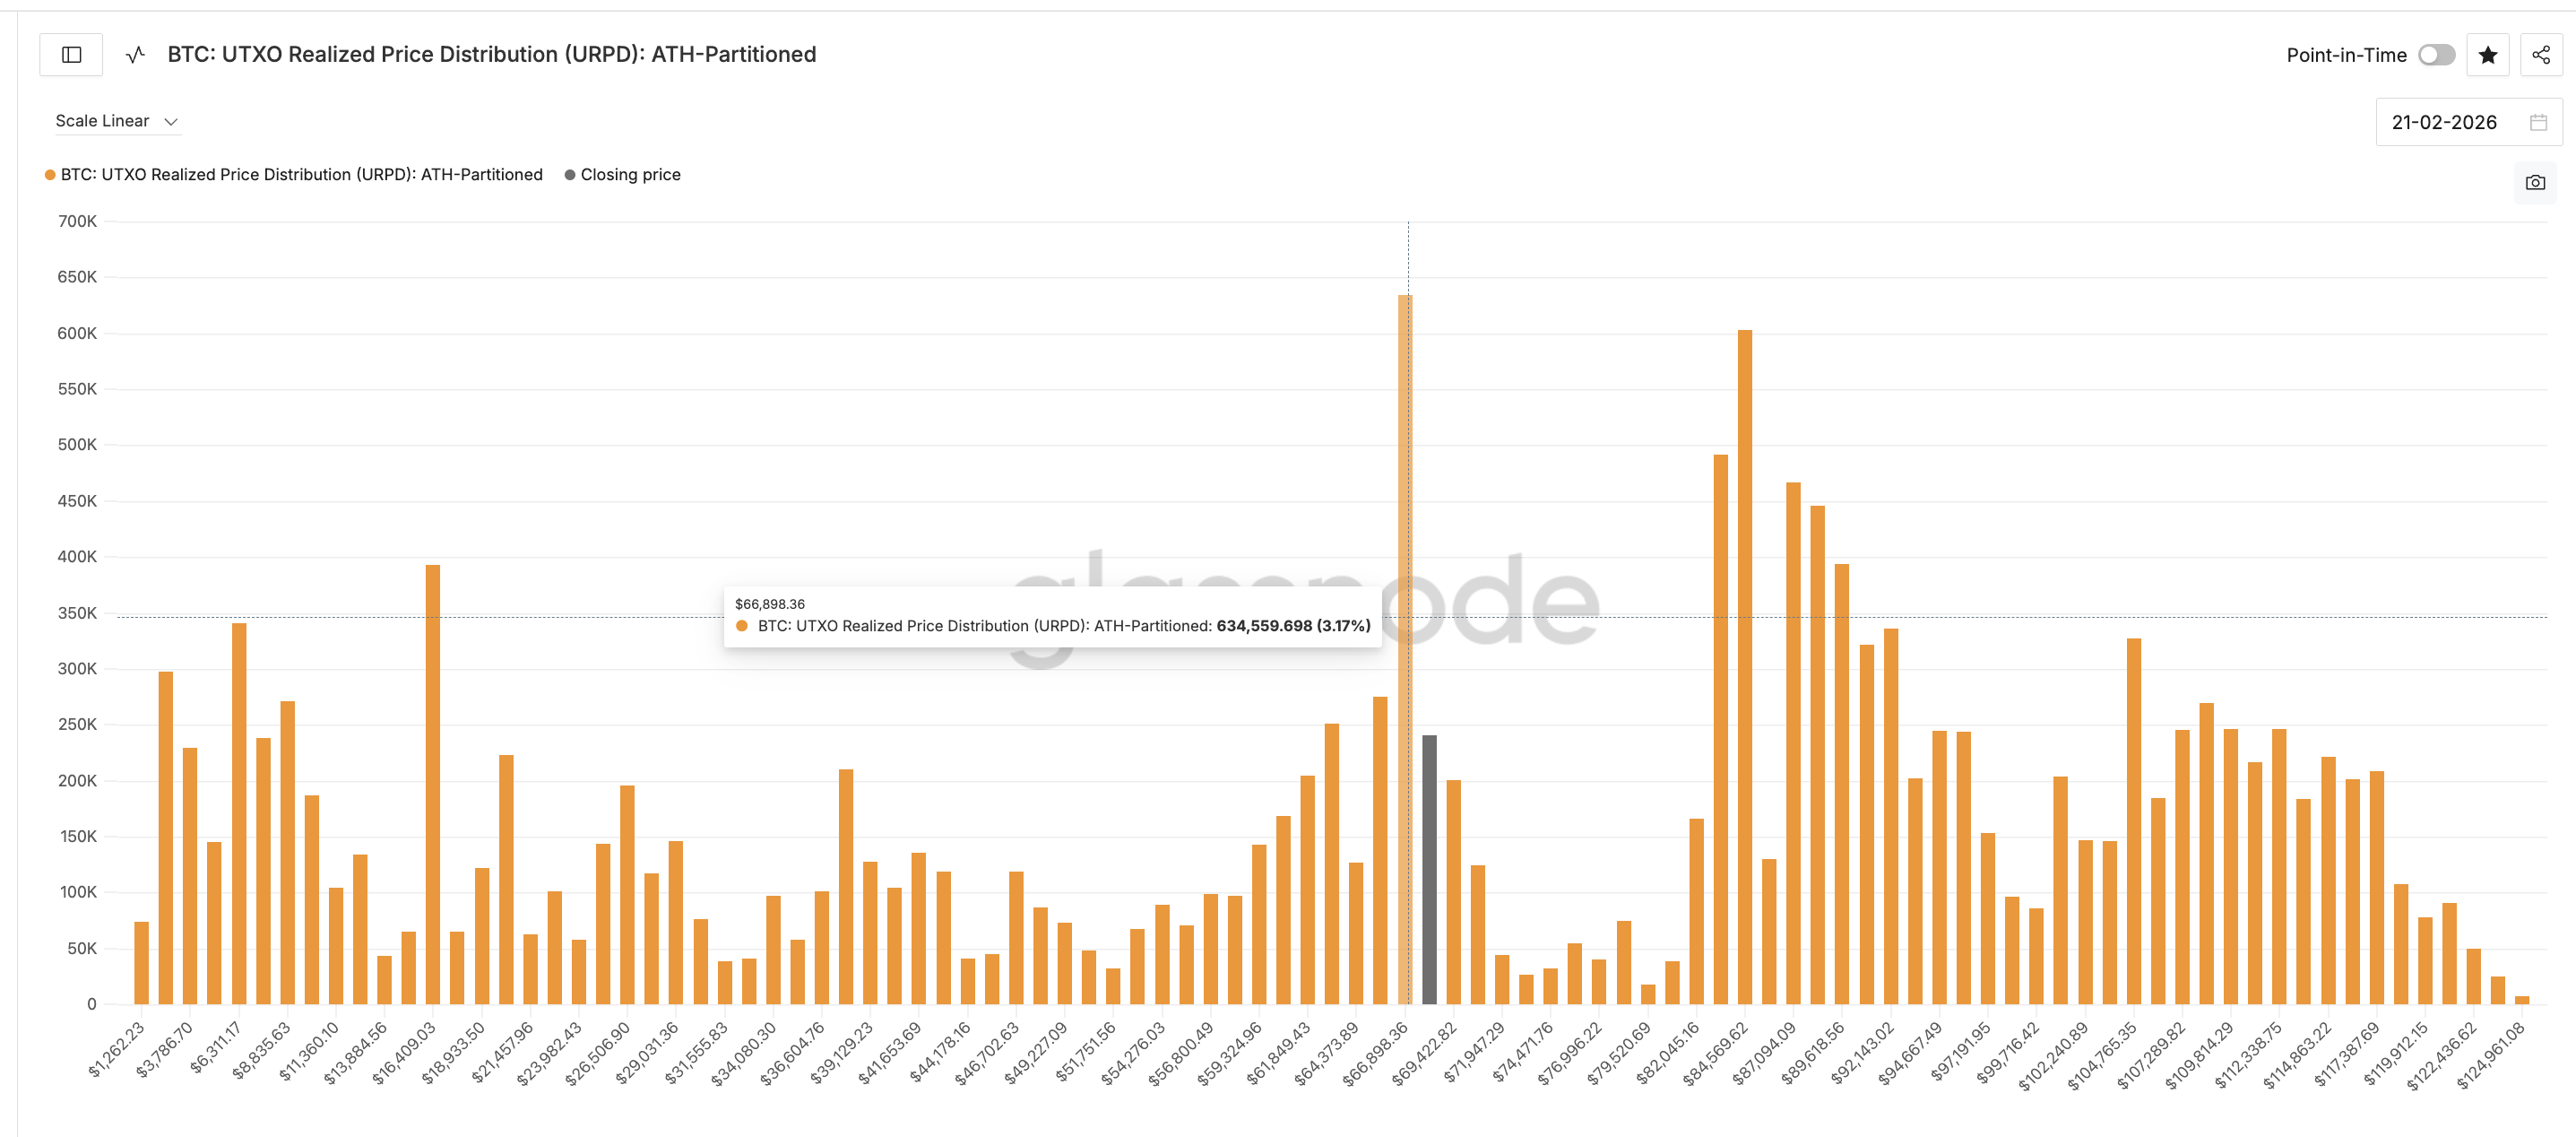
Another major cluster sits at $65,636, holding an additional 1.38% of supply.
These levels are important because they represent prices at which many investors bought Bitcoin. If Bitcoin falls below these levels, holders may begin selling to avoid losses. This can accelerate the price decline quickly.
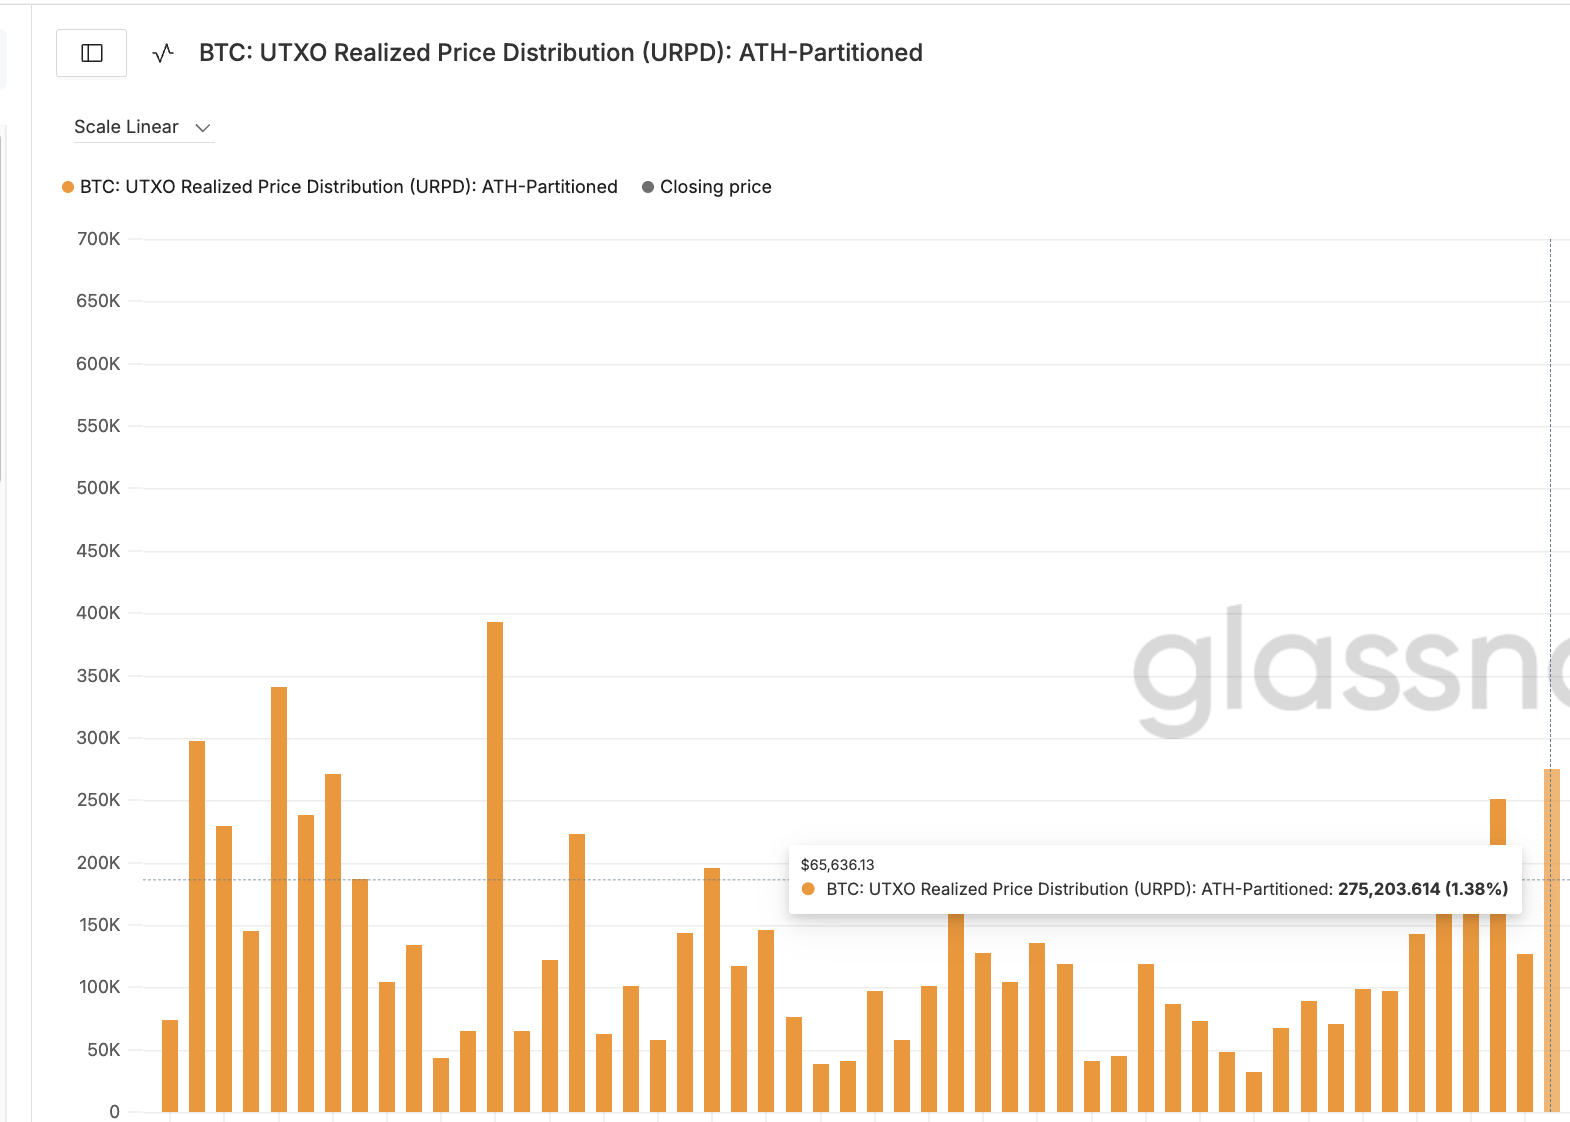
Together, these clusters represent more than 4.5% of Bitcoin’s supply concentrated just below the current price. This creates a high-risk zone directly under Bitcoin’s support. That explains the biggest price warning
If Bitcoin closes below this region, the head-and-shoulders pattern realization could gain strength.
Rising Leverage and ETF Outflows Increase Liquidation Threat
Derivatives data shows rising liquidation risk as Bitcoin rebounded. Open interest, which measures the total value of active futures positions, has increased from $19.54 billion on February 19 to about $20.71 billion now, during the bounce.
This means more traders have entered leveraged positions during the recovery.
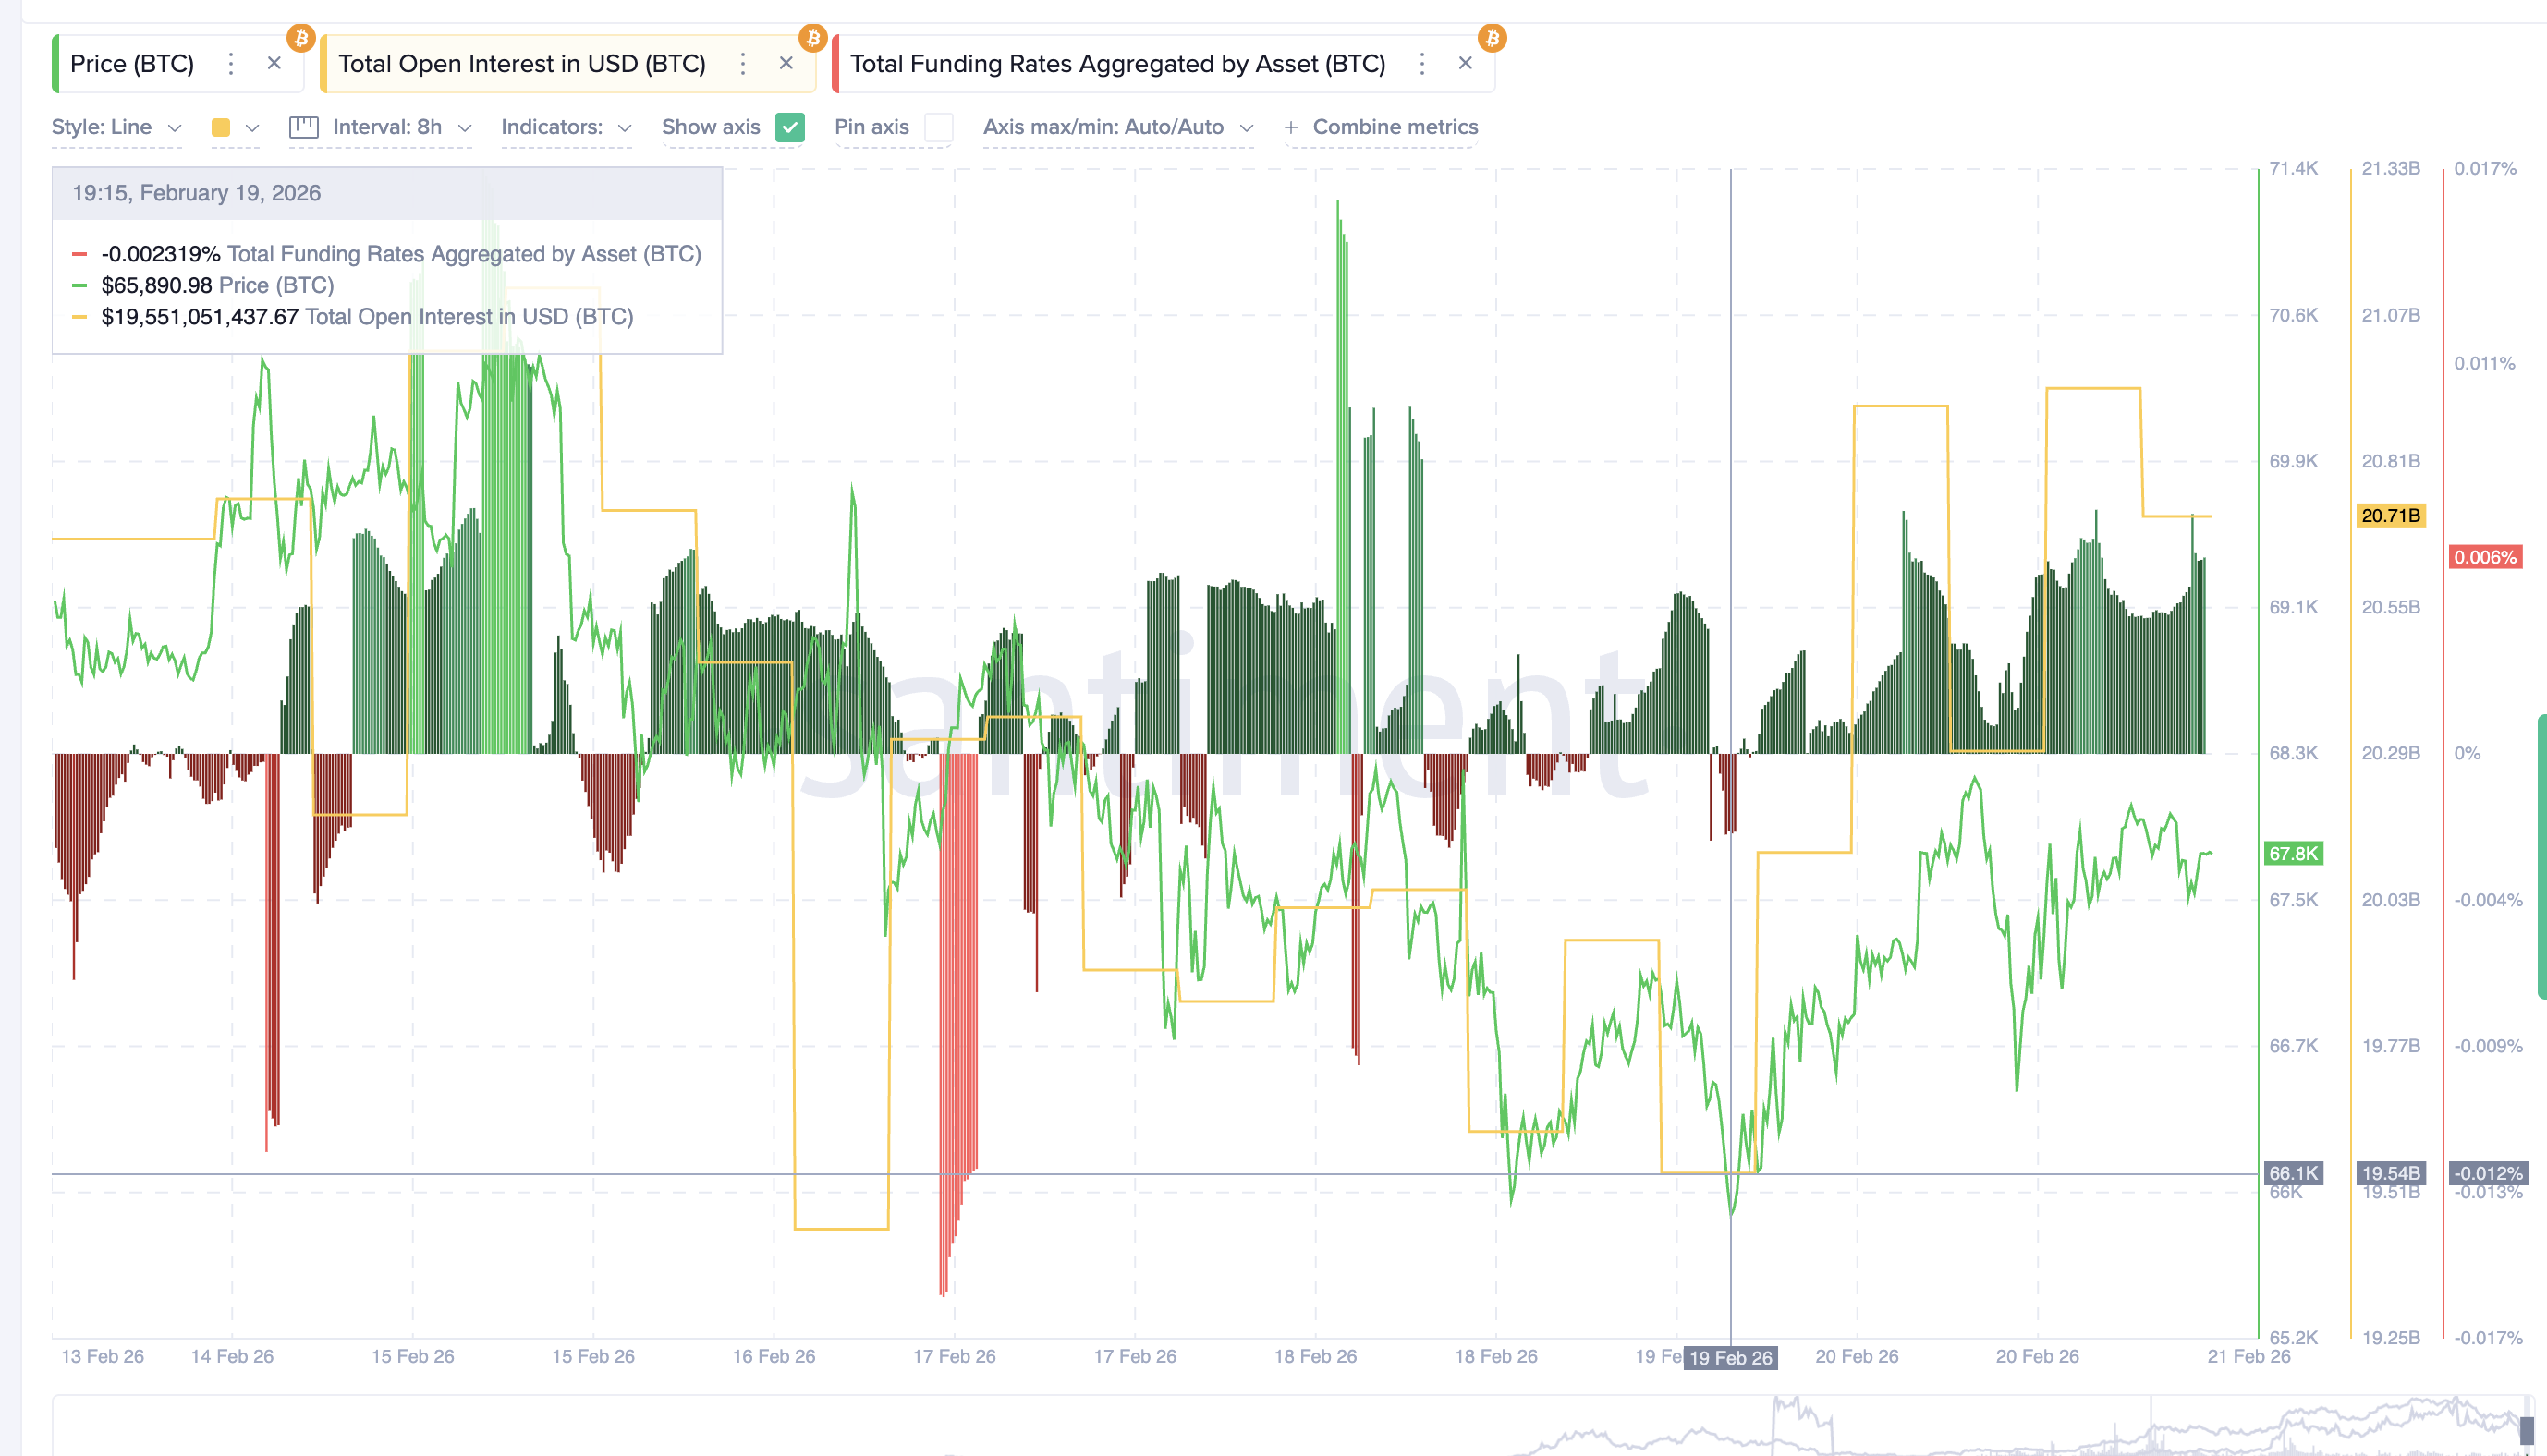
At the same time, funding rates have turned positive. Funding rates are payments between long and short traders. Positive funding means more traders are betting on price increases. This creates a dangerous situation.
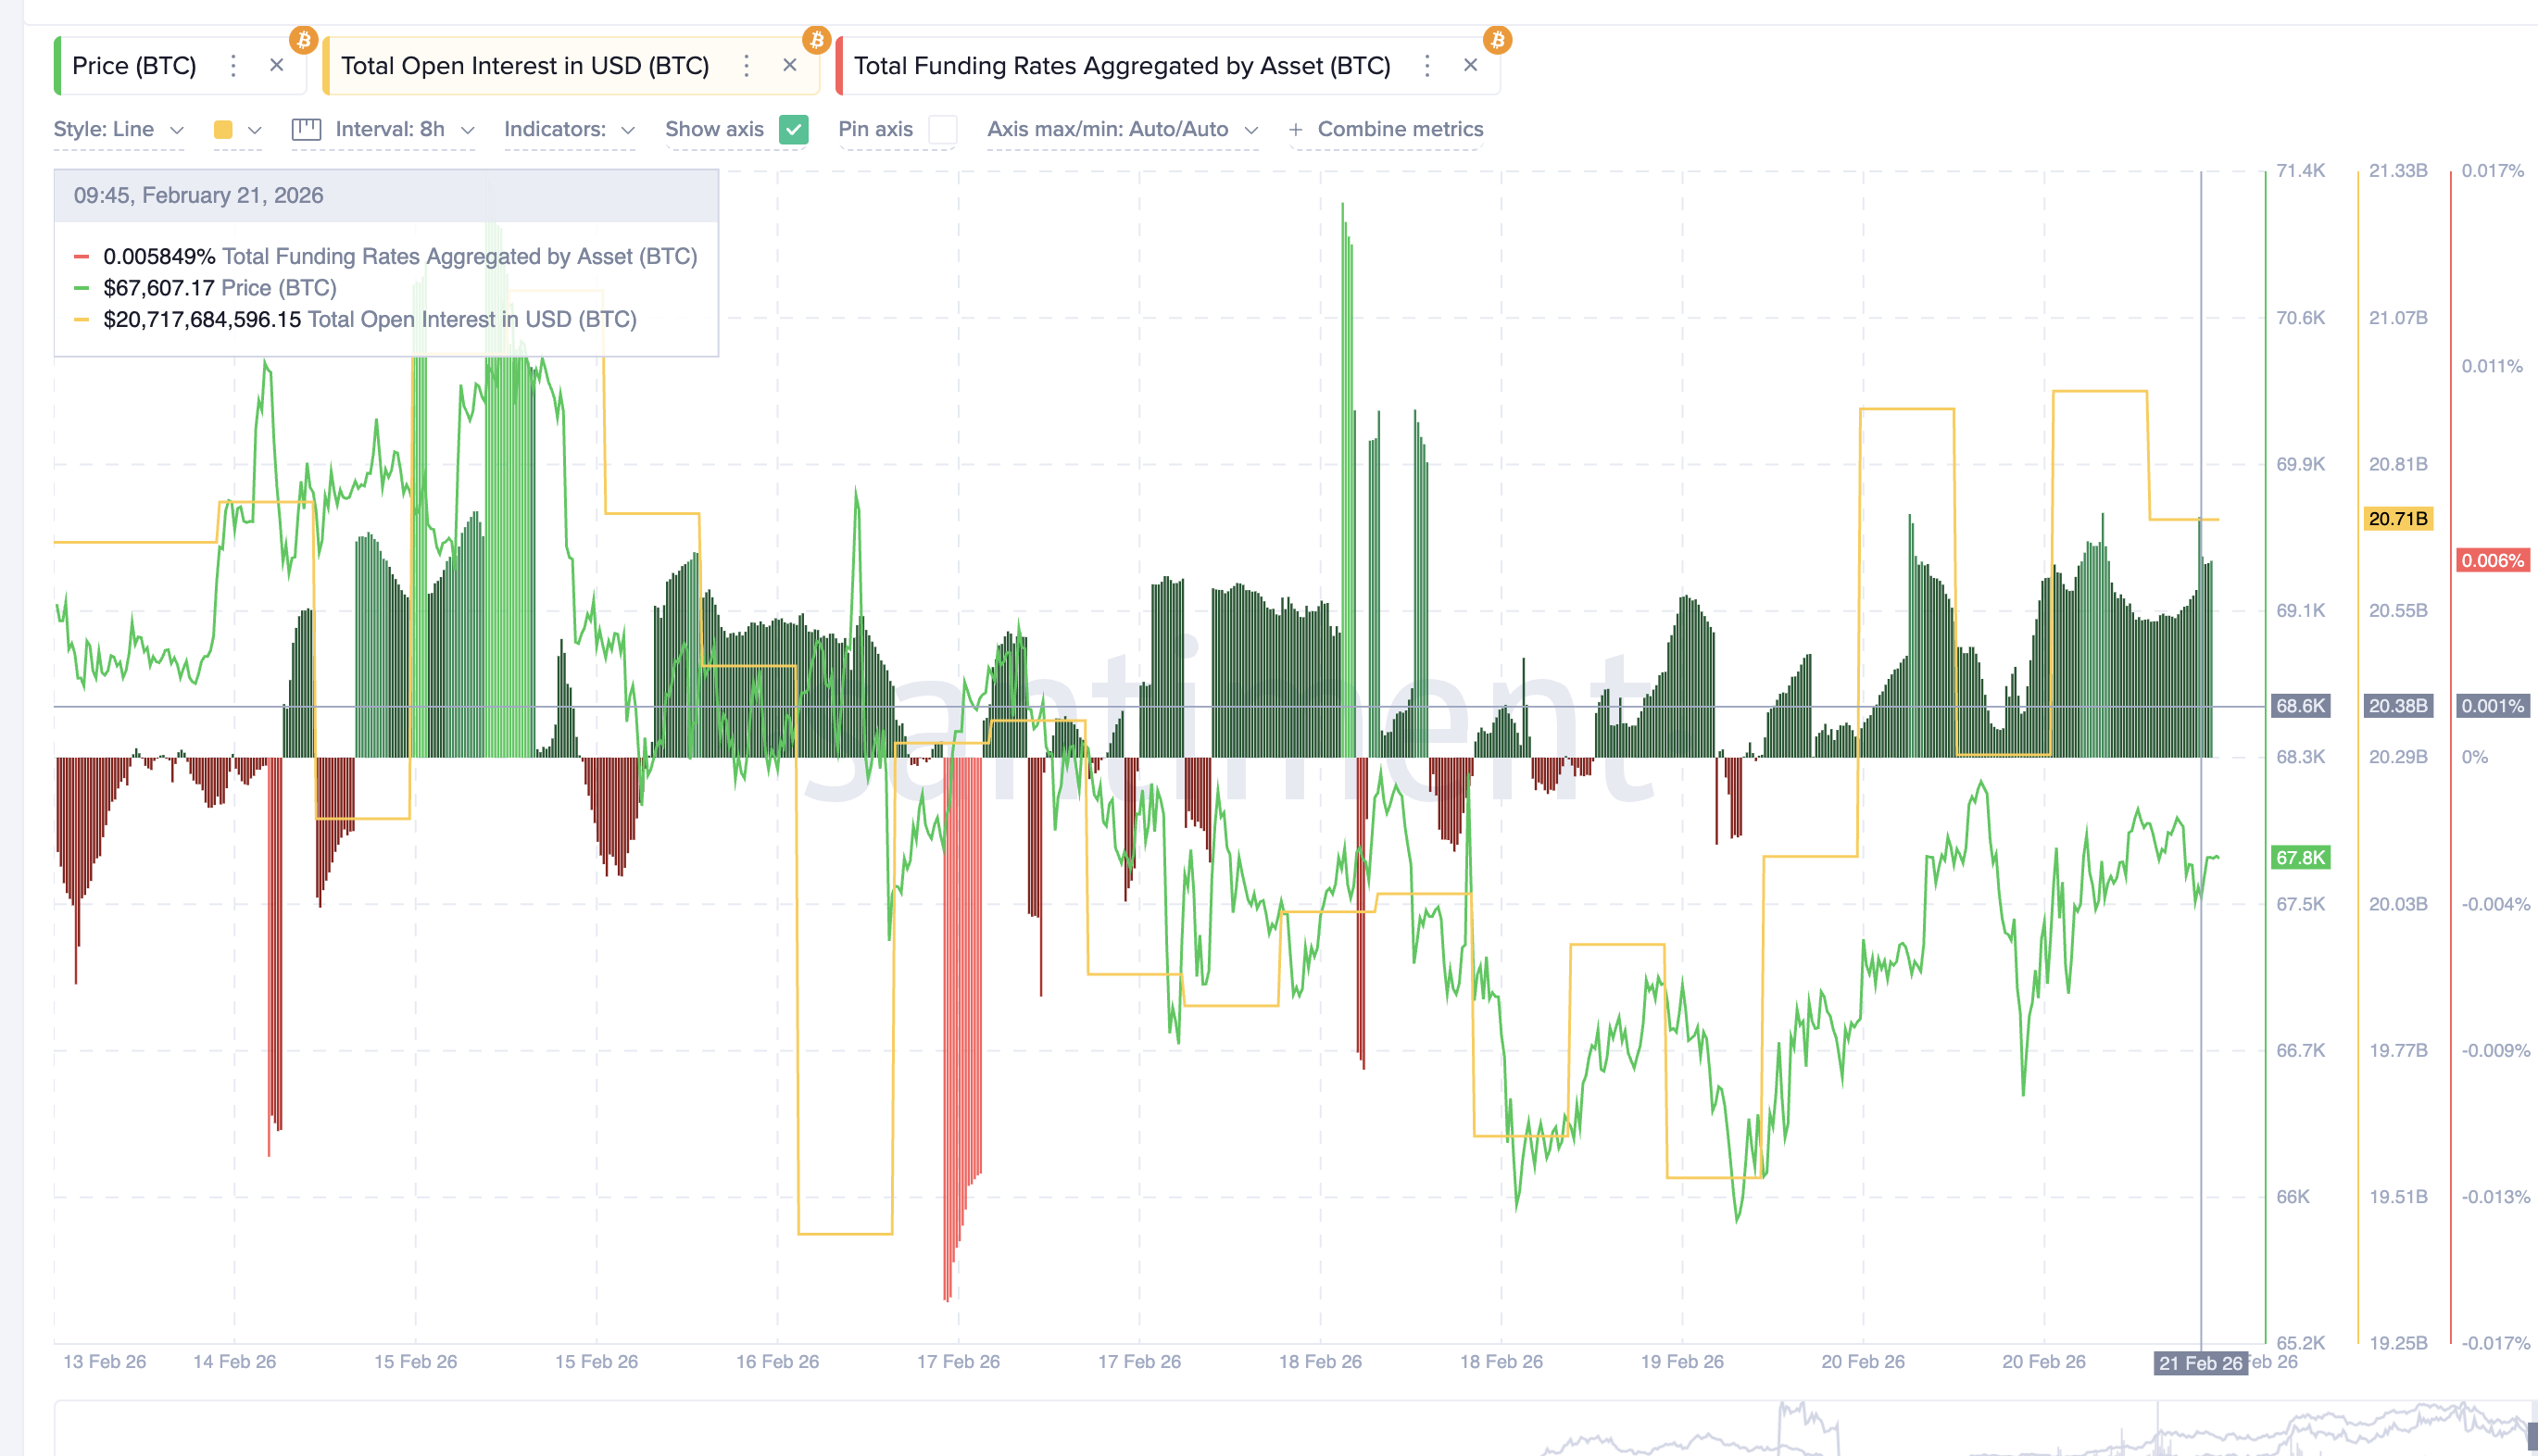
If the Bitcoin price starts falling, these leveraged long positions may be forced to close. This triggers a long squeeze, where bullish traders are pushed out of their positions. Such forced exits can create a liquidation cascade, adding extra selling pressure and accelerating the price drop.
Institutional sentiment also remains weak. Spot Bitcoin ETFs have now recorded five consecutive weeks of net outflows. This shows that institutional investors are still withdrawing capital rather than accumulating.
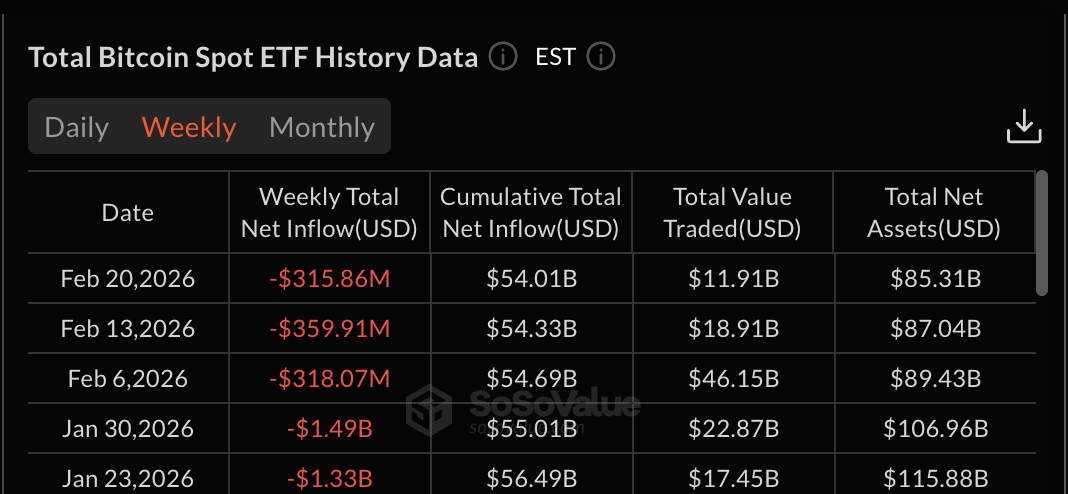
This reduces support during price declines.
Bitcoin Price Faces Critical Test Below Institutional Resistance
Bitcoin also remains below its monthly Volume Weighted Average Price, or VWAP, which sits near $70,000. VWAP represents the average price weighted by trading volume. Monthly VWAP is widely used as a proxy for institutional cost basis.
When Bitcoin trades below VWAP, it means the average institutional position is currently at a loss. This often causes institutions to reduce exposure or avoid new buying, explaining the ETF apathy.
A recovery above $70,000 would signal renewed institutional strength. But as long as Bitcoin stays below this level, recovery attempts may remain limited, and the broader structure remains bearish.
On the downside, Bitcoin’s first key support sits near $67,300. If this level breaks, the next support appears at $66,500, followed by $65,300. These levels align closely with the major supply clusters mentioned earlier. Failure to hold these levels could trigger the larger head-and-shoulders breakdown near the $60,800 neckline.
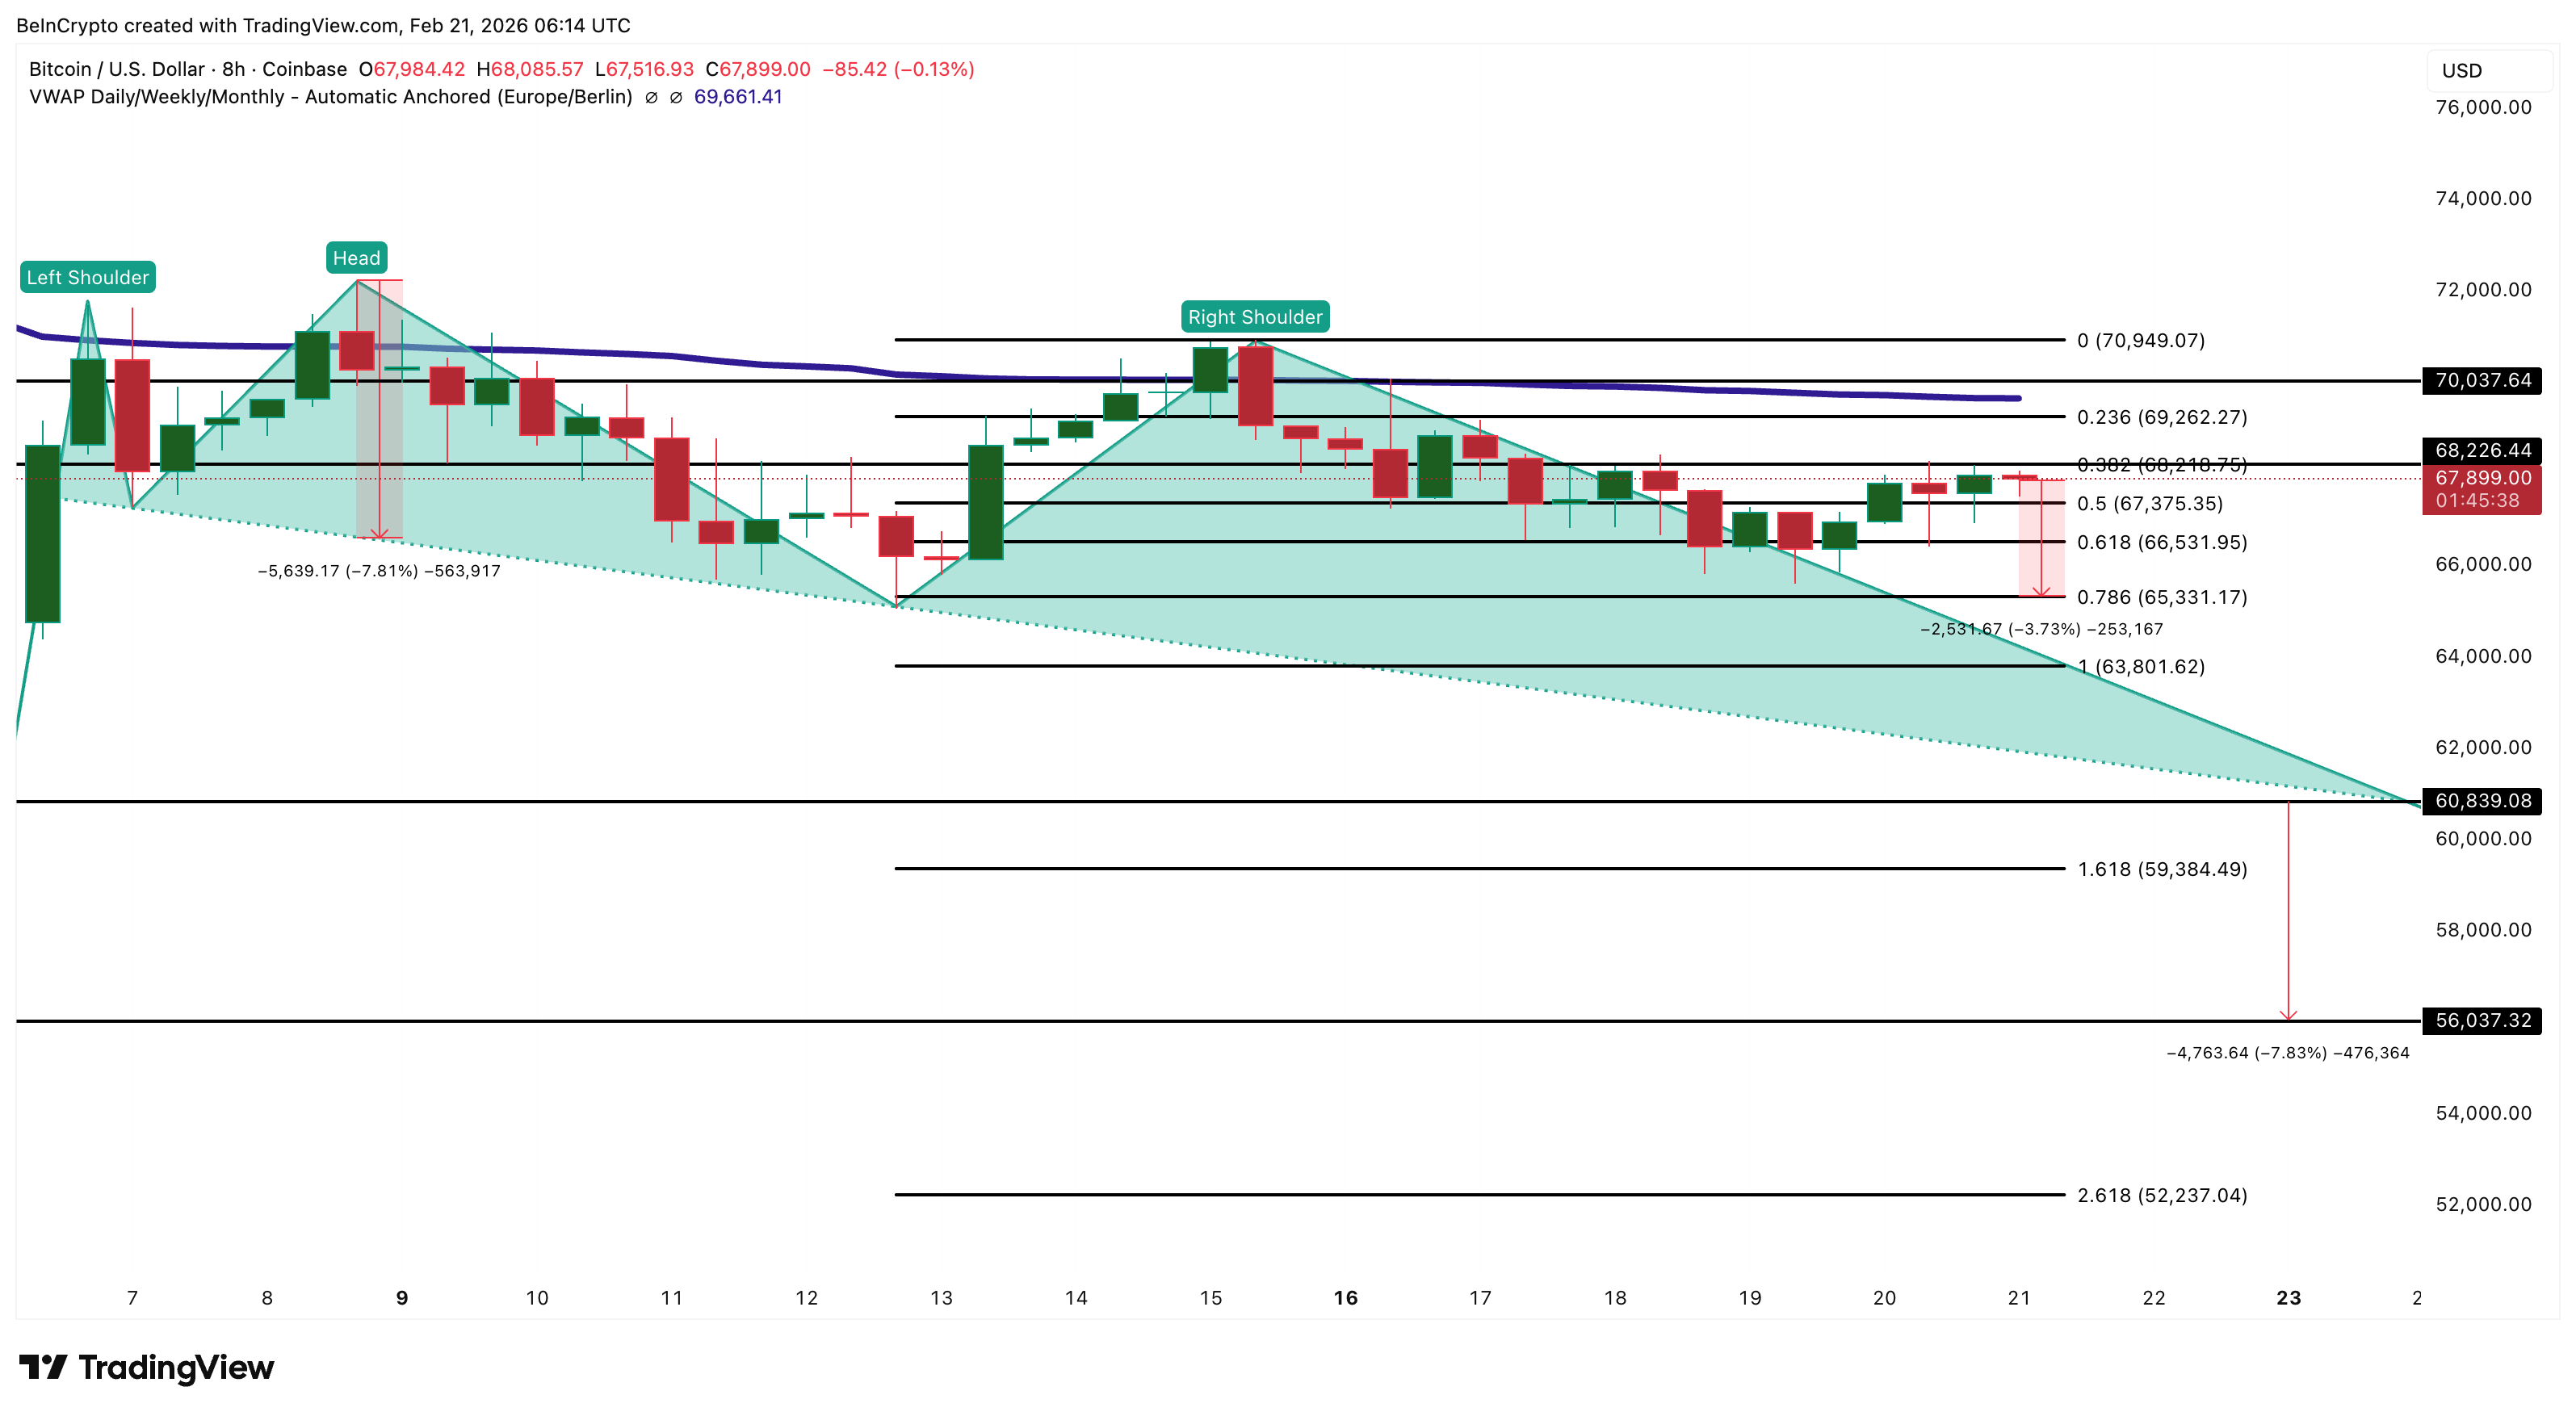
A breakdown can then trigger a price breakdown target of over 7.5%, hinting at a target price of $56,000, in the near-to-mid-term.
On the upside, Bitcoin must reclaim $68,200 to stabilize its short-term structure. However, a full recovery would require reclaiming the $70,000 VWAP level.


Bitcoin market sentiment has cooled as speculative euphoria ebbs, according to a weekly assessment by Santiment. The analytics firm notes that calls for BTC to sprint into uncharted territory — with bold targets ranging from $150,000 to $200,000, or even a drop to $50,000–$100,000 — have faded from the discourse. The shift away from meme-driven optimism is framed as a healthier sign for the market, suggesting retail buyers are retreating from extreme projections. While price action has not produced a definitive trend, the combination of cooling FOMO and mixed on-chain signals points to a more cautious environment. Bitcoin previously surged to around $126,100 in October before sliding into a downtrend that persisted through year-end.
Key takeaways
- Calls for extraordinary BTC targets are fading, signaling a rebalanced risk appetite.
- Bitcoin traded near $60,000 on Feb. 6 and later rose toward the mid-$60s, reaching about $67,800 at the time of publication.
- Social sentiment around BTC has shifted from extreme bearishness to neutral, complicating short-term trading decisions.
- The Crypto Fear & Greed Index remained in Extreme Fear, underscoring persistent caution among investors.
- On-chain activity shows warning signs, with declining transaction volume, fewer active addresses, and slower network growth suggesting dormancy rather than expansion.
Tickers mentioned: $BTC
Sentiment: Neutral
Price impact: Positive. Bitcoin’s bounce back toward the mid-$60k range provides a modest near-term price lift after February’s dip.
Trading idea (Not Financial Advice): Hold. The combination of softened sentiment signals and dwindling on-chain activity argues for a cautious stance rather than aggressive positioning.
Market context: The mood around BTC sits at a crossroads between a cooler speculative outlook and a still-fragile risk-off backdrop. With daily trading volumes and on-chain participation cooling, the market appears to be testing whether the recent price appreciation can translate into sustainable user activity or whether it remains a symptom of speculative liquidity rather than fundamental growth.
Why it matters
The Santiment analysis captures a moment when the crypto narrative shifts from high-conviction price fantasies to a more grounded view of Bitcoin’s fundamentals and macro-driven price action. On one hand, prominent proponents previously predicting multi-hundred-thousand-dollar BTC prices have softened their stance, acknowledging the need for a longer, steadier runway. On the other hand, even as price nudges higher, traders face a paradox: sentiment has improved enough to reduce panic-driven moves, yet on-chain metrics tell a story of reduced network activity, which historically can precede meaningful price moves or retests of support levels.
Bitcoin’s price trajectory has been a central point of focus for market participants. After a push to the early 2025 high, BTC then retraced into late-year weakness, a pattern that left many investors cautious about the durability of any rebound. The February dip to around $60,000 was followed by a tentative recovery into the mid-$60k area, with the latest readings showing the asset hovering near $67,847 according to CoinMarketCap. This price action, set against fading meme-driven enthusiasm, underscores a market that may require clearer catalysts before committing to a fresh up-leg or a renewed consolidation phase.
From a sentiment perspective, the shift from “extreme bearishness” toward a neutral stance can both help and hinder decision-making. While neutral sentiment reflects a cooling of speculative frenzy, it can also reduce the clarity of trading signals, making it harder for participants to determine whether a breakout is genuine or simply a pause in the current range. Santiment cautions that relying solely on sentiment metrics in such environments can be misleading, urging traders to balance social indicators with real-time on-chain data and price action.
On-chain indicators add another layer of nuance. Transaction volume, active addresses, and network growth have all shown a tendency to trend downward, a sign that the network is being used less frequently. In practical terms, this dormancy can imply that a large portion of market participants are waiting on the sidelines, rather than actively expanding utilization or driving new demand for block space. While this is not inherently bearish, it does suggest that price momentum might rely more on liquidity and macro factors than on fundamental network-driven demand in the near term.
Meanwhile, the Crypto Fear & Greed Index has persisted in the Extreme Fear zone, a reminder that risk appetite remains fragile even as prices recover from mid-wFebruary lows. Such readings often reflect a market where traders are wary of mispricing or sudden reversals, preferring to observe and react rather than to chase momentum. The juxtaposition of a modest price uptick with cautionary social sentiment and waning on-chain activity paints a complex picture for investors weighing the odds of a sustained rally versus a prolonged consolidation or a deeper pullback.
Beyond BTC-specific dynamics, the broader market context remains relevant. A cooler sentiment regime can coincide with tighter liquidity and a more selective investment climate, impacting capitalization on new products, exchange-traded products, and institutional allocations. In this environment, investors may favor risk-managed strategies and deeper due diligence over rapid entry, even as favourable macro cues or favorable regulatory developments could tilt the balance toward a renewed upswing.
What to watch next
- Monitor on-chain metrics for signs of renewed active participation (transaction volume, number of active addresses, network growth) over the next few weeks.
- Track BTC price action around key levels near $68,000–$70,000 to identify potential breakouts or resistance tests.
- Watch sentiment indicators for any renewed swing toward bullishness or a return to fear-driven selling pressures.
- Observe any shifts in macro liquidity and risk sentiment that could provide a catalyst for a sustained move higher or a pullback.
Sources & verification
- Santiment: Weekly sentiment overview noting the decline in extreme price targets and the shift in retail optimism.
- CoinMarketCap: Bitcoin price data showing a dip near $60,000 in early February and a later level around $67,800 at publication time.
- Alternative.me: Crypto Fear & Greed Index reading at 8 (Extreme Fear).
- On-chain indicators referenced by Santiment: transaction volume, active addresses, and network growth trends.
- The broader discussion of BTC price dynamics and sentiment shifts summarized in Santiment’s weekly report.
Market reaction and key details
Bitcoin (CRYPTO: BTC) has navigated a climate where speculative frenzy has cooled, and investors are increasingly data-driven in their approach. Santiment’s latest weekly note highlights a notable retreat in calls for explosive BTC appreciation or drastic downside, signaling a more tempered market outlook. The shift away from outsized targets underscores a broader recalibration of risk as participants weigh the likelihood of a sustained rally against the possibility of choppy, range-bound trading.
The historical price arc serves as a reference point for the current mood. After peaking around $126,100 in October, BTC entered a downtrend that tempered expectations for a rapid, uninterrupted ascent. The subsequent months reinforced a picture of a market sensitive to macro headlines and liquidity cycles, rather than a purely driven by hyperbolic optimism. In early February, the asset found its footing around the $60,000 mark, only to recover modestly in the mid-$60,000s and hover near $67,800 at the time of writing. This sequence illustrates how price and sentiment can diverge in the short term, with cautious optimism coexisting with measured risk-taking.
On the sentiment front, the recovery from prior “extreme bearishness” suggests participants are beginning to consider price action in a more balanced light. Yet the absence of a clear, confirmatory trend means traders face a dilemma: whether to read the current neutral stance as a precursor to a durable rally or as a temporary pause before renewed volatility. Santiment emphasizes that sentiment metrics should not be the sole basis for decisions in such conditions; instead, they should be interpreted in the context of on-chain activity and price momentum to form a holistic view.
Despite the more constructive narrative around BTC, on-chain metrics offer a cautionary note. The indicators highlighted—transaction volume, active addresses, and network growth—are showing signs of deceleration. This pattern points to a market where a large share of participants is currently waiting on the sidelines, rather than actively expanding network usage or driving new adoption. While not inherently bearish, the data signals that any upside momentum may depend on a fresh round of sustained utility and user participation beyond mere price speculation.
Additionally, the Crypto Fear & Greed Index’s Extreme Fear reading reinforces the sense that risk tolerance remains constrained. In such an environment, even favorable price moves might be treated with scepticism by some investors who seek stronger proof of durable demand or clearer catalysts before committing additional capital. Taken together, the data landscape from Santiment — coupled with the price action and the on-chain signals — depicts a market undergoing a cautious recalibration rather than a wholesale paradigm shift toward new all-time highs.

TLDR:
- Robert Kiyosaki bought another full Bitcoin near $67K during recent market weakness.
- Bitcoin demand shifted above zero after months of persistent negative readings.
- Long-term holders are beginning to absorb new supply as selling pressure cools.
- The 21 million supply cap remains central to Bitcoin’s long-term scarcity narrative.
Bitcoin demand returned to positive territory as market participants reacted to fresh accumulation signals and renewed buying activity.
The shift comes as author Robert Kiyosaki disclosed another Bitcoin purchase during the recent price dip near $67,000.
At the same time, on-chain data shared by CryptosRus showed apparent demand moving above zero after months of weakness.
Together, these developments frame a market balancing short-term volatility against long-term supply constraints.
Robert Kiyosaki Adds to Holdings During Bitcoin Demand Shift
Robert Kiyosaki, author of Rich Dad Poor Dad, confirmed on X that he bought another full Bitcoin near $67,000. His statement came as Bitcoin traded around $68,000 during a period of price consolidation.
The purchase aligns with his repeated strategy of accumulating during downturns rather than selling into weakness.
In his tweet, Kiyosaki cited concerns about rising United States debt and potential large-scale dollar issuance. He argued that extensive monetary expansion would weaken the dollar and reinforce Bitcoin’s scarcity narrative. His comments referred to what he described as a coming “Big Print” by the Federal Reserve.
Kiyosaki also pointed to Bitcoin’s capped supply of 21 million coins. He stated that once the final Bitcoin is mined, the asset would stand stronger than gold. The supply ceiling remains central to discussions among long-term holders about Bitcoin demand.
Although Bitcoin has faced short-term price swings, Kiyosaki framed the decline as an opportunity. His approach reflects a broader accumulation thesis focused on fixed supply rather than daily volatility. The purchase adds to the ongoing debate over Bitcoin’s role as a hedge against currency expansion.
On-Chain Data Shows Bitcoin Demand Turning Positive
Separately, CryptosRus reported that Bitcoin demand has flipped positive after nearly three months of contraction.
Apparent demand moved to approximately +1,200 BTC following a prolonged negative stretch. In December, the metric had dropped to near -154,000 BTC, reflecting persistent distribution.
The data measures whether long-term holders are absorbing newly mined supply. When the reading remains deeply negative, excess supply typically weighs on price action. As the metric turns positive, selling pressure appears to ease.
According to the shared analysis, structural accumulation is beginning to re-emerge. Selling activity has cooled compared to previous months, supporting the recovery in Bitcoin demand.
However, market observers noted that a single positive print does not confirm a sustained trend.
Even so, historical patterns show that positive demand readings often precede stronger market phases. If the recovery persists, accumulation may gradually rebuild the foundation for price stability. For now, Bitcoin demand remains the central metric guiding near-term sentiment.


A long-running governance dispute inside the Aave ecosystem has escalated after a core engineering firm announced it will step aside.
Key Takeaways:
- Core developer BGD will not renew its contract, deepening a governance dispute between Aave DAO and Aave Labs.
- The conflict centers on plans to push users from Aave v3 to the upcoming v4 upgrade.
- The announcement rattled the market, with the Aave token dropping over 6%.
Bored Ghosts Developing (BGD), a software company contracted by Aave DAO to build and maintain key components of the lending protocol, said Friday it will not renew its agreement when the current term expires in April.
In a post on Aave’s governance forum, the team blamed Aave Labs, the company founded by protocol creator Stani Kulechov, for pushing a strategic shift tied to the upcoming Aave v4 upgrade.
Aave Developer Refuses to Support V3 Amid Push Toward V4
BGD said it could not continue work on Aave v3 while efforts were underway to steer users toward the new version.
“We believe even proposing this on the main revenue-maker & fully functional engine of Aave is borderline outrageous,” the group wrote.
The market reacted quickly. The Aave token fell more than 6% following the announcement.
Kulechov acknowledged the departure, writing on social media that the team had played a critical role in the protocol’s development.
BGD co-founder Ernesto Boado previously served as chief technology officer at Aave Labs.
“Aave V3 would not be what it is today without their contributions,” Kulechov said. Delegate Marc Zeller called the move “devastating,” noting that much of the platform’s revenue depends on BGD’s code.
Aave, with more than $26 billion in user deposits, is the largest decentralized finance lending protocol.
It is governed by tokenholders through a DAO structure, but tensions have been building for months over the role of Aave Labs and control of the brand.
Delegates recently sought to transfer brand assets, including naming rights, social media accounts and the aave.com website, from Labs to the DAO, though the proposal narrowly failed.
Labs later offered to redirect revenue from Aave-branded services to the DAO but tied the plan to recognizing Aave v4 as the project’s future technical foundation.
That clause alarmed BGD, which described Aave v3 as the ecosystem’s “crown jewel” and warned that altering lending parameters could pressure users to migrate prematurely.
Aave Labs Says V3 Will Remain Supported With No Immediate Migration
Aave Labs said there is no immediate timeline for migration and that v3 will remain supported. Kulechov added the company can assume maintenance duties if needed, and that the protocol will continue operating normally.
BGD’s contract ends April 1. The firm has offered a short-term transition arrangement to help the DAO find a replacement, marking the first tangible break in what was once viewed as one of DeFi’s most stable governance models.
Meanwhile, the US Securities and Exchange Commission formally concluded its multi-year investigation into the Aave Protocol without recommending any enforcement action.
The action ends nearly four years of regulatory uncertainty surrounding one of decentralized finance’s most widely used lending platforms.
The post Aave’s “Civil War” Claims First Casualty as Key Developer Walks Away appeared first on Cryptonews.


Is ETH finally going to rebound decisively, or will there be another crash to new lows.
Ethereum continues to struggle to reclaim the coveted $2,000 psychological level, as each attempt to do so results in a subsequent rejection and correction.
Popular analyst Ali Martinez weighed in on the asset’s recent performance and explained that it’s forming a bullish flag. However, there’s a major catch in his post, which could actually mean trouble ahead for ETH.
Ethereum $ETH is forming a bullish flag!
There’s just one twist… The chart is inverted. pic.twitter.com/Kb8eamJOMF
— Ali Charts (@alicharts) February 20, 2026
The “inverted” bullish flag shows that ETH has actually been in a consistent downtrend for weeks, but it has managed to compress within a tighter range more recently. Martinez believes a bigger move is in the making, but it could push the asset to new local lows of under $1,400.
Daan Crypto Trades also brought up ETH’s underwhelming performance as of late, indicating that the start of 2026 has been worse than how it moved in early 2025.
The analyst outlined hopes that the largest altcoin could finally rebound in the following few months, since the March-to-May period is historically more beneficial for it.
$ETH Has started the year of worse than last year so far. Historically, March through May are good months for ETH.
But we know how the market is all over the place recently and that there’s been pretty much zero correlation with other risk assets.
This makes for an awful… pic.twitter.com/CBAfLTduHx
— Daan Crypto Trades (@DaanCrypto) February 21, 2026
You may also like:
Another unfavorable development within the Ethereum investor ecosystem is the net flows within the spot ETH ETFs. Last week was in the red once again, with roughly $113 million leaving the funds.
On the opposite side, BitMine continues to accumulate. The Tom Lee-chaired company bought another 45,759 ETH last week, and now holds 4,371,497 tokens, valued at almost $8.7 billion. The company is down $8 billion on its Ethereum position, given its average entry cost of $3,820.
SECRET PARTNERSHIP BONUS for CryptoPotato readers: Use this link to register and unlock $1,500 in exclusive BingX Exchange rewards (limited time offer).

Disclosure: The views and opinions expressed here belong solely to the author and do not represent the views and opinions of crypto.news’ editorial.
I’ve watched enough liquidation cascades to know that prices move faster than narratives, timelines fill with confident takes, and even experienced traders start reacting to the loudest signal in the room. In those minutes, the core challenge is maintaining a coherent decision process when the environment tries to break it.
Summary
- Volatility exposes attention limits: When markets cascade, traders don’t just need predictions — they need compressed context. AI becomes the “second screen” that restores coherence under stress.
- Usage spikes during chaos, not calm: Data shows AI engagement surges around liquidation events, revealing that traders use it to filter noise and slow emotional reactions.
- Interpretation shapes market structure: As more traders rely on AI for real-time context, the quality of those interpretations can either dampen herding or amplify systemic risk.
That’s why the most meaningful shift I’m seeing is practical. Traders reach for AI during chaos because it compresses information, restores context, and slows emotional reaction time when the market speeds up. Engagement rises broadly over time, and then surges when markets stress-test attention. AI increasingly sits inside the crypto market structure, so those surges carry implications beyond product adoption.
When the screen turns red, attention becomes the bottleneck
During extreme volatility, traders struggle with context collapse. Price action, breaking news, on-chain chatter, funding changes, liquidation data, and social sentiment hit at once. The mental bandwidth required to interpret it all becomes the constraint.
A growing body of research links information overload to degraded decision accuracy under limited attention. A Federal Reserve paper lays out that mechanism and the measurable market effects.
In that environment, many traders gravitate toward tools that turn the flood into something legible. The demand shifts toward fast summaries, context comparisons, and clearer explanations of what has changed.
What tool usage time reveals about trader intent
Since August 2025, MEXC reports that 2.35 million users have used its AI trading suite, generating 10.8 million total interactions. Average daily active users reached about 93,000, with a single-day peak near 157,000; the conversational bot represented the largest share of activity in the suite.
Those totals matter, but the shape of usage matters more. Spikes cluster around stress events, when traders seek a compressed understanding quickly.
When the market accelerates, traders increase their use of AI as a lens for interpretation. That pattern also clarifies what traders mean when they say “AI helps me trade.” In volatile conditions, “help” often means filtering noise, summarizing the moving parts, and restoring situational awareness. The decision remains theirs, and the tool shapes what they can see in time.
AI as stress infrastructure for clarity and restraint
A lot of AI conversation in trading still centers on prediction. In lived market conditions, traders often value something else: coherence.
During volatility, a trader’s biggest risk is often cognitive. Stress narrows attention. Social proof grows louder. Rumor fills the gaps left by speed. Tools that provide fast context can lower the odds of impulsive action driven by panic and narrative momentum.
AI’s real utility shows up at the trader level. It can behave like an editor, distilling what’s known and flagging what’s uncertain — or helping the user anchor on relevant variables while the market tries to drag them into reaction.
That distinction matters because it draws a line between support and substitution. Support tools improve comprehension under stress. Substitution tools encourage delegation of judgment when uncertainty is highest.
Why this matters for market structure
Now zoom out. AI affects markets beyond retail-facing tools. AI adoption in capital markets spans trading and market intermediation, and carries risks tied to opacity, governance challenges, and correlated behavior when many systems respond similarly.
AI-driven trading can contribute to faster markets and higher volatility during stress, especially when strategies converge or react in similar ways to shocks. Crypto magnifies these dynamics. The market runs 24/7. Reflexive sentiment moves quickly. Professional market makers and retail traders often share the same venues and the same velocity of information. In that setting, exchange design and information presentation become part of how markets behave under pressure.
This is why I believe exchanges are increasingly evaluated on a broader definition of quality. Liquidity and fees remain essential, but users also judge the platform’s capacity to keep them oriented when volatility peaks. At scale, orientation becomes stability.
When large numbers of traders use AI tools during volatility to interpret the market in real time, the quality of those interpretations shapes behavior. A clearer context reduces crowding into the same rumors and overreactions. Poor context can accelerate herding, especially when uncertainty is highest.
The next phase of AI in crypto markets is accountability and provenance
If traders use AI primarily for interpretation during stress, the next phase is about accountability. Accountability starts with making it obvious what sources an insight relies on, what is confirmed versus inferred, and what the tool cannot responsibly conclude in real time. Analysts explicitly frame market-wide risks that can emerge from broad AI adoption, especially around correlated behavior and stress dynamics.
It also changes how AI-powered features should be framed. Tools that present themselves as authoritative forecasts can encourage over-delegation at the exact moment when humility and restraint matter most. Tools that emphasize context can encourage deliberation without pretending to eliminate uncertainty.
As AI spreads through trading and market infrastructure, monitoring and governance need to keep pace because systemic risks reveal themselves most sharply during stress.
AI is becoming the translation layer for speed
The industry often talks about AI as a trader. Many users already treat it as a translator. When markets break, traders lean on AI to convert noise into signal, speed into digestible context, and emotional pressure into something closer to restraint. That’s why adoption rises during volatility, and that’s why the stakes are bigger than feature engagement charts suggest.
With more participants relying on similar kinds of real-time interpretation under stress, AI shapes how the crowd understands events. At that point, AI influences behavior at scale, and behavior at scale becomes market structure.
Disclosure: This article does not represent investment advice. The content and materials featured on this page are for educational purposes only.

TLDR:
- Bitcoin’s cycle bottoms have grown shallower each time, falling from -92.7% in 2011 to -68.5% in 2022.
- BTC is currently 47% below its October 2025 ATH of $126K, with Fear and Greed at single digits.
- Green drawdown days near all-time highs are growing faster than red days for the first time in Bitcoin’s history.
- Comparing the 2025 selloff to 2018 may be the wrong framework, as structural data points to a maturing asset.
The latest Bitcoin selloff has renewed fears of a prolonged bear market, but historical drawdown data suggests this cycle may not follow the same path as those before it.
Bitcoin currently trades roughly 47% below its October 2025 all-time high of $126,000. Fear and Greed readings sit at single digits.
Yet 15 years of drawdown data, when mapped against the present, paints a different picture from what many traders are expecting.
Past Cycles Carried Far Deeper and Longer Drawdowns
In 2011, Bitcoin collapsed 92.7% from its peak. Nearly every day of its young existence was spent deep in drawdown territory.
The 2013–2015 cycle followed with a 72% decline, adding over 1,500 days of brutal losses to the historical record.
By 2017, Bitcoin had logged more than 2,500 drawdown days, and red still dominated the distribution chart. The 2018 bear market then pushed losses to 78.4%, reinforcing the same deep correction band between -60% and -80%. Those cycles defined what analyst Sminston With described as “the old Bitcoin.”
The critical pattern across all those cycles, however, is one of gradual improvement. Each successive bottom came in shallower than the one before it.
The sequence runs as follows: -92.7%, -87%, -84%, -77%, and then -68.5% in 2022. That consistent upward shift in the floor is not coincidental.
The current selloff, sitting at approximately -47%, has not yet approached any of those prior cycle bottoms. That alone separates this moment from what traders experienced in 2018 or 2015, even if sentiment feels comparable.
Structural Shifts in How Bitcoin Spends Its Time
After the 2021 bull cycle, a measurable change appeared in the drawdown distribution. Green bars, representing days spent within 0% to -15% of an all-time high, began growing at a faster rate than any prior period. Bitcoin was simply spending more time near its highs than it ever had before.
Sminston With noted that “green-white oscillations are replacing the deep red plunges,” referring to the shift away from the severe, prolonged corrections that once dominated Bitcoin’s history.
The transition zone between -15% and -35% has also grown, with Bitcoin spending close to 90 days there following the October 2025 peak.
This does not mean further downside is impossible. Some market participants are still calling for $40,000 or even $25,000.
However, the data shows that Bitcoin’s worst drawdowns have been getting structurally shallower, cycle after cycle, and the time spent near all-time highs has been growing.
The question the data raises is straightforward. If each cycle bottom has come in less severe than the last, and if Bitcoin is spending more time in the green regime than ever before, then comparing 2025 to 2018 may simply be the wrong framework for this moment.
Aside from ETC, the other notable gainers today include FIL, NEAR, and ARB.
Bitcoin’s price felt some volatility after yesterday’s developments on the tariff front, but ultimately recovered from the dip and now sits around $68,000.
Most larger-cap alts are with minor gains today, while DOT, UNI, and NEAR have emerged as the top performers from this cohort of assets.
BTC Above $68K
The primary cryptocurrency rallied unexpectedly last weekend after it defended the $65,000 support. The bulls initiated a leg up that drove the asset to almost $71,000 for the first time in about a week. However, that was another short-lived attempt, and BTC quickly started to lose value during the business week.
It was stopped once again at $70,000 on Monday, and the next few days brought some more pain. The aulmination took place on Thursday when the bears pushed bitcoin down to $65,600. Its reaction was positive at this point, and it quickly rebounded by three grand.
More volatility ensued on Friday after the US Supreme Court ruled that some of Trump’s tariffs were illegal. The POTUS responded immediately and imposed an additional 10% global tariff on top of the existing ones. BTC dropped by $2,000 in minutes, but recovered just as quickly, and now trades above $68,000 once again.
Its market capitalization has climbed above $1.360 trillion, while its dominance over the alts on CG stands close to 56.5%.

ETC Pumps
ETH, XRP, SOL, and TRX have all posted minor gains of under 1% daily. As a result, Ethereum continues to struggle below $2,000, while XRP is close to $1.45. BCH and HYPE have marked more impressive gains from the larger caps.
Even more impressive price increases come from DOT, UNI, and NEAR, with gains of up to 8% in the case of Near Protocol’s native token. Nevertheless, Ethereum Classic has soared the most today, rocketing by 16% to $9.7. FIL and ARB follow suit.
The total crypto market cap has reclaimed the $2.4 trillion mark on CG and is up to $2.415 trillion as of press time.

SECRET PARTNERSHIP BONUS for CryptoPotato readers: Use this link to register and unlock $1,500 in exclusive BingX Exchange rewards (limited time offer).
Disclaimer: Information found on CryptoPotato is those of writers quoted. It does not represent the opinions of CryptoPotato on whether to buy, sell, or hold any investments. You are advised to conduct your own research before making any investment decisions. Use provided information at your own risk. See Disclaimer for more information.
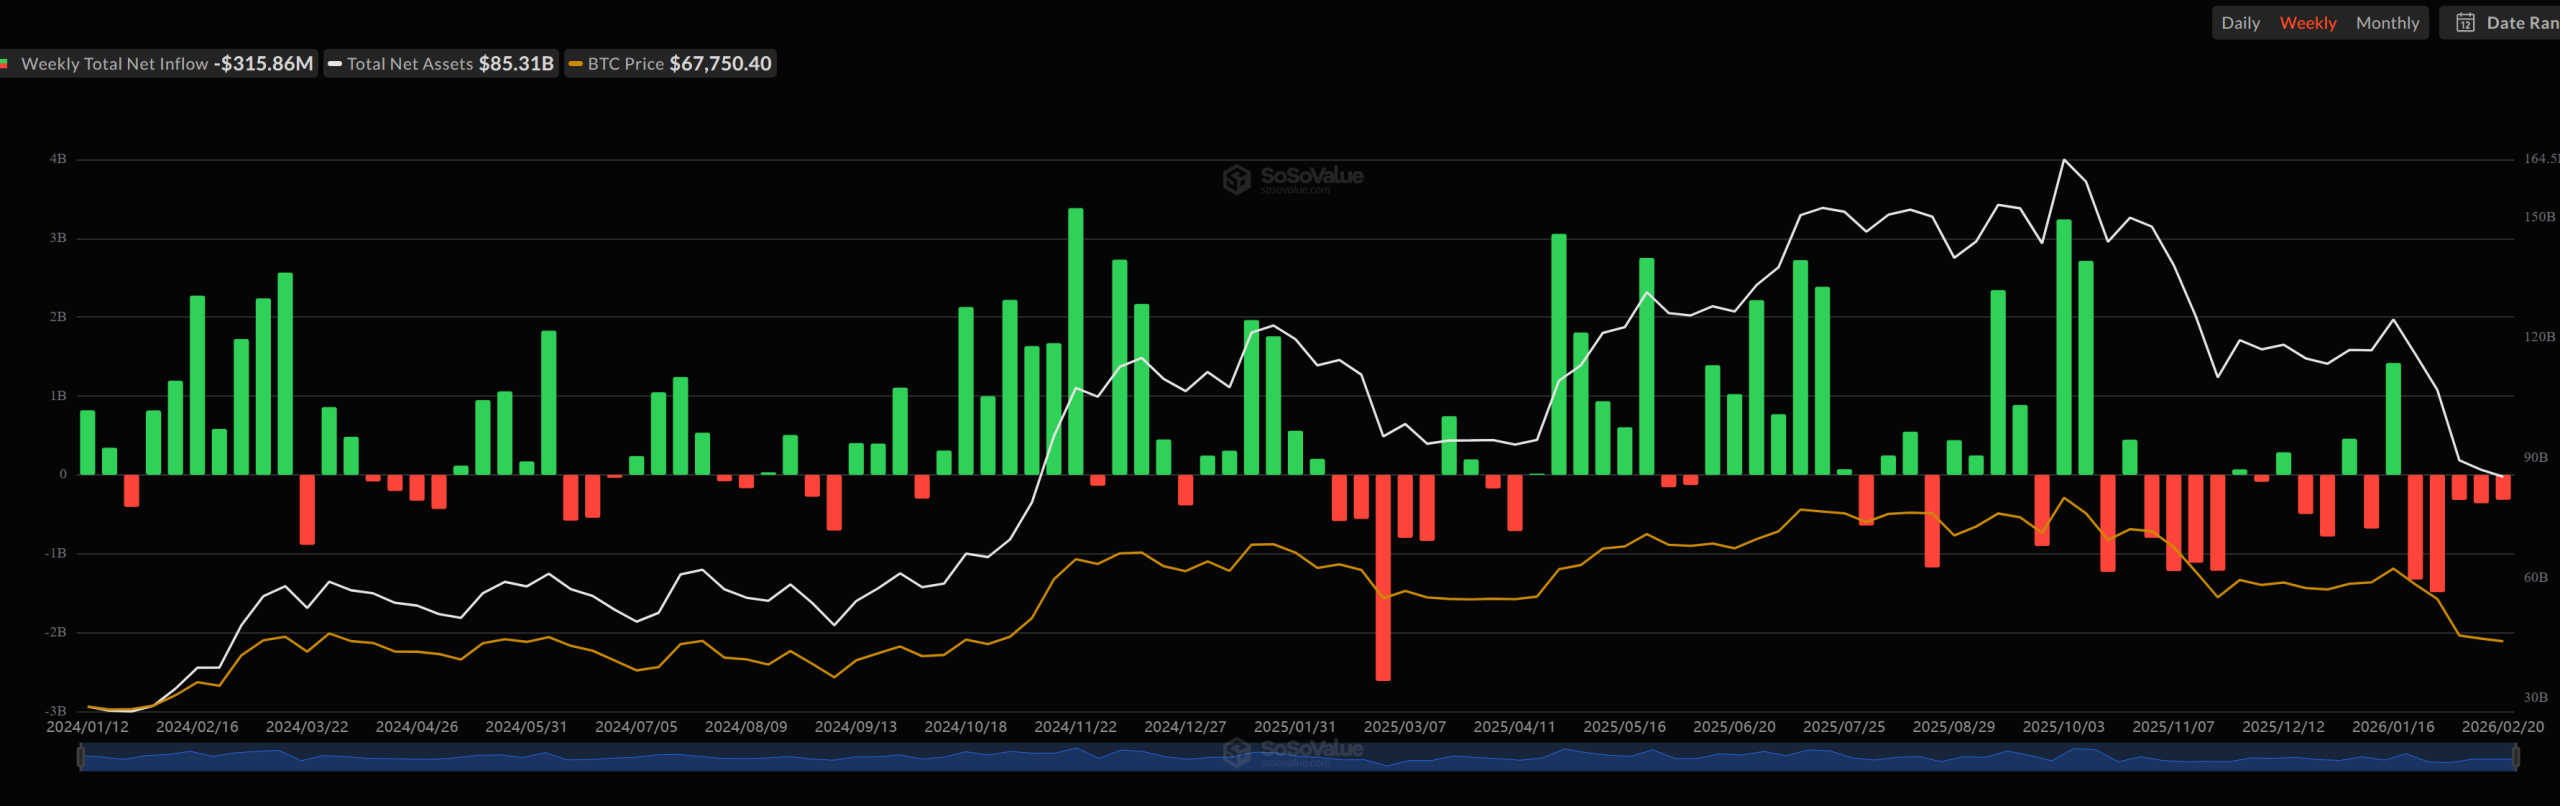
US spot Bitcoin ETFs have extended a five-week stretch of net outflows, with investors pulling roughly $3.8 billion from the products across the period. The latest weekly snapshot shows continued pressure even as inflows emerged on select days, underscoring a broader de-risking phase among institutional holders. In aggregate, spot Bitcoin ETFs have drawn about $54.01 billion in net inflows since inception, while total assets sit around $85.31 billion, a share of roughly 6.3% of Bitcoin’s overall market capitalization. Ether ETFs have mirrored the mood on the downside, posting a fifth consecutive week of net selling, even as pockets of buying appeared on specific dates.
Key takeaways
- Five consecutive weeks of net outflows from US spot Bitcoin ETFs, totaling about $3.8 billion, with the trend anchored in broader risk-off sentiment.
- The week ended Jan. 30 marked the largest single pull, about $1.49 billion, illustrating how quickly allocations can swing when macro headlines intensify.
- Last week saw mixed activity, including roughly $315.9 million in net outflows but with some days posting inflows, indicating evolving but uneven demand.
- Ether (ETH) ETFs followed a similar pattern, recording net outflows of around $123.4 million for the week, even as selective daily inflows appeared.
- Since launch, spot Bitcoin ETFs have accumulated approximately $54.01 billion in net inflows, with total assets near $85.31 billion, representing about 6.3% of Bitcoin’s market capitalization.
Sentiment: Bearish
Price impact: Negative. The persistent outflows suggest selling pressure from institutional reallocations and risk-off positioning, even as occasional inflows temper the pace.
Market context: The data arrive as traders weigh macro developments, including geopolitical dynamics and tariff news, which have sharpened risk-off tendencies across asset classes. Amid a fragile liquidity backdrop, crypto markets remain sensitive to headline risk and shifting expectations for central bank policy.
The latest numbers align with a broader pattern observed in recent weeks: institutional de-risking rather than a wholesale loss of interest in crypto assets. Vincent Liu, chief investment officer at Kronos Research, framed the outflows as evidence that portfolio managers are trimming risk exposures rather than exiting the asset class altogether. “The withdrawals reflect de-risking in response to geopolitical tensions and macro uncertainty,” Liu told this publication. “Market inflows will be dependent on macro events like incoming Thursday’s initial jobless claims, as weaker data could revive expectations for future rate cuts and help support sentiment currently at 14 extreme fear on the crypto fear and greed index.”
Why it matters
The sustained outflows from spot Bitcoin ETFs highlight a meaningful dynamic in how institutions approach crypto exposure during periods of heightened macro risk. While the asset class still sits within a broader allocation framework for many long-term investors, near-term positioning appears to be guided by a careful risk assessment rather than aggressive capitalization. The fact that outflows are occurring across multiple weeks, rather than isolated incidents, signals a rebalancing mindset rather than a wholesale retreat from crypto.
From a market structure perspective, the outflows matter because ETFs are a primary on-ramp for many traditional investors. They offer familiar mechanics and regulated exposure, which means the behavior of ETF flows can influence price discovery, liquidity, and volatility around spot markets. The correlation with macro headlines — such as jobless claims data or trade developments — underscores how crypto markets remain part of a global risk-off narrative, even as they retain the potential for high beta moves when risk appetite returns.
Meanwhile, the persistence of inflows on certain days shows there is ongoing, if uneven, demand for crypto exposure at the institutional level. The net inflows since inception remain sizable, underscoring that crypto remains a fixture in diversified portfolios for many buyers who still view the space as part of a longer-term thematic thesis. The market is watching whether a shift in macro cues — perhaps softer data or signs of policy accommodation — could unlock a renewed wave of ETF buying, particularly as the crypto fear and greed index signals a more cautious sentiment among traders.
What to watch next
- Upcoming macro data releases, including initial jobless claims, which could influence near-term risk appetite and ETF flows.
- Next-week updates on spot ETF allocations and whether any positive sessions in Bitcoin or Ether ETFs reverse the five-week downtrend.
- Regulatory and policy developments that alter the risk-reward calculus for regulated crypto exposure.
- Any notable shifts in long/short positioning among institutions that could hint at a broader reallocation cycle.
Sources & verification
- SoSoValue data on weekly net flows for US spot Bitcoin and Ether ETFs (spot ETF fund flow page).
- Vincent Liu, Kronos Research CIO, remarks on de-risking and macro drivers in an interview addressing ETF outflows.
- Bloomberg reporting on net inflows for Bitcoin ETFs despite recent outflows (as referenced in related analyses).
- Historical context of cumulative ETF inflows and total assets for spot Bitcoin ETFs since launch.
Market reaction and near-term outlook for spot ETF flows
Bitcoin (CRYPTO: BTC) and Ether (CRYPTO: ETH) exchange-traded products have been navigating a delicate balance between risk-off dynamics and a persistent demand for regulated crypto exposure. The five-week streak of net outflows from US spot Bitcoin ETFs, totaling around $3.8 billion, reflects a market where institutions are recalibrating risk rather than retreating from the asset class, according to market observers. The weekly data show a notable swing within the period: a peak weekly outflow of approximately $1.49 billion in the week ending Jan. 30, underscoring how quickly sentiment can shift in response to macro headlines. While there were days of inflows — including a Friday that added roughly $88 million — the week closed with a negative tilt, reinforcing the overarching trend toward de-risking during periods of heightened uncertainty.
The Ether ETF picture mirrors Bitcoin’s, with five consecutive weeks of net selling and a weekly tally that reached about $123.4 million in outflows last week. There were pockets of buying on particular days, such as inflows near $48.6 million on Feb. 17 and $10.3 million on Feb. 13, but these gains were not enough to reverse the cumulative downward trajectory of flows for Ether, reflecting a broader risk-off environment that has weighed on top-tier crypto exposures across the board. The divergence between intraday inflows and the week’s net negative outcome highlights how price reaction and liquidity conditions can differ from calendarized flow data, particularly in markets that operate under tighter liquidity conditions and heightened counterparty risk awareness.
Beyond the short-term movement, the longer-term context remains constructive in a cumulative sense. Spot Bitcoin ETFs have drawn about $54.01 billion in net inflows since launch, while total assets stand near $85.31 billion, representing roughly 6.3% of Bitcoin’s market capitalization. That scale indicates that regulated products continue to play a meaningful role in channeling institutions’ crypto exposure into traditional portfolios, even as daily flows swing with macro headlines. Some observers point to the possibility that macro catalysts could reignite inflows; others warn that the current risk-off backdrop could persist until clearer signals emerge from the policy front or labor market data. In any case, the overall trajectory is one of gradual, regulated access to exposure, rather than rapid, speculative allocation. As markets await further clarifications on policy and macro data, the path of ETF flows will likely remain a barometer of institutional appetite for regulated crypto assets.
What it means for users and investors
The ongoing flow dynamics have practical implications for users ranging from long-term holders to active traders. For investors seeking regulated exposure, the persistence of outflows may imply tighter liquidity on the ETF side in the short term, potentially widening bid-ask spreads on pullback days. For builders and ecosystem participants, the data highlight the importance of robust on-chain analytics and transparent product disclosures, helping users navigate a landscape where inflows and outflows can diverge from underlying price action for extended periods.
On the regulatory front, the resilience of spot ETF products suggests that, for a broad segment of the market, the regulated vehicle remains an attractive conduit for exposure. However, the macro overlay remains the primary determinant of flows in the near term. The crypto markets are in a phase where risk tolerance is sensitive to data surprises and geopolitical developments, reinforcing the idea that ETF flows are not a separate universe from macro risk; they are a lens through which investors adjust positions as incentives and risks shift.
What to watch next
- Upcoming macro headlines, especially labor market data, that could tilt sentiment toward or away from risk assets.
- Any shifts in ETF flow data in the following weeks that indicate a renewed appetite for regulated crypto exposure.
- Regulatory developments that could affect the structure, liquidity, or accessibility of spot ETFs in the United States.
Sources & verification
- SoSoValue ETF flow pages documenting weekly and cumulative spot Bitcoin and Ether ETF flows.
- Vincent Liu’s examination of de-risking and macro drivers for ETF outflows (Kronos Research).
- Bloomberg references to net inflows in Bitcoin ETFs against the backdrop of recent outflows.

The Netherlands Gambling Authority has moved against prediction markets platform Polymarket, ordering its Dutch affiliate, Adventure One, to stop offering wagering services to residents without a permit.
Key Takeaways:
- Dutch regulators ordered Polymarket’s affiliate to halt operations for offering unlicensed betting to residents.
- Authorities said prediction market wagers are illegal in the Netherlands, even for licensed gambling operators.
- The case reflects wider global regulatory pressure on event-based contracts and prediction platforms.
In a notice released Tuesday, the regulator said the company must “cease its activities immediately” or risk penalties of up to $990,000.
Officials said the platform allowed users in the Netherlands to place bets prohibited under national law, including contracts tied to local elections, and had failed to respond to earlier requests from authorities to address the issue.
Prediction Markets Not Permitted Under Dutch National Gambling Rules
“Prediction markets are on the rise, including in the Netherlands,” said Ella Seijsener, the authority’s director of licensing and supervision.
She added that such operators provide wagers that are not allowed in the Dutch market under any circumstances, even for licensed gambling companies.
Earlier this year, the company’s chief legal officer Neal Kumar said the firm was open to discussions with regulators while US federal courts consider questions over oversight of prediction markets.
The dispute mirrors broader regulatory tension around event-based contracts. In the United States, platforms offering similar products have drawn scrutiny from state authorities, many of which argue the services resemble sports betting.
At the same time, leadership at the Commodity Futures Trading Commission has pushed back against state intervention, asserting federal jurisdiction over prediction market activity.
BREAKING: Dutch financial daily FD reports that @Polymarket has been officially banned in the Netherlands — PredictFolio (@PredictFolio) February 17, 2026

The regulator warns that failure to cease services for Dutch users could result in fines of €420,000–€840,000 per week.https://t.co/gZ7rT04401
The enforcement action also comes as Dutch lawmakers debate tighter rules affecting digital assets.
The country’s House of Representatives recently advanced a proposal introducing a 36% capital gains tax on certain investments, a measure expected to cover cryptocurrencies if enacted.
Should the Senate approve the plan, the tax could take effect as early as 2028.
For now, the regulator’s order places Polymarket’s operations in the Netherlands on hold, highlighting how rapidly growing prediction markets are colliding with national gambling frameworks across multiple jurisdictions.
Dutch Indirect Crypto Investments Hit €1.2B
As reported, Dutch exposure to cryptocurrency through financial securities has grown rapidly over the past five years, reaching about €1.2 billion by October 2025, according to De Nederlandsche Bank (DNB).
The increase largely reflects rising prices of major digital assets rather than a surge of new investor money.
Holdings stood at roughly €81 million at the end of 2020, showing how valuation gains have expanded crypto-linked investments across households, institutions and companies.
Despite the jump, direct ownership of cryptocurrencies remains relatively limited for many investors.
Even with the growth, crypto securities represent only about 0.03% of the Netherlands’ overall investment market, indicating traditional assets still dominate portfolios.
Last year, Dutch crypto firm Amdax raised €30 million ($35 million) to launch Amsterdam Bitcoin Treasury Strategy (AMBTS), a dedicated Bitcoin treasury company that plans to accumulate up to 1% of the total BTC supply, or roughly 210,000 Bitcoin.
The post Dutch Regulator Orders Polymarket to Halt Unlicensed Betting Operations appeared first on Cryptonews.
US spot Bitcoin exchange-traded funds (ETFs) have posted five consecutive weeks of net outflows, with investors pulling roughly $3.8 billion from the products over the period.
During last week, the funds recorded about $315.9 million in net outflows, according to data from SoSoValue. The biggest weekly withdrawal during this 5-week streak occurred in the week ending Jan. 30, when spot Bitcoin (BTC) ETFs recorded about $1.49 billion in net outflows.
The net weekly outflows come as some sessions posted inflows. On Friday, Bitcoin ETFs saw about $88 million in inflows, but they were outweighed by larger redemption days earlier in the week. Notable withdrawals included more than $410 million on Feb. 12, along with additional negative sessions from Feb. 17 through Feb. 19, leaving the weekly total firmly negative.

As of Friday, spot Bitcoin ETFs have accumulated roughly $54.01 billion in net inflows since launch. Total net assets stood near $85.31 billion, representing approximately 6.3% of Bitcoin’s overall market capitalization.
Related: Bitcoin ETFs shed $166M as BTC heads for worst start in years
Institutional de-risking drives Bitcoin ETF outflows
Recent withdrawals from spot Bitcoin ETFs appear tied to institutional positioning rather than a loss of long-term interest in the asset, according to Vincent Liu, chief investment officer at Kronos Research. He said the outflows reflect portfolio de-risking as geopolitical tensions and broader macro uncertainty rise.
Liu added that flows may remain unstable in the near term. Escalating trade disputes and tariff developments have reinforced a risk-off environment across markets, leaving digital assets sensitive to macro headlines.
“Market inflows will be dependent on macro events like incoming Thursday’s initial jobless claims, as weaker data could revive expectations for future rate cuts and help support sentiment currently at 14 extreme fear on the crypto fear and greed index,” he told Cointelegraph.
Related: Bitcoin ETFs still sit on $53B in net inflows despite recent outflows: Bloomberg
Spot Ether ETFs see outflows
Spot Ether (ETH) ETFs have also faced sustained selling pressure, with flows turning negative across the past five weeks as investors trimmed exposure to the second-largest cryptocurrency.

During last week, the funds recorded about $123.4 million in net outflows, according to SoSoValue data. The weekly losses came despite occasional positive sessions. Ether ETFs posted inflows on several days, including about $48.6 million on Feb. 17 and $10.3 million on Feb. 13, but they were outweighed by heavier selling earlier in the week.
Magazine: Bitcoin may take 7 years to upgrade to post-quantum — BIP-360 co-author

Brian Armstrong Makes SHOCKING XRP Announcement! You Won’t Believe This!

Noughties reality TV star announces cervical cancer diagnosis | Lifestyle

How Specialist Services Shape Business Growth in Competitive Local Markets


-

 Video5 days ago
Bitcoin: We’re Entering The Most Dangerous Phase
-

 Tech6 days ago
Luxman Enters Its Second Century with the D-100 SACD Player and L-100 Integrated Amplifier
-

 Crypto World4 days ago
Can XRP Price Successfully Register a 33% Breakout Past $2?
-

 Sports4 days ago
GB's semi-final hopes hang by thread after loss to Switzerland
-

 Fashion17 hours ago
Weekend Open Thread: Boden – Corporette.com
-

 Video1 day ago
XRP News: XRP Just Entered a New Phase (Almost Nobody Noticed)
-
 Tech4 days ago
The Music Industry Enters Its Less-Is-More Era
-

 Business4 days ago
Infosys Limited (INFY) Discusses Tech Transitions and the Unique Aspects of the AI Era Transcript
-

 Entertainment3 days ago
Kunal Nayyar’s Secret Acts Of Kindness Sparks Online Discussion
-

 Video4 days ago
Financial Statement Analysis | Complete Chapter Revision in 10 Minutes | Class 12 Board exam 2026
-

 Tech3 days ago
Retro Rover: LT6502 Laptop Packs 8-Bit Power On The Go
-
 Sports2 days ago
Clearing the boundary, crossing into history: J&K end 67-year wait, enter maiden Ranji Trophy final | Cricket News
-

 Entertainment3 days ago
Dolores Catania Blasts Rob Rausch For Turning On ‘Housewives’ On ‘Traitors’
-

 Business3 days ago
Tesla avoids California suspension after ending ‘autopilot’ marketing
-
 NewsBeat6 days ago
The strange Cambridgeshire cemetery that forbade church rectors from entering
-

 Crypto World3 days ago
WLFI Crypto Surges Toward $0.12 as Whale Buys $2.75M Before Trump-Linked Forum
-

 Politics4 days ago
Eurovision Announces UK Act For 2026 Song Contest
-
 NewsBeat6 days ago
Man dies after entering floodwater during police pursuit
-

 Crypto World2 days ago
83% of Altcoins Enter Bear Trend as Liquidity Crunch Tightens Grip on Crypto Market
-

 NewsBeat7 days ago
UK construction company enters administration, records show