

Crypto World
Bitcoin Price Metric Reveals $122K Average Return Over 10 Months
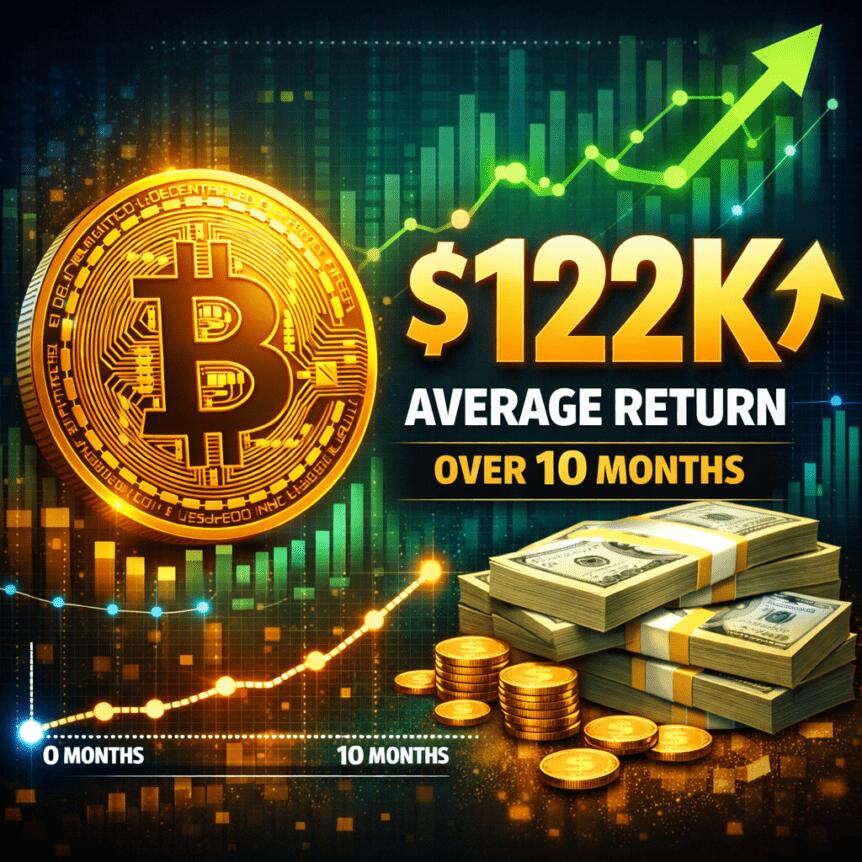
Bitcoin has drawn renewed attention from traders and analysts as data-driven signals suggest a potential upside path into 2027, even amid a recent stretch of muted sentiment. An informal metric developed by market economist Timothy Peterson points to an 88% probability that BTC/USD will be higher by early 2027, a claim grounded in monthly patterns dating back to 2011. If history repeats, the model implies a price near $122,000 per coin within ten months, positioning Bitcoin for what some view as an “average return” rather than a rapid meteoric rise. The narrative sits alongside a broader chorus of bullish commentary from major banks and market observers who continue to think Bitcoin can stage a substantial recovery in the coming year, even as risk-off currents persist across traditional markets.
Key takeaways
- An informal metric from Timothy Peterson suggests a roughly 88% chance BTC/USD will be higher by early 2027, based on historical frequency of positive months.
- Under this scenario, Bitcoin could reach about $122,000 per coin within ten months, which would equate to an “average return” given past performance since 2011.
- Despite a period of underperformance since late 2025, bullish forecasts remain active, with analysts highlighting inflection-point dynamics rather than precise price targets.
- Bernstein has surfaced a bulls-case target of around $150,000 for Bitcoin, underscoring continued institutional interest in a multiyear rally.
- Wells Fargo’s note flags potential capital inflows into Bitcoin and equities totaling about $150 billion by the end of March, suggesting further speculative appetite.
Tickers mentioned: $BTC
Sentiment: Bullish
Price impact: Positive. The convergence of upbeat forecasts and improving sentiment could support upside momentum for Bitcoin in the near term.
Trading idea (Not Financial Advice): Hold. While the setup leans toward upside, volatility and macro risk warrant a cautious stance until clearer directional signals emerge.
Market context: The market has been digesting a mix of technical signals and macro influences, with a notable divergence between short-term momentum and longer-horizon forecasts. The discussion around Bitcoin’s path centers on whether historical patterns can translate into a sustained rally despite periodic pullbacks and risk-on/risk-off cycles that characterize crypto liquidity and funding conditions.
Why it matters
The ongoing debate about Bitcoin’s trajectory sits at the intersection of on-chain behavior, macro liquidity, and evolving investor psychology. If Peterson’s 88% odds hypothesis holds, it would suggest that the crypto market has entered a phase where repeated positive monthly readings can precede a meaningful upside. The reference point of $122,000, anchored to a decade of price data, provides a tangible milestone that traders and risk managers can monitor against volatility spikes and pullbacks.
Institutional interest remains a persistent tailwind for the bull case. Bernstein’s recent analysis arguing for a $150,000 target signals that large-scale wealth and professional funds continue to view Bitcoin as a potential long-horizon hedge and return driver, not merely a speculative asset. At the same time, Wells Fargo’s note on potential inflows—citing a $150 billion expansion into Bitcoin and equities by the end of March—highlights the interplay between crypto markets and traditional asset streams. The combination of high-conviction targets and expected capital inflows underscores a continued re-pricing dynamic in which narrative and data-driven signals reinforce each other.
Nonetheless, the mood within the market remains fractured. Peterson’s own work cautions that the metric he discusses emphasizes inflection points rather than precise targets, and a survey cited in the report points to prevailing bearish sentiment in parts of the crypto ecosystem. The tension between a favorable long-term thesis and a wobbling near-term momentum is typical of a market navigating a transition from macro-tilted risk-off periods to periods of renewed speculative interest. In other words, the narrative is compelling, but the path to a sustained rally is likely to be choppy, with volatility continuing to reflect shifting risk appetites across both crypto and broader financial markets.
Beyond the headline forecasts, the story includes practical market dynamics that have featured in recent reporting. For example, even as some analysts flag upside potential, others point to recent price patterns and the episodic nature of Bitcoin’s momentum. There is also recognition that positive data points can coexist with caution about timing—investors are watching for concrete catalysts that could shift the trajectory from consolidation to a more pronounced up-leg. The crypto ecosystem has also seen episodes where large holders or “whales” participate in accumulation, offsetting sell pressure and contributing to sporadic surges in price. This pattern of selective accumulation has been noted in related coverage and remains a factor that traders monitor as they assess the probability of a sustained breakout. See for example commentary highlighting whale-driven V-shaped accumulation as a counterweight to sell-offs.
In this backdrop, the narrative remains nuanced: the macro backdrop is not uniformly bullish, but there is a persistent belief among a subset of market observers that Bitcoin’s longer-run risk-reward profile justifies continued interest. The expectation is that if the next few quarters deliver supportive price action and a stream of positive signals—on-chain activity, liquidity, and institutional participation—the market could sustain an upward drift that aligns with the optimism expressed by Bernstein and others. Meanwhile, the data points that have historically preceded rallies—such as a persistent sequence of higher months and improving on-chain metrics—will continue to be scrutinized as potential inflection signals rather than definitive price triggers.
Additional context comes from the broader conversation around crypto sentiment and risk appetite. The market’s mood can swing rapidly in response to macro news, regulatory developments, or shifts in funding conditions on major exchanges. The 2021–2022 era of rapid price appreciation followed by sharp corrections has conditioned market participants to weigh upside potential against the risk of retracements. In that sense, Peterson’s framework offers a lens to identify potential turning points, while Bernstein’s and Wells Fargo’s forecasts remind investors that price targets are only one piece of a complex puzzle. Investors facing this environment are likely to weigh multiple signals—price momentum, on-chain activity, institutional commentary, and macro indicators—before committing to meaningful exposure shifts.
Looking ahead, the interplay between these forecasts, market sentiment, and actual price action will be pivotal. The crypto market has shown resilience when liquidity returns and risk tolerance improves, yet the path to a durable rally requires sustained participation from both retail and institutional players. As analysts continue to publish scenarios that hinge on historical patterns repeating, traders should remain attentive to contingency setups, including potential catalysts that could accelerate or pause the rally. The balance of probabilities remains cautiously bullish, anchored by data-driven signals and the prospect of deeper institutional engagement, but never free of risk.
Sources and verifications discussed in this article include a pair of data-driven signals and commentary from market researchers and financial institutions, along with linked materials that capture the ongoing discourse around Bitcoin’s price path.
What to watch next
- Monitor BTC price action toward the $122,000 target within the next ten months and observe how monthly performance aligns with Peterson’s frequency-based metric.
- Track updates to Bernstein’s price scenario and Wells Fargo’s capital-flow expectations for Bitcoin and related equities, including any new investor communications or research notes.
- Watch for shifts in market sentiment as measured by surveys or social-media signals tied to crypto views, particularly around inflection-point indicators.
- Observe on-chain accumulation patterns, especially among large holders, as reported in relevant analyses and linked research notes.
Sources & verification
- Timothy Peterson’s X posts detailing the 88% odds via a trailing-month metric measuring frequency of positive months (data goes back to 2011).
- Bernstein’s analysis citing a $150,000 BTC target and framing Bitcoin’s decline as the “weakest bear case” in history.
- Wells Fargo’s note on potential $150 billion in inflows into Bitcoin and stocks by the end of March, highlighting growth in speculative participation.
- Reports and data on whale accumulation dynamics and related on-chain signals referenced in coverage surrounding V-shaped accumulation patterns.
- Historical discussion of Bitcoin price targets and market sentiment within the crypto narrative and linked market commentary.
Bitcoin momentum and the road ahead
Bitcoin (CRYPTO: BTC) has drawn renewed attention from traders and analysts as data-driven signals suggest a potential upside path into 2027, even amid a recent stretch of muted sentiment. An informal metric developed by market economist Timothy Peterson points to an 88% probability that BTC/USD will be higher by early 2027, a claim grounded in monthly patterns dating back to 2011. If history repeats, the model implies a price near $122,000 per coin within ten months, positioning Bitcoin for what some view as an “average return” rather than a rapid meteoric rise. The narrative sits alongside a broader chorus of bullish commentary from major banks and market observers who continue to think Bitcoin can stage a substantial recovery in the coming year, even as risk-off currents persist across traditional markets.
The analysis frames its outlook around a few core ideas. First, the notion that a substantial portion of monthly price action over the past two years has been positive—roughly half—creates a probabilistic backdrop for a potential upward swing. Peterson explains that his metric measures frequency, not magnitude, so it could still register a down-month even in a broader uptrend. Still, he notes the utility of the approach for identifying inflection points that might precede a new phase of price appreciation. In a post on X, he underscored that the method is informal but helpful for spotting transitions in momentum.
Second, a separate line of bullish thinking continues to gain attention from institutions. Bernstein’s research team has argued for a substantial upside with a $150,000 target, framing Bitcoin’s recent drawdown as a potential setup for a longer-term rebound. This view aligns with a segment of the market that sees Bitcoin as a multiyear hedging asset whose risk premium may be re-rated as liquidity conditions improve and macro narratives shift. Meanwhile, Wells Fargo’s note projects sizable inflows into Bitcoin and equities by the end of March, underscoring the belief that a broader wave of savings and speculative capital could re-enter risk assets in the near term. Analysts there highlighted the appeal of “YOLO” style trades in a climate of improved liquidity and improving sentiment among some investor cohorts.
Despite the sense of optimism, the market remains cautious. Peterson’s own work cautions that while the metric can help identify inflection points, it does not guarantee a particular price path. The broader sentiment picture includes pockets of bearishness, as evidenced by surveys and on-chain commentary, which means that buyers should be prepared for a choppy advance rather than a straight line higher. The fact that bullish scenarios coexist with continued caution is a reminder that Bitcoin’s price trajectory will be influenced by a blend of on-chain dynamics, macro trends, and evolving investor appetite.
As the calendar moves toward early 2027, the most pertinent questions revolve around whether the momentum signals can translate into sustained price gains and whether the demand side—institutional capital, wealth managers, and retail participants—will sustain a higher level of engagement. The references to the Bernstein and Wells Fargo analyses, coupled with Peterson’s frequency-based perspective, provide a framework for assessing how different catalysts—ranging from improved liquidity to renewed risk-appetite cycles—could align to support a longer-term uptrend. In a market where headlines oscillate between caution and confidence, the likely path forward is not a single, definitive move but a sequence of incremental advances punctuated by periods of consolidation. For traders and long-term holders alike, the question remains: where does the next decisive breakout come from, and how will risk controls shift as Bitcoin tests higher price levels?
For readers seeking a direct line of verification, the key pieces of evidence in this discourse include Peterson’s analysis shared on X, Bernstein’s bullish scenario, and Wells Fargo’s inflow projections, all of which sit alongside ongoing reporting on on-chain activity and macro risk signals that influence market direction.

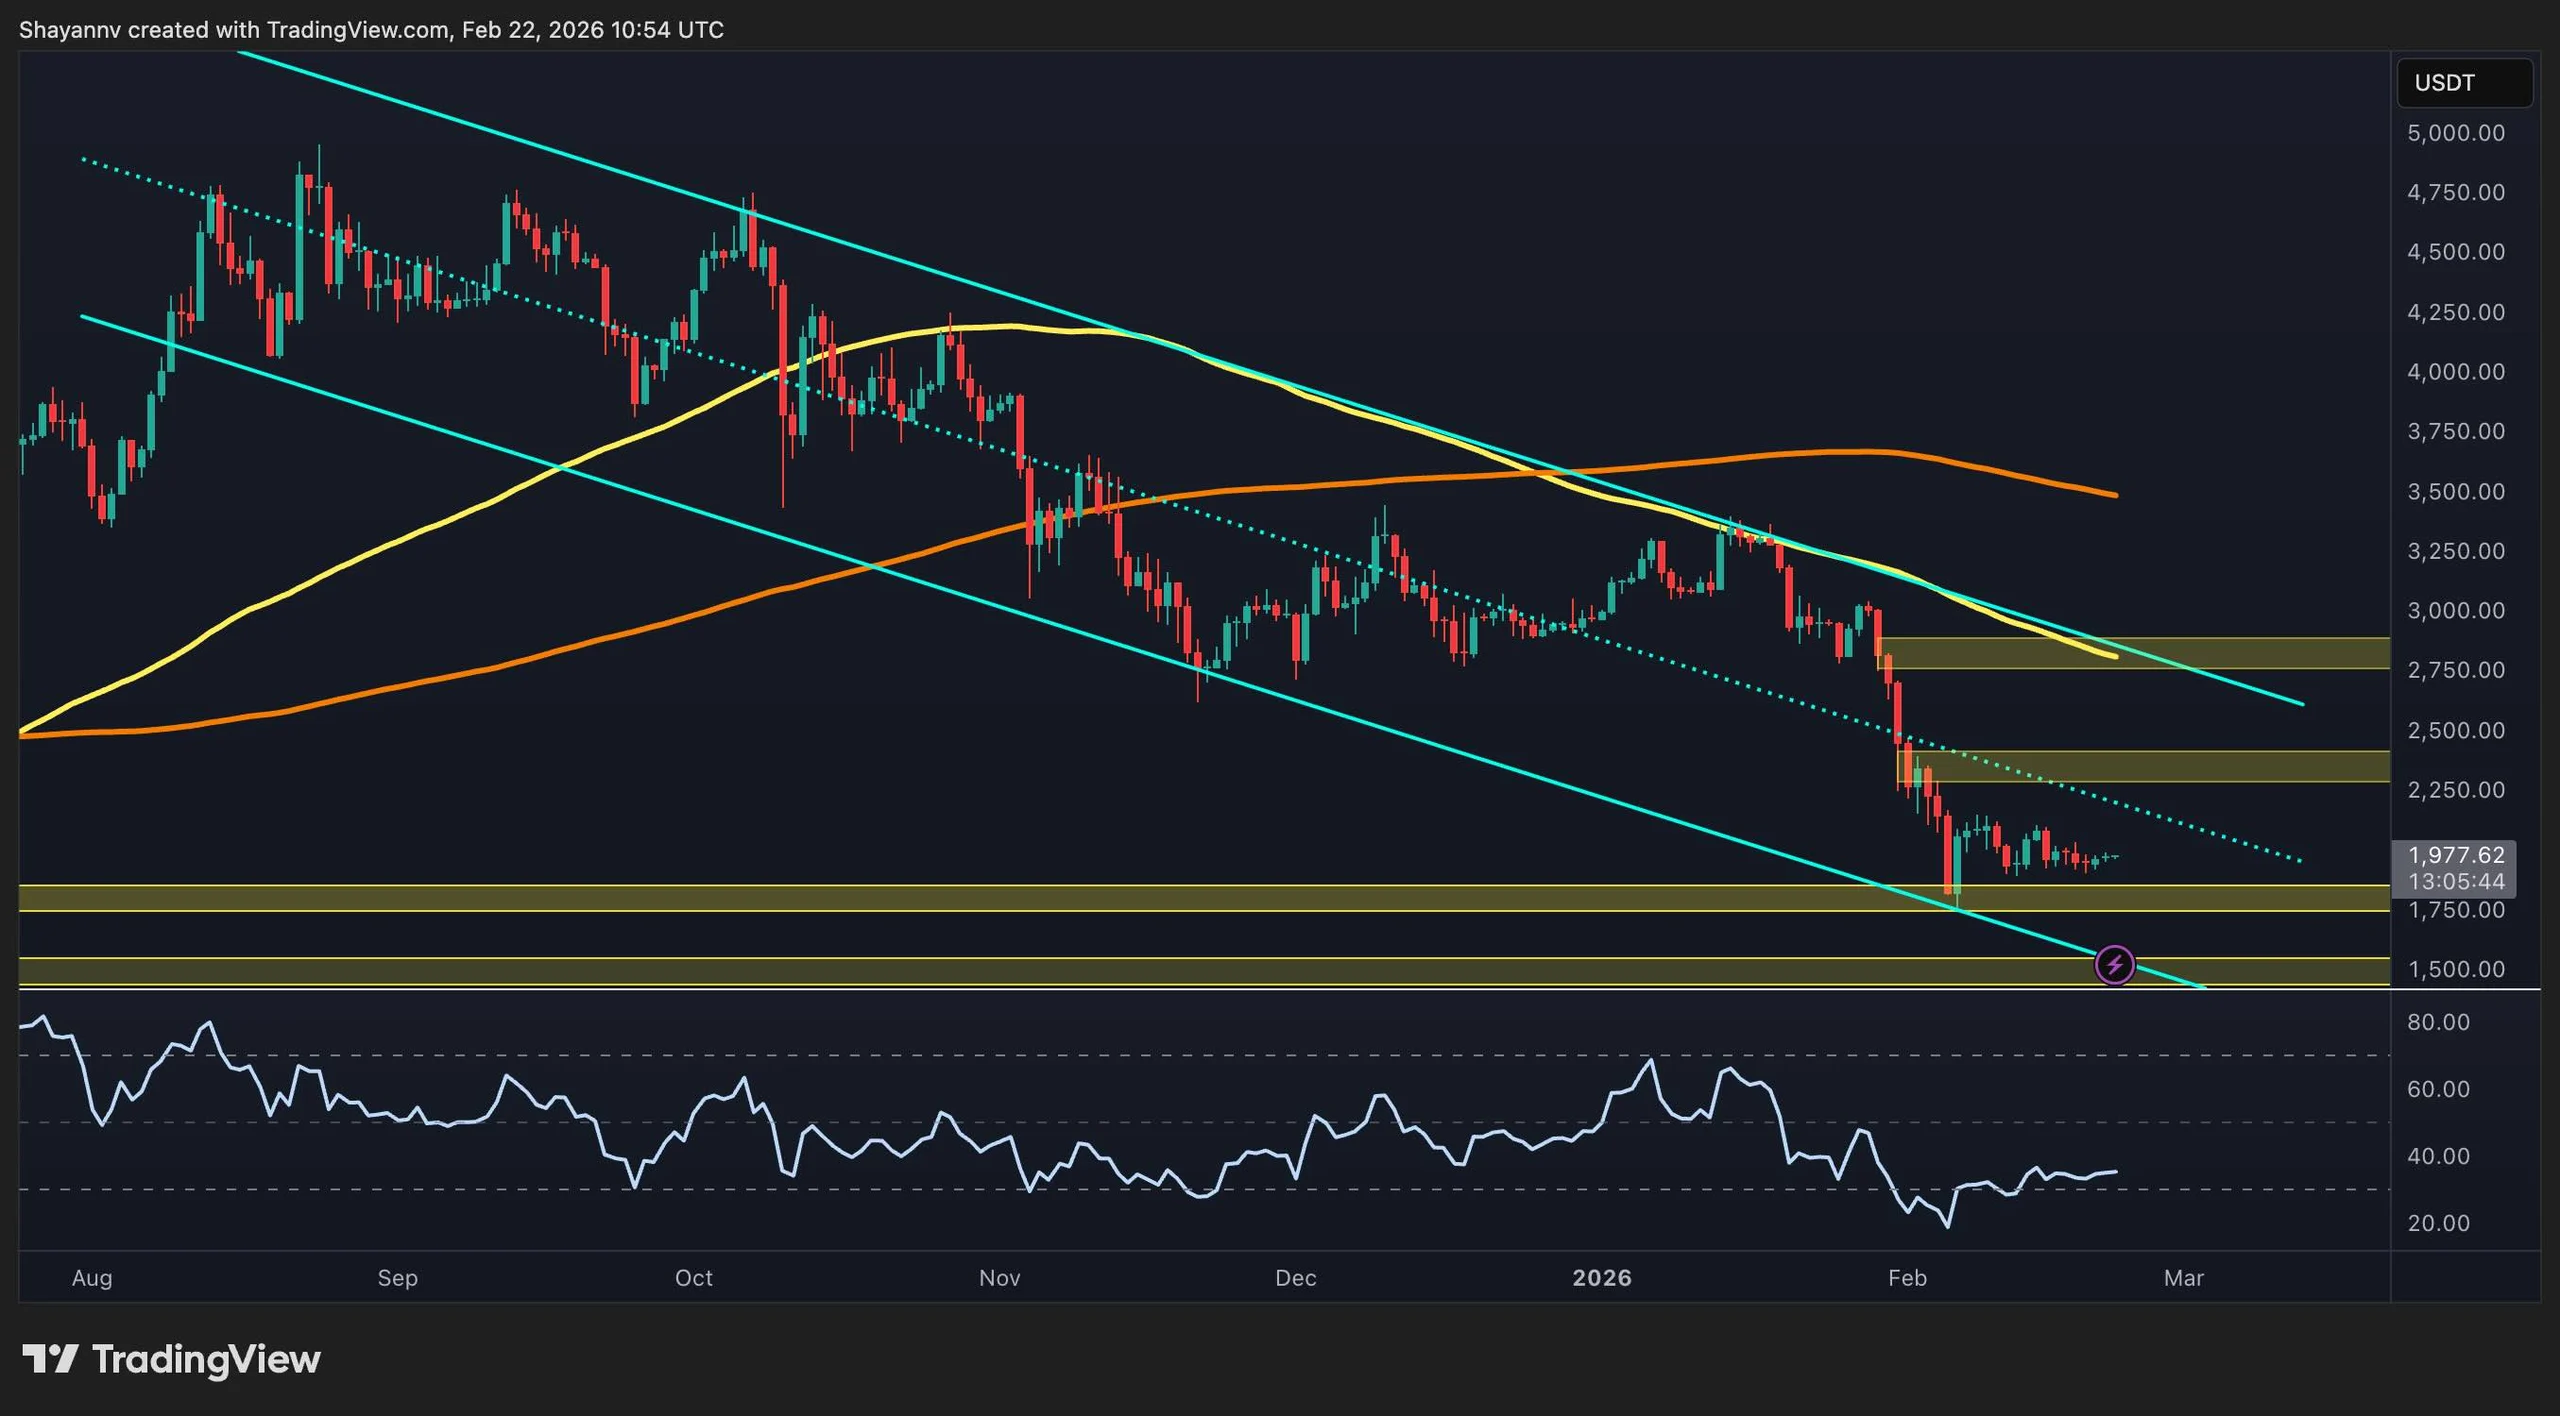
Ethereum remains in a broader corrective phase, trading below key moving averages and inside a well-defined descending structure. While short-term stabilization is visible near support, the higher-timeframe trend still favors sellers unless major resistance levels are reclaimed with strong momentum.
Ethereum Price Analysis: The Daily Chart
On the daily timeframe, ETH continues to respect a descending channel, consistently forming lower highs beneath both the 100-day and 200-day moving averages. The recent breakdown accelerated the price into the $1,750–$1,800 demand zone, where buyers have stepped in to slow the decline, but the structure remains bearish overall.
The $2,300–$2,400 region now acts as a key resistance cluster, aligning with prior breakdown levels and just below the declining 100-day moving average. Unless ETH can reclaim that zone and break above the channel’s upper boundary, rallies are likely to be corrective, with the risk of another leg toward lower channel support still present.
ETH/USDT 4-Hour Chart
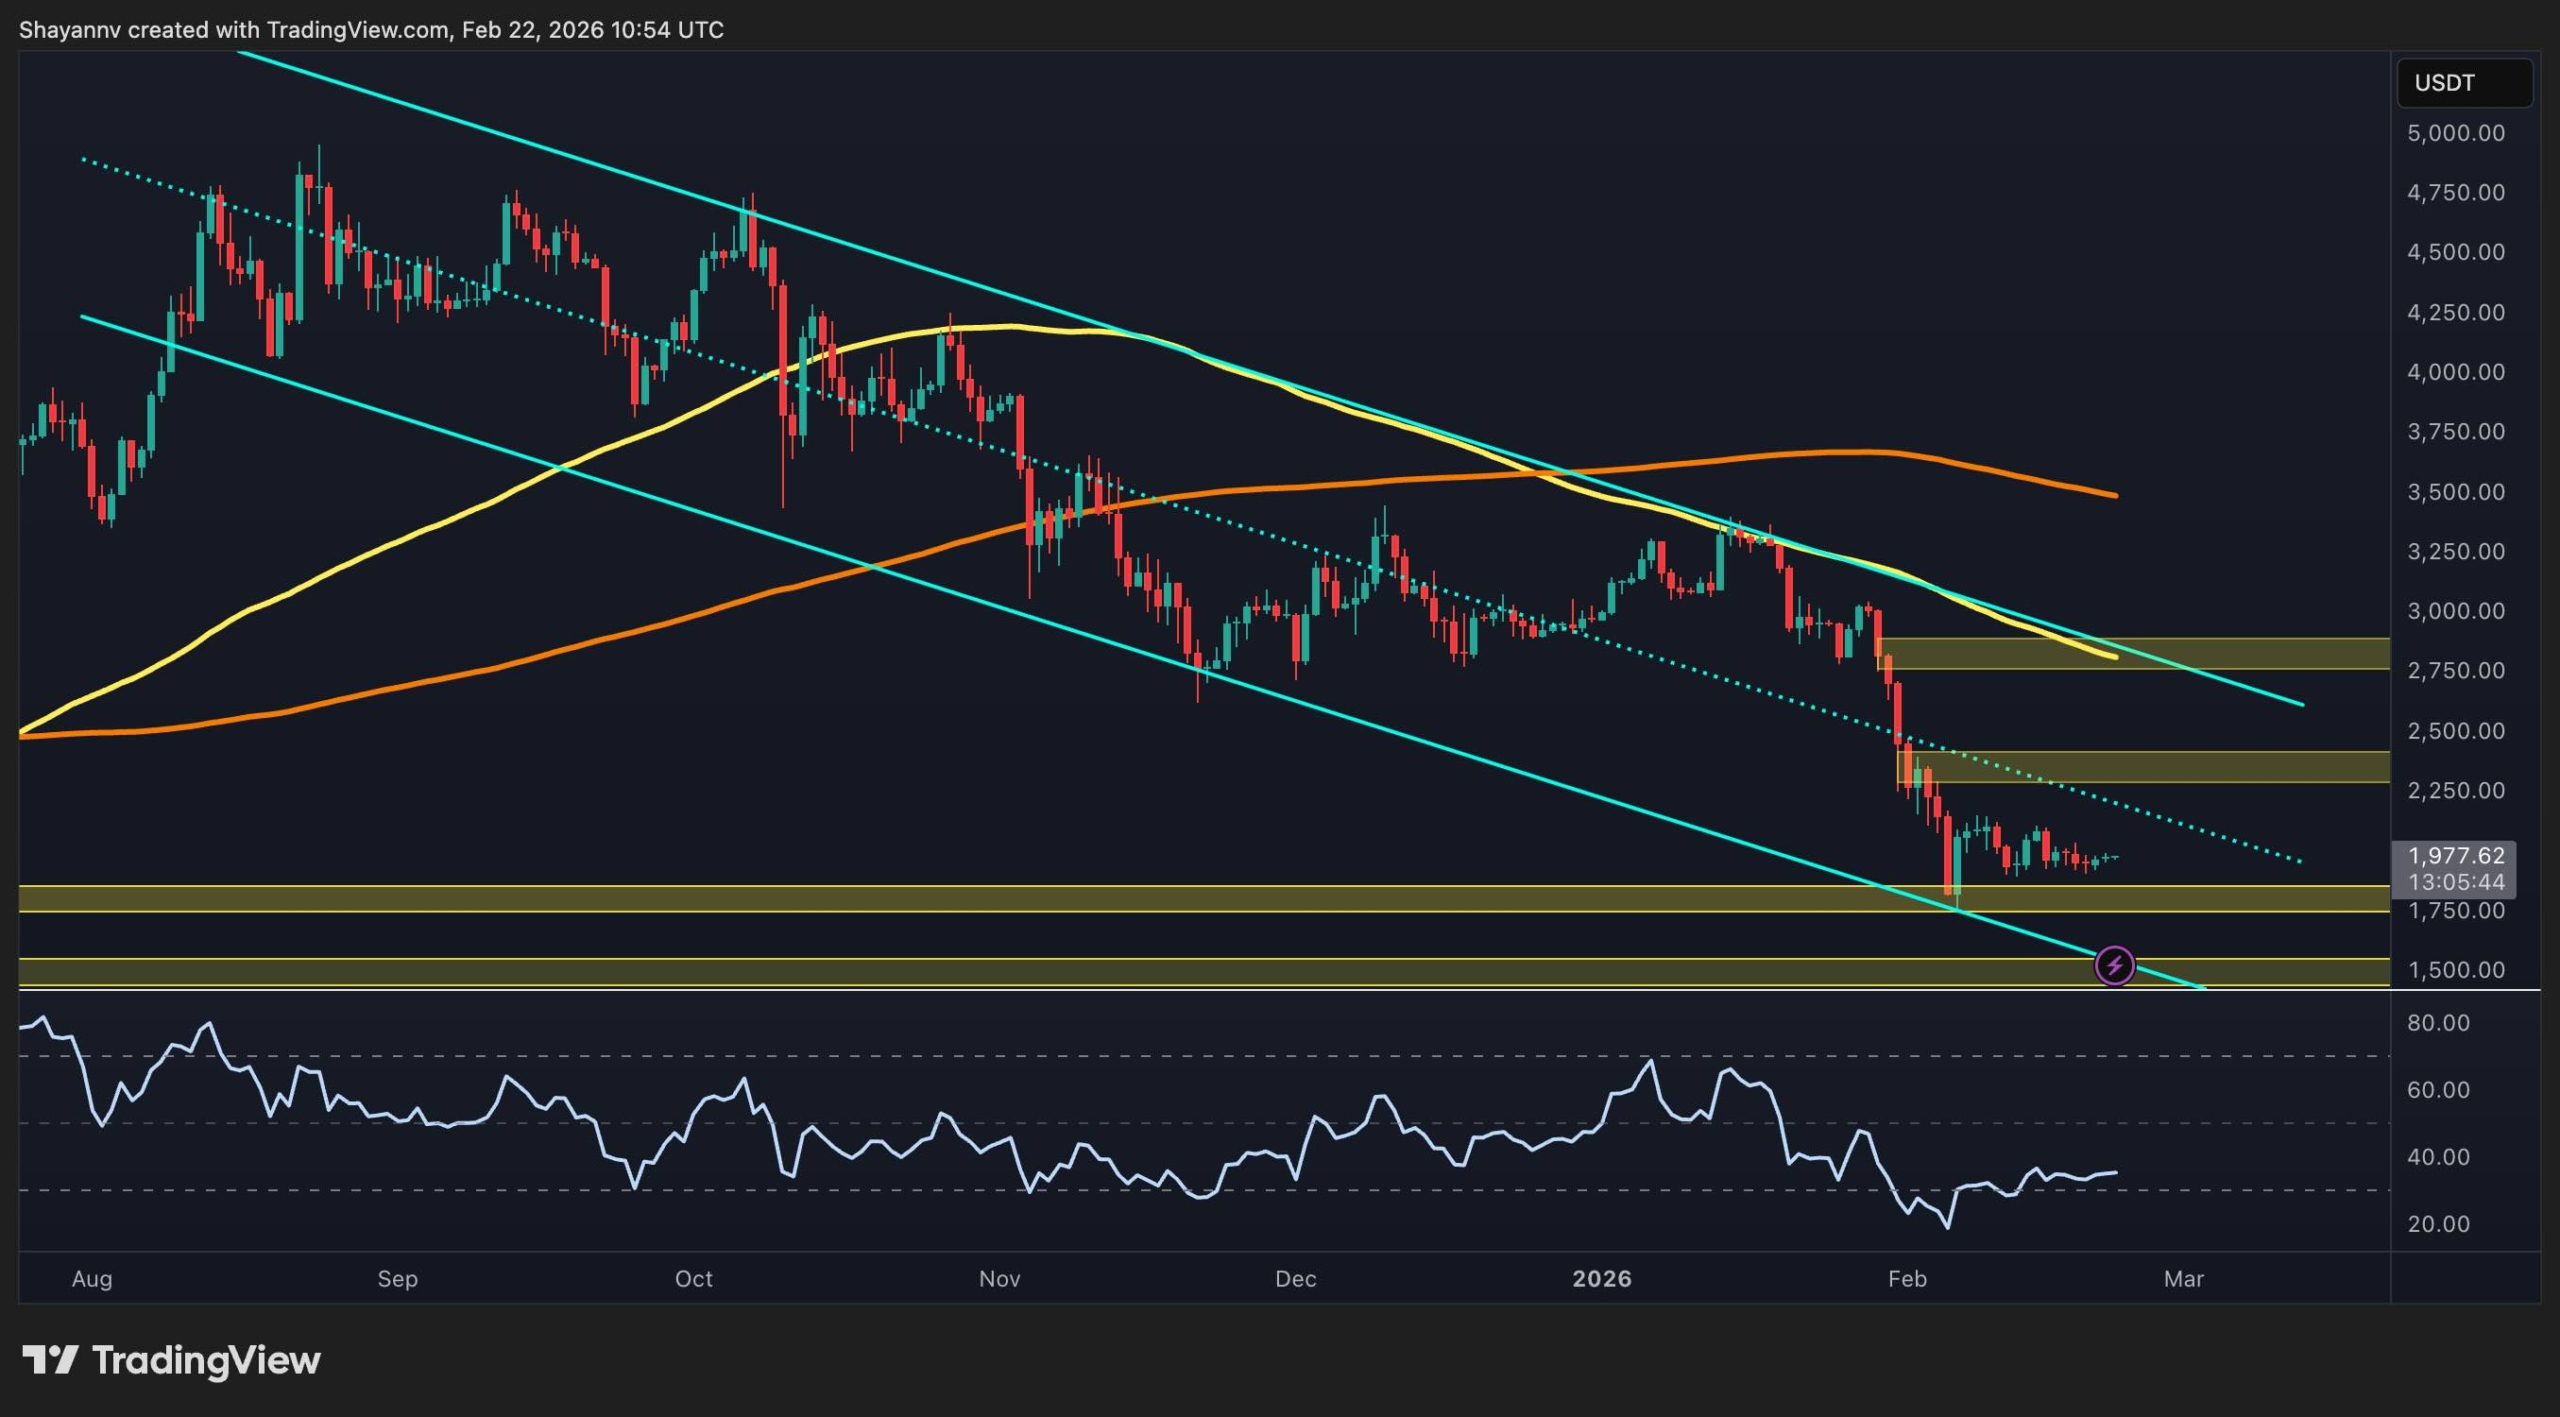
On the 4H timeframe, the asset has been compressing inside a symmetrical triangle formed from recent lower highs and higher lows, above the $1,800 horizontal support zone. This short-term symmetrical contraction reflects indecision rather than confirmed reversal, as lower highs are still being printed.
A breakout above $2,000–$2,100 highs would be the first signal of a short-term momentum shift and could open a move toward the $2,300-$2,400 resistance band. Conversely, losing the $1,800 base would invalidate the consolidation thesis and likely trigger renewed downside pressure toward deeper support levels.

On-Chain Analysis
Active address data shows a sharp spike in network activity recently, with the 30-day EMA of active addresses surging to multi-month highs. Historically, similar expansions in activity have coincided with periods of heightened volatility and often precede major directional moves.
However, despite the spike in participation, the asset has not yet confirmed a bullish reversal. This divergence suggests that while engagement is rising, capital flows are not decisively pushing prices higher, and might be indicating panic selling at lows by weaker hands. If elevated activity sustains while the price stabilizes, it could form a constructive base. However, a confirmation would require a clear break above key technical resistance levels.

Binance Free $600 (CryptoPotato Exclusive): Use this link to register a new account and receive $600 exclusive welcome offer on Binance (full details).
LIMITED OFFER for CryptoPotato readers at Bybit: Use this link to register and open a $500 FREE position on any coin!
Disclaimer: Information found on CryptoPotato is those of writers quoted. It does not represent the opinions of CryptoPotato on whether to buy, sell, or hold any investments. You are advised to conduct your own research before making any investment decisions. Use provided information at your own risk. See Disclaimer for more information.
Disagreements within a decentralized autonomous organization (DAO) are a sign of a healthy DAO, according to Dr. Michael Egorov, founder of the decentralized finance (DeFi) platform Curve Finance.
DAOs are a decentralized organizational structure that relies on smart contracts to automate functions and member voting to govern onchain protocols.
Egorov said that both a 2024 governance proposal involving the Curve DAO and the recent dispute involving the Aave DAO illustrate the importance of disagreements to the structure’s vitality. He told Cointelegraph:
“If everyone automatically agrees on something, it feels like people just don’t really care. They vote for whatever comes in, or they don’t participate at all. The first sign of that would be governance apathy, like when people are not voting at all.”
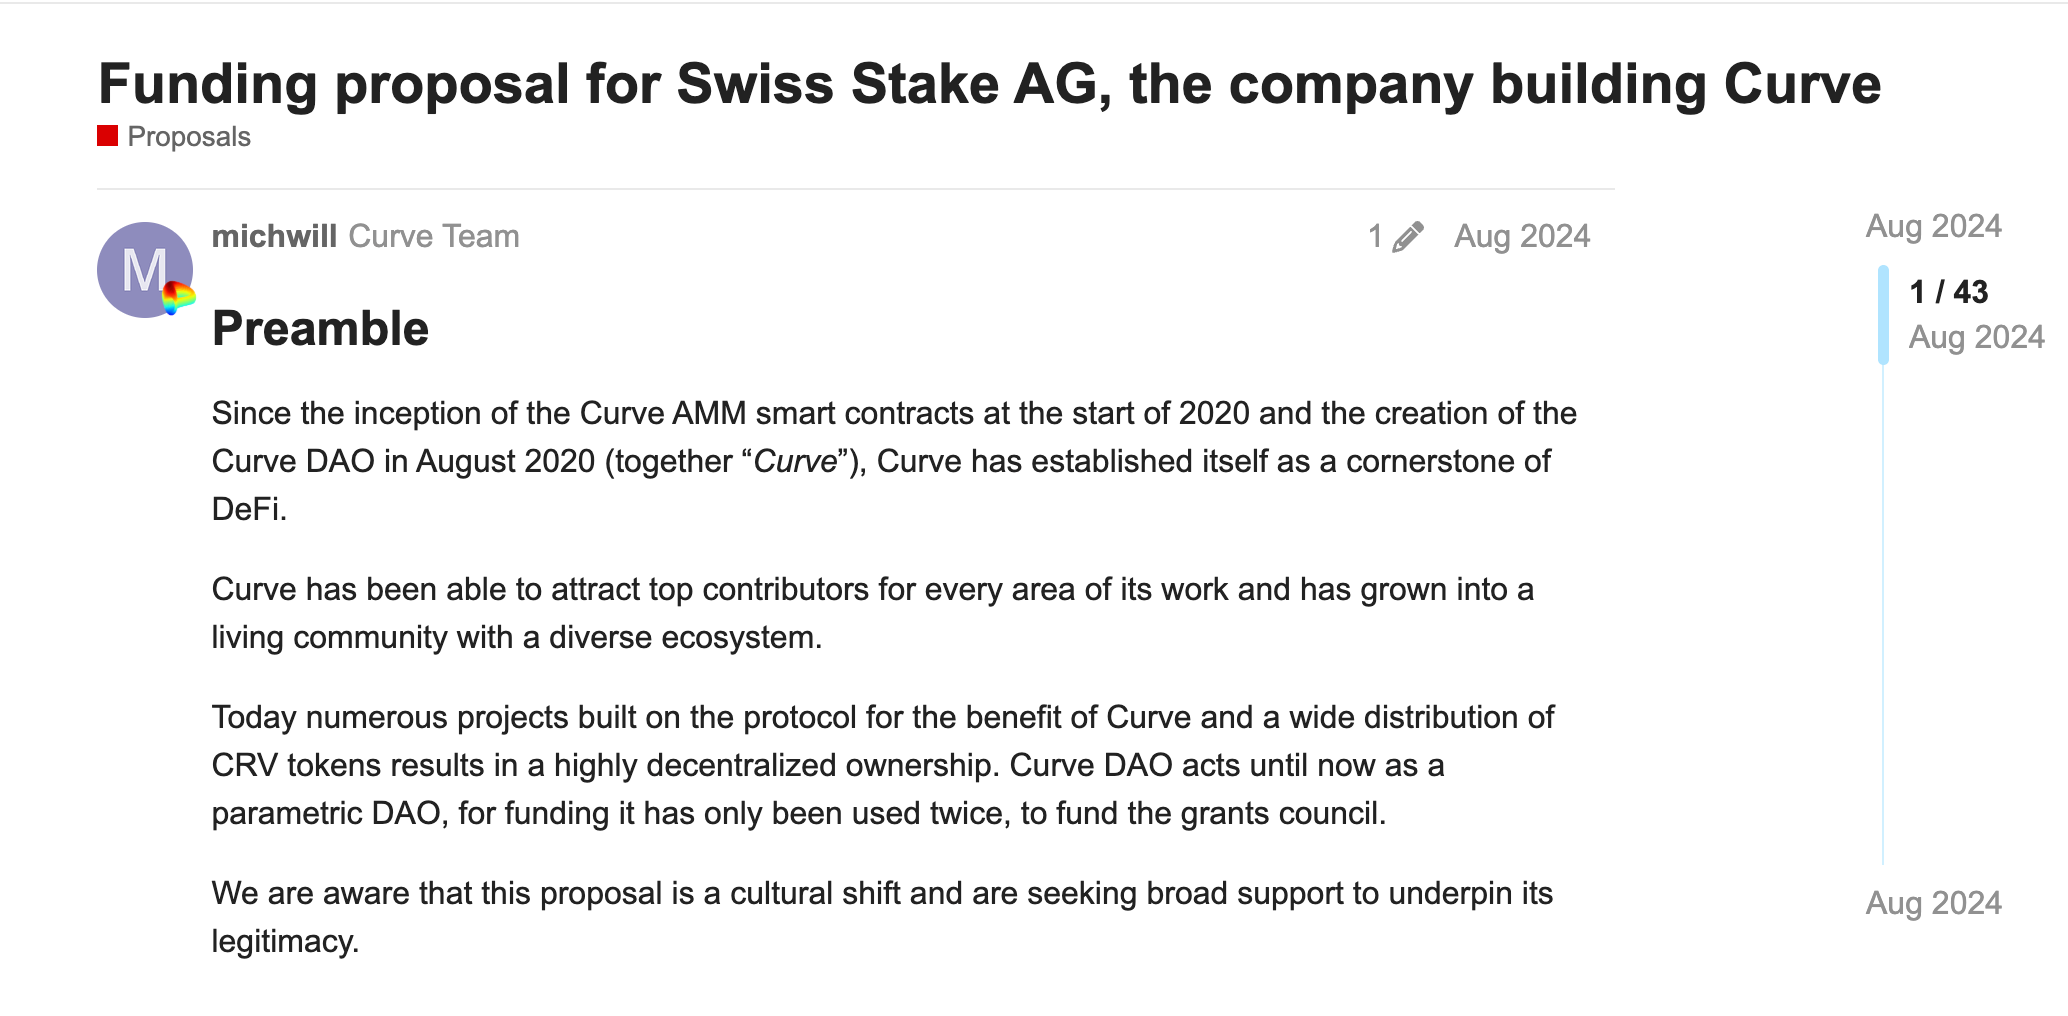
That earlier Curve DAO matter concerned a 2024 governance proposal to provide Swiss Stake AG, the main developer behind the Curve Finance protocol, with a grant valued at about $6.3 million at the time, which drew significant pushback from members of the Curve DAO.

Egorov noted that the proposal was revised and resubmitted in December 2025, and the redrafted proposal received over 80% turnout from DAO members.
An analysis last year by blockchain development company LamprosTech found that “Voter turnout in most DAOs rarely passes 15%, concentrating decision-making power in the hands of a small, active group.”
Curve token holders lock up their tokens for a long period, which encourages long-term governance engagement, Egorov said.
Egorov said that DAOs represent a new model for human organization that is distinct from a company or a self-sovereign country, but features elements of a sovereign country, including political parties voicing disagreement about how to govern a protocol.
Related: Core technical contributor to cease involvement with Aave DAO
Aave dispute highlights challenges in onchain governance and intellectual property rights
In December 2025, a governance dispute erupted between Aave Labs, the main development company of Aave products, and the Aave DAO over fees from the integration with DeFi exchange aggregator CoW Swap.

Members of the DAO were critical of the fees from the integration going directly to a wallet controlled by Aave Labs, and the pushback sparked a debate over which entity has rightful control over intellectual property on the DeFi platform.
A proposal was then submitted to the Aave DAO to bring Aave brand assets and intellectual property under the control of the DAO; it ultimately failed to pass.
Legal recognition of DAOs could mitigate governance disputes
DAOs cannot interact with the real world without regulated legal structures, like business entities or bank accounts, and DAO control over intellectual property is a common governance issue, Egorov said.
DAOs are a great fit for governing anything onchain, he said, adding that users should also experiment with DAOs for offchain elements as well, though centralized companies might be a better fit to manage offchain structures.
If DAOs could be legally recognized and interact with the traditional financial world, owning business entities and bank accounts, it could mitigate governance disputes, Egorov said, adding that the legal system has yet to catch up to the latest technology.
Magazine: Real AI use cases in crypto, No. 2: AIs can run DAOs

TLDR:
- Elon Musk is alleged to be collaborating with Ripple, though no official confirmation has been issued by either party.
- REAL Token is reportedly scheduled to list on BTCC Exchange on February 28th, pending verified disclosure from the platform.
- Price projections suggest a move from $0.045 to $690.70 if 0.01% of the $228 trillion global market enters the network.
- XRP Ledger daily transactions have surged 40%, approaching 2.5 million per day, reflecting measurable real-world network growth.
Elon Musk’s alleged connection to the XRP Ledger ecosystem has sparked fresh market interest across crypto communities.
Unverified reports claim that Ripple CEO Brad Garlinghouse confirmed a collaboration with Musk, tied to the upcoming REAL Token listing on BTCC Exchange.
The listing is reportedly scheduled for February 28th. However, neither Musk nor Garlinghouse has issued any public statement confirming these claims.
Market participants are being advised to approach the circulating reports with caution before making any financial decisions.
Musk’s Alleged Involvement Draws Attention to XRP Ledger Activity
Elon Musk’s name has long carried weight in cryptocurrency markets, often triggering sharp price and volume movements.
Reports linking him to the XRP Ledger through REAL Token have generated notable traction in online communities.
None of Musk’s companies, however, have released any announcements directly referencing REAL Token or related initiatives.
A post from CryptoGeekNews stated that Ripple CEO Brad Garlinghouse confirmed a close collaboration with Musk. The same post tied this alleged partnership to a global XRPL token listing scheduled for February 28th on BTCC Exchange.
The post itself acknowledged that claims connecting both parties require careful interpretation by market participants.
Crypto markets have historically responded strongly to narratives involving prominent public figures and major exchange listings.
As a result, short-term trading volumes can surge considerably even without verified fundamentals in place. Volatility in these situations tends to follow sentiment cycles rather than confirmed operational developments.
REAL Token Listing and XRP Ledger Liquidity Claims Remain Unverified
REAL Token is reportedly scheduled to debut on BTCC Exchange on February 28th, marking its entry onto a recognized international trading platform.
Liquidity flows are said to be increasingly converging through the XRP Ledger via REAL Token. This movement is reported to position the ecosystem for a potential supply squeeze, based on circulating market commentary.
Price projections tied to the listing suggest a possible move from $0.045 to $690.70 per token. These figures assume that just 0.01% of the $228 trillion global market enters the network. Ripple has not confirmed or validated any of these circulating valuation projections publicly.
BTCC Exchange has not published detailed listing conditions beyond general references found across online communities.
Token supply metrics, contract specifications, and distribution schedules also remain unclear at this time. Until official disclosures are made, market participants have limited verified information to assess the listing accurately.
XRP Ledger Network Growth Provides Backdrop for Rising Speculation
Daily successful transactions on the XRP Ledger have grown by approximately 40%, approaching 2.5 million per day.
This rise points to measurable real-world network usage growing within the XRP ecosystem. Despite this activity, XRP’s price remains below key moving averages, currently trading at $1.39.
The XRP Ledger continues to expand through payments, tokenization, and decentralized finance experimentation. Developments tied to rumored partnerships, including the alleged Musk connection, currently exist outside confirmed corporate announcements.
Official statements or exchange filings are expected to provide further clarity as the reported February 28th date approaches.
Regulatory frameworks are also playing a growing role in how institutions evaluate token listings and liquidity conditions.
Compliance standards increasingly require verified disclosures and transparent communication from projects seeking credibility. Until such disclosures emerge, the market is largely operating on sentiment rather than substantiated developments.


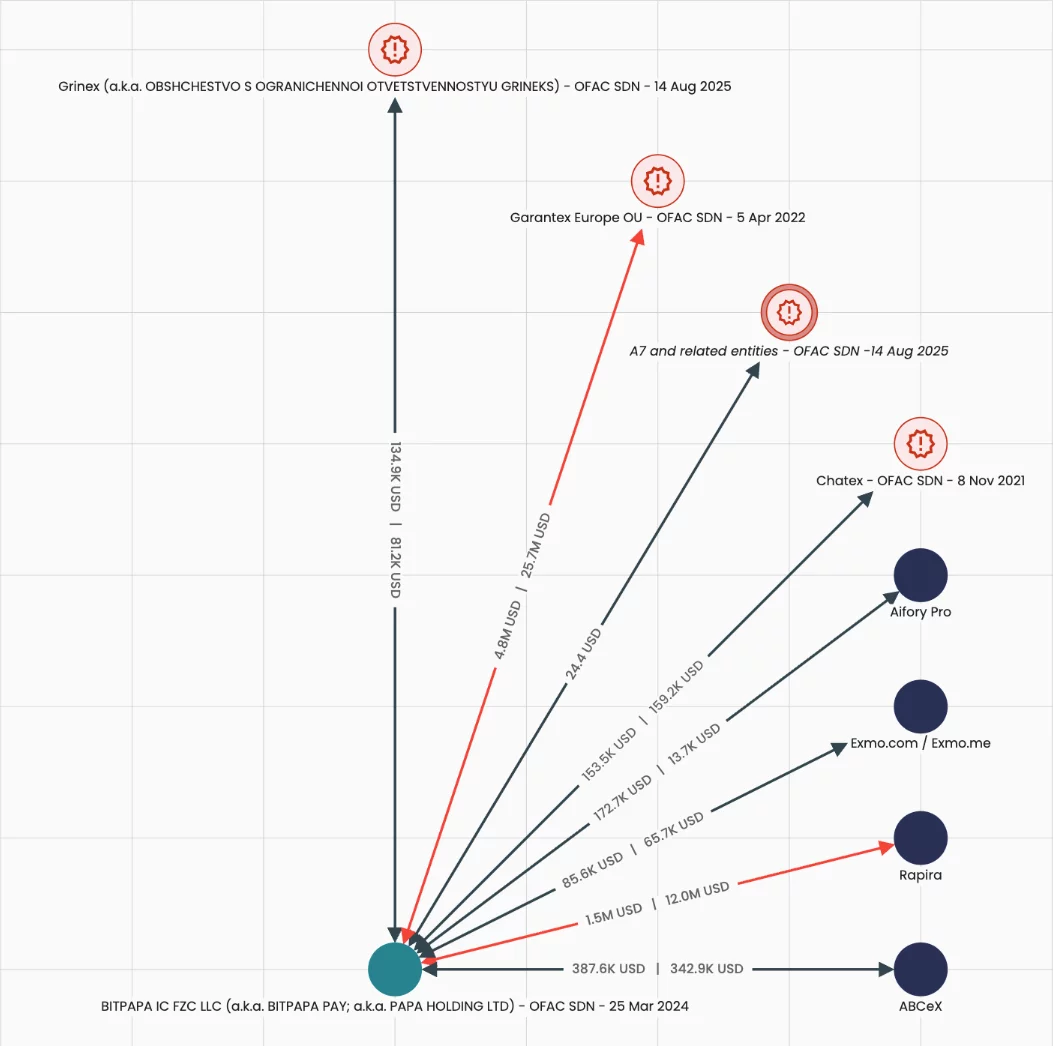
Crypto exchanges maintaining operational or financial connections with Russia continue aiding circumvention of international sanctions, according to an Elliptic report.
Summary
- Elliptic says some exchanges help Russia bypass sanctions via crypto.
- Wallet rotation and P2P ruble trades obscure sanctioned flows.
- Shared custody links Exmo global and Russia-facing platforms.
The platforms provide transaction routes allowing Russian entities to make cross-border payments shielded from traditional banking oversight through ruble-to-crypto conversions.
Bitpapa, sanctioned by the U.S. Office of Foreign Assets Control in March 2024, sends approximately 9.7% of outgoing crypto funds to OFAC-sanctioned targets, including 5% to the sanctioned exchange Garantex.
ABCeX has processed at least $11 billion in crypto from its Moscow Federation Tower office, previously occupied by Garantex.
Exmo claims to have exited the Russian market but continues sharing custodial wallet infrastructure between its Western-facing and Russian-facing platforms. They conduct over $19.5 million in direct transactions with sanctioned entities.
Bitpapa and ABCeX use crypto wallet rotation to evade tracking
Bitpapa, a peer-to-peer exchange with corporate registrations in the UAE, primarily targets Russian users allowing rubles to be exchanged for crypto.
Blockchain analysis shows the platform manages wallets to evade sanctions enforcement by constantly rotating addresses.
This prevents transaction monitoring systems from identifying Bitpapa as a counterparty and hiding Russian fund origins.
ABCeX operates both order-book and P2P ruble-to-crypto trading from Moscow’s Federation Tower.
The exchange uses wallet-hiding strategies to prevent crypto transactions from being linked to the service. ABCeX has sent amounts to Garantex and Aifory Pro, which specializes in cash-to-crypto services.
Fiat currencies including rubles are converted into crypto through these services before being transferred across borders without passing through intermediaries.
The assets can then be converted to local currency through overseas crypto brokers or exchanges. Many exchanges maintain nominal registrations outside Russia while helping in high volumes of trading linked to sanctioned entities.
Exmo shares wallet infrastructure between separate platforms
Exmo claimed to exit the Russian market following the 2022 invasion of Ukraine by selling its regional business to Exmo.me.
Blockchain analysis contradicts this geographic operational separation, showing Exmo.com and Exmo.me continue sharing identical custodial wallet infrastructure.
Crypto deposited into either platform is pooled into the same hot wallet addresses, while withdrawals for both platforms are issued from matching addresses.
The shared infrastructure shows no real operational separation and allows funds from the Russian-facing platform to co-mingle with the Western-facing entity. Exmo has transacted with Garantex, Grinex, and Chatex.
Rapira, a Georgia-incorporated exchange with a Moscow office, helps in ruble-based trading and has engaged in direct crypto transactions with Grinex totaling over $72 million.
Moscow authorities reportedly raided Rapira’s offices as part of a capital flight investigation to Dubai.
Aifory Pro operates in Moscow, Dubai, and Turkey, serving as a “Foreign Economic Activity Payment Agent” for international trade between Russia and China.
SOL corrects. Charts become volatile. The crypto community starts discussing “cycle bottoms” and “the end of growth.” Some sell. Some lock in losses. Others postpone decisions “until better times.”
And Vladika?
Vladika continues producing blocks. Maintaining uptime. Supporting the network with the same infrastructure stability as before.
A validator on Solana does not operate according to candle patterns. It operates according to epochs, blocks, and infrastructure reliability.
When the Market Falls, Commitment Becomes Visible
Corrections are not only about price. They are stress tests for network participants.
During turbulence, some operators reduce infrastructure costs. Some adjust commission structures. Others become less transparent.
And there is another category — those who remain consistent.
Vladika belongs to the latter.
The economic model does not change depending on market phase:
- 0% commission on base staking rewards
- 100% of MEV rewards distributed to delegators
No hidden mechanisms.
No temporary campaigns.
No sudden commission increases after several epochs.
If you delegate SOL through Vladika, you receive the full rewards generated by the network for your participation.
What Happens to Staking When Price Declines?
It is critical to separate two variables: market price and network yield.
Yes, SOL may correct.
But staking mechanics continue operating. Blocks are produced. Consensus is maintained. Rewards are distributed.
The average staking yield for Vladika currently stands at approximately 6.42% annually.
This is not speculative yield.
It is structural compensation for securing the network.
During corrections, this number becomes more meaningful.
While part of the market reacts emotionally, staking remains a discipline tool.
You do not sell the asset.
You do not remove it from the ecosystem.
You allow it to generate additional SOL.
Important: You Do Not Transfer Your Funds
For many holders, this is fundamental.
When staking on Solana, tokens remain in your wallet.
You do not transfer them to the validator.
You delegate voting rights only.
You retain full custody.
You can undelegate at any time.
After the standard unlock period (one epoch), SOL becomes fully liquid again.
Staking is not asset transfer.
It is infrastructure participation.
Validator Behavior During Volatility Is the Key Metric
Selecting a validator during bullish phases is easy.
Evaluating performance during difficult periods is far more telling.
Key indicators:
- uptime stability
- commission history
- MEV transparency
- participation in official network programs
Vladika holds SFDP Approved status under the Solana Foundation Delegation Program.
https://solana.org/sfdp-validators/A23LfQn6khffj2hGhGfXr6P52W2pxrVcCaHVQLYQgiX2
This confirms compliance with Solana Foundation technical standards.
Additionally, the validator is marked as “Honest” on analytics platforms tracking operator behavior and MEV transparency — indicating no hidden redistribution mechanisms.
These parameters become especially relevant during market instability.
Stability Is a Position
In bull markets, yield discussions are easy.
In corrections, only consistency remains.
Vladika does not alter its structure based on market sentiment.
It does not modify economics under pressure.
It does not experiment with commission levels.
Infrastructure must remain stable regardless of cycle phase.
If You Already Hold SOL
If SOL is already in your wallet, the primary question is efficiency.
An average yield of ~6.42% annually allows you to increase SOL holdings without additional market exposure and without surrendering control.
Staking enables you to:
- support network decentralization
- accumulate additional SOL
- maintain full asset control
- participate in Solana infrastructure long term
Markets fluctuate. That is their nature.
A validator built for stability continues operating.
Vladika remains online — with uptime, transparent economics, and structural consistency.
Detailed validator information, staking conditions, and technical specifications are available at:
https://vladika.love/
Disclaimer: This is a Press Release provided by a third party who is responsible for the content. Please conduct your own research before taking any action based on the content.
TLDR:
- XRP has dropped 69% from its recent all-time high of $3.66 and is currently trading around $1.39.
- The $0.66 price level is a critical support threshold — a weekly close below it invalidates the bullish outlook.
- Santiment data recorded $1.93B in weekly realized losses, the largest spike for XRP since November 2022.
- Analysts cite upside targets of $2, $3, $5, and $10-plus if XRP holds above its key accumulation zone.
XRP is trading around $1.39 after recording a 69% correction from its recent all-time high of $3.66. The asset has posted a -3.76% decline in the last 24 hours and an -8.78% drop over the past seven days.
Trading volume stands at approximately $1.43 billion within the same 24-hour window. The token is currently testing a historically significant demand zone that analysts say previously served as a multi-year accumulation area.
XRP Retests Multi-Year Accumulation Zone After Sharp Decline
The current price action places XRP at a technically important level. The token broke below the $2 support zone and is now retesting what analysts describe as a high-timeframe demand area.
This zone previously acted as the upper boundary of a multi-year accumulation range before the 835% rally.
Crypto analyst Crypto Patel noted on social media that the current structure mirrors a classic breakout-retest setup. The price tested this same support region before the prior explosive move. That historical parallel has drawn attention from traders watching the $0.86–$0.66 range closely.
According to the analysis, the $0.66 level acts as the key line for bullish continuation. A weekly close below that price would technically invalidate the bullish outlook. For now, XRP remains above that threshold while sentiment stays cautious.
The confluence of the multi-year breakout retest and the accumulation zone creates what analysts see as a strong demand area. Whether price holds or breaks lower from here will likely set the tone for the next major move.
On-Chain Data Shows Largest Realized Loss Spike Since November 2022
On-chain data from Santiment recorded $1.93 billion in weekly realized losses among XRP holders. This marks the largest spike of this kind since November 2022. The data point reflects a notable capitulation event among market participants.
Crypto Patel referenced the Santiment figures in a post on X, pointing out that extreme capitulation events have historically coincided with local price bottoms.
The November 2022 comparison is relevant because that period also preceded a recovery phase for many digital assets.
Realized losses occur when holders sell at prices lower than their cost basis. A spike of this size shows that a large portion of the market exited positions at a loss. Such behavior often marks a shift from weak hands to stronger holders.
Upside targets cited in the analysis range from $2 to $3, extending further to $5 and beyond $10 from the accumulation zone.
These levels represent potential resistance points if buyers step in and the price recovers. The next major confirmation will come from how XRP closes on a weekly basis near current levels.
Bitcoin (CRYPTO: BTC) has been signaling a potential bottom as CME futures positioning turns bullish again, a pattern that has preceded notable recoveries in prior cycles. In April 2025, non-commercial traders shifted from net short to net long, and a similar rotation is resurfacing in 2026, raising the odds of a renewed ascent in the weeks ahead. The price action sits near a key technical floor: the 200-week exponential moving average, a long-standing bear-market floor that has defined major drawdowns over the past decade; as of February, that metric hovered around $68,350, giving bulls a critical line in the sand. An oversold RSI adds to the narrative that selling pressure could be abating and a bottoming process may be underway.
Key takeaways
- The CFTC Commitment of Traders report shows non-commercial traders shifting from net short to net long, with net positions around -1,600 contracts after previously being +1,000.
- Historical analogs underscore potential upside: roughly 70% gains after similar unwind events in April 2025 and about 190% gains in 2023 under comparable conditions.
- Bitcoin’s defense of the 200-week EMA near $68,350 provides a structural support that could anchor a broader recovery rally.
- Analysts have discussed a path toward roughly $85,000 by around April if BTC clears the 100-week EMA and sustains momentum.
- Despite the favorable setup, the shift is described as a condition, not a signal; a deeper drawdown remains possible, echoing 2022’s dip below the 200-week EMA even amid oversold readings.
Tickers mentioned: $BTC
Sentiment: Bullish
Price impact: Positive. The unwind of net shorts into longs and the defense of the 200-week EMA support increase the odds of a near-term rebound toward higher targets, including the potential move to $85,000 if trends persist.
Market context: The current positioning sits within a broader framework of liquidity shifts and risk-on sentiment in crypto markets. Moving-average dynamics and derivatives positioning—especially around CME futures—turn into leading indicators for momentum, while macro and ETF flows continue to shape the medium-term trajectory.
Why it matters
The evolving futures posture matters because it signals a potential change in risk tolerance among large traders and institutions. If the pattern holds, it can attract additional buyers who monitor derivatives data and on-chain signals, possibly accelerating a shift from a prolonged drawdown to a more constructive price cycle. For traders, the combination of an oversold RSI, a tested floor at the 200-week EMA, and a history of outsized recoveries after similar unwind events creates a framework for positioning with defined risk and reward trade-offs.
From a market structure perspective, a sustained bounce would impact liquidity and confidence across the ecosystem, influencing miners, developers, and product teams building on Bitcoin. Observers will be watching for confirmation signals beyond the headline shifts—whether BTC can decisively clear resistance bands such as the 100-week EMA and how on-chain activity changes as price action improves. The dynamic underscores how derivatives and macro factors continue to interplay with price discovery in the longest-standing crypto market trend.
Analysts have highlighted the nuanced nature of these signals. Tom McClellan and others have noted that smart-money rotations can precede recoveries, but they do not guarantee them—echoing the caution that traders should maintain disciplined risk management as conditions evolve. The broader takeaway is a heightened awareness that the market may be shifting from a bear-market lull to a more data-driven recovery regime, dependent on how price action responds to macro inputs and on-chain signals in the weeks ahead. For those tracking the narrative, the emergence of a durable bottom would likely hinge on price staying above critical moving averages and on ongoing participation from institutional and professional traders.
What to watch next
- Next CFTC COT report release and the evolution of net futures positions on CME.
- BTC price action around the 200-week EMA (~$68,350) and a potential break above the 100-week EMA toward higher levels.
- The potential climb toward $85,000 by around April if bullish momentum persists.
- Improvements in the RSI alongside broader liquidity shifts and macro cues that could confirm a durable bottom.
Sources & verification
- CFTC Commitment of Traders (COT) report for bitcoin futures data: https://www.cftc.gov/dea/futures/deacmesf.htm
- Bitcoin historical price metric sees $122K ‘average return’ over 10 months: https://cointelegraph.com/news/bitcoin-historical-price-metric-122k-average-return-over-10-months
- Bitcoin whales sharks accumulate conditions breakout Santiment: https://cointelegraph.com/news/bitcoin-whale-sharks-accumulate-conditions-breakout-santiment
- Bitcoin crash 60k halfway point crypto bear market: https://cointelegraph.com/news/bitcoin-crash-60k-halfway-point-crypto-bear-market
Bitcoin’s rebound setup: futures positioning, EMA signals and the path to $85k
Bitcoin (CRYPTO: BTC) has been shaping a potential bottom as CME futures positioning turns bullish again, a pattern that has preceded notable recoveries in prior cycles. In April 2025, non-commercial traders shifted from net short to net long, and a similar rotation is resurfacing in 2026, raising the odds of a renewed ascent in the weeks ahead. The price action sits near a key technical floor: the 200-week exponential moving average, a long-standing bear-market floor that has defined major drawdowns over the past decade; as of February, that metric hovered around $68,350, giving bulls a critical line in the sand. An oversold RSI adds to the narrative that selling pressure could be abating and a bottoming process may be underway.
The shift in speculative positioning is detailed in the CFTC report, which shows net long exposure among non-commercial traders moving back into positive territory after a stretch of net shorts. This cadence — the turning of the tide in futures positioning — has historically preceded multi-week to multi-month reversals, particularly when price remains anchored to major moving averages like the 200-week EMA. In this cycle, the same dynamic is being cited as a setup for a potential run toward higher prices should bullish momentum sustain itself.
Analysts have pointed to historical precedents for context. In the months following similar unwind events, BTC has experienced meaningful gains: around 70% in the wake of the April 2025 shift, and on a prior cycle, as much as 190% in 2023 under comparable futures-market conditions. The emphasis on historical parallels suggests that, if the market can defend the 200-week EMA, a test of higher thresholds becomes plausible. The 200-week EMA has repeatedly served as a floor during deep drawdowns, reinforcing the idea that a durable bottom could form when prices hold above this line. The current setup also aligns with a broader pattern where smart-money participation has historically preceded price recoveries, though no outcome is guaranteed.
One caveat remains central to any bullish interpretation. McClellan and other observers emphasize that the smart-money rotation is a condition rather than a guarantee of higher prices. If the market fails to sustain the rebound, or if macro headwinds intensify, BTC could revisit downside scenarios seen in prior cycles, including a retest of lower levels or a deeper pullback. In the historical context of 2022, BTC dipped below the 200-week EMA despite oversold conditions, underscoring that downside risk can persist even when indicators suggest a potential bottom. As price hovers near the $68k area, traders are weighing the odds of a durable bottom against the risk of a renewed drawdown should momentum falter.
Market watchers are also mindful of how on-chain signals and macro factors interact with price action. A rebound would have implications for risk appetite across the ecosystem, potentially attracting institutions and retail traders alike who aim to capitalize on a multi-week uptrend. If the scenario unfolds as anticipated, a move toward the $85,000 region could materialize by spring, contingent on sustained buying pressure and continued participation from major market players. The narrative continues to be shaped by evolving data: if the RSI remains oversold but begins to turn higher, it could provide an additional layer of validation for bulls; conversely, a renewed wave of selling pressure would complicate the outlook and call into question the durability of any near-term gains.
Crypto World
XRP Ledger launches permissioned DEX, Strategy purchases $168M Bitcoin, Animoca secures Dubai license | Weekly recap

In this week’s edition of weekly recap, XRP Ledger activated a members-only decentralized exchange for regulated institutions, Strategy reported its fourth-largest Bitcoin purchase of the year and Animoca Brands obtained regulatory approval in Dubai. XRP Ledger enables institutional-only trading Strategy…


President Donald Trump and First Lady Melania Trump launched their official cryptocurrency tokens more than a year ago. Today, those digital assets have wiped out $4.3 billion in retail wealth.
According to Cryptorank, 2 million everyday investors currently hold underwater positions, while 45 early-deployment wallets have gained a combined $1.2 billion. For every dollar insiders earned, retail investors lost $20.
Trump Coins Fall Up to 99% Amid Insider Windfall
As a result, the rapid decline of these tokens, alongside the significant gains of early insiders, has attracted much attention from industry observers.
Blockchain analytics firm CryptoRank found the TRUMP token has fallen 92% to $3.55 from its $75 all-time high. The MELANIA token dropped 99% to 11 cents from $13.05.
Although the broader cryptocurrency market shed over $1 trillion in value during the same period, researchers attributed the presidential tokens’ steeper declines to structural design rather than general market conditions.
On-chain forensics show anonymous accounts linked to the initial developers systematically drained decentralized liquidity pools.
In December 2025 alone, blockchain analyst EmberCN reported that the TRUMP token’s primary deployment address transferred $94 million in USDC into the cryptocurrency exchange Coinbase.
The developers utilized a strategy called single-sided liquidity provision on the decentralized platform Meteora.
Here, insiders deposited only TRUMP and MELANIA tokens without pairing them with dollar equivalents.
This strategy programmed the automated market maker to continuously sell their holdings to incoming retail buyers. The assets were then quietly converted into USDC
Furthermore, the threat of continued dilution looms heavily over the remaining holders.
CryptoRank data shows developers locked $2.7 billion in insider tokens inside smart contracts until 2028. Because this expiration date coincides perfectly with the end of Trump’s presidential term, it establishes a highly structured exit strategy.
This means that underwater retail holders will likely serve as exit liquidity for this final insider payout when those tokens finally hit the open market.


As AI infrastructure investments surge toward $300B in 2025 alone, fueled by mega-projects like the $500B Stargate initiative and hundreds of billions in Nvidia chip purchases, the decentralized AI space offers a compelling alternative to Big Tech’s centralized dominance. Now’s the time to invest in it.
In the rapidly evolving landscape of artificial intelligence, a seismic shift is underway, one that promises to redefine how we build, deploy and interact with AI. While centralized AI, dominated by tech giants like Amazon, Microsoft and Google, has driven remarkable progress, the recent shift toward agentic AI creates a unique opportunity for decentralized AI. It’s why the sector is poised to become the most exciting and critical space over the next few years.
With a global AI market projected to grow at a 35.9% CAGR through 2030, the stark valuation gap—$12 trillion for centralized AI enterprises versus ~$12 billion for decentralized AI—signals an unprecedented investment opportunity. Bridging this gap will not only yield massive financial returns but also reshape the ethical, technical and societal foundations of AI. Here’s why decentralized AI, powered by open-source principles and blockchain technology, is the future.
The valuation gap: a $15 trillion opportunity
Centralized AI, controlled by a handful of tech behemoths, commands a staggering $12 trillion~ in enterprise value, fueled by their dominance of nearly 70% of global cloud infrastructure. Yet, this concentration of power comes at a cost: stifled competition, ethical lapses, a loss of agency and control for both individual and corporate users and a one-size-fits-all approach that often stifles innovation.
Meanwhile, decentralized AI, valued at just $12 billion, is a nascent yet rapidly growing ecosystem. The blockchain AI market alone is projected to skyrocket from $6 billion in 2024 to $50 billion by 2030, reflecting a staggering 42.4% CAGR, and I don’t believe these figures will come close to the actual outcome, as the real numbers are likely to be much higher. This disparity isn’t a sign of weakness but a clarion call for investors. The next two to three years will see decentralized AI platforms—think Bittensor, Artificial Superintelligence Alliance,The Manifest Network, Venice.Ai or Morpheus—close this gap by democratizing access, fostering innovation and addressing the critical flaws of centralized systems.
And as the agentic AI age approaches, conjuring visions of hundreds of billions of independent AI agents executing instructions and transacting on behalf of individuals and companies, the case for decentralized AI becomes all the more urgent.
How can these agents be truly autonomous in a centralized model? How can we know –and prove– that they are living up to the legal definition of an “agent?” In other words, it’s a fiduciary with 100% responsibility to its owner, not to a third party (such as the platform on which it is hosted). The explosion of innovation this hyper-competitive, hyper-collaborative “Internet of AI agents” points to will only be possible if those agents are given the privacy and control they need to truly act independently. There is no “free market of ideas” without the actors in that market having their own free will. Over the past quarter, the explosion of localized AI agent frameworks built on open architectures, such as OpenClaw, has demonstrated how quickly sovereign AI can move when unshackled from centralized cloud control. By moving AI from corporate servers to local, peer-to-peer networks, users are shifting from “renting” intelligence to owning their own fully autonomous stacks. This structural re-architecture bypasses Big Tech gatekeepers, sparking a wave of innovation and privacy that centralized platforms can no longer control.
Privacy: empowering individuals over corporations
Centralized AI thrives on vast data lakes, often harvested with little regard for individual privacy. Big Tech’s history of squashing competition and skirting ethical boundaries, whether through monopolistic practices or opaque data usage, has eroded trust. Decentralized AI, by contrast, leverages blockchain’s cryptographic security to prioritize individual privacy. Users control their data, sharing it selectively via secure, transparent protocols. Platforms like Akash Network ensure that personal data remains encrypted and decentralized, preventing the kind of mass exploitation seen in centralized systems. This privacy-first approach isn’t just ethical; it’s a market differentiator in an era where 83% of enterprises are shifting workloads to private clouds to escape public cloud vulnerabilities.
But it’s not only individuals who are disadvantaged by the current centralized model. Businesses, institutions and entire industries have been forced to keep their most valuable datasets locked away. Sometimes for competitive reasons, sometimes because of fiduciary, custodial, or regulatory obligations, making sharing with centralized LLMs flatly impossible. The risk of inadvertently uploading trade secrets, proprietary R&D, sensitive customer records or regulated data into the black box of a hyperscaler has been a hard stop for meaningful enterprise-scale AI adoption.
But the deeper significance of this shift goes beyond unlocking long-dormant corporate data vaults; it redefines what enterprise trust in AI actually looks like. This is core to the mission of organizations like the Advanced AI Society, which argues that we are entering an era where enterprise customers will not merely prefer privacy-preserving infrastructure; they will demand something far stronger: proof of control. Not marketing promises, not compliance checklists, but cryptographic, verifiable assurance that the business, and only the business, controls its data, compute pathways, storage substrates, proprietary model weights and fine-tuned derivatives. In a world where AI touches regulated workflows, intellectual property and customer-sensitive operations, enterprises will insist on provable guarantees that nothing escapes their perimeter, and nothing can be silently copied, scraped or siphoned by a third party. Decentralized AI is the first architecture capable of delivering this new trust standard. It shifts the question from “Do we trust our vendor?” to “Can we verify our sovereignty?” and that inversion is the fault line upon which the next decade of enterprise AI adoption will hinge.
This is where decentralized AI and confidential computation transform the playing field. For the first time, companies can safely apply their private datasets to local or domain-specific model training without surrendering custody or visibility. Whether through encrypted compute, zero-knowledge architectures, or decentralized execution layers, the data never leaves their control. What was once an unbridgeable chasm of AI potential on one side and locked corporate data on the other can now finally be crossed.
And that unlock is enormous. Non-internet-platform companies represent the vast majority of the world’s valuable information: pharmaceutical research vaults, medical imaging archives, energy exploration data, financial pattern histories, supply chain telemetry, manufacturing QA logs and more. These troves have been sealed off from AI’s learning loops due to the inherent danger of centralized training. Decentralized, privacy-preserving AI flips that equation, turning previously inaccessible datasets into catalytic assets.
If AI is truly going to cure cancer, solve energy scarcity, overhaul logistics, accelerate drug discovery or reinvent scientific research, it cannot rely solely on whatever scraps of information Big Tech has scraped from the public internet. The great breakthroughs will come when the off-internet world—the real, industrial, scientific and institutional world—can safely contribute its data to AI models without risking exposure, theft or exploitation.
Decentralized AI is the architecture that makes that future possible. It doesn’t just empower individuals against corporations; it empowers every enterprise that has been forced to sit on the sidelines. And when those data vaults finally open on their own terms and under their own control, that will be the great unlock that propels AI from impressive novelty to civilization-scale engine.
Compute capacity: harnessing the world’s spare resources
Centralized AI’s Achilles’ heel is its insatiable demand for compute power, requiring dozens of gigawatts to train and run models like GPT-4 or Llama. Data centers strain global energy grids, raising environmental concerns and increasing consumer costs.
Decentralized AI flips this paradigm by tapping into spare compute capacity such as idle GPUs in homes, offices or even smartphones. Platforms like Targon (Bittensor Subnet 4), focused on making AI inference faster and cheaper, aggregate distributed resources to deliver scalable solutions. OAK Research highlights that Targon’s benchmarks reportedly outperform Web2 solutions in certain tasks, offering lower-cost inference with acceptable quality—a game-changer for commodification, scaling and downstream integrations. By efficiently using existing energy sources, decentralized AI aligns with a sustainable future while democratizing access to cutting-edge technology.
Blockchain as the backbone of trust and innovation
AI is moving to blockchains, and for good reason. Blockchain solves critical pain points that centralized systems sidestep or exacerbate:
- Training validation: Decentralized networks like Bittensor use consensus mechanisms (e.g., Yuma Consensus) to validate AI model outputs, ensuring quality without centralized gatekeepers.
- Copyright compliance: Blockchain’s immutable ledger tracks data and model provenance, addressing intellectual property disputes—a growing concern in AI.
- AI guardrails: Decentralized governance creates transparent, community-driven rules to prevent misuse.
- Value transactions: Tokens like those on Akash enable fair reward distribution for contributors, from miners to validators.
- Data security and privacy: Distributed storage and encryption protect sensitive data, unlike centralized clouds prone to breaches. These features empower a collaborative ecosystem where developers, users and enterprises co-create value, unhindered by Big Tech’s competitive stranglehold.
Open source: the catalyst for exponential growth
Decentralized AI thrives on open-source principles, fostering innovation at a pace centralized systems can’t match. Open-source models, like those on Bittensor for specialized tasks, invite global contributions and enable rapid iteration on use cases ranging from video analysis to predictive markets. Centralized AI, by contrast, locks models behind proprietary walls, limiting adaptability and accessibility. Open-source decentralized platforms not only accelerate innovation but also align with the growing demand for transparency in AI development—a demand Big Tech often ignores.
The investment case: why now?
The $12 trillion centralized AI market is a mature Goliath, but its growth is constrained by ethical scandals, energy demands and diminishing returns. Decentralized AI, though smaller, is a nimble $12B David, poised for exponential growth. Its ability to address privacy, leverage distributed computing and foster open innovation makes it a superior long-term bet. Investors who back platforms like Bittensor, Storj, or Akash now, while valuations are low, may stand to reap outsized returns as the blockchain AI market scales to $200 billion by 2030. The shift is already underway: enterprises are moving to private clouds, and communities are embracing decentralized governance.
The future is decentralized
Decentralized AI isn’t just a technological evolution; it’s a societal necessity. It counters Big Tech’s monopolistic grip, protects user privacy and harnesses global resources for sustainable growth. As platforms like Bittensor and Akash pioneer scalable compute markets, they pave the way for a world where AI serves the many, not the few. The delta in the valuation gap will close. Not because centralized AI will falter, but because decentralized AI’s potential is too vast to ignore. For investors, developers and visionaries, this is the most exciting space to watch, build and invest in over the next three years. The revolution is here, and it’s decentralized.

Women’s FA Cup: Holders Chelsea, Man City and Arsenal into last eight

My Moleskine wasn’t enough to save my mental health but this app was
Prince William ‘not in calm state’ to watch movie as he attends BAFTAs

Smart energy pays enters the US market, targeting scalable financial infrastructure

Why Israel is blocking foreign journalists from entering
Software stocks enter bear market on AI disruption fear with ServiceNow plunging 10%

Analysis of Financial Statements Marathon | Class 12 | All Previous Year Questions (PYQs)| CBSE 2026

We Spent ONLY Money on Food in Istanbul (Massive Mistake?)

Blackrock Started The Trend Of Directly Buying Crypto! UK Government To Use Crypto! Bitcoin Trouble?
-

 Video6 days ago
Bitcoin: We’re Entering The Most Dangerous Phase
-

 Crypto World5 days ago
Can XRP Price Successfully Register a 33% Breakout Past $2?
-

 Video3 days ago
XRP News: XRP Just Entered a New Phase (Almost Nobody Noticed)
-

 Fashion2 days ago
Weekend Open Thread: Boden – Corporette.com
-

 Sports6 days ago
GB's semi-final hopes hang by thread after loss to Switzerland
-

 Politics13 hours ago
Baftas 2026: Awards Nominations, Presenters And Performers
-
 Tech6 days ago
The Music Industry Enters Its Less-Is-More Era
-

 Business5 days ago
Infosys Limited (INFY) Discusses Tech Transitions and the Unique Aspects of the AI Era Transcript
-

 Entertainment4 days ago
Kunal Nayyar’s Secret Acts Of Kindness Sparks Online Discussion
-

 Video5 days ago
Financial Statement Analysis | Complete Chapter Revision in 10 Minutes | Class 12 Board exam 2026
-

 Tech4 days ago
Retro Rover: LT6502 Laptop Packs 8-Bit Power On The Go
-
 Sports4 days ago
Clearing the boundary, crossing into history: J&K end 67-year wait, enter maiden Ranji Trophy final | Cricket News
-

 Business7 hours ago
Mattel’s American Girl brand turns 40, dolls enter a new era
-

 Entertainment4 days ago
Dolores Catania Blasts Rob Rausch For Turning On ‘Housewives’ On ‘Traitors’
-

 Business2 hours ago
Law enforcement kills armed man seeking to enter Trump’s Mar-a-Lago resort, officials say
-

 Business5 days ago
Tesla avoids California suspension after ending ‘autopilot’ marketing
-

 Politics5 days ago
Eurovision Announces UK Act For 2026 Song Contest
-

 Tech2 hours ago
Anthropic-Backed Group Enters NY-12 AI PAC Fight
-

 Crypto World4 days ago
WLFI Crypto Surges Toward $0.12 as Whale Buys $2.75M Before Trump-Linked Forum
-

 Politics4 hours ago
Maine has a long track record of electing moderates. Enter Graham Platner.