
Crypto World
Bitcoin Price Rises as Spot Bitcoin ETFs Attract $1.42B in Inflows
Join Our Telegram channel to stay up to date on breaking news coverage
The Bitcoin price has jumped by a fraction of a percentage in the last 24 hours to trade at $95,324, as spot Bitcoin ETFs saw a strong return recording $1.42 billion in net inflows over the past week.
ETF activity was heavily concentrated in the middle of the week. Data shows that Wednesday delivered the largest single-day inflow of approximately $844 million, followed closely by $754 million on Tuesday. Although momentum cooled toward the end of the week, including a notable $395 million outflow on Friday, the strong midweek buying was enough to push total weekly inflows to their highest level since early October. At that time, spot Bitcoin ETFs attracted around $2.7 billion, highlighting the scale of the renewed interest.
The latest inflow trend suggests that institutional investors are gradually returning to Bitcoin through regulated investment products after a period of caution. Vincent Liu, chief investment officer at Kronos Research, said that ETF inflows indicate long-only allocators re-entering the market. He added that ETF buying, combined with reduced selling from large Bitcoin holders, or whales, is helping tighten effective supply.

On-chain data shows whale selling pressure has eased compared to late December, reducing a key source of distribution and downside risk. Ethereum ETFs also posted positive inflows, though at more modest levels compared to Bitcoin. The strongest inflow day occurred on Tuesday, with approximately $290 million, followed by $215 million on Wednesday. However, late-week selling weighed on performance, with Friday seeing roughly $180 million in outflows, trimming total weekly inflows to around $479 million.
Despite the improved flow data, analysts remain cautious. Market observers note that short-lived spikes in ETF inflows have historically led to brief price rebounds rather than sustained rallies. Analysts argue that Bitcoin will likely need several consecutive weeks of strong and consistent ETF demand to support a durable uptrend. Without sustained inflows, price gains may continue to face resistance and fade during periods of weaker demand.
Bitcoin Price Consolidates Above Key Support After Bullish Breakout
Bitcoin (BTC) shows steady consolidation after a strong bullish breakout, according to the latest 4-hour chart, as price trades at $95,470 at the time of writing. The chart highlights a major support zone near the $86,000–$88,000 range, where Bitcoin previously formed a solid base.
This area acted as a demand zone, absorbing selling pressure and setting the stage for a rebound. From this level, BTC began forming a rounded bottom pattern, a classic bullish structure that often signals a gradual shift from bearish to bullish momentum. The bullish bias was confirmed after the price broke above a key resistance zone around $91,000–$92,000, labeled as a bullish breakout on the chart. Following the breakout, Bitcoin rallied sharply toward the $97,000–$98,000 area, where sellers temporarily stepped in. This level now acts as short-term resistance.
Currently, BTC is moving sideways just below resistance, suggesting healthy consolidation rather than weakness. Price is holding above the former resistance zone, which has now flipped into support around $94,500–$95,000. This behavior often indicates that buyers are defending higher levels while preparing for a possible continuation move.
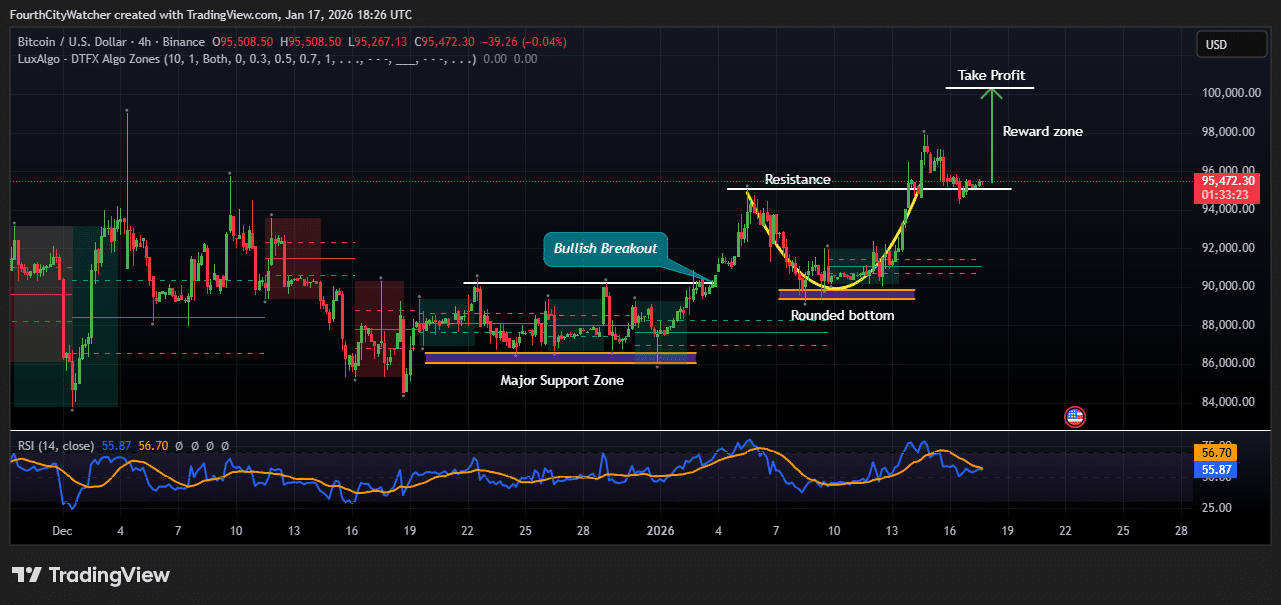
BTCUSD Chart Analysis Source: Tradingview
The chart also marks a reward zone targeting the $100,000 psychological level, aligning with the projected take-profit area. A clean break and close above the $96,000–$97,000 resistance could open the door for a retest of six-figure prices in the near term.
Momentum indicators support this outlook, with the Relative Strength Index (RSI) is hovering around the mid-50s, indicating a neutral-to-bullish momentum. Notably, RSI is neither overbought nor oversold, leaving room for further upside if buying pressure increases.
The technical structure remains constructively bullish, as long as Bitcoin holds above the $94,000 support zone. A drop below this level could invite short-term pullbacks toward $92,000, but unless BTC loses the major support near $88,000, the broader trend continues to favor the bulls.
Related Articles:
Best Wallet – Diversify Your Crypto Portfolio

- Easy to Use, Feature-Driven Crypto Wallet
- Get Early Access to Upcoming Token ICOs
- Multi-Chain, Multi-Wallet, Non-Custodial
- Now On App Store, Google Play
- Stake To Earn Native Token $BEST
- 250,000+ Monthly Active Users
Join Our Telegram channel to stay up to date on breaking news coverage


Key Takeaways
- PLTR shares declined approximately 6% following Michael Burry’s bubble warning
- The ‘Big Short’ investor argues Anthropic is capturing market share with ARR surging from $9B to $30B
- Palantir’s forward P/E ratio stands at roughly 115x versus a sector median of 21x
- Analyst opinions vary: Rosenblatt maintains $200 Buy; Benchmark expresses valuation worries
- Street consensus remains Moderate Buy with average target of $194.61
The legendary investor from “The Big Short,” Michael Burry, publicly challenged Palantir’s market position on Wednesday through a post on X, declaring the stock potentially overvalued while highlighting Anthropic’s growing dominance in enterprise artificial intelligence.
PLTR shares tumbled approximately 6% during regular trading hours following his remarks. After-hours activity showed some recovery as the stock climbed back toward $141.18 with renewed buying interest.
Palantir Technologies Inc., PLTR
Burry previously revealed a short bet against Palantir in early 2025. His Wednesday commentary escalated his critique, focusing on fundamental shifts in the competitive environment.
“Anthropic is eating Palantir’s lunch,” Burry stated. “That massive boost from $9B to $30B ARR at Anthropic is because Anthropic offers the easier, cheaper, intuitive solution for businesses.”
His argument drew support from Ramp data, referencing a March 2026 study by economist Ara Kharazian. The analysis revealed that nearly 25% of Ramp’s business customers now subscribe to Anthropic services — a dramatic increase from just 4% twelve months earlier.
Burry further emphasized that Anthropic is capturing 73% of incremental enterprise AI expenditures, while the broader AI sector displays zero-sum characteristics, with OpenAI recording its steepest monthly user decline ever.
Premium Pricing Under Scrutiny
With a forward price-to-earnings multiple hovering around 115x, Palantir commands a significant premium over its sector median of 21x and towers above comparable large-cap AI competitors. This valuation disparity has consistently fueled bearish arguments.
Benchmark’s Yi Fu Lee maintains a neutral stance with a Hold rating. His position reflects concerns that current pricing assumes flawless operational performance, leaving limited room for growth deceleration.
Rosenblatt analyst John McPeake takes the opposing view. He stands by his Buy recommendation and $200 valuation target, highlighting forthcoming developments such as the “Golden Dome” missile defense initiative. McPeake projects Palantir’s involvement in this contract could drive billions in revenue through 2028.
Bank of America’s Mariana Perez also retains her Buy stance, characterizing the selloff as a temporary response to news flow. She emphasizes Palantir’s entrenched position within critical government data infrastructure as a sustainable competitive moat.
Wall Street Perspective
The current analyst consensus registers as Moderate Buy, comprising 14 Buy ratings, 5 Hold ratings, and 2 Sell ratings.
The mean price objective stands at $194.61 post-volatility, suggesting potential upside of approximately 38% from Wednesday’s closing price.
Palantir delivered 70% year-over-year revenue expansion in its latest quarterly results, a metric that bullish investors cite as validation of the company’s underlying business strength despite valuation controversies.
Burry isn’t the sole prominent skeptic. Short-seller Andrew Left revealed his own short position in Palantir last September, additionally highlighting Databricks as a superior alternative investment.
Since Anthropic remains privately held, investors lack direct mechanisms to capitalize on Burry’s competitive thesis — though the downward pressure on PLTR has proven tangible.
The official designation of the Maven Smart System represents one of the more concrete near-term positive catalysts currently on the horizon for shareholders.

Binance announced it will delist six tokens on April 23, triggering immediate losses across the affected assets.
The exchange will remove Beefy.Finance (BIFI), FIO Protocol (FIO), FunToken (FUN), Measurable Data Token (MDT), Orchid (OXT), and Wanchain (WAN) from all spot trading pairs.
Binance Purges Six Tokens in Latest Delisting Wave
The exchange attributed its decision to its periodic review process. It evaluates development activity, trading volume, network security, and team commitment, among other factors.
“At Binance, we periodically review each digital asset we list to ensure that it continues to meet a high level of standard and industry requirements. When a coin or token no longer meets these standards or the industry landscape changes, we conduct a more in-depth review and potentially delist it. Our priority is to ensure the best services and protections for our users while continuing to adapt to evolving market dynamics,” the blog read.
Follow us on X to get the latest news as it happens
The sell-off was swift. FUN dropped 27.93% within minutes of the April 9 notice, the steepest fall among the six.
MDT followed with a 22.79% decline, while FIO lost 20.51%. BIFI fell 8.93%, and OXT slid 13.42%. WAN saw the mildest reaction, with a dip of just 1.24%.

This is another wave of removals this month. On April 1, Binance delisted eight tokens, including Loopring (LRC) and Radiant Capital (RDNT), which also saw double-digit drops following the announcement.
Several of these tokens had been flagged well before removal. Binance placed BIFI and MDT under its Monitoring Tag in June 2025. FUN and OXT received the same warning label in March 2026.
The label flags tokens that show elevated risk and sharper price swings than their peers. Binance reviews tagged assets on an ongoing basis and may delist those that fail to meet its standards.
Subscribe to our YouTube channel to watch leaders and journalists provide expert insights
The post Binance Delisting Wipeout: 6 Altcoins Crash After Exchange Pulls the Plug appeared first on BeInCrypto.
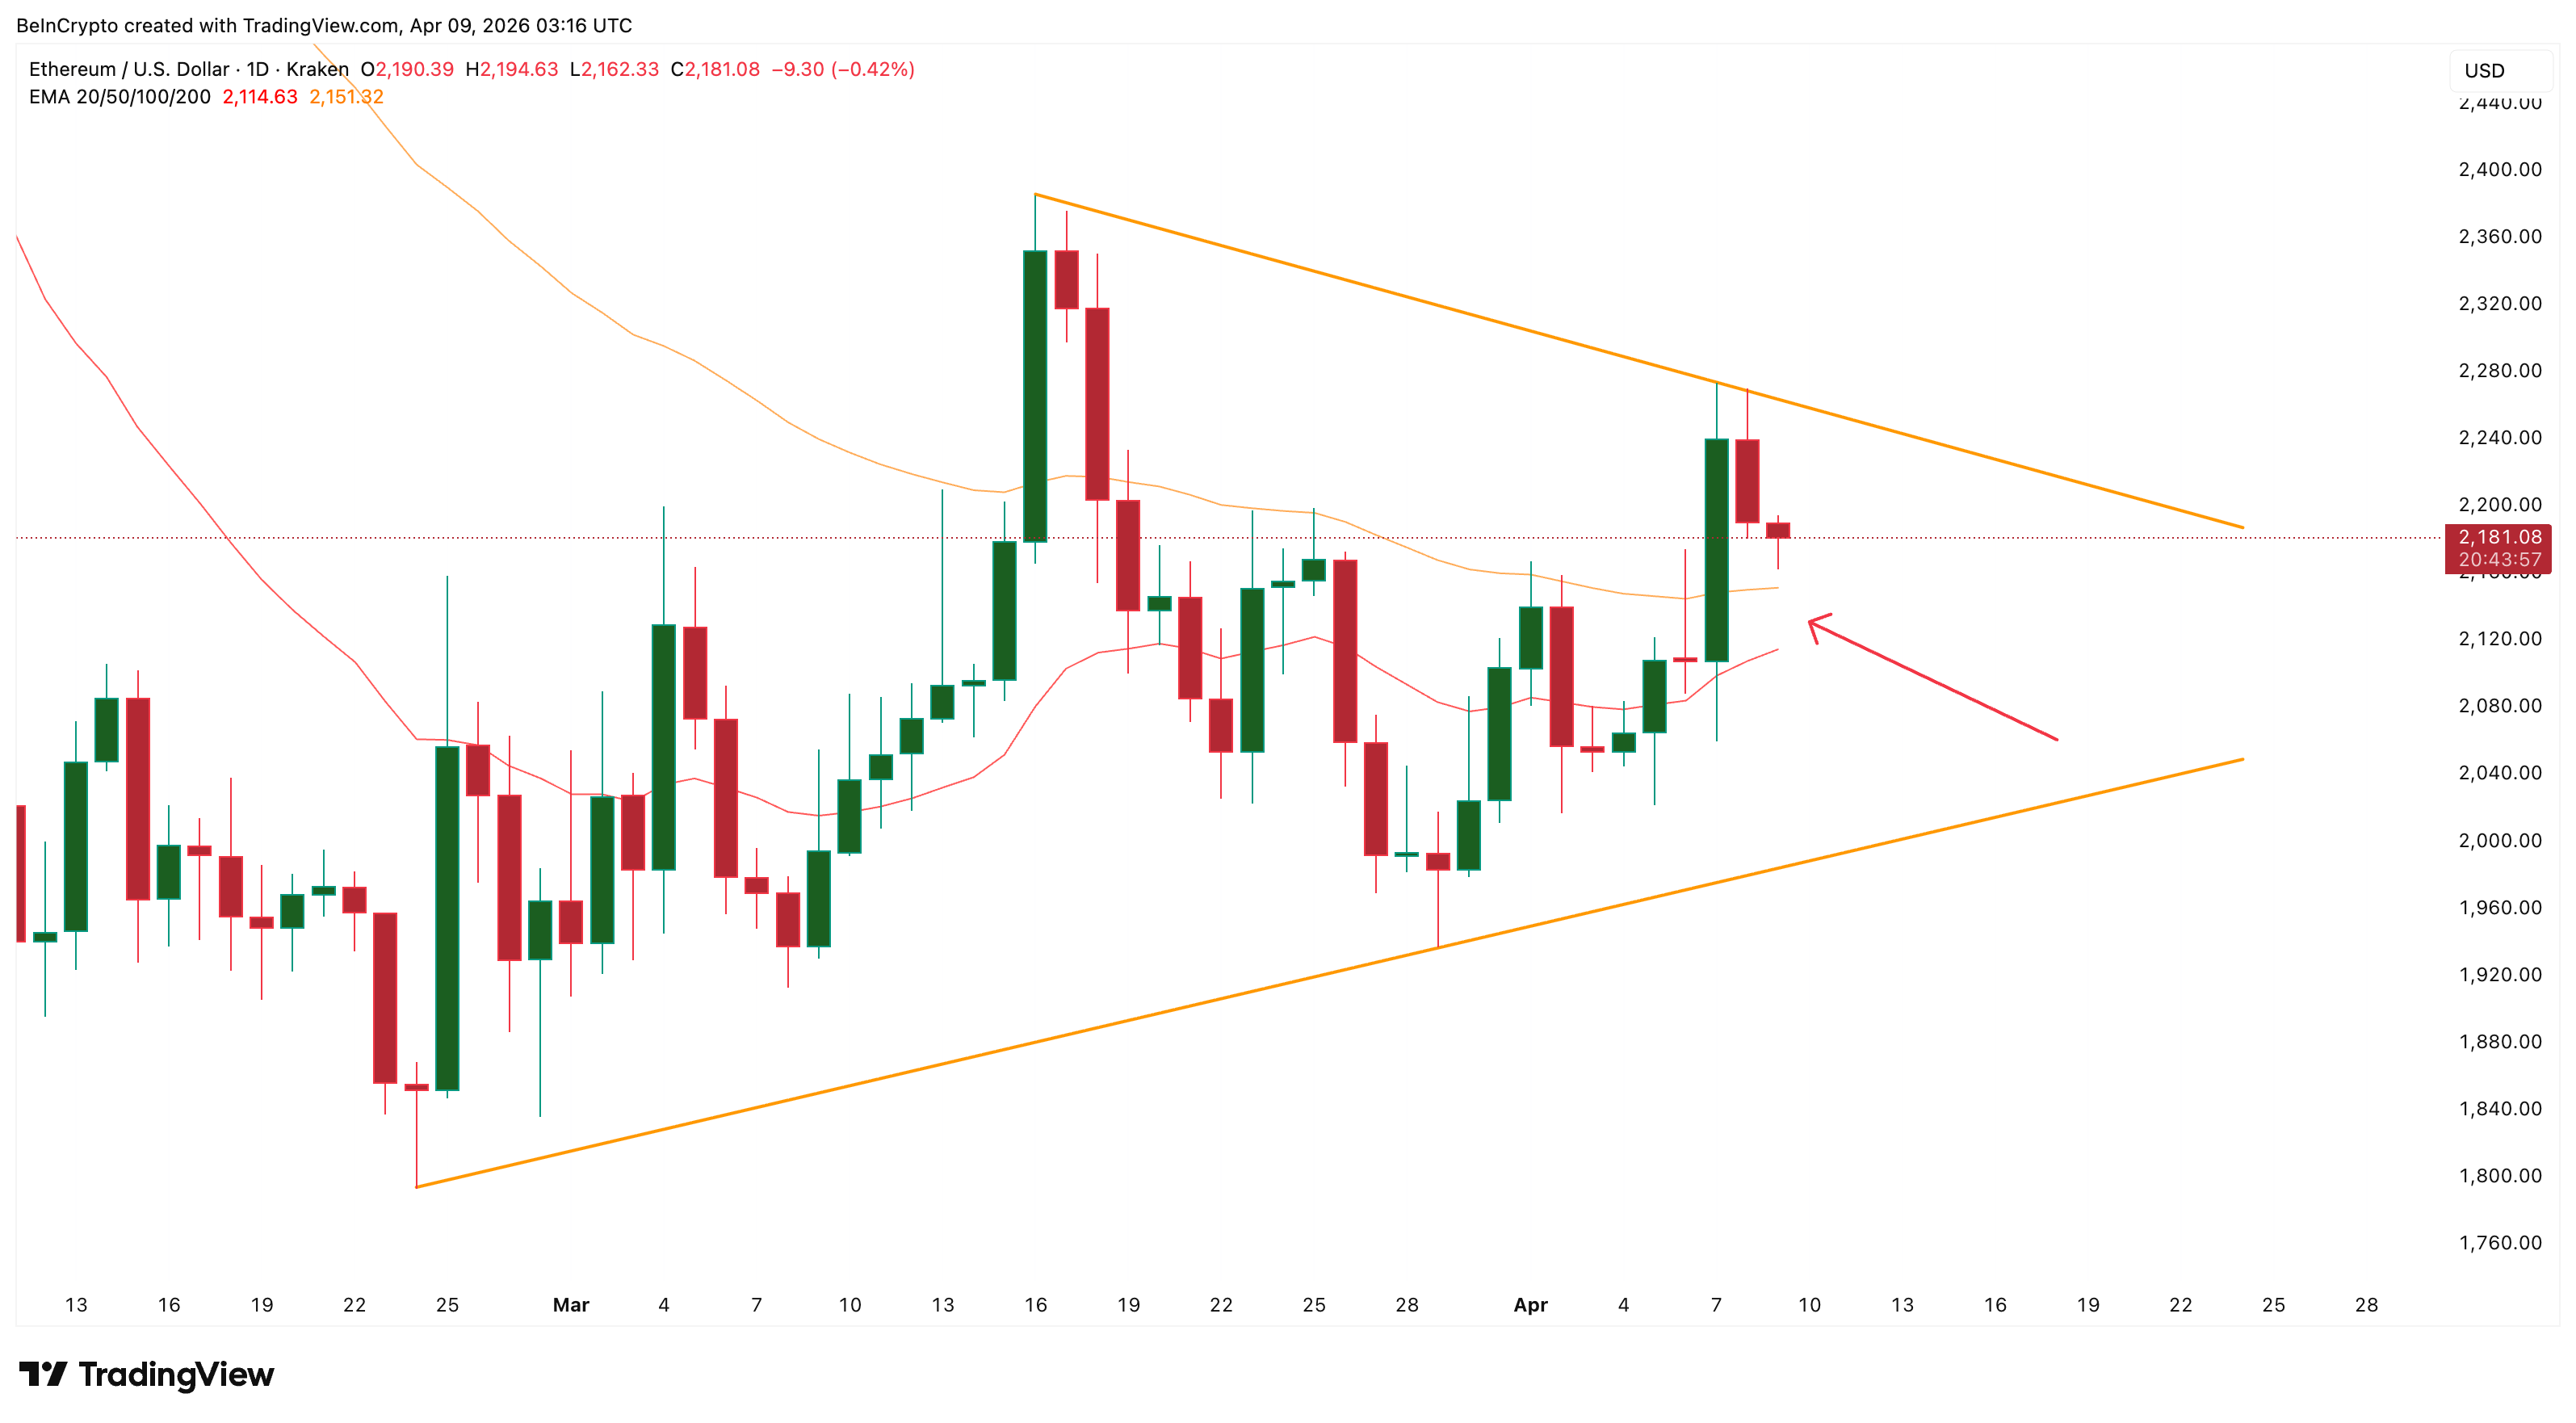
Ethereum (ETH) price trades at $2,181 on April 9, sitting just 0.5% above a critical technical level while facing coordinated selling pressure from three directions.
The Ethereum Foundation, spot ETF holders, and whales are all reducing exposure simultaneously. Meanwhile, two key moving averages on the daily chart are converging toward a bullish crossover. The combination puts the Ethereum price in its most conflicting position yet, in April.
Symmetrical Triangle Tightens as Two EMAs Close In
Ethereum price has been trading inside a symmetrical triangle on the daily chart since late February. The pattern has compressed price between a series of lower highs and higher lows, squeezing the range tighter with each session.
The most recent test of the upper trendline was rejected. Sellers defended that level aggressively, pushing ETH back toward the middle of the triangle. The rejection matters because it confirms the pattern is still intact and no breakout has occurred.
The 20-day Exponential Moving Average (EMA), a trend indicator that gives greater weight to recent price movements, sits at $2,114, still below the 50-day EMA at $2,151. The gap between them is narrowing. If the 20-day manages to cross above the 50-day, it would flash a golden cross and shift short-term momentum bullish.
However, with selling pressure mounting from three fronts, the risk is that the 20-day stalls and diverges back downward, a failed crossover attempt that would reinforce the bearish structure.
Want more token insights like this? Sign up for Editor Harsh Notariya’s Daily Crypto Newsletter here.
A failed crossover attempt inside a tightening triangle would tilt the odds toward a downside breakdown. But the chart setup alone does not explain why ETH is under this much pressure. The selling is not just technical. It is structural.
Foundation, ETFs, and Whales All Reduce Exposure at Once
The sell pressure is arriving from three separate fronts simultaneously.
The Ethereum Foundation announced it would convert 5,000 ETH into stablecoins via CoWSwap’s TWAP feature to fund R&D, grants, and donations.
According to on-chain tracker Lookonchain, 3,750 ETH worth $8.3 million has already been sold at an average price of $2,214. Another 1,250 ETH, worth approximately $2.77 million, remains earmarked for conversion. The Foundation’s own announcement framed the sale as routine treasury management, but the market reads any large sell from the project’s creator as a bearish signal regardless of intent.
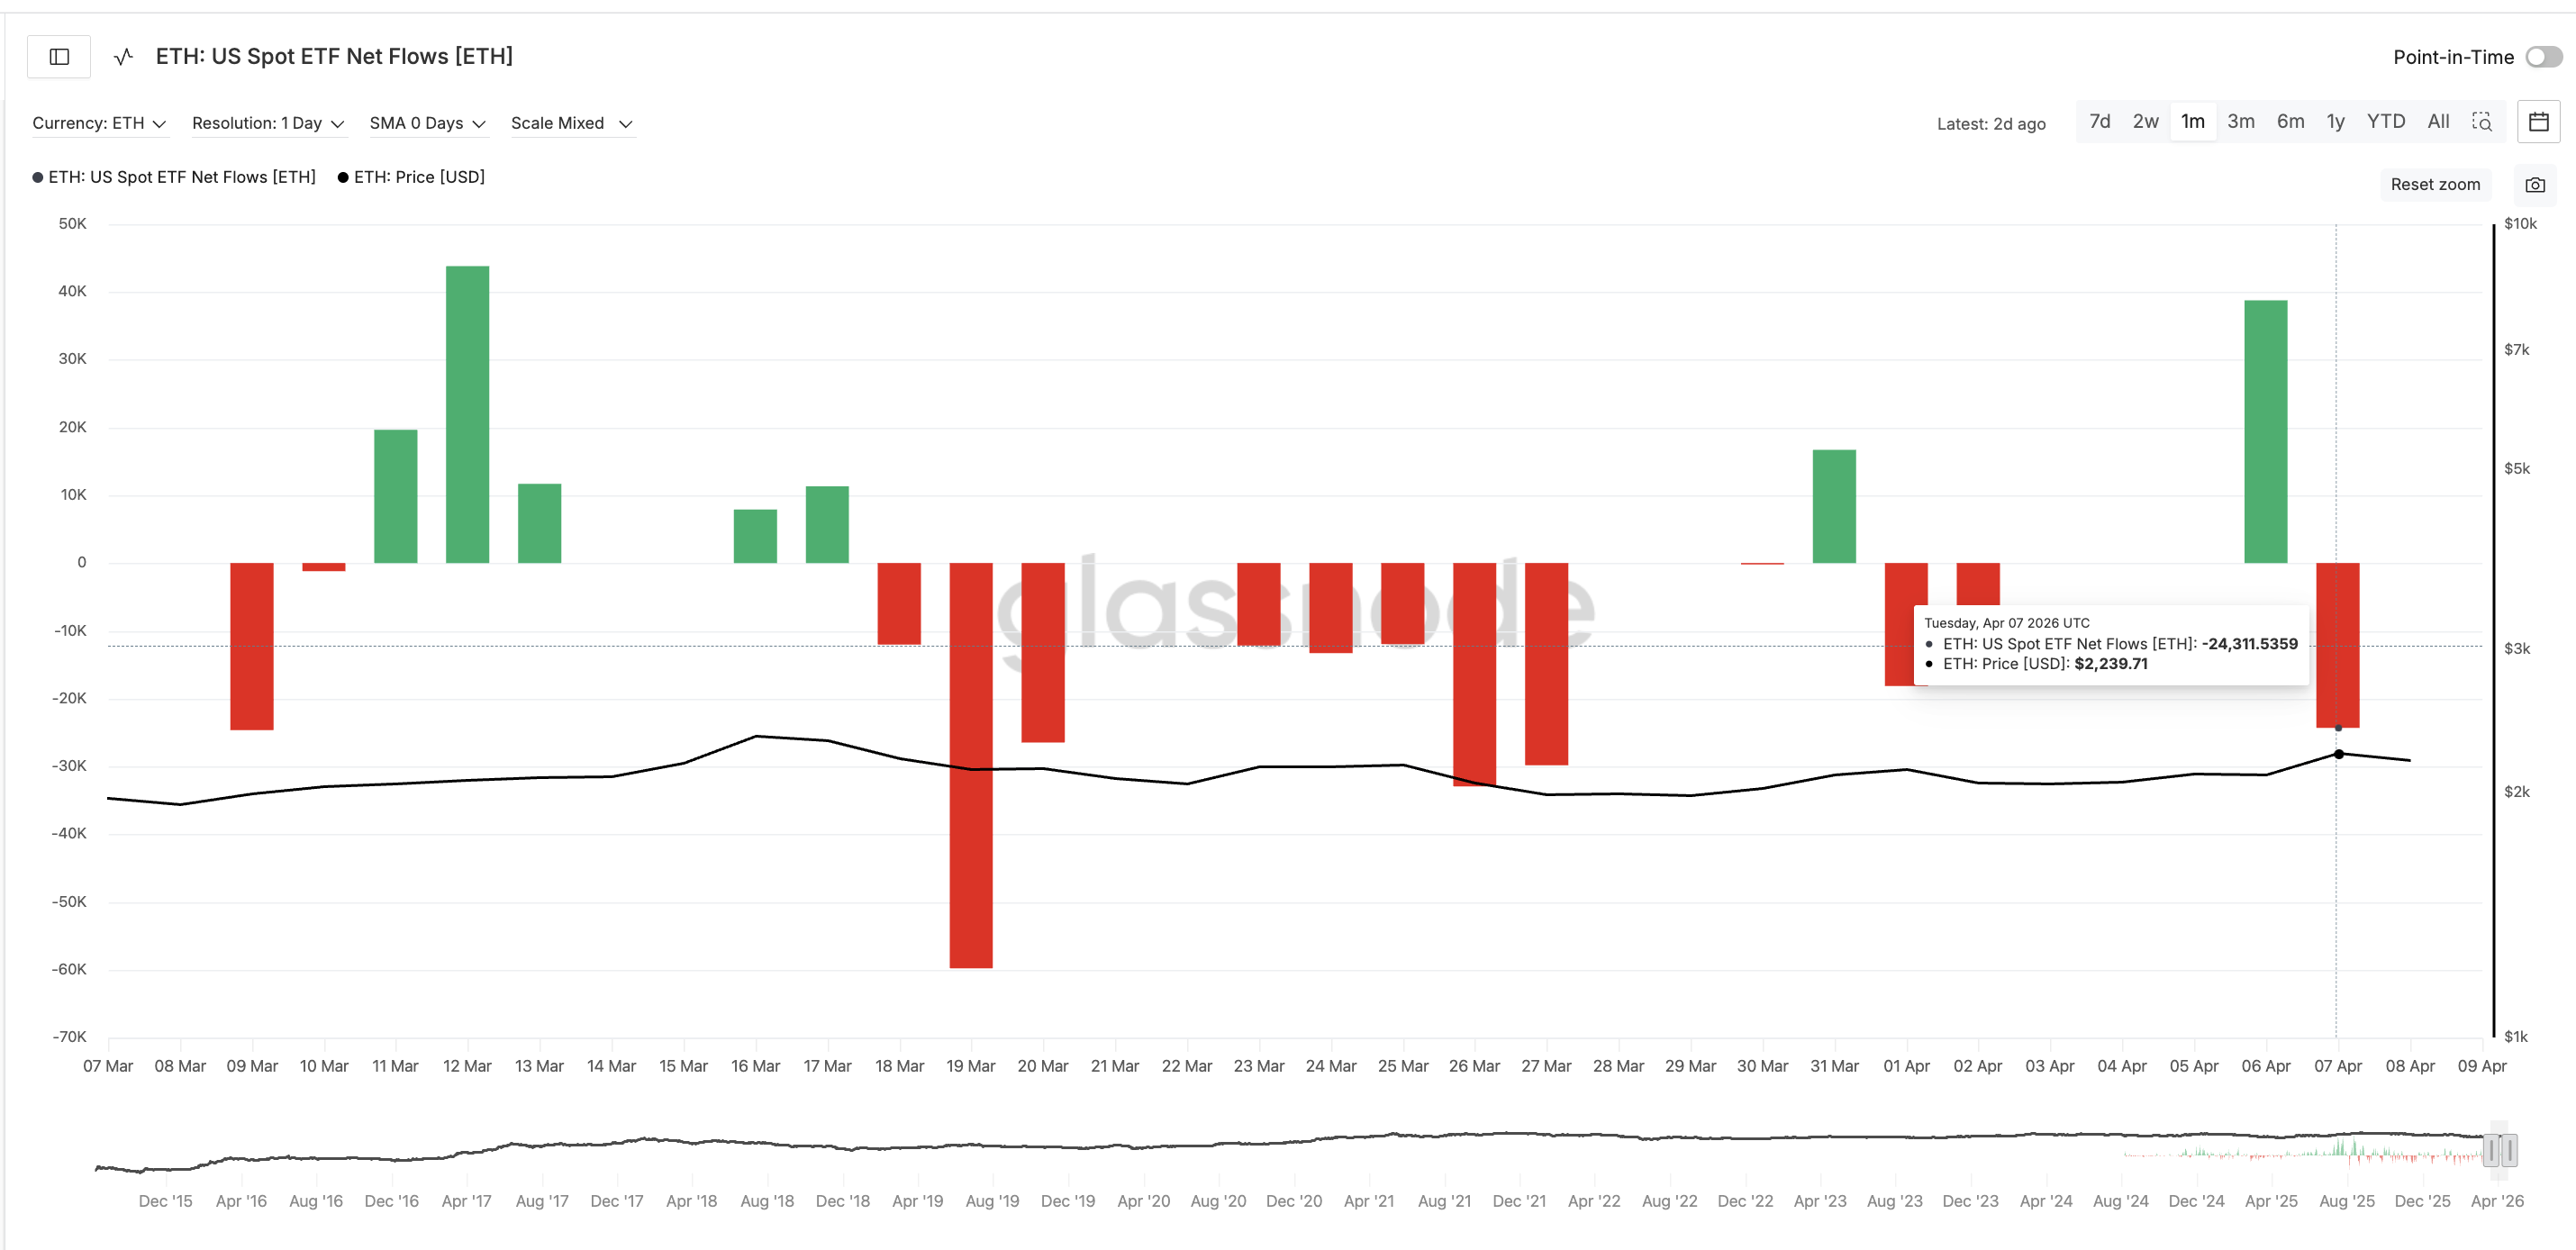
The ETF picture flipped just as fast. US spot ETH ETF flows recorded a strong inflow of 38,769 ETH on April 6. One day later, April 7 saw an outflow of 24,311 ETH. The reversal erased most of the previous session’s institutional demand in a single day.
Whale behavior adds the third layer.
According to Santiment data, the supply held by whales outside of exchanges peaked at approximately 123 million ETH around April 8 and has since dropped to 122.93 million, roughly $153 million. The decline appears modest in absolute terms, but the timing matters. Whales began reducing holdings around the same time the Foundation started selling and ETF flows reversed.
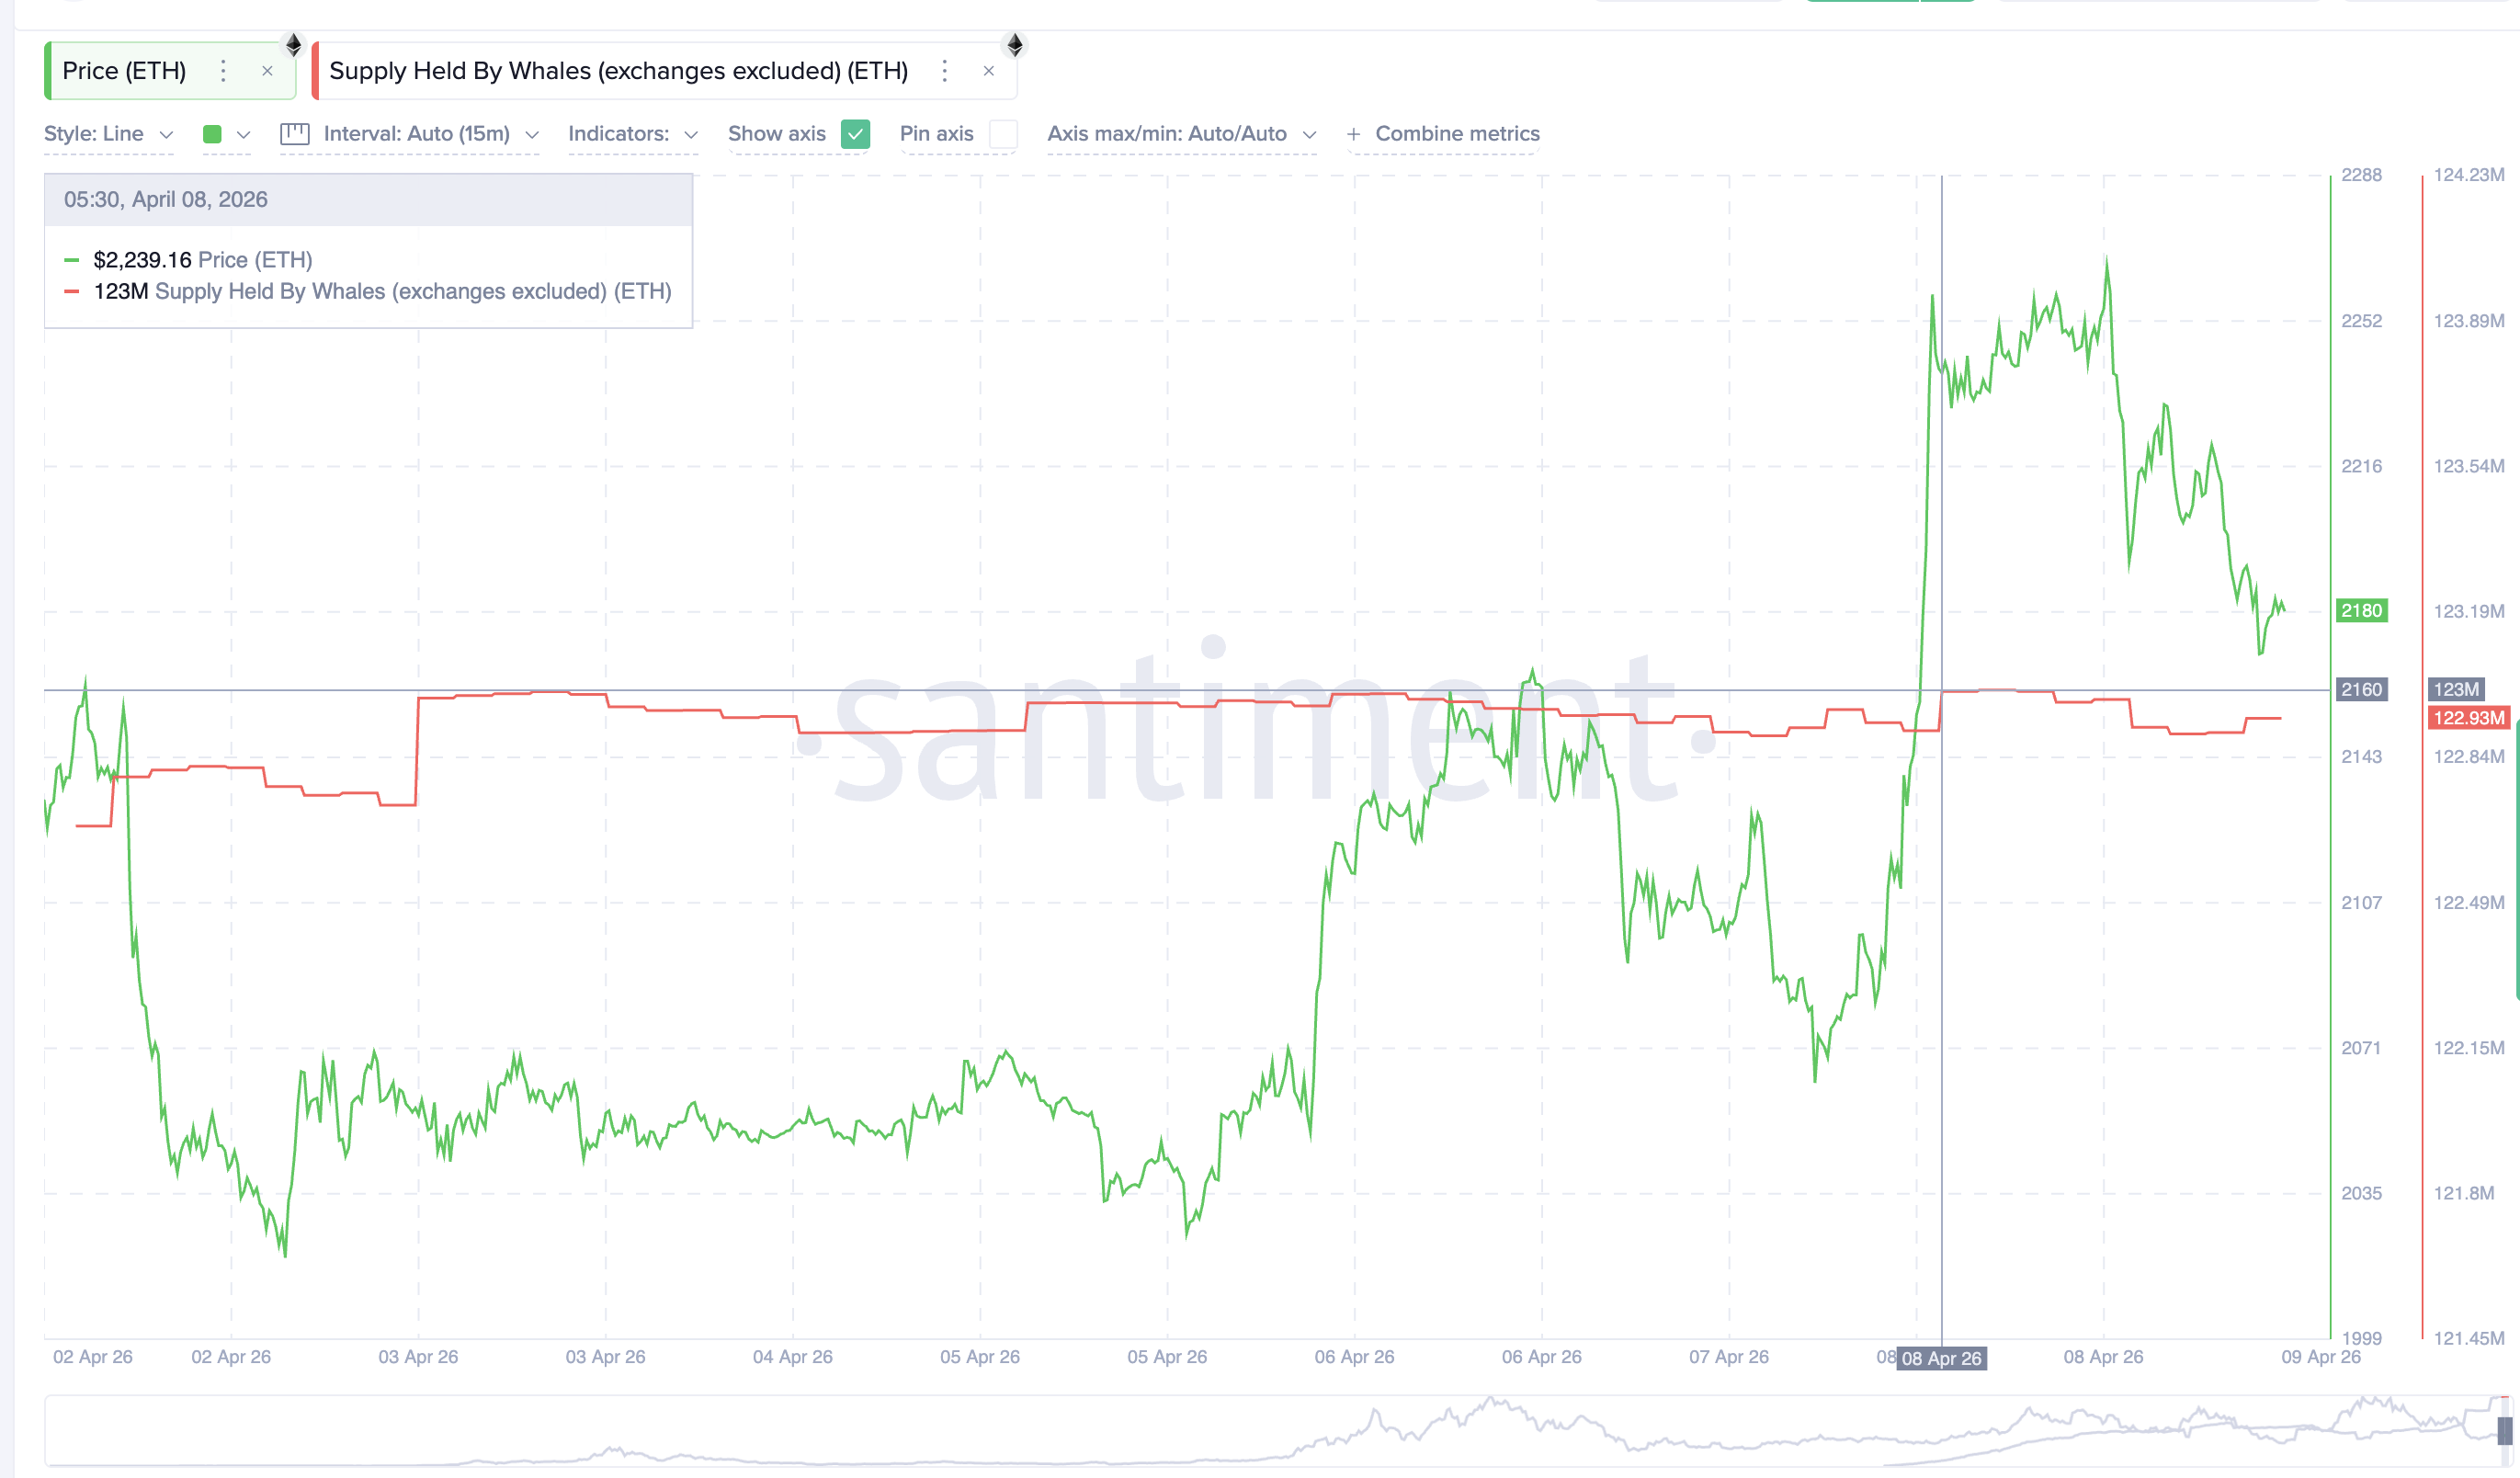
When three independent groups, the Foundation, ETF holders, and whales, all reduce exposure within the same 48-hour window, it creates a supply overhang that technical patterns alone cannot absorb. The ETH price chart now decides how much of this pressure the market can handle.
Ethereum Price Sits 0.5% Above the Level That Changes Everything
ETH trades at $2,181, just 0.5% above the 0.236 Fibonacci level of $2,168. This is the line that matters most right now. A daily close below $2,168 would confirm that the selling pressure from all three fronts is overwhelming dip buyers and would place ETH firmly in the lower half of the triangle.
Below $2,168, the next supports are $2,102 at the 0.382 level and $2,049 at the 0.5 level. A drop below $1,995 at the 0.618 level would bring the lower trendline of the symmetrical triangle into direct focus, raising the risk of a breakdown toward $1,823.
Ethereum price did briefly dip below $2,168 during the session before buying pressure helped it reclaim the level. That reclaim shows buyers are aware of the line. However, a second test with the EMA golden cross still unconfirmed and the Foundation still holding 1,250 ETH to sell may not hold as well. The broader market weakness adds another headwind.
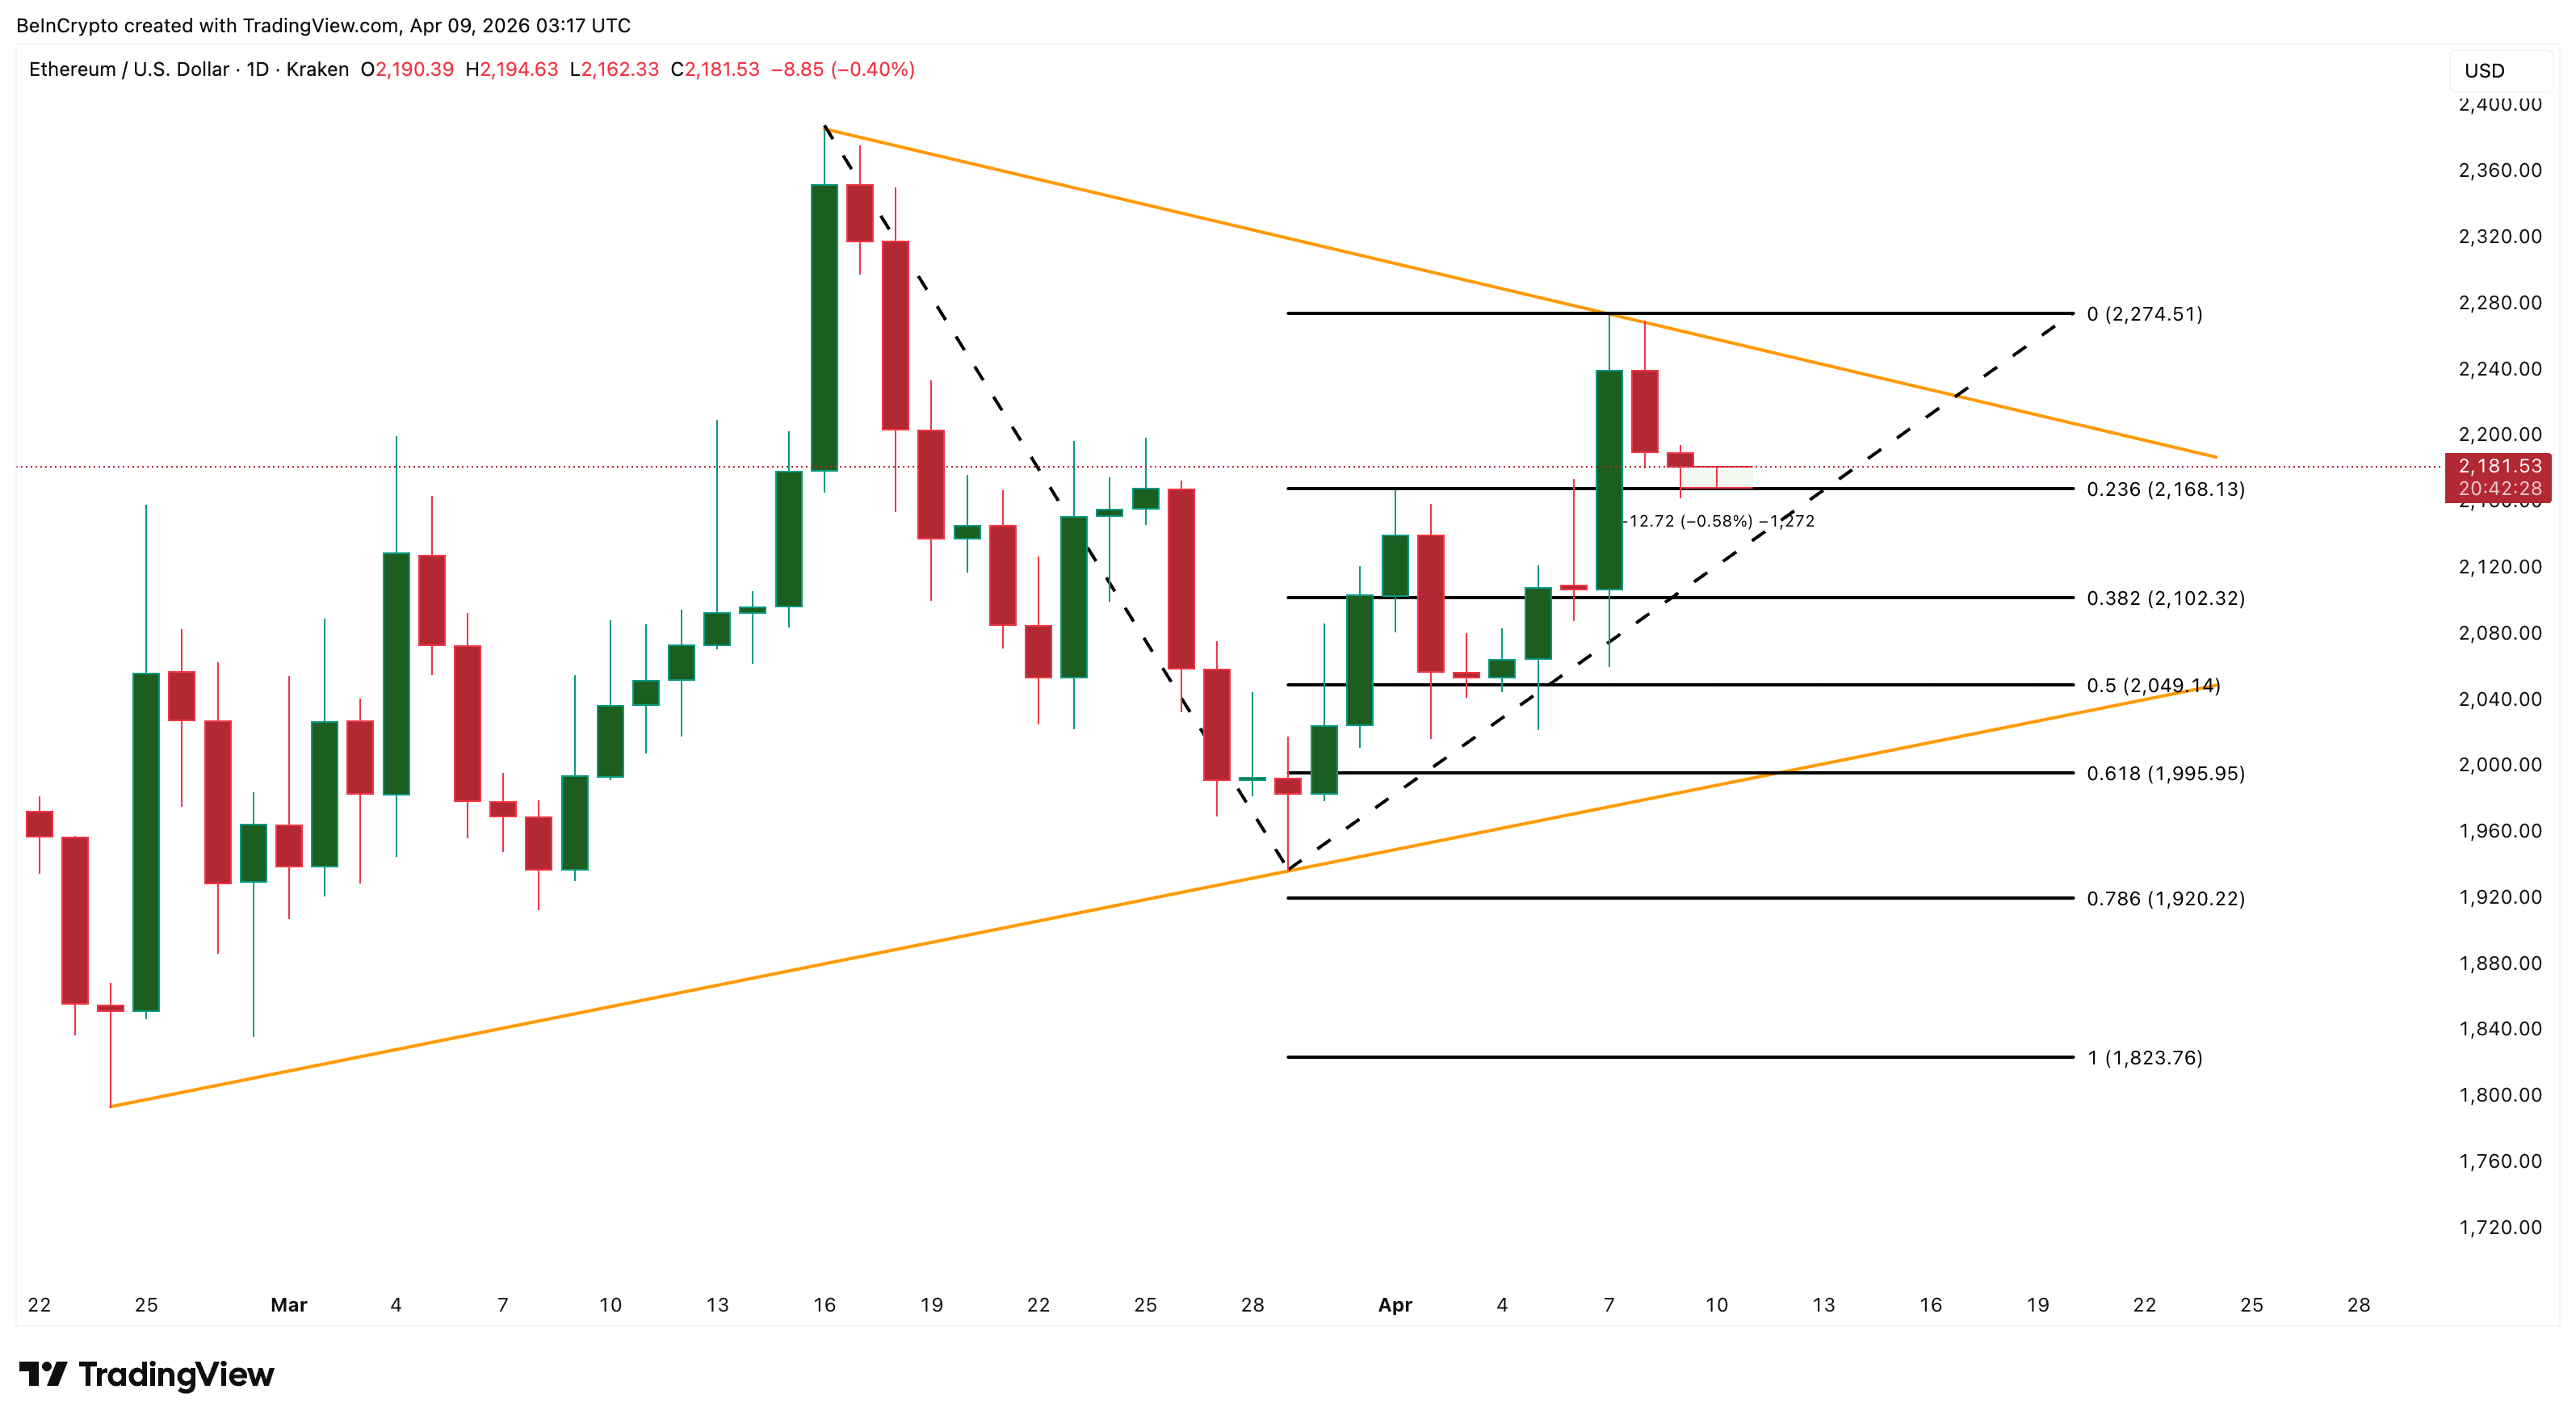
For strength to return, ETH needs to stay above $2,168 and attempt a move back toward $2,274. That would push price back toward the upper trendline and could help confirm the crossover. However, with three selling cohorts active and no fresh demand catalyst visible, the upside path remains the harder one.
Currently, $2,168 separates a defended floor with a path back toward $2,274 from a three-front-driven slide toward $2,102 and lower.
The post Ethereum Price Clings to $2,168 as Foundation Leads a 3-Front Selloff appeared first on BeInCrypto.
Crypto World
RWA Marketing Shifts From Hype to Structure as Institutional Capital Grows More Discerning

TLDR:
- Yield promises no longer close RWA deals — investors now demand verified legal structures and default procedures first.
- Credibility built through clean repayment records outperforms any paid marketing campaign in the RWA sector today.
- Regulatory arbitrage across jurisdictions like Malaysia and Switzerland is becoming a core feature, not a legal workaround.
- Instant redemption and pre-funded liquidity layers are now the clearest signal that an RWA project is built to last.
RWA marketing is undergoing a fundamental shift across the crypto industry. Projects that once relied on yield promises are now held to a much higher standard.
Institutional and retail investors are demanding legal clarity, collateral transparency, and defined default procedures before committing capital.
The market drawdown of October 2025 accelerated this change considerably. As tokenized real-world assets attract more scrutiny, the strategies that worked a year ago are no longer enough to close deals.
Credibility and Structure Replace Yield as the Core Pitch
The days of leading with high APY figures are largely over in RWA marketing. Investors are now asking harder questions about legal structures, collateral custody, and enforcement rights.
Projects that answer those questions clearly are gaining the most traction. This shift reflects a broader maturation across the tokenized asset space.
@liqvid_xyz captured this directly: “You can’t sell trust with a story. You need structure, transparency, and execution.” That standard now applies to every project seeking serious capital.
Institutional allocators, in particular, are running thorough due diligence before committing. According to @RealFinOfficial, onboarding a bank or major asset originator can take six to eighteen months.
Credibility, meanwhile, has become the most valuable asset any project can hold. It cannot be purchased through advertising spend or influencer campaigns.
Instead, it is built month by month through clean repayment records and verifiable history. @eightlends has reported zero defaults since launch — a fact that speaks louder than any marketing pitch.
Regulatory arbitrage is also playing a quiet but powerful role. Projects are selecting jurisdictions like Malaysia, the Philippines, and Switzerland to structure their offerings legally.
@metafyed noted they operate under Malaysian and Philippine frameworks. However, explaining that regulatory strategy to buyers remains an ongoing challenge, with most drop-off occurring at that educational moment.
Liquidity and Education Remain the Two Biggest Growth Levers
Beyond structure, liquidity is fast becoming the defining feature of competitive RWA projects. Most tokenized assets still carry TradFi-style redemption timelines, sometimes taking hours or days to settle.
That friction limits the appeal to both retail and institutional participants. Smart projects are now building pre-funded liquidity layers and instant redemption mechanisms to close that gap.
@AmpleProtocol made clear that narrative alone is not enough today. “Everyone is looking for a combination of tokenomics plus Product Market Fit with most projects right now,” they stated.
Without a functional product behind the story, even a well-structured narrative loses credibility fast. Liquidity, in that context, is proof of execution.
Education remains one of the most consistent barriers to growth in this sector. Many crypto users are unfamiliar with SPV structures, collateral agents, and enforcement rights. @eightlends noted that growing in RWA is really about education more than anything else.
Walking users through the full process — from borrower verification to onchain monthly payments — is what converts interest into investment.
The three main audiences — institutional allocators, high-net-worth investors, and wealth managers — each require a tailored approach. Wealth managers particularly need cross-border yield products that clear compliance hurdles for their clients.
Serving these intermediaries well creates leverage across the entire distribution chain. That approach, paired with transparent structure, separates the projects that scale from those that stall.

For several weeks, the oil market remained directly influenced by the US-Iran tensions. Threats to close the Strait of Hormuz kept Brent prices within the $97–110 range. Overnight on 8 April, the parties announced a two-week ceasefire, and the Strait of Hormuz reopened to shipping, immediately removing the accumulated geopolitical premium from prices. Brent declined by over 10%, falling towards the $92 per barrel level.
However, later the same day, the ceasefire came under pressure. Gulf states reported Iranian drone and missile strikes, with the UAE, Kuwait, and Bahrain confirming attacks on oil facilities and infrastructure. Iran subsequently suspended vessel transit through the Strait of Hormuz, citing a breach of the agreement by Israel, which had conducted strikes in Lebanon. Israel clarified that the ceasefire does not apply to Lebanon.
Negotiations are scheduled for 10 April in Islamabad, although the outcome remains uncertain. The market continues to show high sensitivity to any changes in diplomatic or military rhetoric. In parallel, OPEC+ approved an increase in oil production quotas on Sunday, adding further supply-side pressure.
Technical Picture
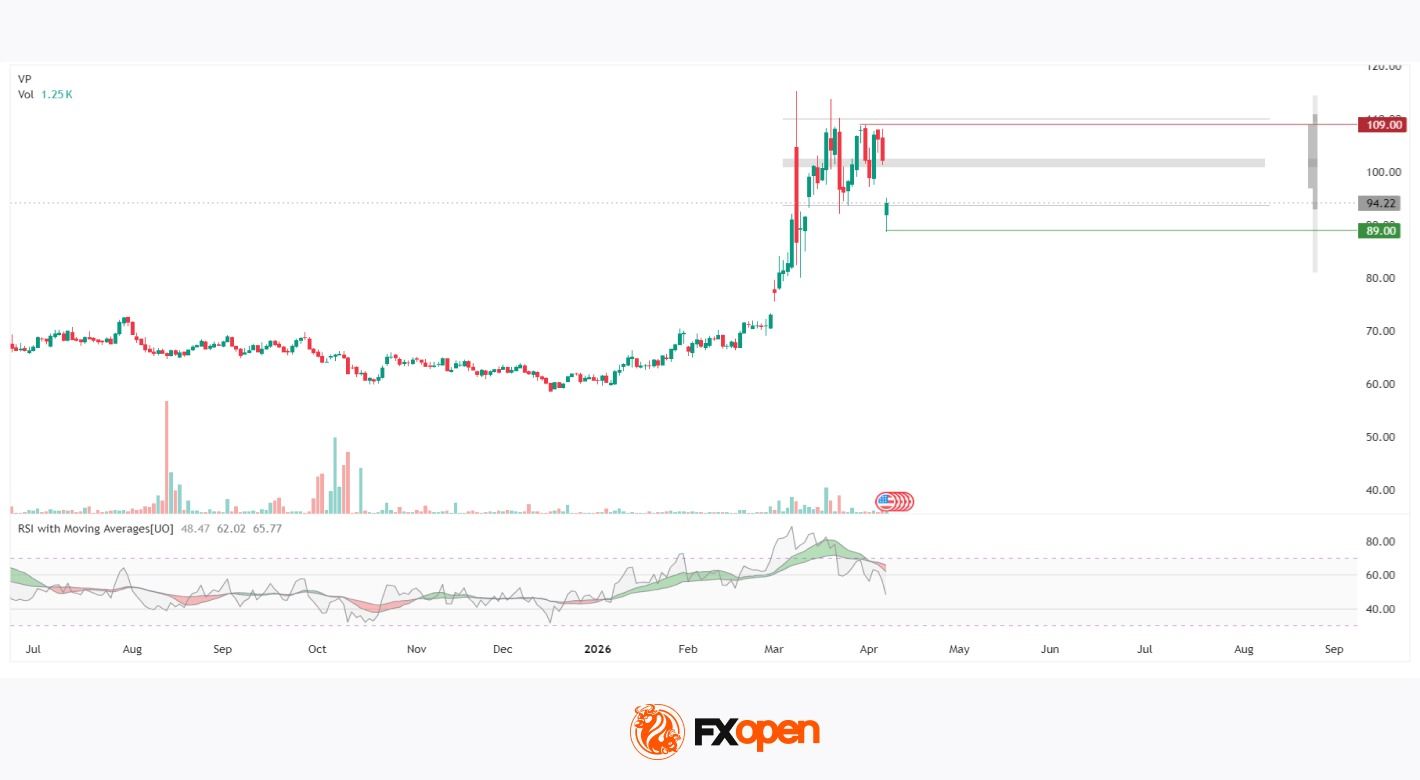
On the daily chart, the prolonged consolidation within the $60–75 range concluded with an impulsive rally towards $115, driven by geopolitical escalation in February–March 2026. Notably, on 18 March, vertical volume recorded a peak spike, confirming the climactic nature of the move.
The market failed to sustain these elevated levels, and the subsequent correction pushed prices down to $89, where the price approached the lower boundary of a horizontal volume cluster. Above current levels, the market profile remains dense, with the highest concentration of trading activity (POC) located in the $101–103 range. This area could serve as the nearest upside reference, with a breakout requiring significant buyer participation. The next resistance level could be $109.
For sellers, the key support level could be $89. A break below this level aligns with the base of the previous session and may influence short-term bearish positioning.
The RSI with Moving Averages (nominal) indicator presents a similarly notable picture. The RSI has remained below both moving averages for the past 10 days, with both MAs trending downward. This signals a weakening bullish impulse and a shift towards a neutral-to-bearish oscillator configuration.
Key Takeaways
Brent prices corrected sharply following the removal of the geopolitical premium and increased supply pressure from OPEC+. From a technical perspective, the price remains below the POC zone, while the RSI+MA configuration reflects a bearish context. The key range levels—89 and 109—could be reference points for the upcoming session.
Start trading commodity CFDs with tight spreads (additional fees may apply). Open your trading account now or learn more about trading commodity CFDs with FXOpen.
This article represents the opinion of the Companies operating under the FXOpen brand only. It is not to be construed as an offer, solicitation, or recommendation with respect to products and services provided by the Companies operating under the FXOpen brand, nor is it to be considered financial advice.
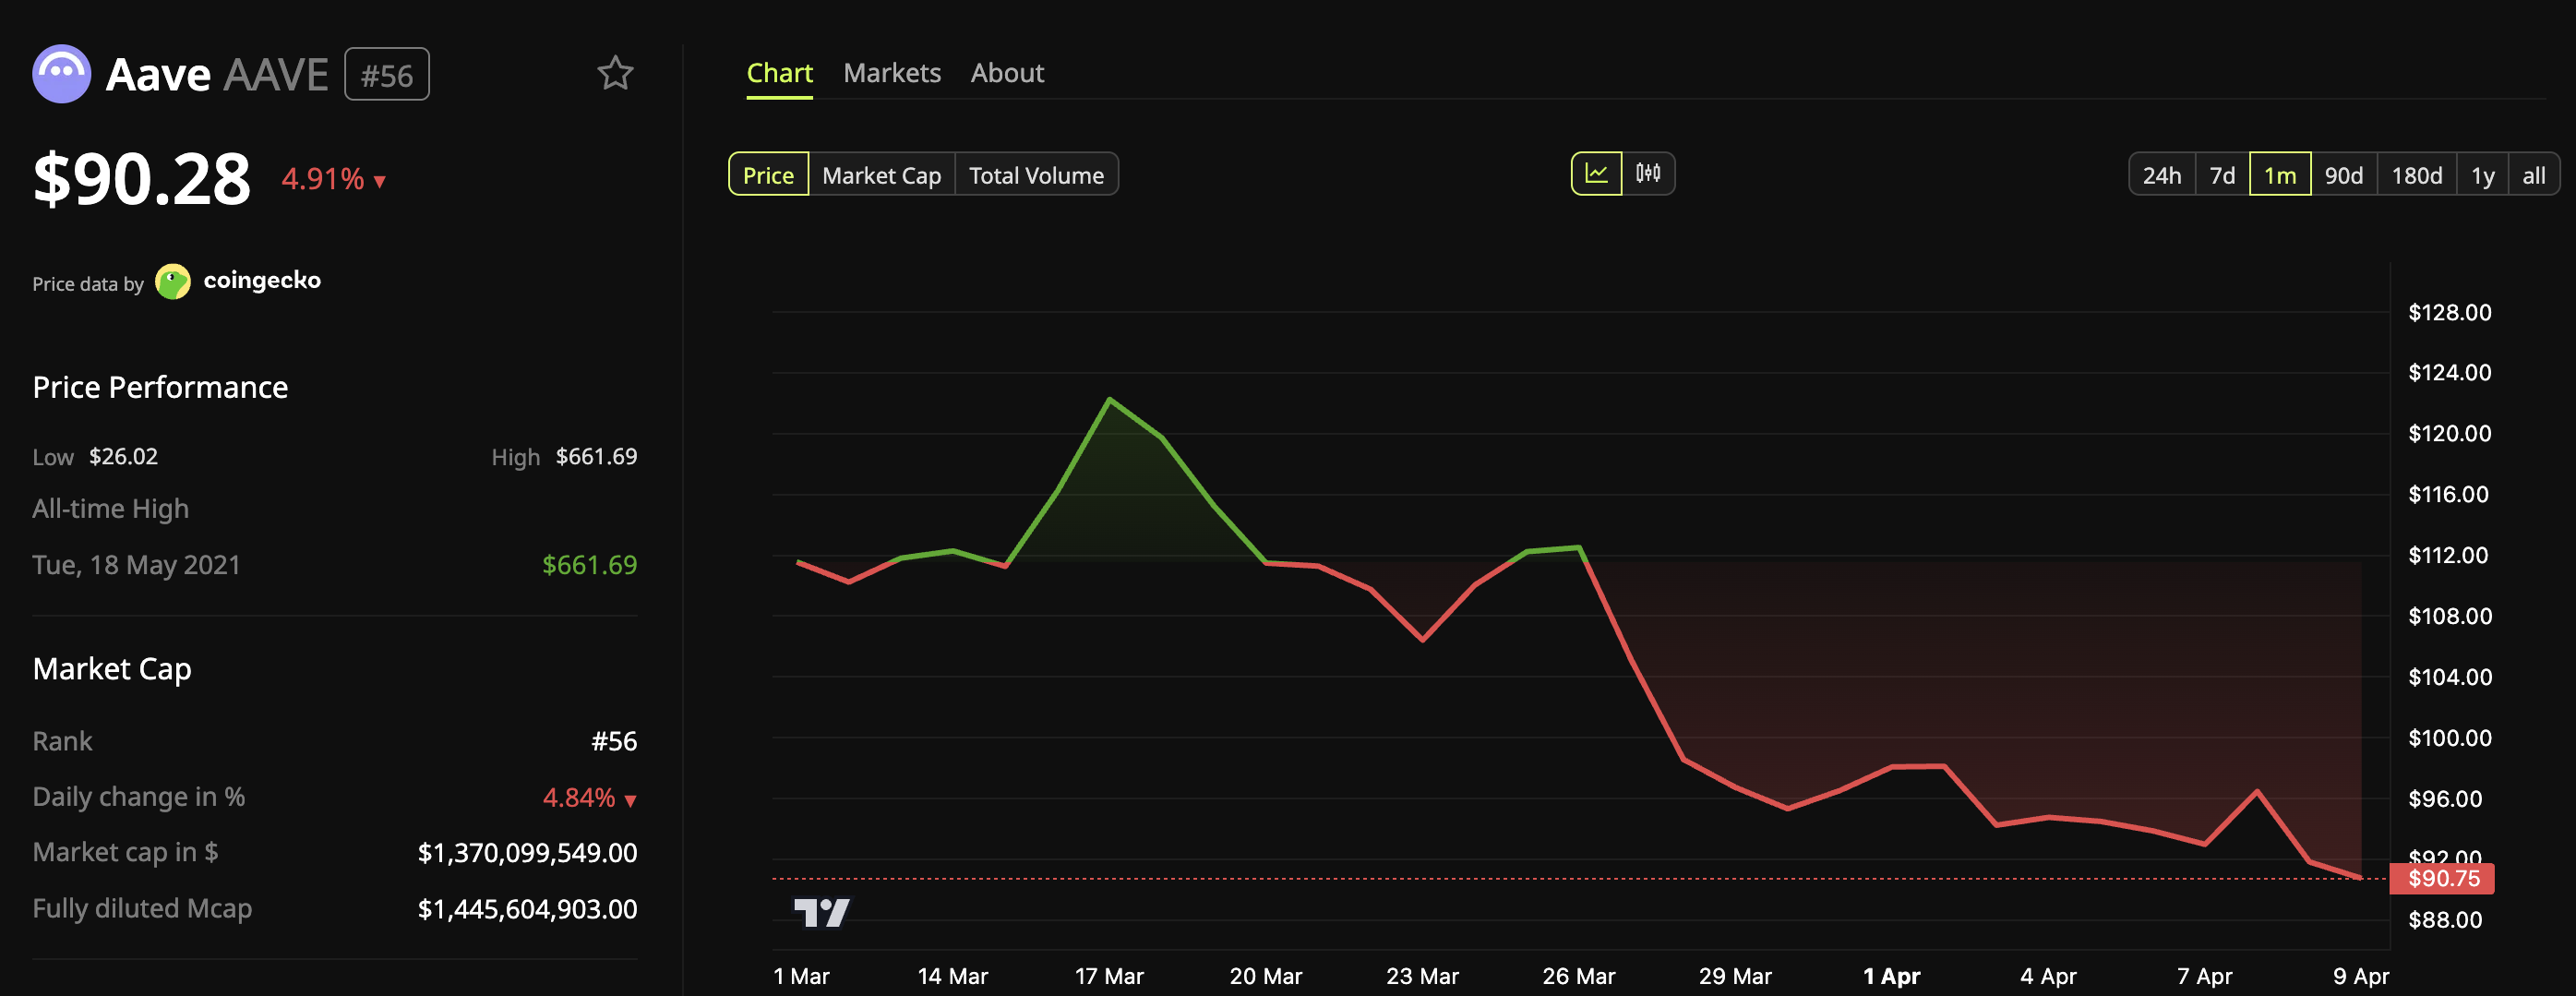
Grayscale Research has labeled Aave (AAVE) a potential “household name,” describing the Decentralized Finance (DeFi) lending protocol as “a bank without bankers” in a new blog.
“Aave is not yet a household name, but we think it will be eventually. Aave is essentially a bank without bankers—a decentralized lending marketplace on Ethereum and other blockchains that takes deposits and makes loans without any human operators,” Grayscale’s Head of Research Zach Pandl wrote.
Pandl pointed to the Bank of Canada’s report. Researchers found that Aave operates with a notably lower net interest margin (NIM) than leading US and Canadian banks, largely due to its lower intermediation costs.
“The Bank of Canada concluded that ‘lending without traditional intermediaries is viable in a technical and operational sense,’ and that Aave ‘operates continuously, transparently, and with minimal overhead, demonstrating the potential of protocol-based credit markets.’ The combination of lower operational costs, attractive rates, and ‘always on’ banking could be a powerful combination for adoption and long-term growth,” the blog added.
Pandl noted that Aave is still “young” and has yet to address complex challenges like credit scoring and undercollateralized lending. However, no lending system is flawless, as recent stress in private credit markets highlights.
“We believe that Aave, a leading onchain lending platform, and its native AAVE token, are poised for long-term growth,” he concluded.
Follow us on X to get the latest news as it happens
Analyst Nick highlighted the protocol’s strengths in a recent post. It generated approximately $142 million in net revenue in 2025, with cumulative lending volume surpassing $1 trillion. Fees reached over $885 million, putting it on track for a strong run rate into 2026.
Token Terminal data showed its TVL has declined since late 2025 to $42.6 billion in April. Despite this, Aave remains the top lending protocol, controlling around 50% of the market share.
“Aave is becoming the onchain credit layer that survives cycles and pulls in real-world capital imo,” he said.
However, on-chain data paints a more cautious picture. AAVE exchange reserves surged to 2.23 million tokens, reversing a year-long declining trend and signaling potential sell pressure.
Whales have also been offloading the token this year, while recent contributor departures have impacted investor confidence. AAVE trades near $90, down roughly 5% over the past day amid a broader market downturn.
Whether Grayscale’s long-term thesis plays out may depend less on protocol metrics and more on whether market sentiment can catch up to the fundamentals.
Subscribe to our YouTube channel to watch leaders and journalists provide expert insights
The post Grayscale Predicts This DeFi Token Will Become a ‘Household Name’ in Crypto appeared first on BeInCrypto.
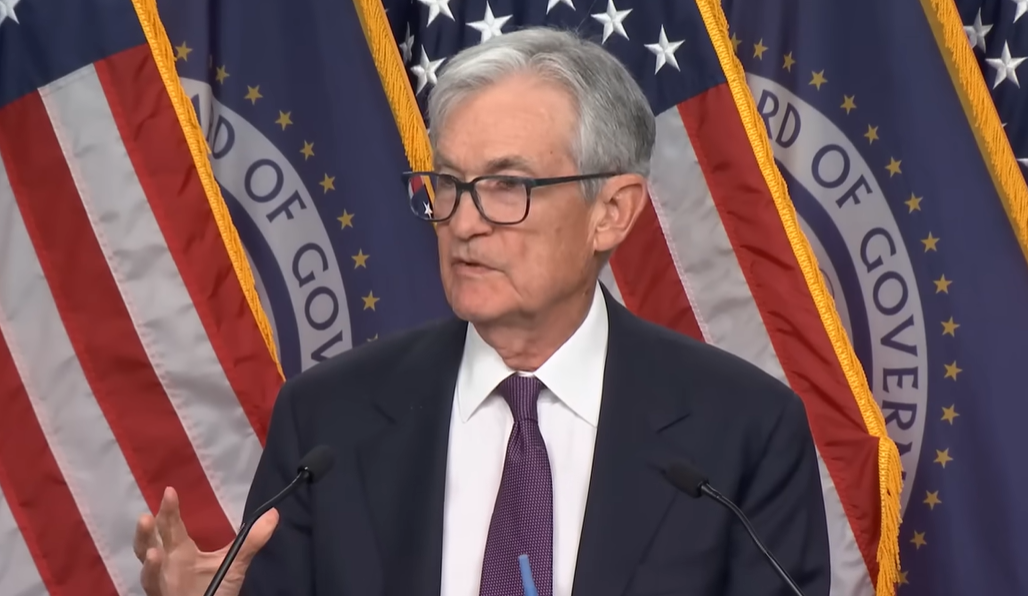
US Federal Reserve members were split on whether the war in the Middle East could spur further interest rate cuts before the end of 2026, according to minutes from the Federal Open Market Committee’s (FOMC) March meeting.
On Wednesday, the Fed released minutes from its last FOMC meeting on March 17 and 18. The meeting ended with an 11-1 vote to keep rates steady at 3.5% to 3.75%, with many officials cautious about the potential impacts of war and what it could mean for the economy.
Amid a risk of further conflicts, the official consensus pointed to a potential rate cut this year, but as Fed officials noted in the minutes, only if inflation does not get out of control.
“Many participants judged that, in time, it would likely become appropriate to lower the target range for the federal funds rate if inflation were to decline in line with their expectations,” according to the Fed minutes.
Rate cuts are generally seen as a positive catalyst for crypto as they free up investment liquidity and can spur demand for speculative investments. The last interest rate cut was Dec. 10, 2025, with the Fed slashing rates by 25 basis points.

While a cut may still be on the table for this year, the general feeling from the FOMC meeting was that it was “too early to know how developments in the Middle East would affect the U.S. economy.”
The FOMC’s next meeting is scheduled for April 28-29.
Cuts still possible, but so are hikes
While some officials were cautiously optimistic about a rate cut, others warned that the opposite might be necessary.
“Some participants judged that there was a strong case for a two-sided description of the Committee’s future interest rate decisions … reflecting the possibility that upward adjustments to the target range for the federal funds rate could be appropriate if inflation were to remain at above-target levels.”
Related: Iran weighing crypto tolls for ships using Strait of Hormuz: Report
Inflation was not the only concern, as many officials pointed to potential downside risks in the labor market, arguing that “in the current situation of low rates of net job creation, labor market conditions appeared vulnerable to adverse shocks.”
According to the CME Group’s FedWatch tool, there is currently a 75.6% chance that the Fed will keep rates at 3.5% to 3.75% during the Fed’s Dec. 8 meeting later this year.
Meanwhile, the chance of a rate cut is 20.4%, while the chance of a rate hike is 2.4% at the time of writing.
Magazine: AI agents will kill the web as we know it: Animoca’s Yat Siu
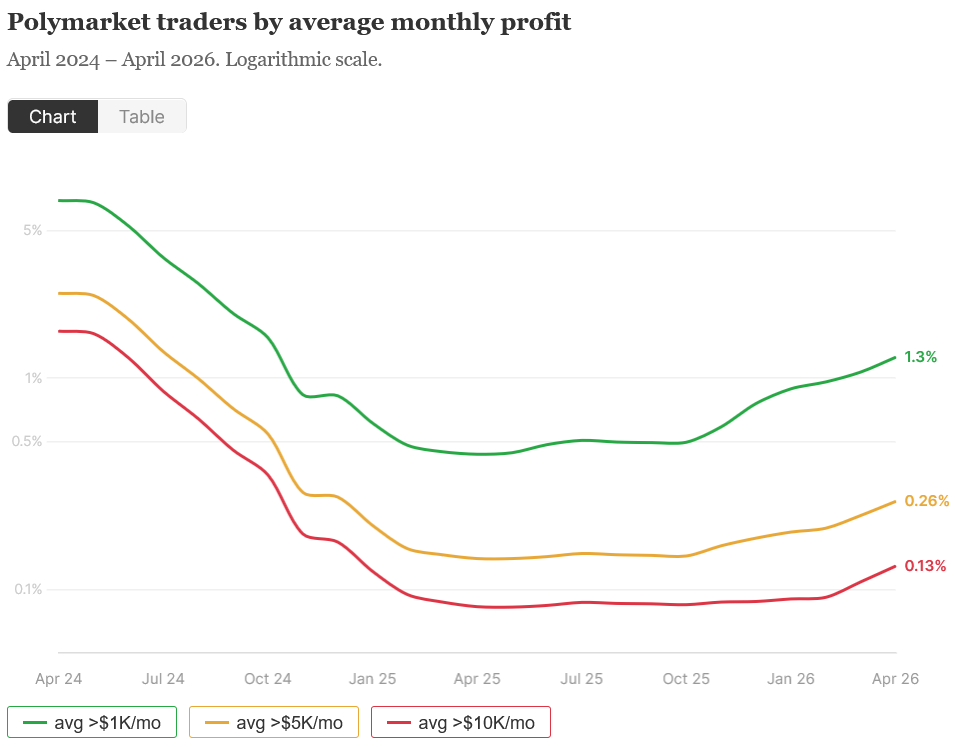
Just 0.015% of Polymarket traders can reliably make $5,000 or more a month, according to new data, meaning the idea of quitting a full-time job to trade prediction markets is unrealistic for most.
Data from crypto analyst Andrey Sergeenkov on Monday found that while nearly 1% of Polymarket traders earned more than $5,000 in a single month, only 0.1% managed to repeat that the following month and just 0.015% were able to sustain it for four consecutive months.

The average US monthly salary is around $5,220, according to Consumer Shield.

Prediction markets have become one of the fastest-growing use cases in crypto, enabling users to speculate on outcomes across politics, sports, finance and cultural events.
Most prediction markets use binary “yes” and “no” shares priced between $0 and $1 that reflect perceived probabilities. Traders can profit by buying undervalued shares and selling higher or holding winning outcomes that settle at $1 when the event has concluded.
Sergeenkov’s findings were framed alongside a report about Logan Sudeith, a former financial risk analyst who quit his job and turned to prediction markets, where he profited $100,000 in December.
Sergeenkov also highlighted an X post from former Messari analyst “Tulip King,” who claimed in November that “Polymarket is the easiest place in crypto to make six figures right now.”
Related: Three Polymarket traders made timely bets on US-Iran ceasefire
However, Sergeenkov’s data found that only 840 wallets (roughly 0.033% of Polymarket traders) have profited over $100,000.
Not all of these wallets would be retail traders, either, as professional traders working at hedge funds and other firms are also trading in prediction markets.
“Less experienced users tend to trade less successfully,” Sergeenkov noted.
Most successful traders make profits and bounce
The more successful traders don’t stick around long either, Sergeenkov said, pointing out that only 172 of 6,600 wallet addresses with average monthly profits above $5,000 remained active more than a year.
“That’s 2.6%,” Sergeenkov said. “Most traders show up, trade for a short period, and leave.”
Sergeenkov’s analysis didn’t come without limitations. The researcher noted that he only factored in realized profits and losses, though he claimed that 96% of trading volume comes from already resolved markets.
Data was taken from April 2024 through to April 1, 2026.
Magazine: Asia Express: Phantom Bitcoin checks, China tracks tax on blockchain

A single geopolitical policy announcement may have just rewritten Bitcoin price prediction. Iran is reportedly requiring ships transiting the Strait of Hormuz to pay tolls in Bitcoin, instantly transforming the world’s most critical oil chokepoint into a live crypto settlement corridor.
According to the Financial Times report confirmed by Bitcoin Magazine, Iran’s Oil, Gas and Petrochemical Products Exporters’ Union spokesperson Hamid Hosseini confirmed the toll is set at $1 per barrel, with a fully loaded supertanker could face a charge approaching $2 million per transit.
Vessels have only seconds to complete payment once approved; the compressed window is explicitly designed so transactions cannot be traced or seized under existing sanctions. The policy applies during a two-week ceasefire window, with empty tankers exempted.
JUST IN: — Watcher.Guru (@WatcherGuru) April 8, 2026
 Iran to require ships passing through the Strait of Hormuz to pay tolls in Bitcoin, FT reports. pic.twitter.com/6yoIEys139
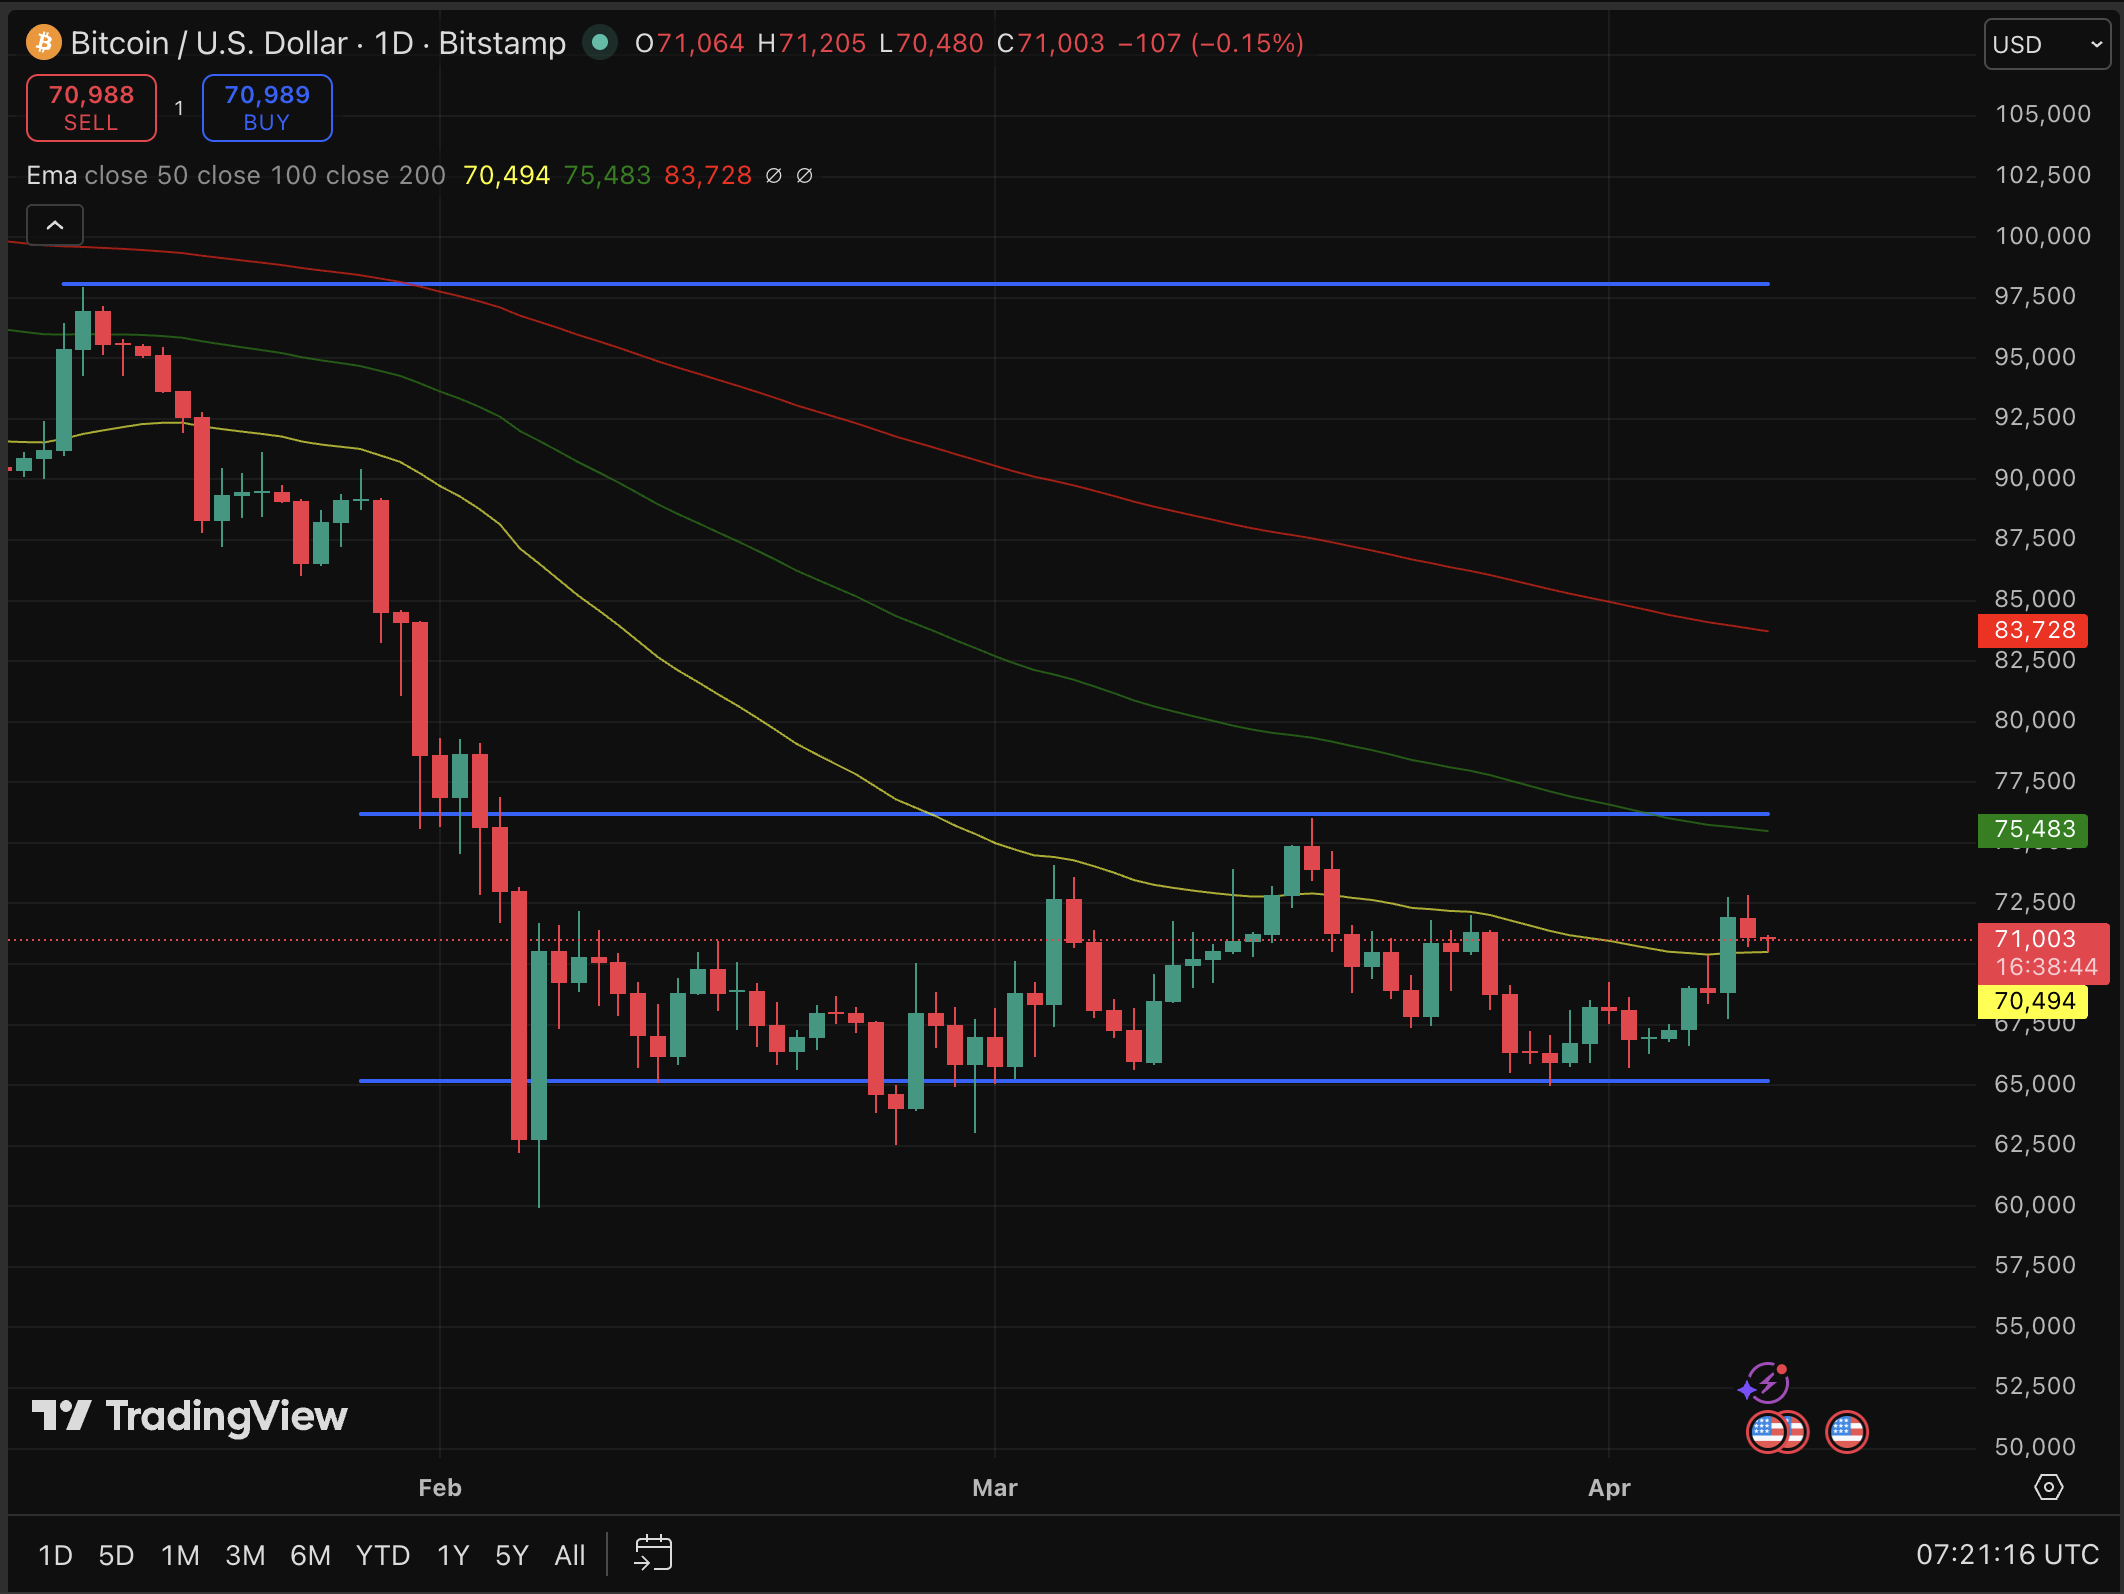
BTC had already surged past $72,000 on ceasefire news alone, recovering sharply from the $67,000 range where it held during Trump’s April 4 ultimatum weekend. The Hormuz toll announcement adds a second, structurally different catalyst, adding Bitcoin’s role in geopolitical infrastructure.
Discover: The best pre-launch token sales
Bitcoin Price Prediction: Hormuz Toll and Geopolitical Tension
Bitcoin’s technical setup entering this week was already constructive. Price reclaimed $69,000 Monday after volatile swings between $65,000 and $74,000 tied to Operation Epic Fury strike updates and oil price moves.
Support is well-defined as institutional bids have clustered at the $65,800–$66,000 zone, which held during the worst of the escalation fear in early April. Resistance sits at $71,000–$75,000, a range BTC is currently pressing against.
Oil crashed 16% from its $100+/barrel peak as ceasefire signals emerged, a deflationary impulse that historically benefits risk assets. Bitcoin’s resilience relative to equities during the Hormuz escalation period signals decoupling behavior in a bullish structural read.
If the ceasefire holds through the two-week window, Hormuz BTC tolls process live transactions, adoption narrative ignites, and the price can then target $100,000 after, with analysts flagging exactly this level on sustained risk-on sentiment.
The ceasefire expires in approximately 12 days. Every day it holds is a day BTC tolls process, and a day the “Bitcoin as sovereign payment rail” narrative compounds. Tick, tock.
Discover: The best crypto to diversify your portfolio with
Hyper Targets Bitcoin’s Bullish Outlook
Bitcoin at $71,000 is a strong position, but the math of a move to $100K from here represents roughly 40% upside for spot holders. For traders who missed the run from $65K, that asymmetry feels thinner than it looks. The rotation question becomes: where does the upside of early-stage Bitcoin infrastructure lie?
Bitcoin Hyper ($HYPER) is making a case for exactly that allocation. Positioned as the first-ever Bitcoin Layer 2 with Solana Virtual Machine (SVM) integration, the project targets Bitcoin’s core structural weaknesses. Bitcoin is known for slow finality, high fees, and the absence of programmable smart contracts.
The SVM integration is the technical differentiator: it delivers sub-second transaction processing, faster than Solana’s base chain itself, with low-cost execution and a Decentralized Canonical Bridge for native BTC transfers.
The presale has raised $32 million at a current price of $0.0136 per $HYPER, with staking available at a high APY during the presale window. If the Hormuz toll story accelerates institutional and retail focus on Bitcoin’s infrastructure layer, early-stage Layer 2 projects absorb that attention before spot BTC does.
Research Bitcoin Hyper here before the presale window closes.
The post Bitcoin Price Prediction: Iran Hormuz Toll Might Spark BTC USD Rally to $100K appeared first on Cryptonews.

Cardano price fell over 5% towards $0.25 on Thursday, paring off a part of its gains seen on the previous day.
Summary
- Cardano price fell 5.7% to around $0.25 as a broader crypto market sell-off triggered profit-taking after the U.S. Iran ceasefire news.
- Nearly $545K in long positions were liquidated over 24 hours, significantly outweighing short liquidations and adding downward pressure.
- Whale wallets holding over 10M ADA rose to a four-month high, signalling continued accumulation despite recent price weakness.
According to data from crypto.news, Cardano (ADA) price fell 5.7% from $0.263 on Wednesday to $0.248 on Thursday morning before settling at the $0.25 mark.
This decline occurred amid a broader sell-off across the cryptocurrency market as investors booked profits after they sold the U.S.-Iran ceasefire news. Bitcoin (BTC), the bellwether asset, was down 1.2% below the $71,000 figure. Ethereum (ETH) fell by 3.4% while other major crypto assets, such as BNB (BNB), XRP (XRP), and Solana (SOL), were all in the red with even more significant losses.
As Cardano price fell, it caught highly leveraged long traders off guard across the derivatives market. Data from CoinGlass show that nearly $545K worth of long positions were liquidated in the past 24 hours, which is nearly nine times the amount of short positions liquidated in the same timeframe.
Long liquidations occur when traders who bet bullish are caught by falling prices and are forced to sell their positions to cover their margins. When long liquidations significantly outweigh short liquidations, the asset’s price often faces intense downward pressure as the forced selling creates a cascading effect.
Despite this volatility, reports indicate that whales are still betting on the token to go up. Notably, data from Santiment shows that the number of whales holding over 10 million ADA tokens has hit a four-month high of 424 at press time. That represents a 5.2% jump over the past nine weeks, a clear sign that whales have been accumulating the token during these dips.
As such, if the whale accumulation trend continues to gain strength, they could attract the attention of retail investors. This, in turn, could potentially change the course of ADA’s current price trajectory.
On the daily chart, Cardano price has entered a horizontal channel pattern where the price was previously trading since early February.
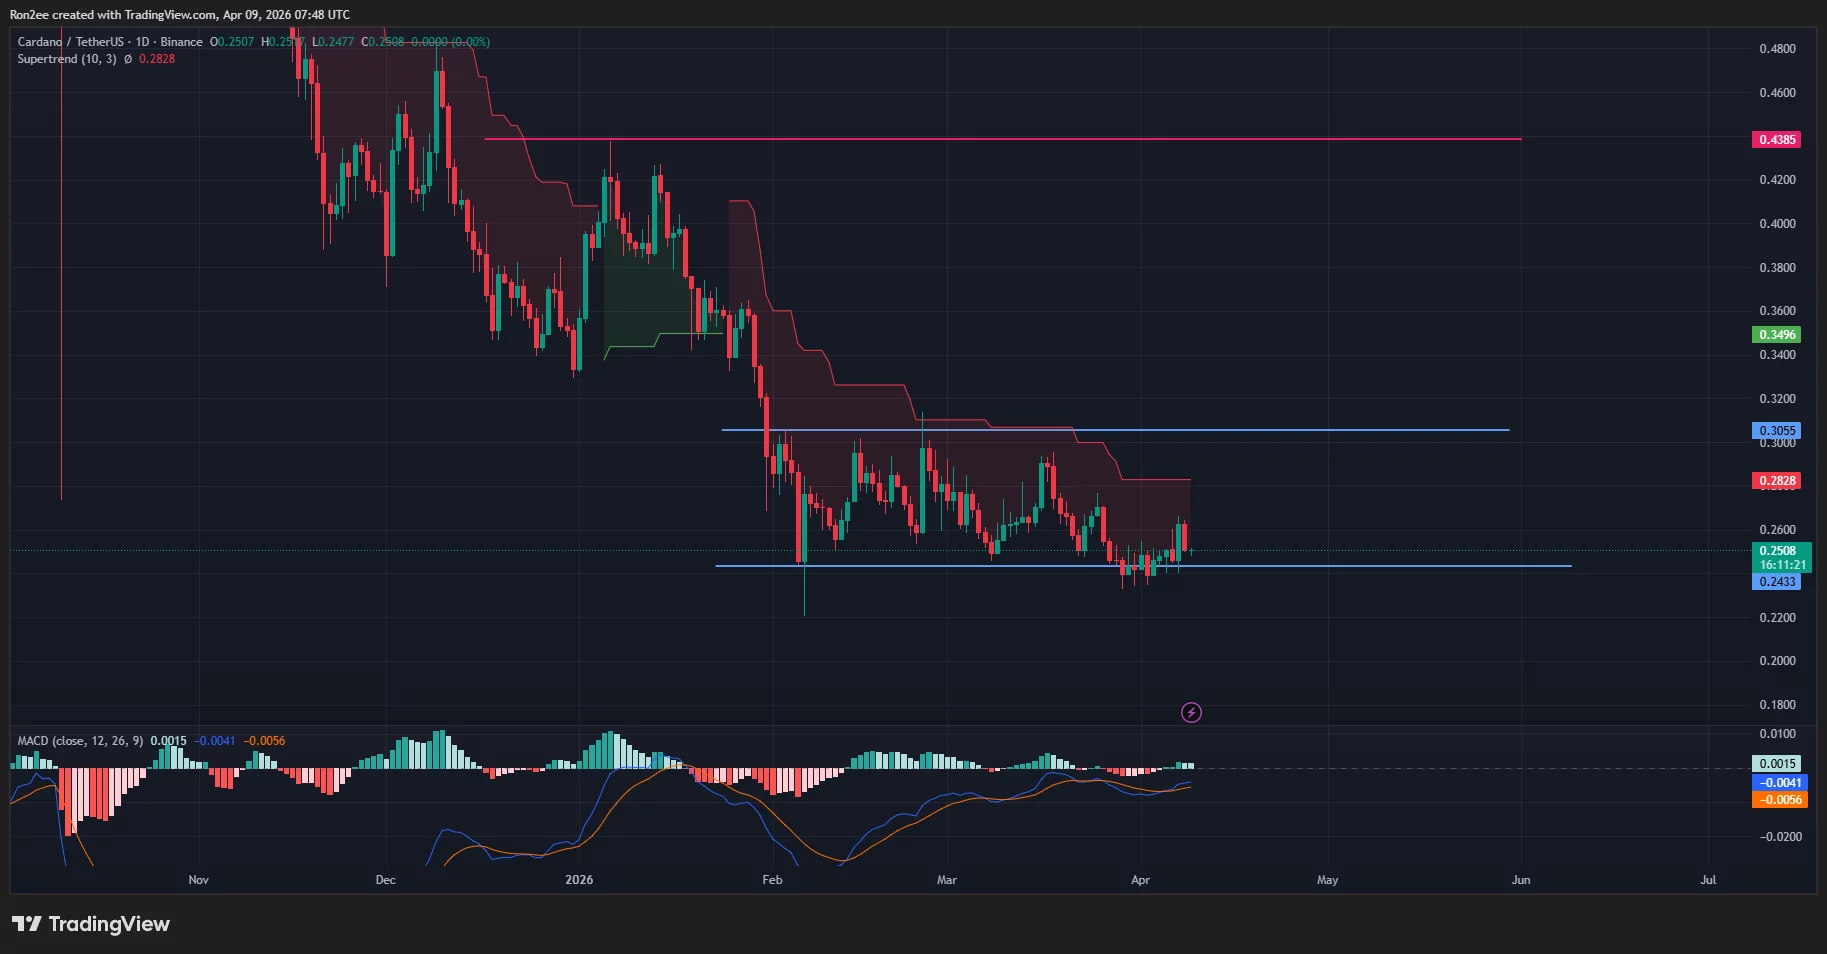
The altcoin broke below the pattern earlier on March 29 as risk-on sentiment withered from the crypto market amidst geopolitical concerns at that time. However, the recent Cardano rebound back into the channel suggests that bulls are attempting to reclaim control.
While the Supertrend indicator still points to some lingering bearishness as it remains red, the MACD line points to a slightly bullish momentum with a bullish crossover while still remaining under the zero line.
For now, the two trendlines of the channel mark the key resistance and support areas for the token. As such, a break below the lower trendline at $0.24 could signal a deeper correction, while if bulls manage to push the price above $0.30, it could spark a fresh rally toward previous highs.
Disclosure: This article does not represent investment advice. The content and materials featured on this page are for educational purposes only.

Clarkson’s Farm producer shares reason why Jeremy Clarkson’s Amazon series will end

NBA YoungBoy Affiliate Ben 10 Shot in Houston Restaurant, Reported Alert and in Stable Condition
Palantir (PLTR) Stock Tumbles 6% Following Burry’s Anthropic Competition Warning


-

 NewsBeat7 days ago
Steven Gerrard disagrees with Gary Neville over ‘shock’ Chelsea and Arsenal claim | Football
-

 Business6 days ago
No Jackpot Winner and $194 Million Prize Rolls Over
-

 Fashion6 days ago
Weekend Open Thread: Spanx – Corporette.com
-

 Business5 days ago
Expert Picks for Every Need
-

 Business3 days ago
Three Gulf funds agree to back Paramount’s $81 billion takeover of Warner, WSJ reports
-

 Sports4 days ago
India men’s 4x400m and mixed 4x100m relay teams register big progress | Other Sports News
-

 Tech1 day ago
How Long Can You Drive With Expired Registration? What Florida Law Says
-
Business4 days ago
No Jackpot Winner, Prize to Climb to $231 Million
-

 Fashion3 days ago
Massimo Dutti Offers Inspiration for Your Summer Mood Board
-

 Tech7 days ago
Commonwealth Fusion Systems leans on magnets for near-term revenue
-

 Fashion2 days ago
Let’s Discuss: DEI in 2026
-
Politics6 days ago
Wings Over Scotland | The quality of mercy
-

 Business4 days ago
Akebia Therapeutics, Inc. (AKBA) Discusses Pipeline Progress and Strategic Focus on Kidney Disease Treatments at R&D Day – Slideshow
-
Sports7 days ago
Justin Jefferson’s Situation Remains Unchanged after JSN’s Deal
-

 Fashion6 days ago
Statement Sunglasses: The Accessory Shaping Modern Fashion
-

 Crypto World19 hours ago
Bitcoin recovers as US and Iran Agree a Ceasefire Deal
-

 Politics6 days ago
East Jerusalem Palestinian families eviction orders
-

 Fashion7 days ago
Thursday’s Workwear Report: Merino Wool Blend Short-Sleeved Sweater
-

 Sports7 days ago
Which German players will make final cut?
-

 Fashion6 days ago
For Love & Lemons’ Spring 2026 Line is for the Romantics
You must be logged in to post a comment Login