
Crypto World
Bitcoin price risks drop to $65k, weekly trend turns bearish
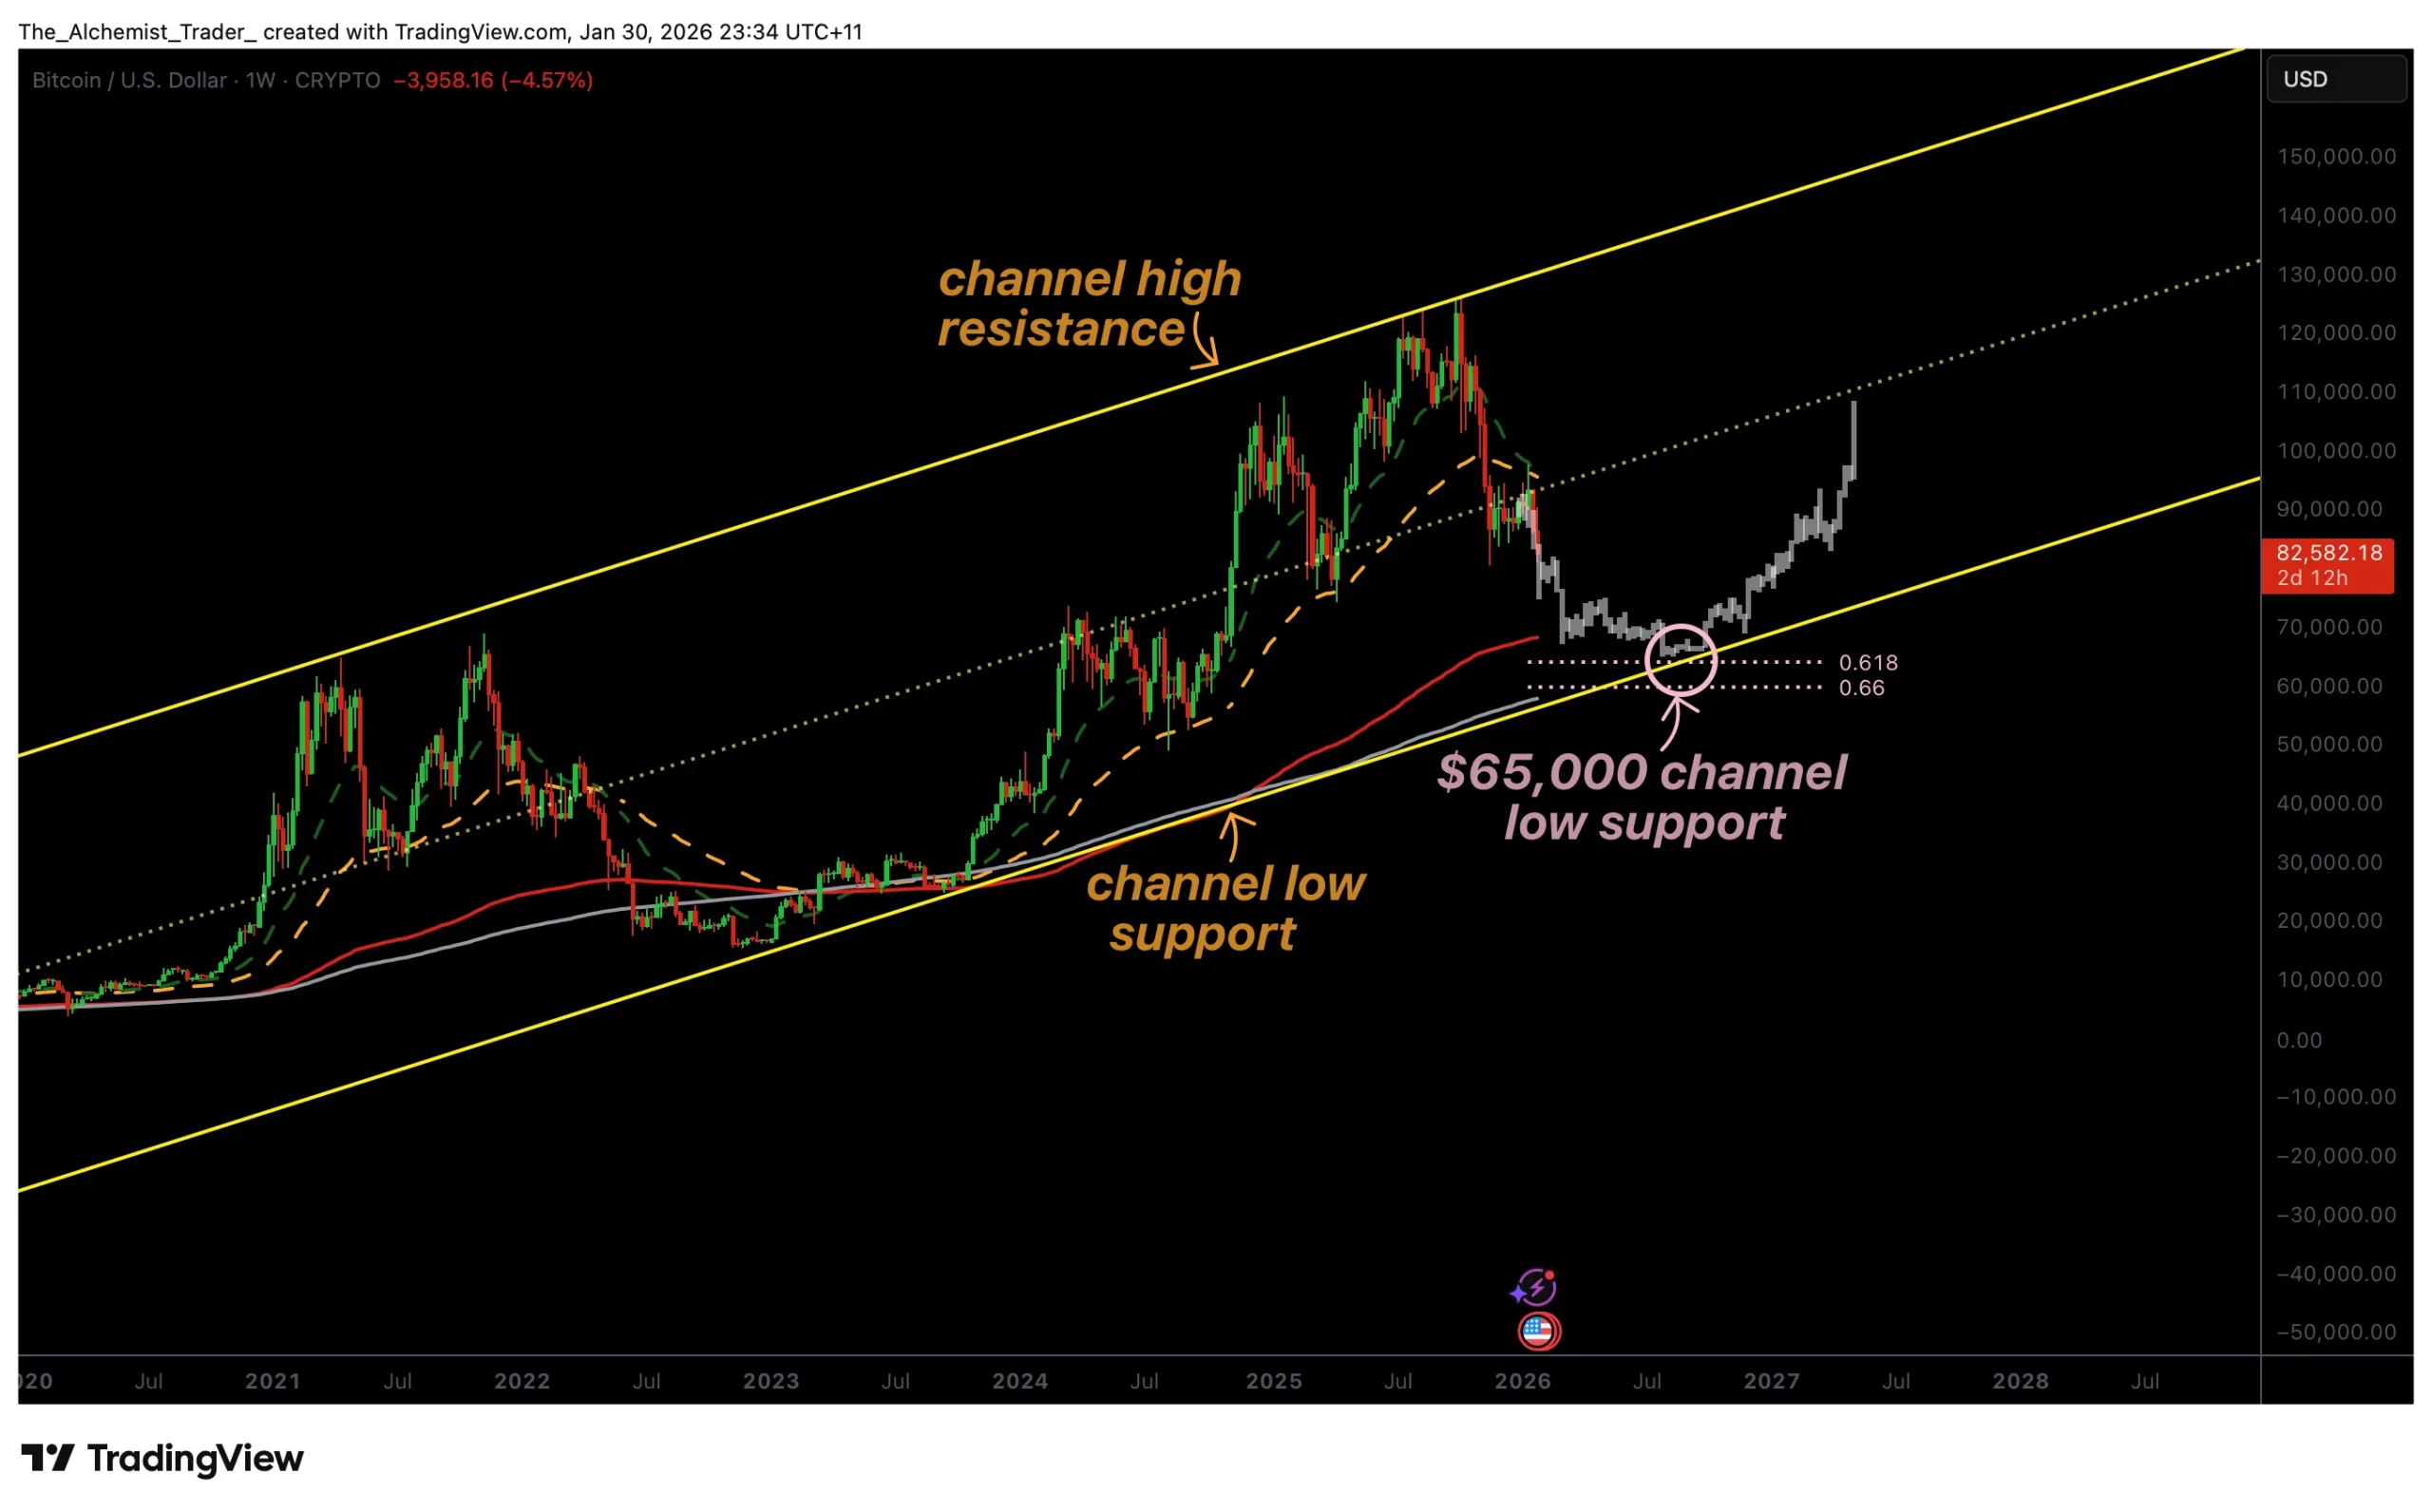
Bitcoin price is losing its weekly structure after a sharp rejection at channel resistance, raising the probability of a deeper corrective move toward $65,000 support.
Summary
- Bitcoin was rejected at channel high resistance, triggering downside momentum.
- The range midpoint has been lost on a weekly closing basis.
- $65,000 channel low and the 200-week moving average are key downside targets.
The current Bitcoin (BTC) price is hovering at $83,000. It’s a critical phase as the higher-time-frame structure continues to weaken. After failing decisively at the upper boundary of a long-standing trading channel, the price has transitioned into an impulsive corrective move that is now reshaping the weekly outlook.
The loss of key levels has shifted momentum firmly in favor of sellers, increasing the probability that Bitcoin will rotate lower toward major structural support. With the weekly trend turning bearish, a downside continuation toward the channel low is becoming the more likely scenario.
Bitcoin price key technical points
- Channel high rejection confirmed: Price was rejected precisely at long-term resistance.
- Range midpoint lost on a closing basis: Signals structural weakness.
- $65,000 channel low in focus: Confluence with the 200-week moving average.

Bitcoin’s recent decline began with a clean rejection at the range high, also referred to as channel high resistance. This level has historically acted as a ceiling for price, and the most recent test was no exception. Sellers stepped in aggressively, triggering a sharp bearish expansion away from resistance.
The rejection was not shallow or indecisive. Instead, it produced strong downside momentum, suggesting that the rally into resistance was corrective rather than the start of a new bullish leg. This reaction set the tone for the current move lower.
Loss of range midpoint confirms weakness
Following the rejection, Bitcoin rotated toward the range midpoint, a level that often acts as a battleground between buyers and sellers. Importantly, this level has now been lost on a weekly closing basis, a development that significantly weakens the bullish case.
Closing below the midpoint shifts control back to sellers and opens the path for price to explore deeper parts of the range. From a market structure perspective, this loss confirms that the corrective move has more room to develop rather than resolving quickly.
Weekly trend turns bearish
With price failing to reclaim key levels, the weekly trend has officially shifted bearish. Bitcoin is now printing consecutive lower highs and lower lows, a defining characteristic of a downtrend. As long as this structure remains intact, rallies are more likely to be corrective and sold into rather than sustained.
This structural shift increases the probability that the current move is not a short-lived pullback but part of a broader corrective phase within the larger channel.
$65,000 emerges as a downside magnet
The next major technical objective sits at the channel low near $65,000. This level represents long-term structural support and has repeatedly acted as a reaction zone throughout Bitcoin’s multi-year trading history. Given the current bearish momentum, the price is increasingly drawn toward this area.
Markets often gravitate toward such well-defined levels, particularly when intermediate support fails. In this context, $65,000 acts as a magnet for price, where liquidity, historical demand, and long-term positioning converge.
200-week moving average adds confluence
Adding to the significance of the $65,000 region is the presence of the 200-week moving average, one of the most closely watched indicators in Bitcoin’s long-term trend analysis. Historically, retests of the 200-week average have often coincided with major cycle bottoms or extended consolidation phases.
While this does not guarantee an immediate reversal, it does suggest that a base-building process is likely once price reaches this zone. Such bases often take time to develop, involving volatility and sideways movement rather than a sharp V-shaped recovery.
Correction does not equal trend failure
It is important to distinguish between a deep correction and a complete breakdown of Bitcoin’s long-term thesis. Even within broader bullish cycles, Bitcoin has repeatedly experienced large drawdowns that reset structure and sentiment before the next expansion phase.
From a higher-time-frame perspective, a move toward $65,000 would still fit within Bitcoin’s historical behavior, particularly given the extended period price has spent trading within this large structural channel.
What to Expect in the Coming Price Action
Bitcoin remains in a bearish corrective phase as long as price stays below the range midpoint and continues to print lower highs on the weekly timeframe. The probability favors continued downside rotation toward $65,000 channel low support, where the 200-week moving average may provide a stabilizing influence.
Until that region is reached and structure improves, rallies are likely to face selling pressure. The coming weeks will be defined by whether Bitcoin completes this corrective move and begins forming a long-term base, or whether bearish momentum accelerates further before support is established.


Foundry’s U.S.‑based, compliance‑first Zcash pool has already grown to roughly one‑third of network hashrate, giving institutional miners a regulated way into privacy coins while stoking fresh centralisation fears.
Summary
- Bitcoin mining giant Foundry has launched an institutional Zcash pool that already accounts for roughly one‑third of new ZEC issuance.
- The U.S.‑based, compliance‑focused pool is pitched at institutional and public miners as a “purpose‑built” alternative to offshore privacy‑coin infrastructure.
- Foundry argues Zcash’s zero‑knowledge privacy with selective disclosure makes it more compatible with regulation than rivals like Monero.
Foundry Digital, operator of the Foundry USA Bitcoin mining pool, has officially launched an institutional‑grade Zcash (ZEC) mining pool that has quickly grown to around 30% of the network’s hashrate, consolidating a significant share of new ZEC issuance under a single U.S.‑regulated operator. The Rochester, New York‑based firm, which Fortune notes already commands about 31% of global Bitcoin production, is positioning its new pool as the default home for institutional miners seeking exposure to privacy‑focused assets without abandoning compliance.finance.
In a Business Wire release, Foundry said the Zcash pool has seen “rapid and sustained hashrate growth reaching ~30% of the current Zcash network hashrate” since it was first announced on March 11, with “multiple institutional mining customers already onboarded and contributing hashrate.” The company stressed that the pool is “designed for professional mining organizations and public companies that require a U.S.-based, compliance-ready partner, including KYC verification in line with Foundry’s institutional standards,” mirroring the governance of its Bitcoin operation.
Foundry CEO Mike Colyer framed the move as both a bet on Zcash and a response to unmet institutional demand. “Zcash has matured into an institutional‑grade asset, but the mining infrastructure supporting it hasn’t kept pace,” he said, adding that the new pool is “purpose‑built for the operational and compliance requirements of institutional and public miners.”
A CoinMarketCap summary of the launch notes that the pool will offer know‑your‑customer and anti‑money‑laundering checks, transparent payout calculations, reporting tools and 24/7 technical support, with no minimum hashrate required to join.
Zcash, launched in 2016, relies on zero‑knowledge proofs (zk‑SNARKs) to enable shielded transactions that hide sender, receiver and amount while still allowing selective disclosure to auditors or regulators. Foundry and several commentators have argued that this “privacy with a view key” model is more compatible with institutional compliance than fully opaque systems like Monero, which lack native mechanisms for selective transparency.
At the same time, the arrival of a U.S. pool with roughly one‑third of Zcash’s hashrate raises familiar centralisation questions. Unfolded and other mining trackers have previously highlighted that Foundry USA already coordinates about 30% of Bitcoin’s global hashrate, and Mempool.space data shows the pool averaging more than 340 exahashes per second on Bitcoin alone. Adding a Zcash operation that quickly captures around one‑third of ZEC issuance further concentrates influence over block production in a single corporate group, albeit one that stresses its role in “contribut[ing] to the decentralization of Bitcoin’s hashrate” by anchoring North American capacity.
For Zcash, the trade‑off is stark: institutional capital and hashpower are flowing in through a U.S.‑regulated gateway that validates the project’s positioning as a compliant privacy coin, but at the cost of a more concentrated mining landscape. As regulators in the U.S., EU and Hong Kong tighten their grip on stablecoins, exchanges and tokenized assets — a trend explored in recent crypto.news coverage of HKDAP’s launch, MiCA implementation and the CLARITY Act — Zcash’s bet is that privacy with selective disclosure, plus a mining pool built for auditors rather than cypherpunks, is a price worth paying for long‑term relevance.
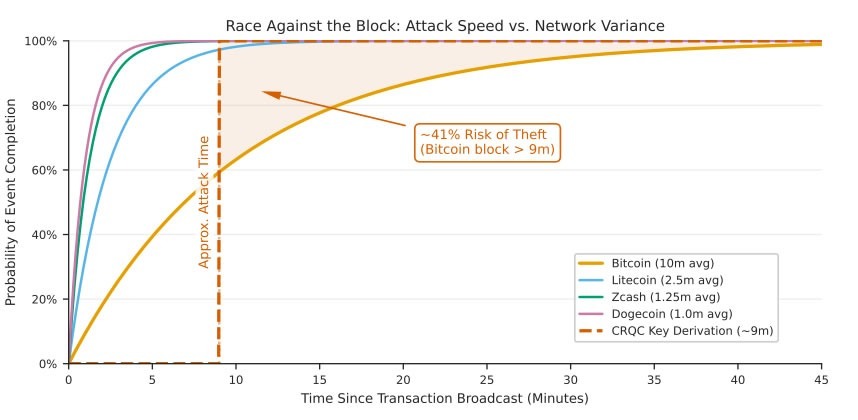
Bernstein said Monday that Bitcoin’s selloff has already priced in much of the market’s fear around quantum computing, arguing that the threat is real but still manageable rather than an immediate existential risk.
Bitcoin’s (BTC) near 50% drawdown from its $126,198 all-time high in October 2025 is proof that the market has “priced in” several risks tied to a quantum breakthrough, partly thanks to technological progress on zero-knowledge privacy and quantum-proof cryptography that “counterbalance” the AI and quantum acceleration, Bernstein said in a Monday note shared with Cointelegraph.
The note lands two weeks after Google researchers said future quantum computers could break the elliptic-curve cryptography used across many blockchains with fewer than 500,000 physical qubits in some architectures, reviving debate over how quickly Bitcoin needs a post-quantum upgrade path. This research suggested a quantum computer could crack a Bitcoin private key in nine minutes, in a theoretical scenario, which is less than Bitcoin’s 10-minute block production time.
However, Bernstein said Bitcoin core developers have “adequate time” to determine a post-quantum path. Last week, Bernstein predicted that Bitcoin has about three to five years to prepare for a post-quantum security upgrade, Cointelegraph reported on Wednesday.

Institutions will play constructive role in quantum-proofing Bitcoin
Bernstein said large institutional holders, including exchange-traded fund (ETF) issuers and corporate treasury buyers such as Strategy, are likely to play a constructive role in any eventual consensus on a post-quantum upgrade.
“We expect institutional partners with now billions at stake to play a constructive role in building consensus on the post-quantum path.”
The note also highlighted the recently introduced BIP-360 proposal and added that slower consensus from Bitcoin developers is seen as responsible behavior when it comes to a $1.5 trillion asset.
BIP-360 is a draft Bitcoin Improvement Proposal that proposes a Pay-to-Merkle-Root output type designed to reduce long-exposure quantum risk by removing Taproot’s key-path vulnerability, though it does not itself add post-quantum digital signatures.
Bernstein said BIP-360 could be implemented as a soft fork for exposed Bitcoin addresses, but added that this would still leave around 8% of the BTC supply in inactive addresses vulnerable to future quantum breakthroughs.
Related: Bitcoiners push for quantum-resistant BIP-360 upgrade as debate heats up
Quantum-proofing Bitcoin is a social issue, not technical
The real challenge of quantum-proofing Bitcoin lies in the societal adoption element of the new standards, not the technical development, according to Arthur Breitman, co-founder of Tezos blockchain.
“The coding work could be done this afternoon,” but Bitcoin holders would still need to migrate to this new standard, Breitman told Cointelegraph during an interview at EthCC 2026.
“If Bitcoin needed to migrate in the next month, they could do it from a technical perspective […] but they can’t get everyone to migrate their key in a month, Breitman said. “It’s going to take years for people to properly migrate their keys,” he added.

Asset manager Grayscale’s head of research, Zach Pandl, shared a similar view in a research report last Monday. He said Bitcoin’s quantum-proofing challenges are “more social than technical,” provided that its UTXO model does not have native smart contracts and that some address types are not quantum vulnerable.
However, he warned that the community needs to find consensus on how to quantum-proof wallets where the private key has been lost or is otherwise inaccessible.
Magazine: AI has dramatically accelerated the quantum threat to Bitcoin: AI Eye

Bitmine Immersion Technologies said BMNR’s ETH holdings reached 4.875 million tokens, while total crypto and cash holdings hit $11.8 billion. The update came in a company release dated April 13, 2026, and followed several recent ETH purchases.
Bitmine said the total included $719 million in cash, 198 Bitcoin, and two equity stakes. The company also said its ETH position now equals 4.04% of Ethereum’s 120.7 million token supply.
ETH Holdings Move Closer to Stated 5% Goal
Bitmine valued its ETH holdings at about $10.8 billion using an ETH price of $2,206. It also listed a $200 million stake in Beast Industries among its other stated holdings. Another stated holding was an $85 million stake in Eightco Holdings, based on the release. The company grouped those positions with its crypto and cash balances in the $11.8 billion total.
Bitmine said the ETH total leaves it 81% of the way to its stated 5% goal. It used a total Ethereum supply figure of 120.7 million tokens in that calculation. The company said it remains the largest Ethereum treasury in the public market by disclosed holdings. That status reflects the size of its disclosed ETH balance after recent purchases.
Staked ETH Base Grows Through MAVAN
Bitmine also announced the launch of MAVAN, its Made in America Validator Network, in the same release. The platform was built to support Bitmine’s Ethereum treasury and staking activity. It also plans to serve institutional investors, custodians, and other ecosystem partners over time. The company said MAVAN focuses on security, performance, and resilience for large staking operations.
As of April 13, Bitmine said 3,334,637 ETH was staked across its operations. At $2,206 per ETH, that stake was worth about $7.4 billion, according to the company. The staked amount equals about 68% of its total ETH holdings.
A portion of Bitmine’s ETH is already staked through MAVAN, while more may move there later.
Lee said ‘Annualized staking revenues are now $212 million.’ He added that full staking could lift annual rewards to $310 million at current yields. Bitmine said the CESR rate was 2.73%, while its 7-day yield was 2.89%. The company said Quatrefoil administers the CESR benchmark used in that comparison.
NYSE Move Adds Visibility to BMNR
Bitmine began trading on the New York Stock Exchange on April 9, after leaving the NYSE American. The move kept the BMNR ticker and placed the shares on the senior exchange. The April 13 update came four days after that market change became effective. Bitmine linked the listing change with its fast growth in ETH holdings and trading activity.
Bitmine also said BMNR ranks among the most traded U.S. stocks by dollar volume. Fundstrat data showed a five-day average of $747 million through April 10, 2026. The company said that ranked BMNR at number 117 among 5,704 listed stocks. Bitmine compared that trading activity with other public companies focused on crypto treasury strategies.
Bitmine named investors including Cathie Wood, Founders Fund, Pantera, Kraken, DCG, and Galaxy Digital. It said those investors support its plan to keep adding ETH toward its stated goal. The company also compared its treasury size with Strategy’s larger Bitcoin treasury in the same release. Bitmine said its own balance remains the largest disclosed ETH treasury among public companies.


Former CFTC chair J. Christopher “CryptoDad” Giancarlo has quit his senior role at Willkie to focus full‑time on crypto, AI and policy work, including a new book on digital money under Trump’s second term.
Summary
- Former CFTC chair J. Christopher Giancarlo has retired from his senior role at law firm Willkie Farr & Gallagher to focus full‑time on digital assets, AI and policy work.
- Known as “Crypto Dad,” he plans to expand strategic advisory work, private investments and think‑tank research, while promoting a new book on crypto’s evolution through Trump’s second term.
- The move cements Giancarlo’s shift from big‑law partner to full‑time crypto advocate as Washington rewrites U.S. rules for stablecoins, DeFi and tokenized markets.
Former Commodity Futures Trading Commission chairman J. Christopher Giancarlo has stepped down as senior counsel and digital‑assets lead at New York law firm Willkie Farr & Gallagher to focus on cryptocurrency, artificial intelligence and public‑policy work, he confirmed on LinkedIn and in remarks reported by Crypto in America and Phemex.
Giancarlo, who joined Willkie in 2020 and helped build its “Digital Works” crypto practice, said he is pivoting toward “strategic advisory services to founders and boards in the fintech and digital asset sectors,” as well as nonprofit projects such as the Digital Dollar Project.creators.spotify+3
In an April post, Giancarlo told followers “after six rewarding years helping Willkie build one of the world’s leading digital asset legal practices, it is time for my next chapter,” adding that he will focus on “fintech, #digitalassets, #crypto and AI — and on making sure freedom and human agency are baked into the new architecture of banking, finance and money itself.” The former regulator, nicknamed “Crypto Dad” for his industry‑friendly stance at the CFTC, also teased an upcoming book titled “CryptoDad’s New Adventures: The Path to Financial Freedom in the 21st Century,” due for publication in October and billed as a narrative of the crypto industry from the 2024 election into President Donald Trump’s second term.
Giancarlo chaired the CFTC from 2017 to 2019, overseeing the launch of the first regulated bitcoin futures and arguing that U.S. regulators should adopt a “do no harm” approach to blockchain innovation, a phrase he repeated in speeches and later in his first book “CryptoDad: The Fight for the Future of Money.” At Willkie, he co‑chaired the firm’s Digital Works practice out of New York, advising banks, exchanges and fintech firms on crypto regulation and co‑authoring memos on topics ranging from stablecoin rules to the emerging U.S. crypto regulatory framework.
According to the ABA Banking Journal and other legal trade publications, Giancarlo has also become one of the most visible public advocates for a U.S. central bank digital currency through his work at the Digital Dollar Project, arguing that a well‑designed digital dollar could “promote U.S. values of privacy, free enterprise and the rule of law” in a world where China and others are racing ahead with state‑backed e‑money. Finews Asia previously reported that Trump allies had floated Giancarlo as a potential “crypto czar,” noting his push for clear stablecoin rules, safe harbors for token projects and a more unified federal approach to digital‑asset oversight.
His latest career move comes as Washington debates the CLARITY Act, GENIUS stablecoin legislation and bank‑backed tokenization pilots, with regulators from the Federal Reserve to the SEC and CFTC defining how dollar‑pegged tokens, DeFi and tokenized treasuries fit inside the existing system. By stepping away from big law to concentrate on investing, policy research and a new book aimed at retail readers, Giancarlo is betting there is room — and demand — for a former top derivatives regulator to help architect that future from the outside, as both adviser and storyteller.
Crypto World
Crypto exchange Kraken targeted in extortion attempt; says no breach and no funds at risk


Crypto exchange Kraken is facing an extortion attempt by a criminal group that threatens to release videos purportedly showing access to internal systems containing client data, the company said Monday.
The Wyoming-based firm said it identified and shut down two instances of inappropriate access tied to individuals within its support team, each involving limited client data.
“Our systems were never breached; funds were never at risk; we will not pay these criminals; we will not ever negotiate with bad actors,” said Nick Percoco, chief security and information officer of Payward and Kraken, in a post on X.
The first incident came in February 2025, when Kraken received a tip about a video circulating on a criminal forum. An internal investigation identified the individual involved, revoked their access and led to additional security controls. A limited number of affected clients were notified.
More recently, Kraken received another tip and a similar video. The company said it again identified the individual responsible, terminated their access and notified affected users.
Security incidents remain a persistent issue in crypto because the industry combines high-value, easily transferable assets with technical and human vulnerabilities. Digital assets can be moved instantly across borders and are often irreversible once lost, making them attractive targets for malicious actors. At the same time, weaknesses in smart contracts, private key management and exchange infrastructure can create exploitable entry points, while phishing and social engineering schemes continue to target users directly.
Recent crypto exploits have shown increasing sophistication, with attackers combining smart contract vulnerabilities, social engineering and rapid fund movement to maximize impact.
In cases like the Drift exploit, adversaries appear to have used a deep understanding of protocol mechanics and liquidity conditions to manipulate systems in ways that are difficult to detect in real time, underscoring how complex and fast-moving decentralized finance (DeFi) environments can create opportunities for advanced attacks.
Kraken is a U.S.-based cryptocurrency exchange operated by Payward Inc., offering spot and derivatives trading, as well as custody and staking services for digital assets. Founded in 2011, the platform serves retail and institutional clients globally, providing access to cryptocurrencies such as bitcoin and ether (ETH), as well as fiat on- and off-ramps. The company is also known for its focus on security and regulatory compliance across multiple jurisdictions.
Across both incidents, approximately 2,000 client accounts were potentially viewed, according to the company. Kraken has millions of customers, and the security events affected only 0.02% of their client base, a person with knowledge of the matter told CoinDesk.
Kraken said it began receiving extortion demands shortly after the latest access was cut off, with the group threatening to distribute materials from both incidents to media outlets and on social media. The company said it will not comply.
The exchange added that it has been working with industry partners and law enforcement to investigate what it describes as broader insider recruitment efforts targeting crypto, gaming and telecommunications firms. It said it believes there is sufficient evidence to identify and arrest those responsible.
“The security of our clients is our highest priority, and we remain fully committed to combating the growing global threat of insider recruitment and constantly enhancing our security practices to combat new threats,” Percoco added.
Galaxy Digital (GLXY), the digital asset financial services firm founded by Mike Novogratz, said it also recently contained a cybersecurity incident involving unauthorized access to an isolated development workspace. No client funds or account data were accessed or at risk.
Read more: Galaxy Digital’s testnet suffers hack but no client funds or information were compromised


Securitize has announced an integration with TRON, adding one of crypto’s busiest networks to its multichain distribution strategy. The deal will bring tokenized funds and securities issued through Securitize onto TRON and support a new real-world asset product due to launch on the network soon.
This comes at a point in tokenized finance where competition depends as much on where assets can be traded, how easily they can find buyers and sellers, and how many users can reach them, as on the act of tokenizing them in the first place.
Why TRON stands out
TRON gives Securitize entry into a network with large user activity, heavy stablecoin usage, and deep transfer flow.
According to figures cited in the announcement, TRON has more than 373 million accounts, over $26 billion in total value locked, and roughly $7.9 trillion in annual transfer volume.
For tokenized securities, those numbers point to a network with real transaction depth. For issuers trying to place regulated assets inside active onchain markets, that is an advantage.
Carlos Domingo, co-founder and CEO of Securitize, linked the integration to global availability and continuous access.
“Tokenization is about bringing real-world financial assets onto infrastructure capable of global scale and continuous market access,” Domingo said. “TRON has built one of the most widely used blockchain networks for value transfer, and this integration positions tokenized securities to tap into that reach over time.”
Securitize is entering the next phase of the RWA race
For the past few years, tokenized asset firms have focused on proving that regulated securities, private credit products, and fund interests can exist onchain. Much of that work centered on compliance, custody, legal structure, and investor access.
Attention is now turning to trading activity, liquidity, and distribution. After all, once an asset is tokenized, the next step is making sure it can circulate inside an active market.
Securitize enters this deal with one of the strongest institutional profiles in the sector. The company says it has more than $4 billion in assets under management and has worked with firms including Apollo, BlackRock, BNY, Hamilton Lane, KKR, and VanEck.
In the United States, it operates through SEC-registered entities spanning brokerage, transfer agency, and an alternative trading system. In Europe, it operates through an authorized investment firm under the EU DLT Pilot Regime.
Securitize’s credentials give it a leading position among traditional financial firms entering tokenization. The TRON integration adds access to a blockchain economy built around frequent use rather than limited institutional pilots.
TRON brings stablecoin liquidity and everyday transaction flow
TRON has long been associated with stablecoin transfers, especially USDT, and with payment flows across exchanges, wallets, and cross-border activity. That gives it a different profile from chains whose tokenization ambitions are more closely tied to asset management or developer activity alone.
Justin Sun, founder of TRON, described the partnership as part of the growing overlap between traditional finance and DeFi.
“Our collaboration with Securitize, a leader in tokenization, continues the convergence of traditional finance and DeFi in a powerful new way,” Sun said. “Together, we’re building the infrastructure for a global, onchain financial system.”
Ultimately, tokenized products become more useful when they sit inside active markets. A fund or security issued on a chain with thin usage may satisfy legal and technical requirements, yet still struggle to gain meaningful circulation. TRON offers a very different setting, especially for issuers seeking access to large pools of stablecoin liquidity.
Public chains are becoming more attractive to issuers
The news also says something about how tokenized asset firms now view public blockchains. For a long period, many tokenization efforts leaned toward controlled venues, private systems, or highly restricted environments. Public chains now offer constant settlement, transferability, and access to large digital asset user bases.
TRON is not alone in chasing this thesis. Ethereum, Solana, and other networks have all structured themselves as destinations for real-world assets.
The combination of Securitize’s standing with major asset managers and TRON’s place in stablecoin activity is key here. One side brings regulated product experience, while the other brings volume and distribution.
Product importance
Important details are still missing. Neither company has yet identified the first real-world asset product due to launch on TRON. That product’s design will do a lot to determine how important this deal becomes.
Indeed, a tightly controlled fund for a narrow investor group would tell one story, while a product built for deeper onchain liquidity and wider participation would tell another.
There is also a credibility issue in the market. Tokenized finance has produced a steady flow of product launches, partnerships, and pilot programs, but secondary trading activity has often stayed limited. A deal like this suggests firms are paying closer attention to circulation and liquidity, especially on blockchains where large amounts of value already move every day.
Final thoughts
For Securitize, TRON offers access to one of crypto’s largest transaction environments. For TRON, the integration adds another route into tokenized finance at a time when competition among public chains is heating up.
Overall, tokenization depends on issuance and circulation. Firms able to combine both will be in a stronger position as the sector develops.
The post Securitize Expands to TRON as Tokenized Asset Competition Builds appeared first on BeInCrypto.
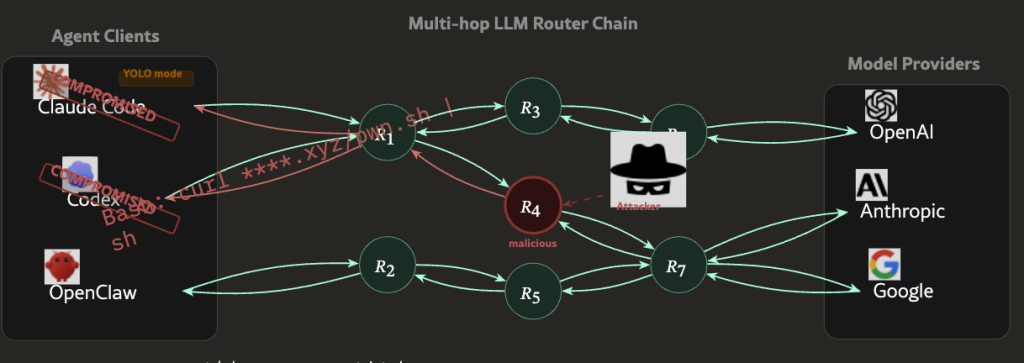
University of California researchers have identified a new class of infrastructure-level attack capable of draining crypto wallets and injecting malicious code into developer environments – and this crypto theft already happened in the wild.
A systematic study published on arXiv on April 8, 2026, titled “Measuring Malicious Intermediary Attacks on the LLM Supply Chain,” tested 428 AI API routers and found that 9 actively injected malicious code, 17 accessed researcher AWS credentials, and at least one free router successfully drained ETH from a researcher-controlled private key.
The attack surface is the AI agent routing layer – infrastructure that has expanded rapidly as AI agents become embedded in blockchain execution workflows. The question is no longer whether this threat is theoretical. The question is how many compromised routers are already handling live user sessions.
- Scale of testing: Researchers tested 428 routers – 28 paid (sourced from Taobao, Xianyu, Shopify) and 400 free from public communities – using decoy AWS Canary credentials and encrypted crypto private keys.
- Confirmed malicious activity: 9 routers injected malicious code, 17 accessed AWS credentials, and 1 free router drained ETH from a researcher-owned wallet.
- Evasion sophistication: 2 routers deployed adaptive evasion, including waiting 50 API calls before activating and specifically targeting YOLO-mode autonomous sessions.
- Attack mechanism: Routers operate as application-layer proxies with plaintext JSON access – no encryption standard governs what they can read or modify in transit.
- Poisoning reach: Leaked OpenAI keys processed 2.1 billion tokens, exposing 99 credentials across 440 Codex sessions and 401 autonomous YOLO-mode sessions.
- Recommended defenses: Researchers urge client-side fault-closure gates, response anomaly filtering, append-only audit logging, and cryptographic signing for verifiable LLM responses.
Discover: Top Crypto Presales to Watch This Month
How Malicious AI Agent Routers Actually Work – Plaintext Proxies, Not Encrypted Pipes
Standard LLM API infrastructure was designed for simple request-response relay: a client sends a prompt, the router forwards it to the model provider, the response comes back.
Malicious routers exploit exactly that trust model – they sit as application-layer proxies in the middle of that exchange, with full read-write access to plaintext JSON payloads passing through them in both directions.

There are no encryption standards governing what a router can inspect or modify in transit. A malicious router sees the raw prompt, the model response, and everything embedded in either – including private keys, API credentials, wallet seed phrases, or code being generated for a live deployment environment.
It can alter the response before it reaches the user, inject additional code into a code-generation output, or silently exfiltrate credentials to an external endpoint.
The UC researchers built an agent they called “Mine” to simulate four distinct attack types against public frameworks, specifically targeting autonomous YOLO-mode sessions where the agent executes actions without human confirmation at each step.
Two of the 428 routers tested deployed adaptive evasion – one waited 50 API calls before activating malicious behavior, specifically to avoid detection during initial testing. That’s not a blunt credential-scraper. That’s a targeted tool built to survive scrutiny.
The poisoning attack vector compounds the risk further. When leaked OpenAI API keys are processed through compromised routing infrastructure, the blast radius scales fast – 2.1 billion tokens processed, 99 credentials exposed across 440 Codex sessions in the researchers’ controlled test environment alone.
Discover: The best crypto to diversify your portfolio with
Who Is Actually Exposed – and Why Existing Defenses Don’t Reach This Layer of Crypto Theft
The problem is not that third-party API routers exist. The problem is that the entire trust model for AI agent infrastructure assumes the routing layer is neutral – and no enforcement mechanism currently verifies that assumption at scale.
Developers building onchain tools, DeFi automation scripts, and autonomous trading agents route API calls through third-party infrastructure constantly.
Free routers sourced from public communities – the category where 8 of the 9 malicious injectors were found, are widely used precisely because they lower the cost of building LLM-powered applications. As automated execution infrastructure in DeFi grows more dependent on external data and agent coordination, the routing layer becomes an increasingly attractive target.
Existing wallet security – hardware devices, multisig setups, offline key storage – does not protect against a router that intercepts a private key before it reaches the signing layer, or that injects malicious code into a deployment script that later executes onchain.
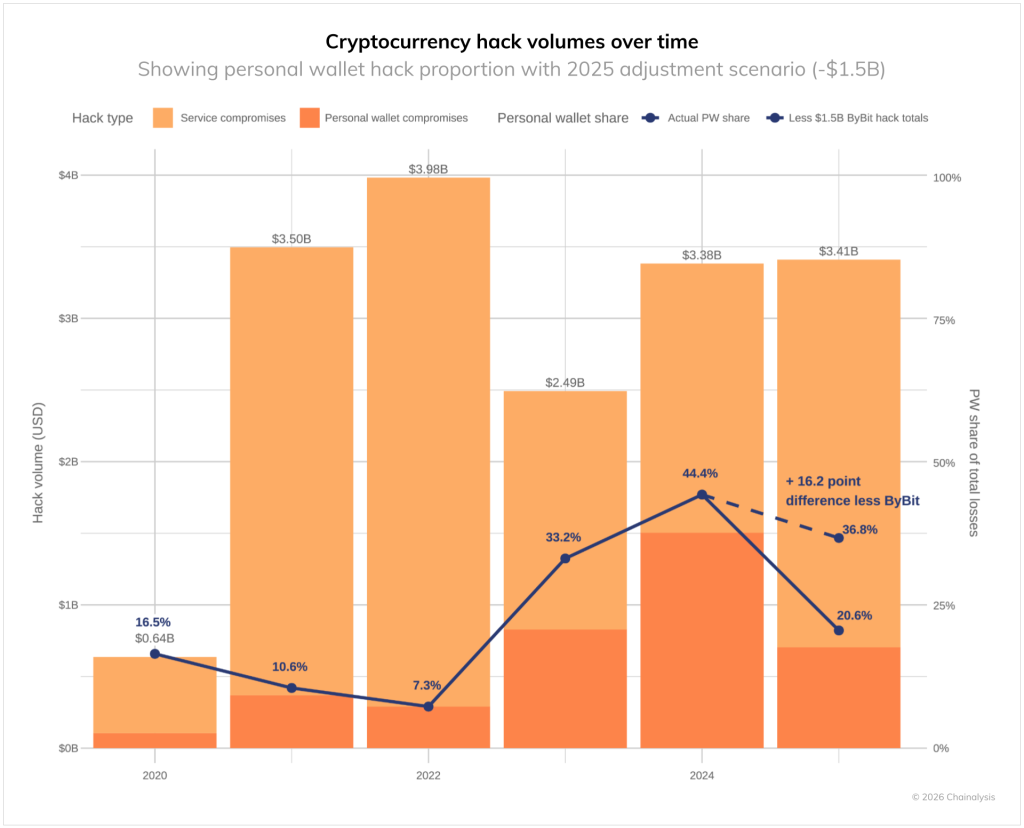
Annual crypto theft losses already hit $1.4 billion. This attack vector doesn’t require breaking cryptography. It requires compromising a piece of middleware that most users never examine.
YOLO-mode autonomous sessions are the highest-risk exposure point. When an agent executes multi-step transactions without human confirmation checkpoints, a malicious router has a wider window to act – and the user has no interstitial moment to catch anomalous behavior.
Solayer founder @Fried_rice amplified the findings on X on April 10, 2026, describing the situation as “third-party API routers widely relied on by large language model agents” carrying “systemic security vulnerabilities” – a characterization that landed hard given the scale of autonomous agent adoption across DeFi tooling.
The researchers’ recommended defenses are client-side: fault-closure gates that halt execution when anomalous responses are detected, response anomaly filtering, and append-only logging for audit trails that can’t be tampered with by the router itself. Longer term, the UC team is advocating for cryptographic signing standards that would make LLM responses verifiable – the same architectural principle that makes onchain oracle integrity a live design requirement rather than an afterthought.
Discover: The best pre-launch token sales
The post Researchers Warn Malicious AI Agent Routers Could Become a New Crypto Theft Vector appeared first on Cryptonews.

Key Highlights
- ALMU stock soars 46% following announcement of $4M federal contract awards
- Share price reaches $15.75 amid quantum photonics funding announcement
- Government support accelerates AI semiconductor and photonics initiatives
- Federal funding exceeding $4M drives quantum technology commercialization plans
- ALMU experiences major breakout as federal partnerships strengthen tech roadmap
Shares of Aeluma, Inc. (ALMU) experienced a significant rally following the announcement of new federal contract awards focused on quantum and photonics innovation. The stock climbed to $15.75, representing a 46.29% gain in a single trading session. This sharp movement came after the company revealed it had secured over $4 million in non-dilutive federal funding to advance semiconductor scaling technologies.
Federal Contracts Propel Stock Performance
The dramatic rise in Aeluma’s share price followed the company’s announcement of significant government contract wins supporting its commercialization strategy. These federal awards specifically target scalable semiconductor technology for quantum applications and high-speed data transmission platforms. The news boosted investor confidence in the company’s positioning within cutting-edge technology sectors.
These contract awards emphasize expanding wafer manufacturing and advanced fabrication capabilities through established industry partnerships. The company maintains ongoing collaborations with Tower Semiconductor and Sumitomo Chemical Advanced Technology. These strategic alliances are designed to enhance manufacturing capacity and create robust supply chain frameworks.
Aeluma positions these achievements to address growing demand in AI infrastructure, defense applications, and next-generation communications networks. The non-dilutive funding structure protects existing shareholders from equity dilution while enabling near-term operational objectives. Consequently, the company bolsters its operational foundation while pursuing strategic long-term expansion.
Advancing Quantum Dot Laser and Photonic Technologies
The company continues developing its quantum dot laser capabilities to meet the needs of emerging data center and telecommunications infrastructure. These advanced lasers deliver superior power efficiency, enhanced durability, and minimized signal degradation. Such characteristics prove critical for quantum computing architectures and AI-powered interconnect frameworks.
Aeluma employs metalorganic chemical vapor deposition techniques to facilitate mass production of quantum dot components. This manufacturing approach enables high-throughput fabrication while ensuring consistent performance specifications across diverse use cases. The company incorporates these laser systems into sophisticated multi-channel photonic arrays designed for advanced computational platforms.
The firm also progresses its aluminum gallium arsenide nonlinear photonics platform tailored for quantum technology deployments. This specialized material enables superior photon creation and control for communications and detection systems. Accordingly, the platform delivers enhanced capabilities versus conventional materials currently employed in photonic implementations.
Market Position in AI and Quantum Sectors
Aeluma solidifies its competitive standing by combining compound semiconductor advantages with conventional silicon fabrication methodologies. The organization previously validated successful material integration on CMOS-compatible 200mm silicon substrates. This technical achievement enables scalable manufacturing across both 200mm and 300mm production environments.
This integration capability ensures compatibility with silicon nitride waveguide technologies utilized in quantum photonic systems. Such an approach facilitates straightforward implementation within current semiconductor manufacturing infrastructure. Aeluma minimizes commercial deployment obstacles across high-growth market segments.
The newly awarded contracts fund specific demonstration projects and scaling operations at its California headquarters and partner manufacturing sites. These initiatives target accelerated preparation for volume manufacturing and commercial market penetration. Ultimately, Aeluma reinforces its leadership position in quantum technology, artificial intelligence, and high-performance communication solutions.

Crypto World
The Monero Price Prediction Everyone Is Reading While Pepeto Quietly Fills the Presale Smart Money Found First
The monero price prediction carries serious weight this cycle because XMR hit a new all time high of $798 in January and now trades 57% below that peak, leaving every trader asking whether this bounce means real recovery or another trap waiting to snap shut. Privacy demand keeps growing even as exchanges delist the token one by one.
While the XMR forecast plays out over months, Pepeto is the network that attracted more than $8.9 million with a confirmed Binance listing, working exchange tools already live, and a presale price that disappears permanently the moment trading begins and early holders start building wealth.
Monero Price Prediction Gains Attention as THORChain Integration and FCMP++ Upgrade Approach
Monero is set to launch on THORChain’s mainnet within two months, enabling private cross chain swaps without centralized exchanges according to CoinMarketCap.
The network also activated its FCMP+ upgrade expanding privacy coverage to the entire chain, and Coinpedia reported that XMR’s price structure shows a Wyckoff base building pattern with a breakout setup forming above key support.
When a privacy coin adds decentralized liquidity and quantum resistant upgrades at the same time, the monero price prediction shifts from hope to pure timing.
XMR at $339 and Pepeto at $8.9M: The Presale Where Timing Is Already Decided
Pepeto: The Network With Verified Tools and a Listing That Locks the Return
When ranking every presale drawing capital this cycle, Pepeto wins before the math even starts, because every other early token asks for blind trust in something that does not exist yet. Pepeto already runs a full network where every tool is live and your capital stays protected from the first second you enter.
PepetoSwap runs trades across tokens at zero cost, so returns stay whole instead of getting sliced apart by fees on every single position. The risk scorer reviews every contract before you buy, so tokens designed to empty wallets get flagged instantly and your money stays exactly where it belongs.
A developer from Binance directs the build, and SolidProof checked every contract with results locked on chain for anyone to verify. More than $8.9 million came in during extreme fear, proving that the wallets that always end up on the winning side of every cycle did their research and moved while everyone else sat paralyzed watching prices fall. Staking pays 185% APY, growing positions daily that gain real, compounding value once the Binance listing sets the opening price and the market discovers what these holders already own.
At $0.000000186 per token, analysts project 100x to 300x once trading starts. The 420 trillion supply matching the original Pepe coin sets a starting point that even the best monero price prediction cannot come close to touching from a $6 billion cap. The Binance listing marks a cutoff that ends this entry for good, and once that door closes there is no walking back through it.
Every day closer to that date is one less day you can get in at a price the open market will never offer again. Pepeto is the only play this cycle where the return comes from one listing and the tools already run today.
Monero Price Prediction: Levels, Targets, and What the Breakout Means
XMR trades near $339 with a $6.2 billion cap, sitting 57% below its January 2026 all time high of $798 per CoinMarketCap.
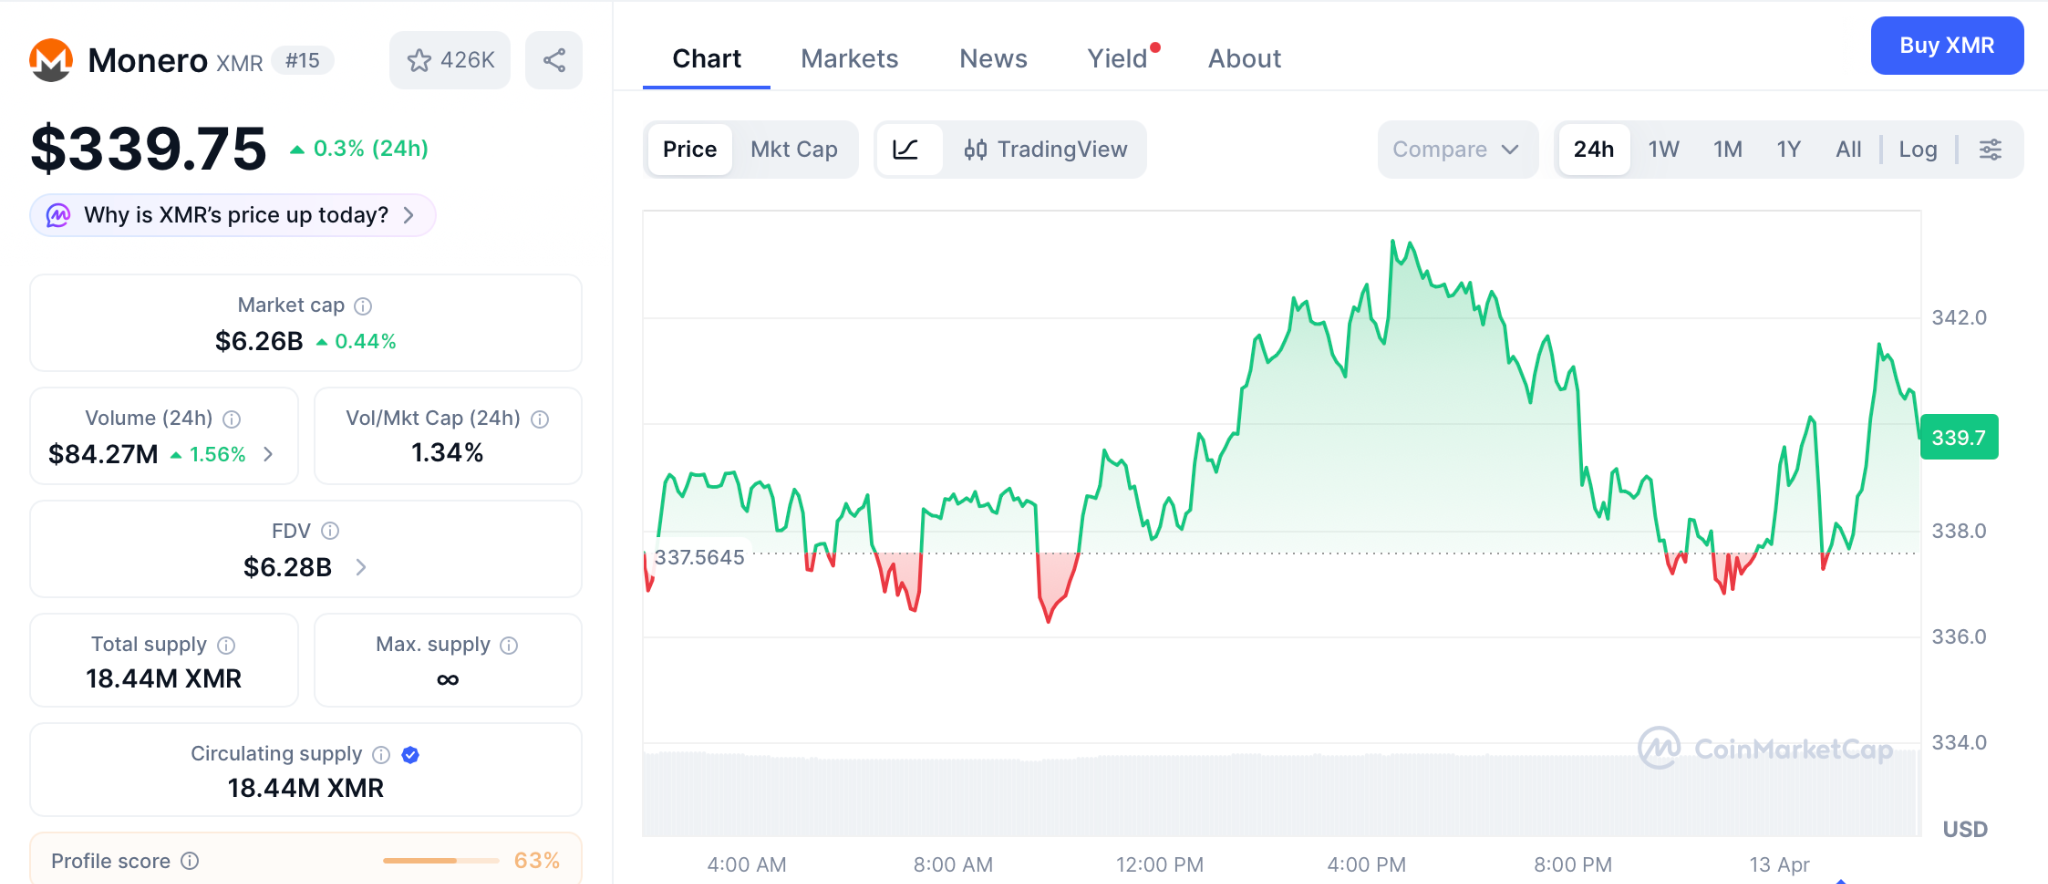
Changelly projects the monero price prediction for April between $310 and $365, with an average near $338. The $380 to $400 supply zone is the key resistance, and a clean break above it would confirm a shift from months of tight range into a fresh move higher.
The THORChain integration brings back the trading access that exchanges took away, and the bull case targets $555 by year end per Cryptopolitan. Even that aggressive target delivers roughly 63% from current levels, strong for a privacy token but months away from a $6 billion base.
Conclusion
XMR holds the privacy story and a THORChain integration that restores the liquidity exchanges stripped away, but 63% over months from a $6 billion cap is a trade, not a wealth event. Wealth events happen when you find the one entry that no one else has priced in yet and you commit before the listing forces the entire market to pay what you already hold. Pepeto is that entry.
The creator of the $11 billion Pepe token built a working exchange. SolidProof signed off on every line of code. A former Binance developer runs the build. And $8.9 million came in from wallets that recognize this setup because they have seen presale to listing events mint millionaires before and they are positioning to be on the right side again.
Entering through the Pepeto official website at this price is how a single decision made today turns into the financial turning point you look back on for the rest of your life. The monero price prediction asks for months of patience and gives you 63%.
The Binance listing asks for one entry and gives you a shot at returns that rewrite your entire financial future. The presale closes, the price vanishes, and the only people who win are the ones already inside.
Click To Visit Pepeto Website To Enter The Presale

FAQs
How does the THORChain integration affect the monero price prediction?
Decentralized swaps restore liquidity lost to delistings, and the monero price prediction improves, but Pepeto at presale pricing with a confirmed listing delivers returns XMR needs months to match.
Is XMR a strong buy at 57% below its all time high?
XMR targets $380 to $555 with strong privacy demand, but the gain takes months while a move from the Pepeto official website captures that return in one listing event.
Can a presale outperform the XMR forecast this cycle?
Pepeto with a developer from Binance, more than $8.9 million attracted, and a confirmed listing is how presale positions deliver the returns privacy token forecasts take years to reach.
Disclaimer: This is a Press Release provided by a third party who is responsible for the content. Please conduct your own research before taking any action based on the content.
Crypto World
Allogene Therapeutics (ALLO) Stock Soars 41% Following Breakthrough CAR T-Cell Trial Results

Key Highlights
- ALPHA3 trial demonstrated 58.3% MRD negativity in cema-cel patients compared to just 16.7% in the observation group
- Zero instances of cytokine release syndrome or neurotoxicity reported among treated participants
- Baird analysts upgraded their price target from $7.00 to $9.00 while maintaining Outperform status
- Probability of success for the therapy program increased to 70% according to Baird’s assessment
- Shares climbed to $3.87 from $2.91, marking approximately 99% gains year-to-date
Shares of Allogene Therapeutics experienced a dramatic rally exceeding 41% on April 13, 2026, following the disclosure of encouraging interim results from the company’s crucial Phase 2 ALPHA3 clinical study examining cemacabtagene ansegedleucel (cema-cel) in patients diagnosed with high-risk large B-cell lymphoma.
Allogene Therapeutics, Inc., ALLO
The released information originated from an interim futility analysis conducted on the trial. Within the initial cohort of 24 randomized participants, 58.3% receiving cema-cel treatment successfully achieved minimal residual disease (MRD) negativity. By contrast, the observation group saw merely 16.7% achieve this benchmark — representing a substantial 41.6 percentage point advantage.
Researchers are utilizing Natera’s investigational CLARITY MRD assay to detect high-risk patients prior to observable clinical relapse. The study positions cema-cel as a first-line consolidation treatment option, which would represent an earlier intervention point than most existing CAR T therapeutic strategies.
Remarkable Safety Results Generate Buzz
The trial’s safety outcomes proved equally compelling as the effectiveness data. Remarkably, no treated participants developed cytokine release syndrome or immune effector cell-associated neurotoxicity syndrome — two complications frequently linked with CAR T cellular therapies.
Additionally, zero treatment-related serious adverse events were documented. Such a clean safety profile stands out significantly within this therapeutic category, prompting Baird analysts to highlight it as a key distinguishing characteristic when evaluating cema-cel against second-line autologous CAR T alternatives.
The therapy’s potential for outpatient administration, coupled with these favorable safety metrics, contributes to what could be a distinctive competitive position. Current CAR T treatments typically mandate inpatient care and are associated with more substantial toxicity concerns.
Following the data announcement, Baird elevated its ALLO price objective from $7.00 to $9.00 while retaining its Outperform recommendation. The investment firm also boosted its probability of success projection for this therapeutic program to 70%.
“The limited dataset size of 12 treated patients should generate enthusiasm,” Baird wrote, acknowledging the early-stage nature of the readout while flagging the initial results as a positive signal for the commercial profile in the first-line setting.
Looking Forward
The ALPHA3 clinical study is recruiting approximately 220 participants across more than 60 clinical sites. Efficacy endpoints continue to remain blinded currently, and the available dataset remains relatively limited. These preliminary figures will require validation as additional trial data matures.
Scheduled interim event-free survival analyses are anticipated in 2027, with complete primary results projected for 2028. Favorable outcomes from these assessments could potentially support a future biologics license application submission.
Additional Wall Street analysts are monitoring developments closely. Jefferies recently launched coverage on ALLO with a Buy recommendation and a $6.00 price objective, while Citizens maintained its Market Outperform stance with a $5.00 target price.
ALLO shares reached $3.87 on April 13, advancing from the previous session’s close of $2.91. The equity has gained approximately 99% year-to-date and is currently trading near its 52-week peak. InvestingPro analysis indicates the stock is presently valued above its calculated fair value, though the biotechnology company maintains a balance sheet with cash holdings exceeding debt obligations.
Bose QuietComfort headphones have just dropped below $200 for the first time in a while
Man found dead in Dundee home as police launch probe

Perth Mint’s sales drop amid geopolitical uncertainty


-

 Politics3 days ago
US brings back mandatory military draft registration
-

 Fashion3 days ago
Weekend Open Thread: Veronica Beard
-
 Sports3 days ago
Man United discover Nico Schlotterbeck transfer fee as defender reaches Dortmund agreement
-

 Tech6 days ago
How Long Can You Drive With Expired Registration? What Florida Law Says
-

 Politics1 day ago
World Cup exit makes Italy enter crisis mode
-

 Crypto World4 days ago
Canary Capital Files SEC Registration for PEPE ETF
-

 Business3 days ago
Tesla Model Y Tops China Auto Sales in March 2026 With 39,827 Registrations, Beating Cheaper EVs and Gas Cars
-

 Politics3 days ago
Malcolm In The Middle OG Turned Down ‘Buckets Of Money’ To Appear In Reboot
-

 Crypto World5 days ago
Bitcoin recovers as US and Iran Agree a Ceasefire Deal
-

 Fashion6 days ago
Let’s Discuss: DEI in 2026
-
 NewsBeat18 hours ago
Pep Guardiola and Gary Neville agree over Arsenal title problem that benefits Man City
-

 Business3 days ago
OpenAI Halts Stargate UK Data Centre Project Over Energy Costs and Copyright Row
-

 Business2 days ago
Ireland Fuel Protests Enter Day 5 as Blockades Spark Shortages and Government Prepares Support Package
-

 Politics3 days ago
LBC Presenter Mocks Trump Over Iran War Failures
-

 Crypto World3 days ago
Federal judge blocks Arizona from bringing criminal charges against Kalshi
-

 Tech4 days ago
A version of Windows 10 released a decade ago is now eligible for additional security patches
-
 NewsBeat1 day ago
JD Vance announces ‘no agreement’ with Iran over nuclear weapons fear
-

 Business3 days ago
IMF retains floor for precautionary balances at SDR 20 billion
-
 Entertainment5 days ago
Alfred Hitchcock’s 10 Most Suspenseful Masterpieces, Ranked
-
 Entertainment3 days ago
A ‘Bridgerton’ Star’s New Survival Thriller Is a Must-Watch on Netflix This Weekend
You must be logged in to post a comment Login