Crypto World
Bitcoin Price Shows Bottom Signal Not Seen Since 2022

Bitcoin has attempted to recover in recent sessions, but upward momentum has stalled as the market waits for a clearer direction. Price remains range-bound after a sharp correction, frustrating short-term traders.
Despite this pause, historical indicators suggest a bottom may be forming. Past cycles show similar conditions often precede renewed recovery phases.
Sponsored
Sponsored
Bitcoin Profitable Supply Hits 2022 Level
Bitcoin’s recent decline triggered a signal last seen during the 2022 bear market. The percentage of supply in profit fell to around 50%, meaning half of all circulating BTC is now underwater. This threshold has historically coincided with market bottoms rather than prolonged sell-offs.
When profitable supply compresses to these levels, selling incentives weaken. Holders become less willing to realize losses, reducing sell-side pressure. In previous cycles, this dynamic encouraged investors to hold through volatility, allowing the price to stabilize before recovery resumed.
Want more token insights like this? Sign up for Editor Harsh Notariya’s Daily Crypto Newsletter here.

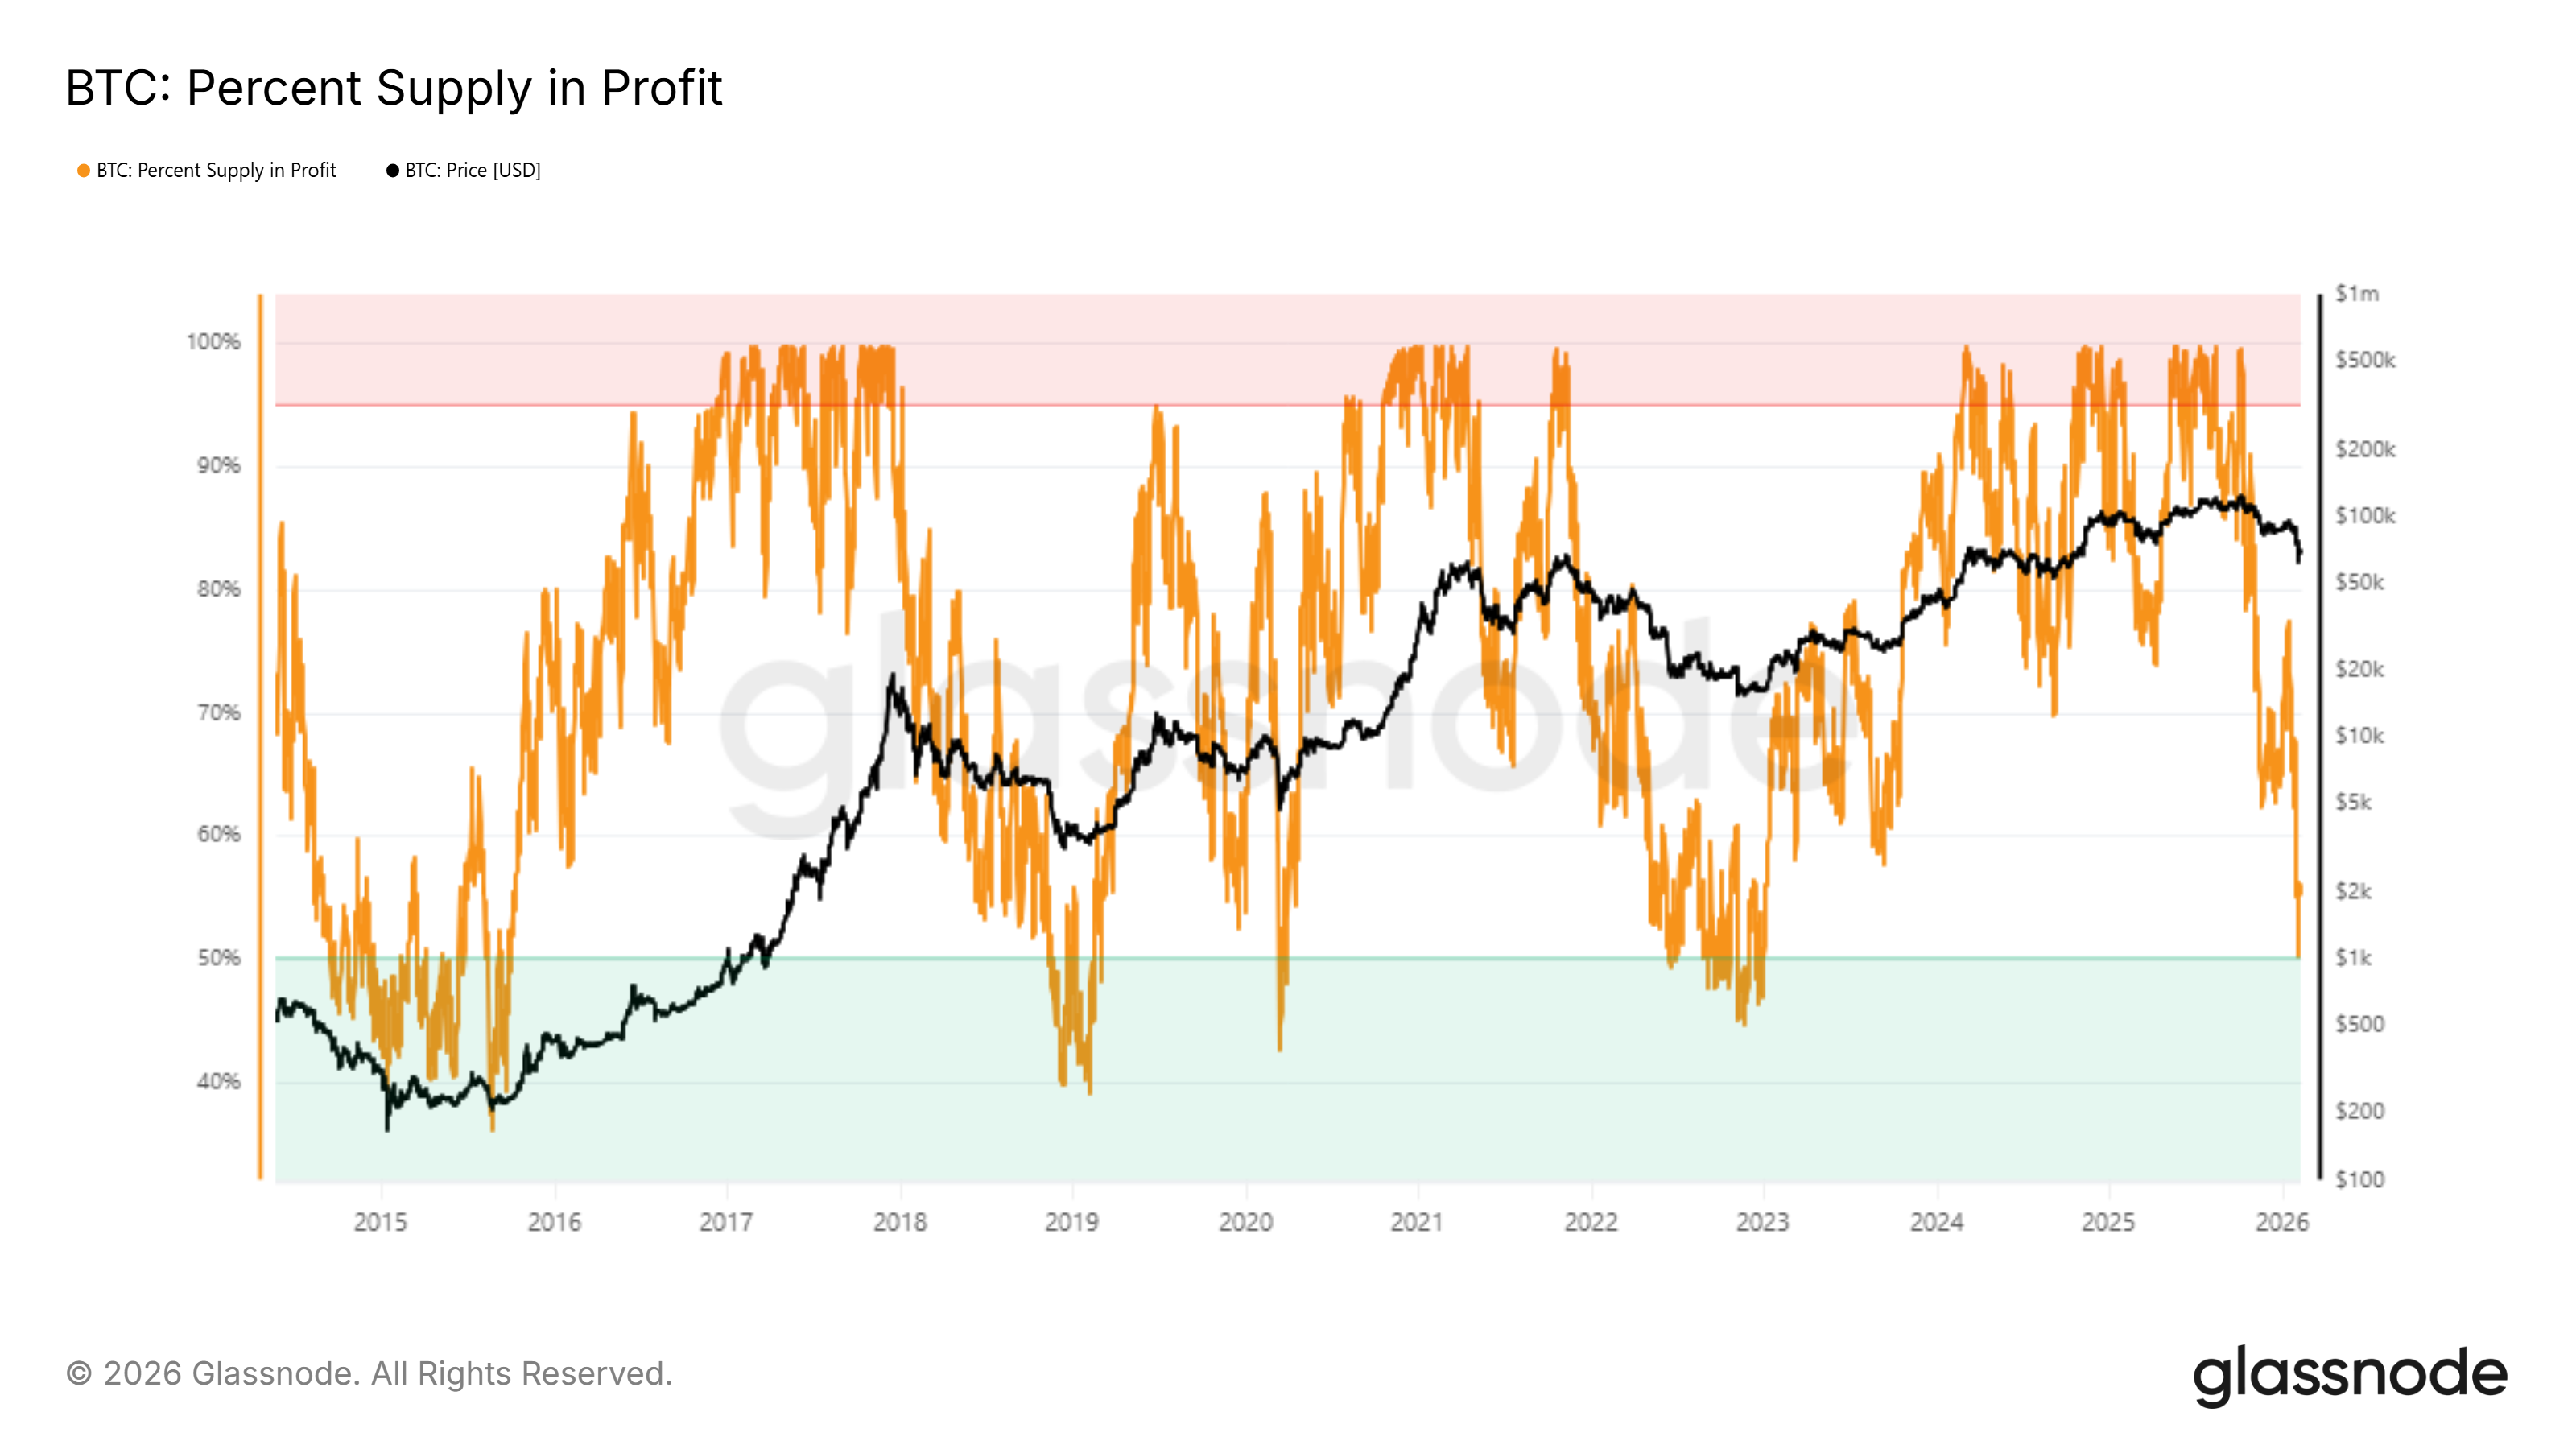
Lower prices also attract fresh capital. Value-oriented buyers tend to enter when downside risk appears limited relative to upside potential. This influx of new demand has historically helped revive Bitcoin recoveries once profitable supply falls to or below the 50% mark.
Why Is Bitcoin Likely To Bounce Back?
Macro indicators reinforce the bottoming narrative. The Pi Cycle Top Indicator, which compares the 111-day moving average to a doubled 350-day moving average, remains far from signaling BTC overheating. This indicator historically flags major tops when the shorter average crosses the higher threshold.
Sponsored
Sponsored
Currently, the opposite setup is unfolding. The shorter moving average is diverging below the longer one, signaling cooling conditions rather than excess speculation. In past cycles, such divergence often preceded sustained rebounds as Bitcoin reset from overheated levels.
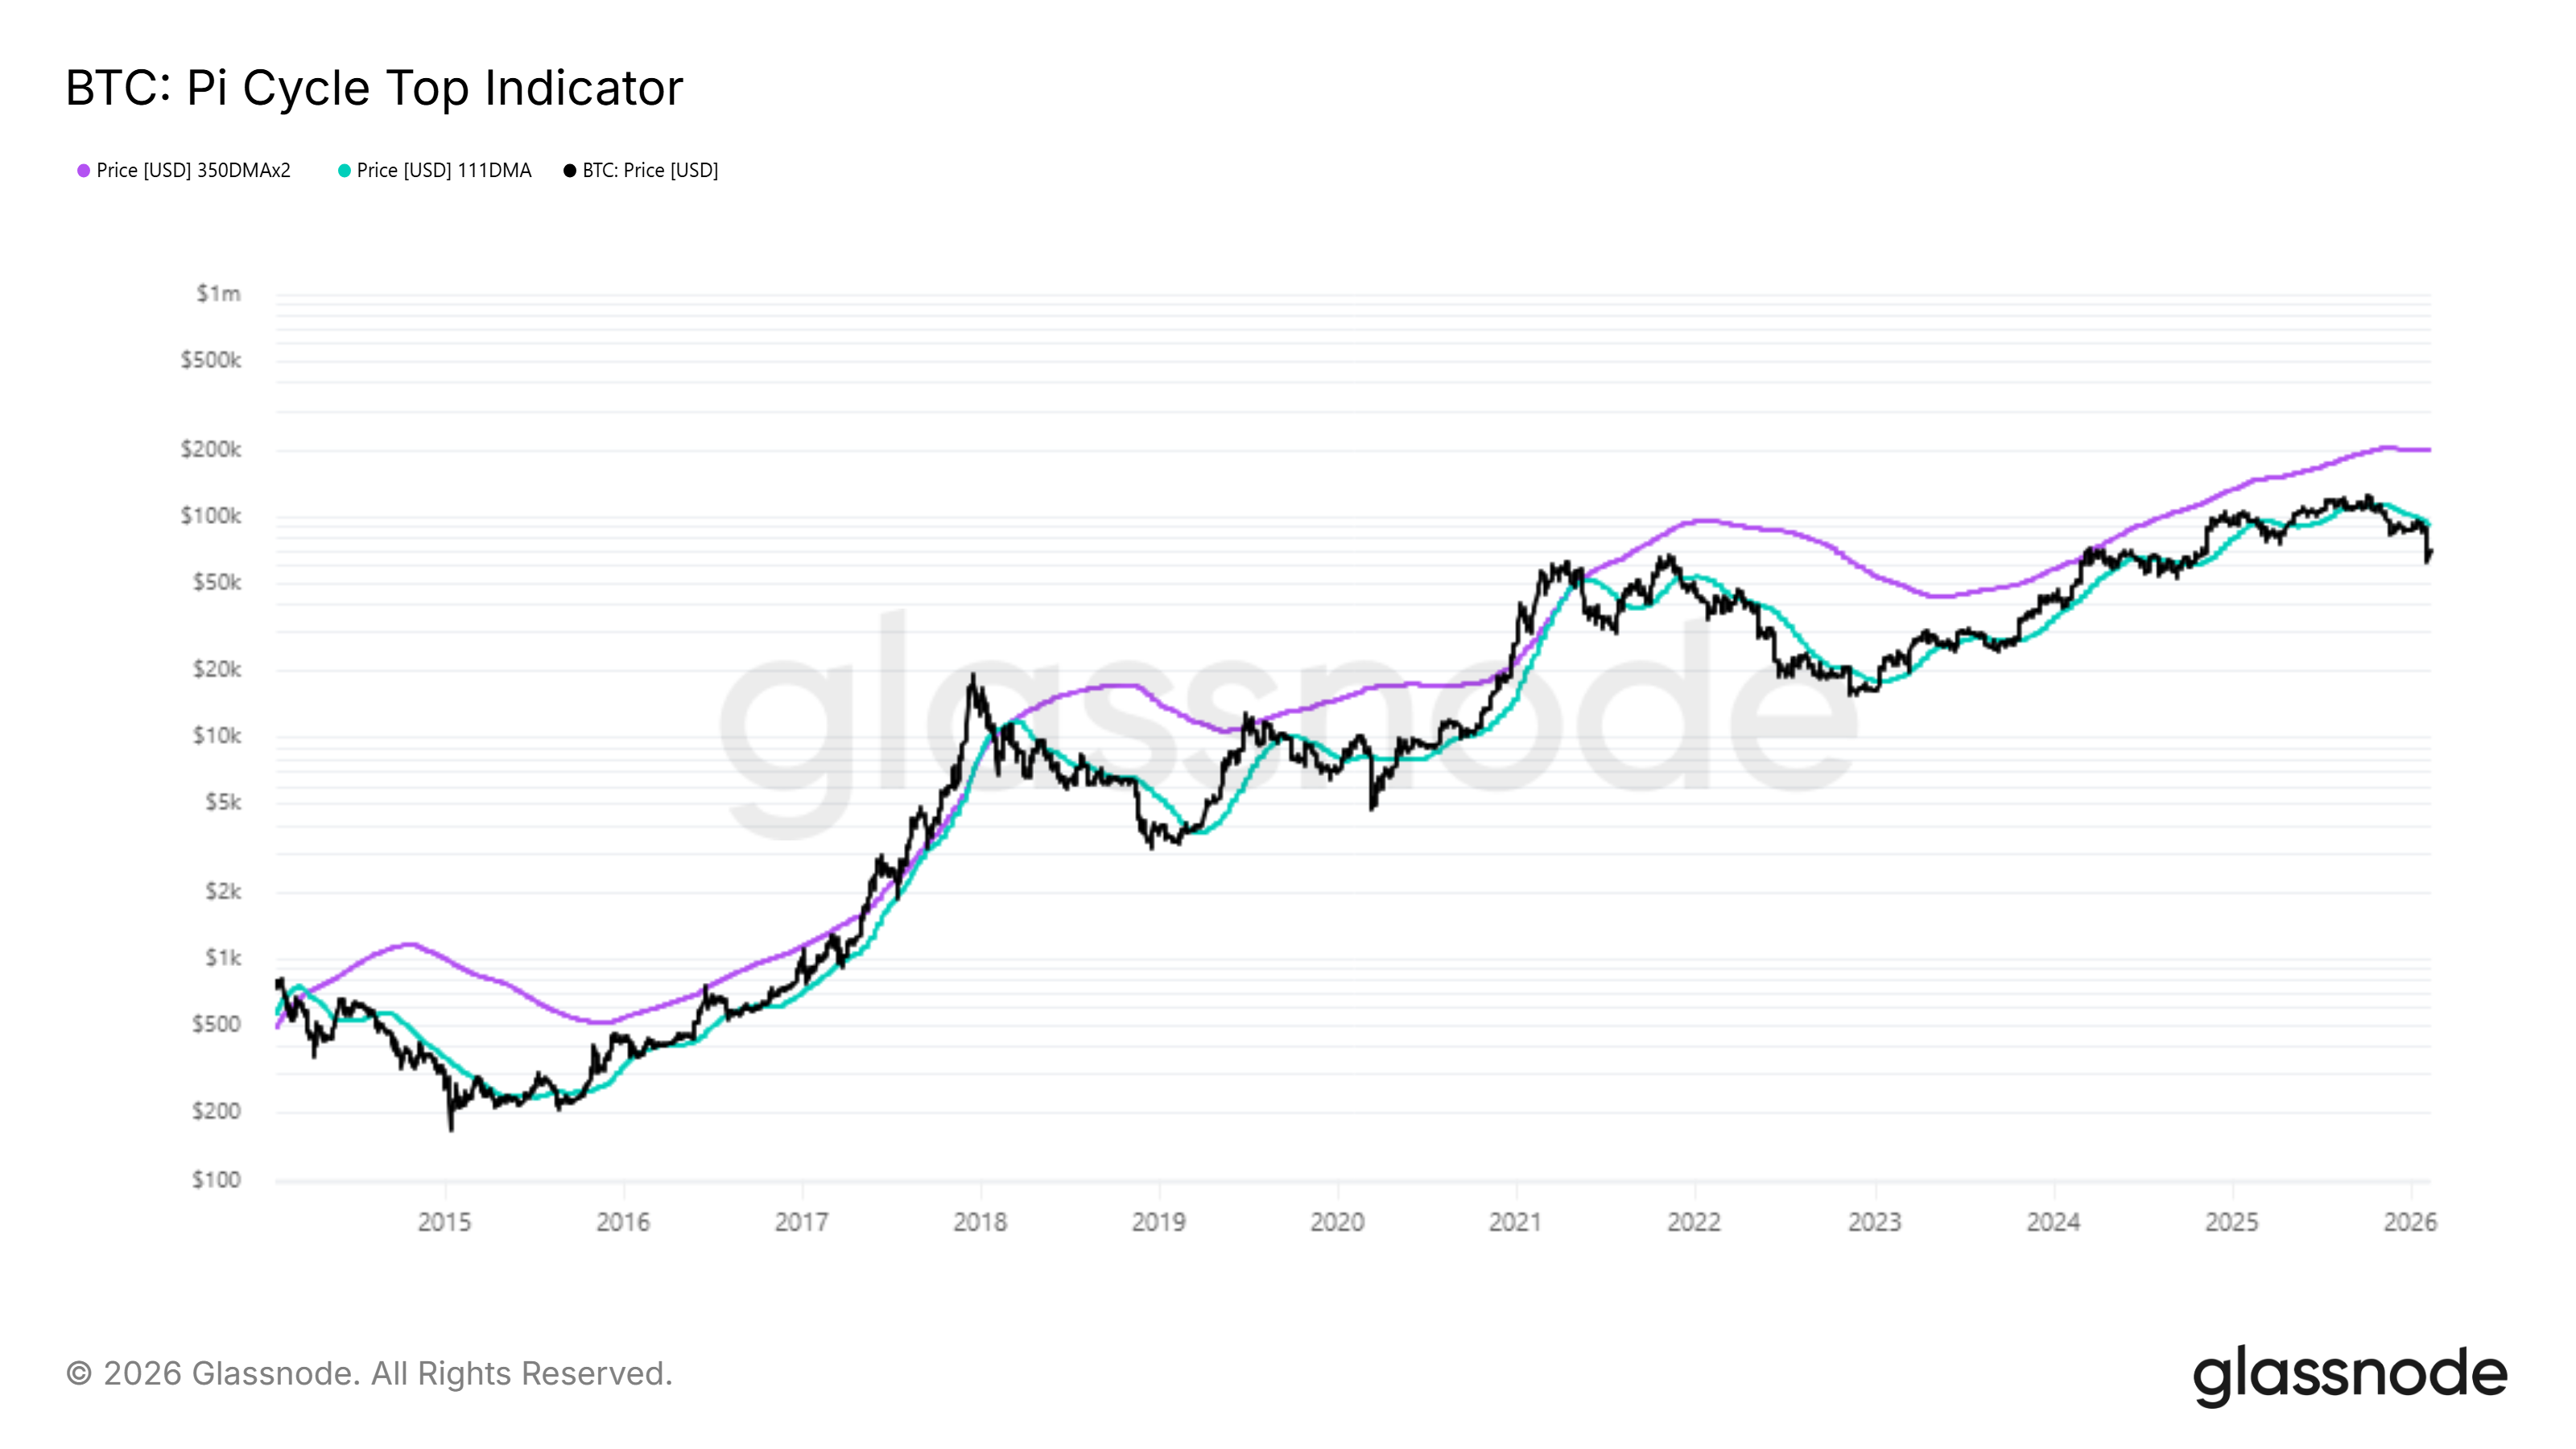
This cycle differs from prior ones. Since March 2023, Bitcoin has maintained a macro uptrend without excessive overheating. Gradual price appreciation limited speculative excess, making this the first clear bottom signal in nearly three years rather than a sharp capitulation-driven low.
BTC Price Levels To Watch
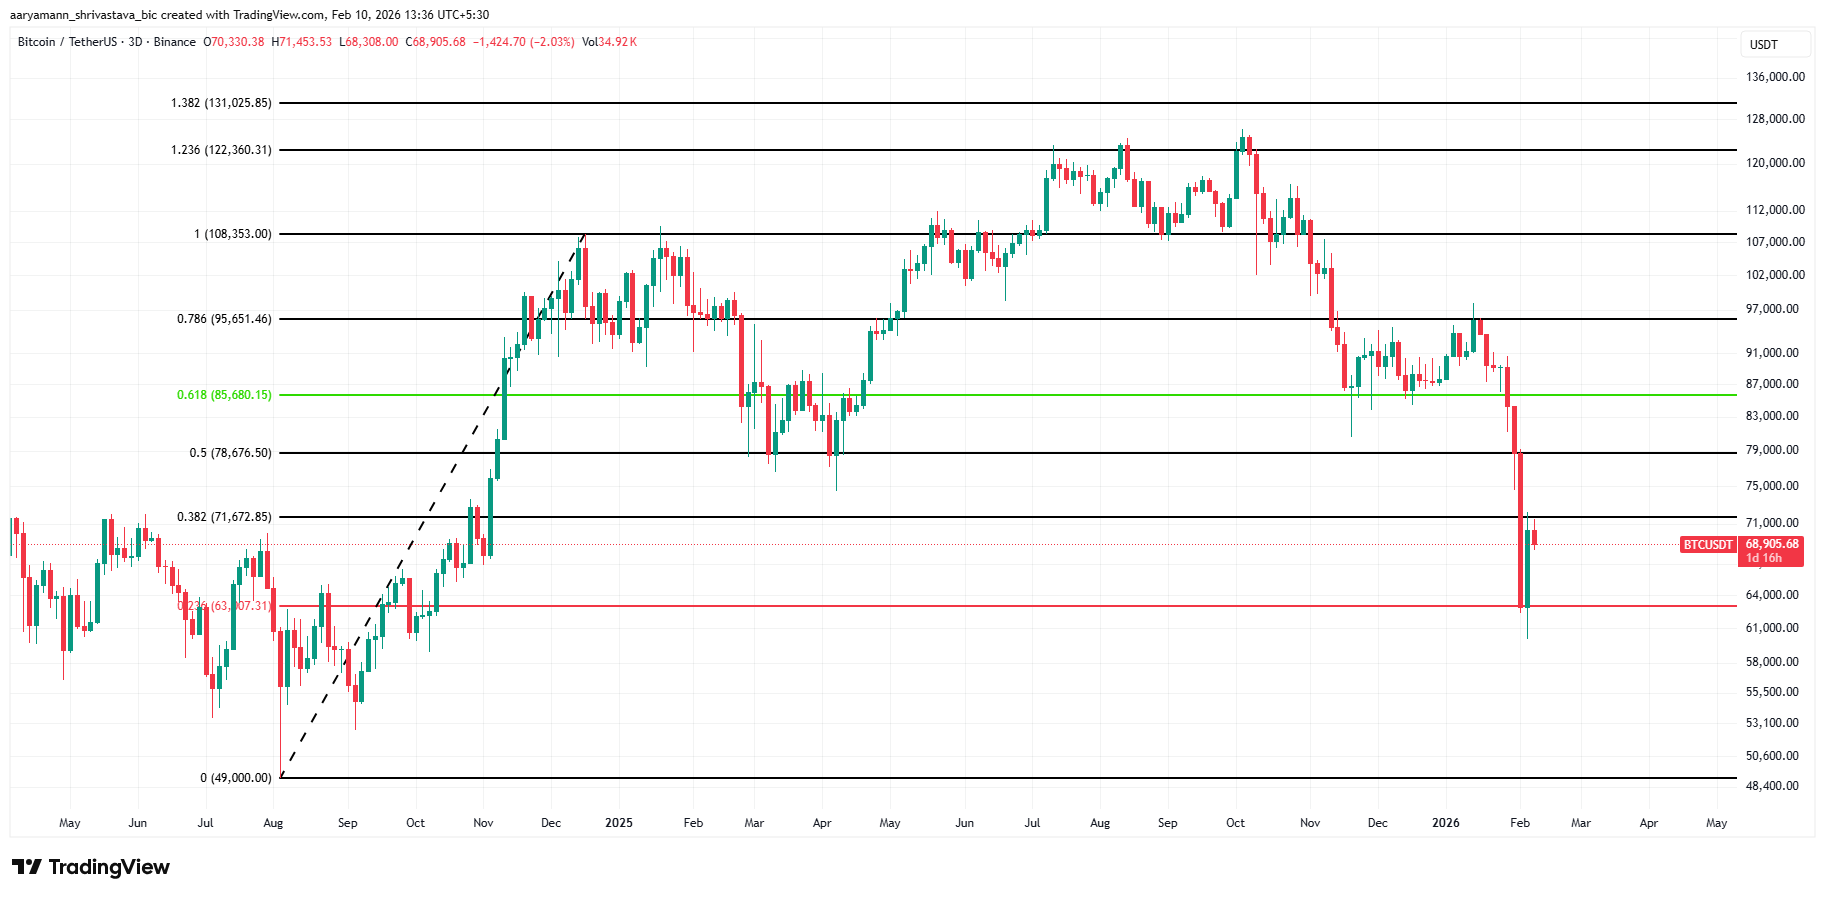
In the short term, Bitcoin is holding above the 23.6% Fibonacci retracement near $63,007. At the time of writing, BTC trades around $68,905, maintaining support despite repeated tests. However, price remains capped below the $71,672 resistance, limiting immediate upside.
If on-chain signals continue holding and inflows strengthen, Bitcoin could break above $71,672. Such a move would open the path toward $78,676. Stronger confirmation of recovery would come only if BTC reclaims $85,680 as a sustained support level.
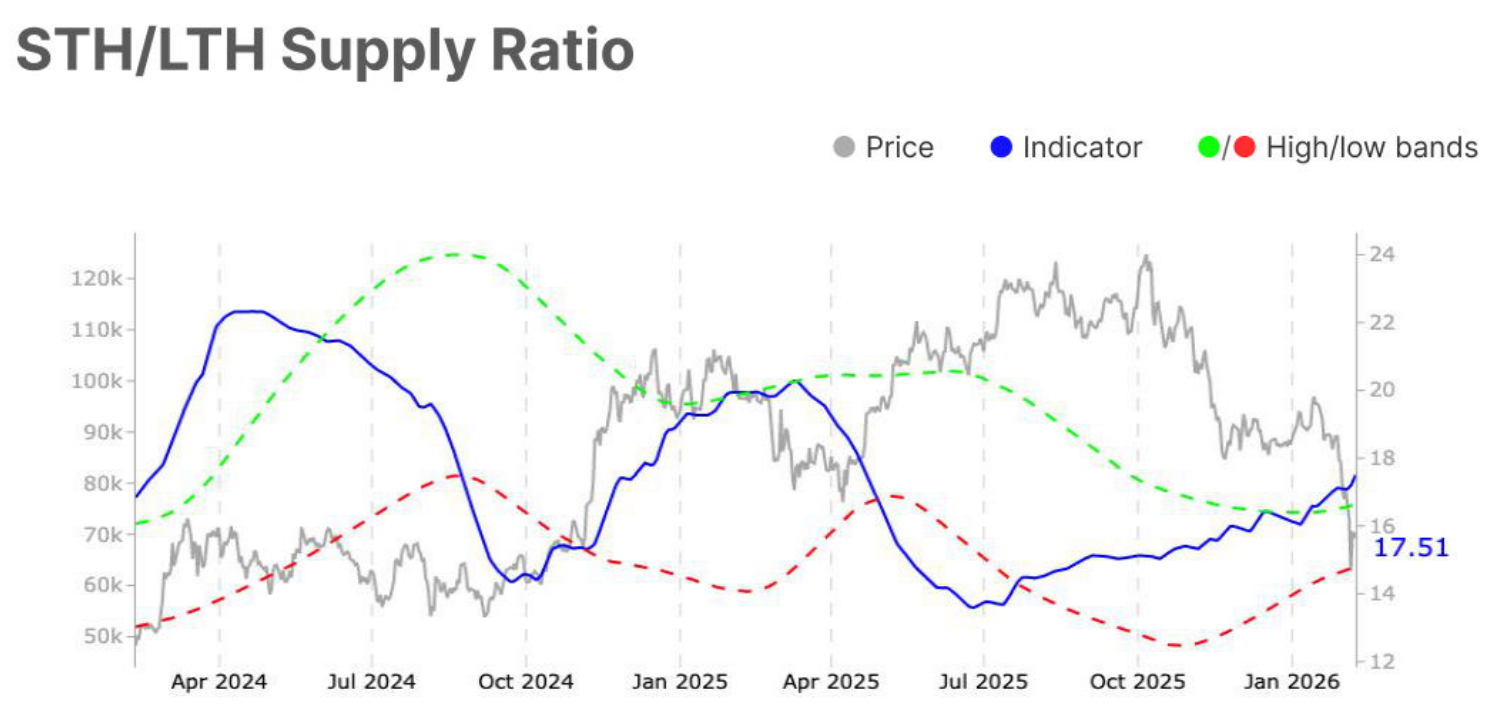
Risks remain on the downside due to the shifting market structure. The short-term holder to long-term holder supply ratio has moved above its upper band. This reflects growing short-term participation, often linked to higher volatility.
This would hurt Bitcoin’s price chances of crossing the $71,672 barrier, continuing its consolidation. Even if BTC does push past said resistance, the selling will pull it back down towards $63,000, invalidating the bullish thesis.
You must be logged in to post a comment Login