Crypto World
Bitcoin price tests $75K as Supertrend turns bearish

Bitcoin price traded near $76,200 after a volatile week as the failed CLARITY Act vote and the Federal Reserve’s rate increase kept pressure on the market. Technical indicators now point to resistance near $78,600, while liquidation data places the main downside liquidity cluster around $74,600.
Summary
- Bitcoin price fell roughly 4% over seven days after briefly approaching $80,000.
- The daily CMF dropped to -0.11, indicating that capital outflows have overtaken inflows.
- 4-hour resistance sits near $78,600, while the RSI remains below the neutral 50 level.
- Liquidation clusters near $74,600 and $77,700 could shape Bitcoin’s next move.
Bitcoin price retreats after rejection near $80,000
According to data from crypto.news, Bitcoin (BTC) was trading near $76,236 at the time of writing, according to the daily chart. The cryptocurrency had recovered from an intraday low of $75,065 after opening the session around $75,644.
BTC has lost roughly 4% over the past seven days after failing to hold an advance toward $80,000. Price briefly reached approximately $79,800 on Sep. 11 before sellers regained control, sending it as low as $74,944 on Sep. 15.
The weekly decline followed the U.S. Senate’s failure to advance the Digital Asset Market CLARITY Act. The procedural measure received 50 votes in favor and 49 against but needed 60 votes to move forward.
The proposed legislation sought to define how the Securities and Exchange Commission and Commodity Futures Trading Commission would divide oversight of digital assets. Its failure reduced the prospect of Congress establishing a federal crypto market structure before the November midterm elections.
Macroeconomic conditions added to the pressure. The Federal Reserve raised its target rate by 25 basis points to a range of 3.75% to 4.00% on Sep. 16, delivering its first increase since 2023.
Bitcoin briefly reacted to the widely expected decision but remained close to its four-week low. Higher rates can reduce demand for non-yielding and risk-sensitive assets by raising returns available from government debt and strengthening the U.S. dollar.
Daily Bitcoin indicators show weakening demand
The daily chart shows BTC trading below its 20-day simple moving average at $78,104. Reclaiming that level would be an early sign that buyers are regaining short-term control.
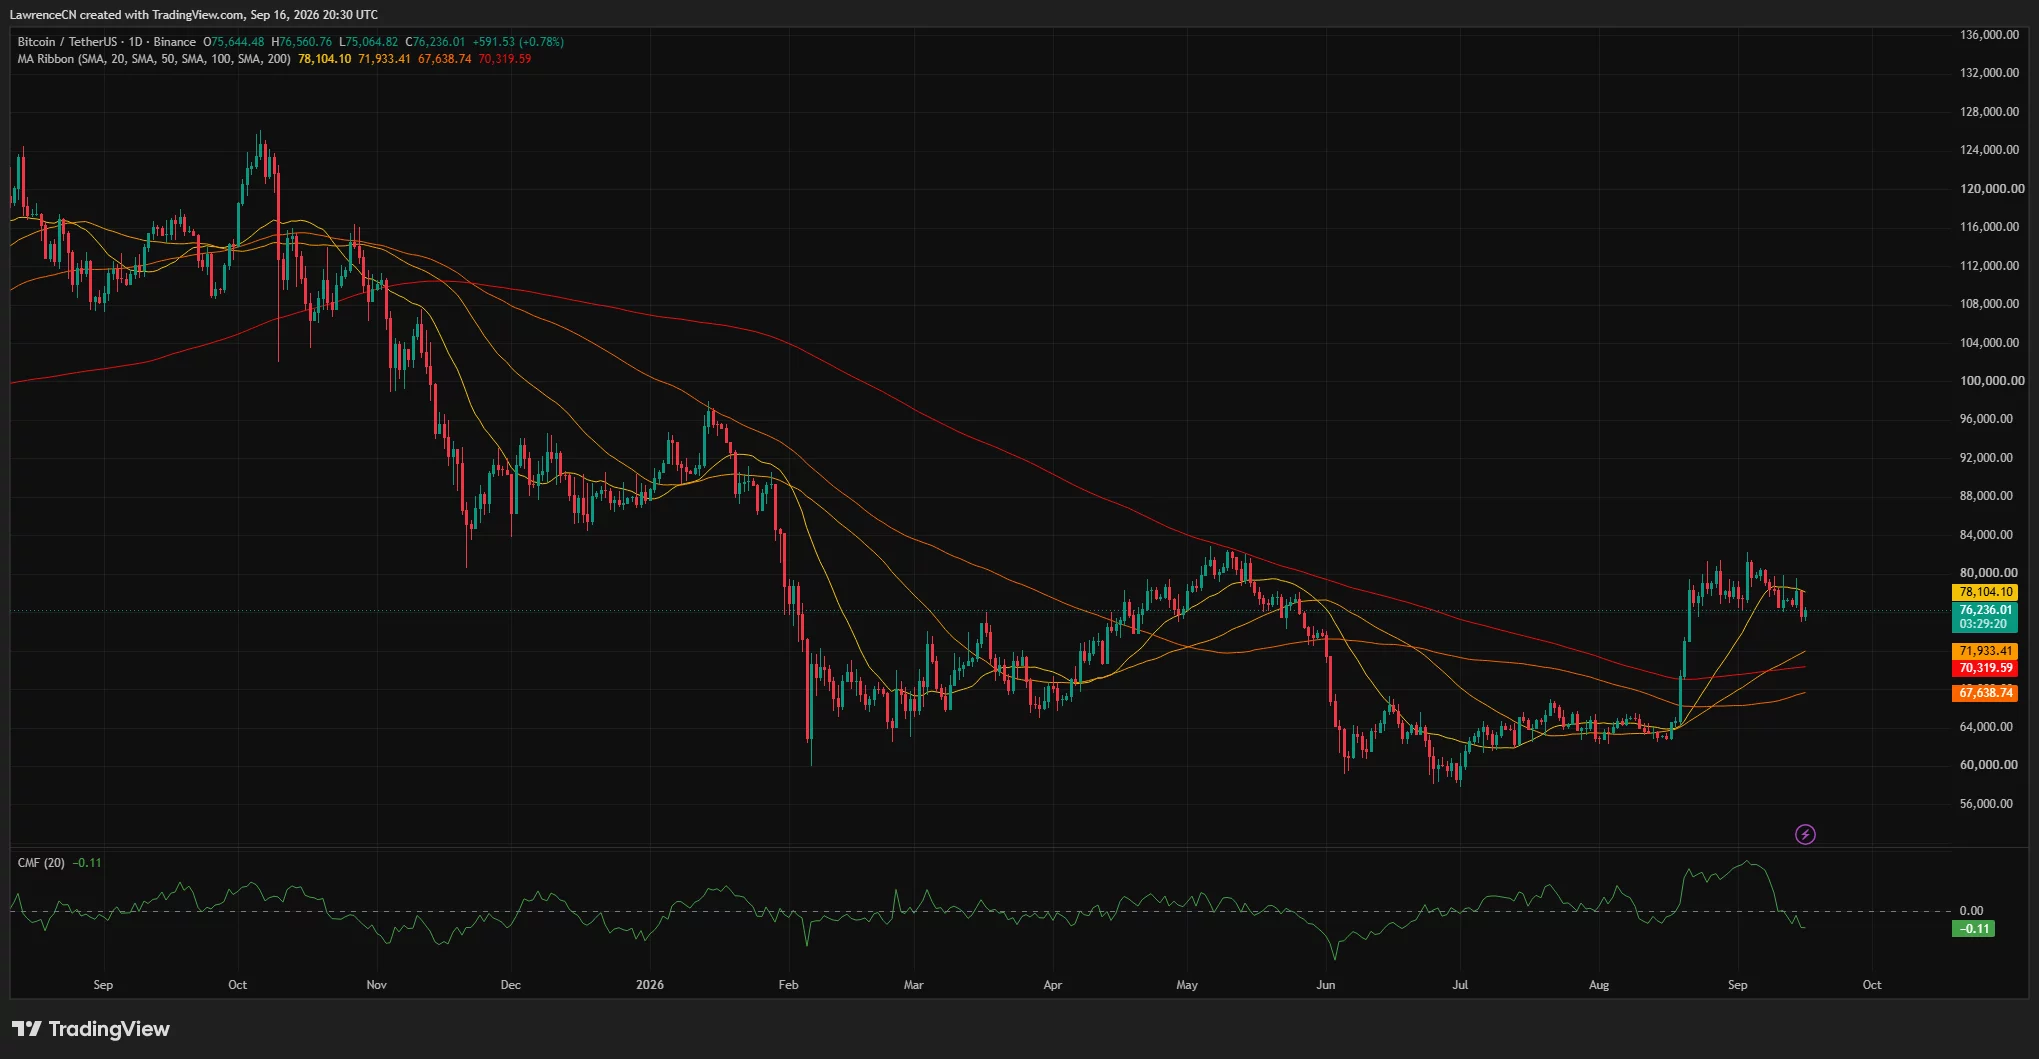

Bitcoin remains above the other major averages shown on the chart. The 50-day SMA stands near $71,933, while the 200-day and 100-day averages sit around $70,320 and $67,639, respectively.
The distance between the current price and those longer-term averages means the wider recovery from Bitcoin’s summer lows has not yet broken down. However, failure to recover the 20-day average could expose the lower moving-average cluster between $70,300 and $71,900.
Chaikin Money Flow has fallen to -0.11 after spending much of late August and early September above zero. A negative CMF reading indicates that selling pressure has exceeded buying pressure over the indicator’s 20-period window.
The change is notable because the CMF weakened as Bitcoin retreated from the $80,000 area. A return above zero would signal improving capital flows, while a deeper negative reading would add weight to the bearish setup.
Bitcoin faces 4-hour resistance at $78,600
Bitcoin’s 4-hour chart keeps the short-term trend bearish. The Supertrend indicator has flipped above the price and now marks resistance near $78,597.
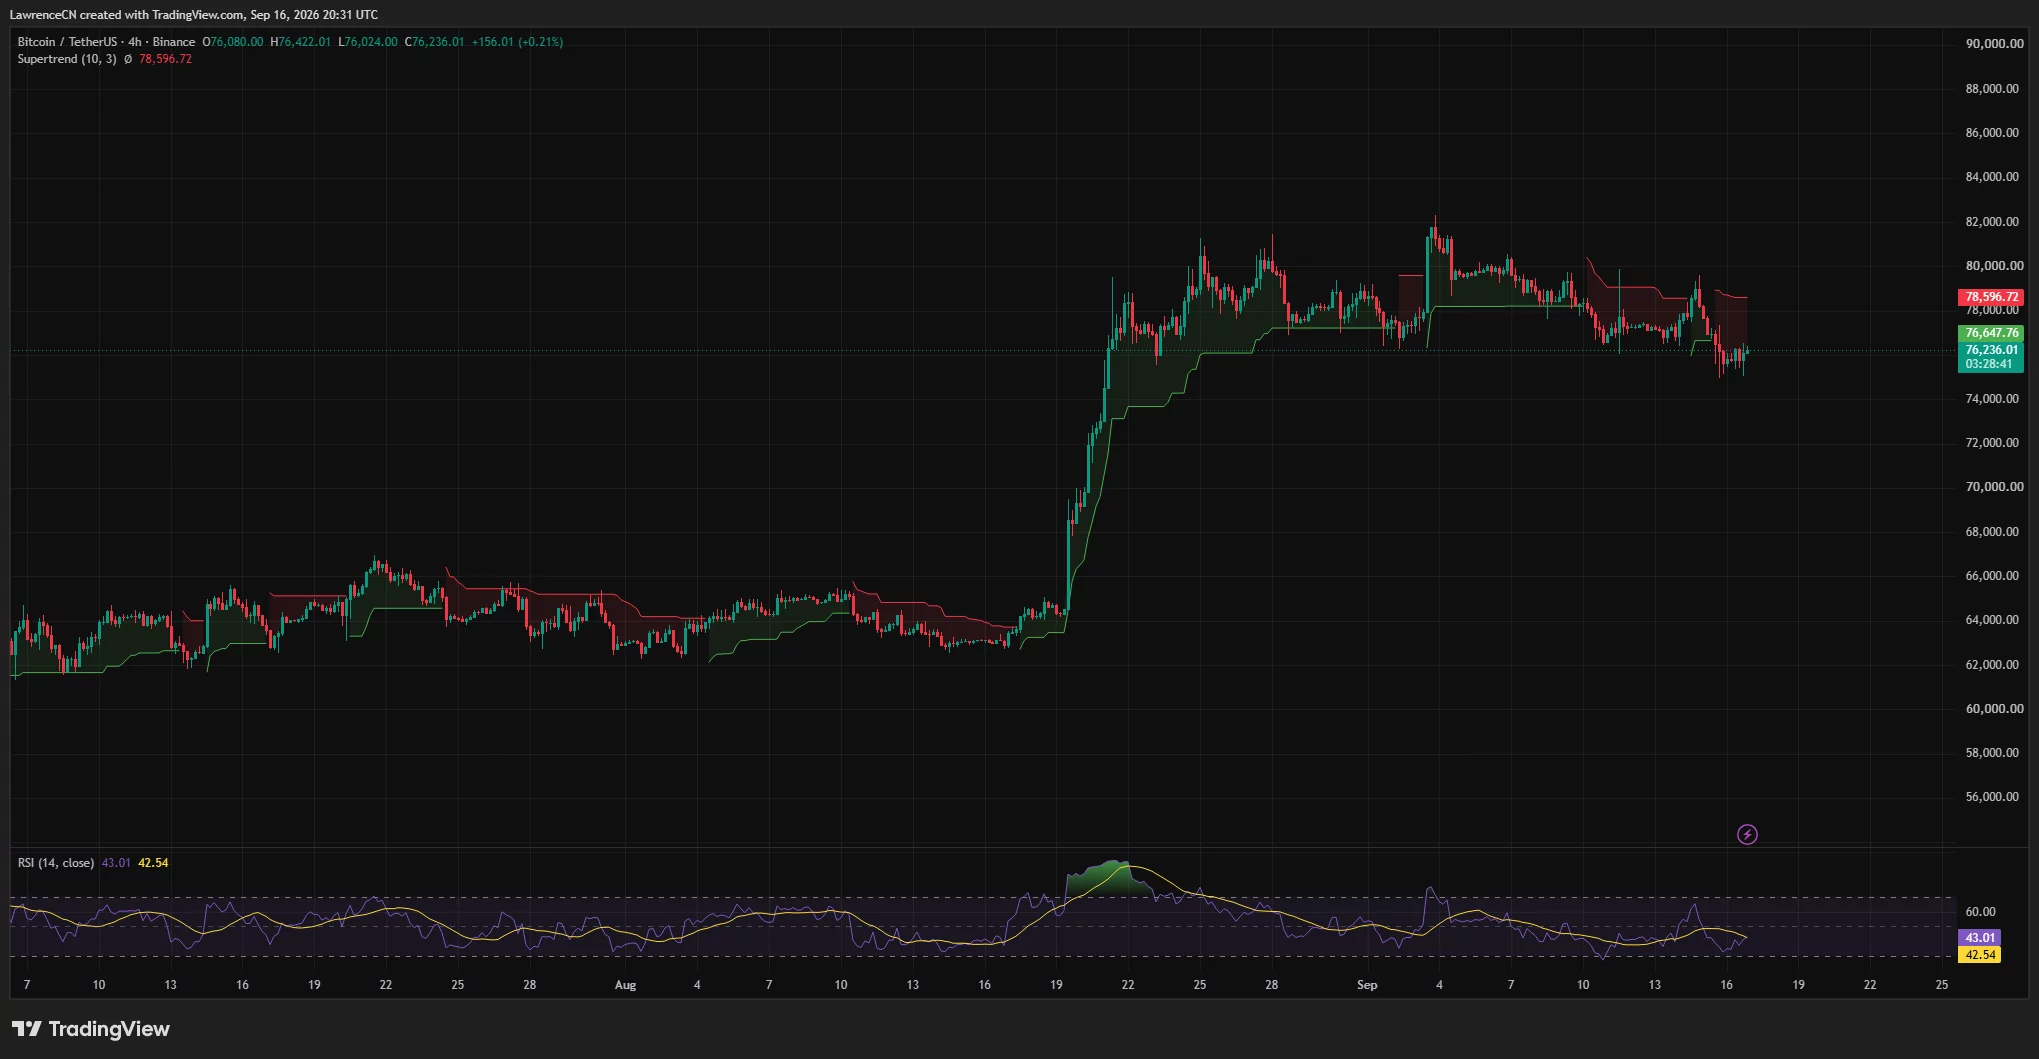
BTC also trades below the indicator’s previous support line around $76,648. Bulls would need to reclaim that level before challenging the heavier resistance zone between $78,100 and $78,600.
The 4-hour Relative Strength Index stands at 43.01, slightly above its signal average of 42.54 but below the neutral 50 mark. The reading shows weak momentum without placing Bitcoin in oversold territory, leaving room for another decline if support fails.
Initial support sits between $75,000 and $75,500, covering the Sep. 15 low and the recent 4-hour range floor. A confirmed break below that area could send BTC toward the daily moving-average region near $71,900.
Crypto trader Daan Crypto Trades said Bitcoin was positioned near its August lows and the 4-hour 200-period moving averages after two major events dominated the previous week.
“Getting them out of the way, regardless of outcome, should make price action a bit less choppy,” the trader said.
A move through $78,600 would invalidate the immediate bearish Supertrend signal and place $80,000 back in focus. Failure to clear the indicator would preserve the pattern of lower highs visible since early September.
Liquidation heatmap puts $74,600 in focus
CoinGlass’s three-day liquidation heatmap shows the largest nearby pool of leveraged positions around $74,600 to $74,700. The concentration sits below the recent low and could attract price if sellers push BTC beneath $75,000.

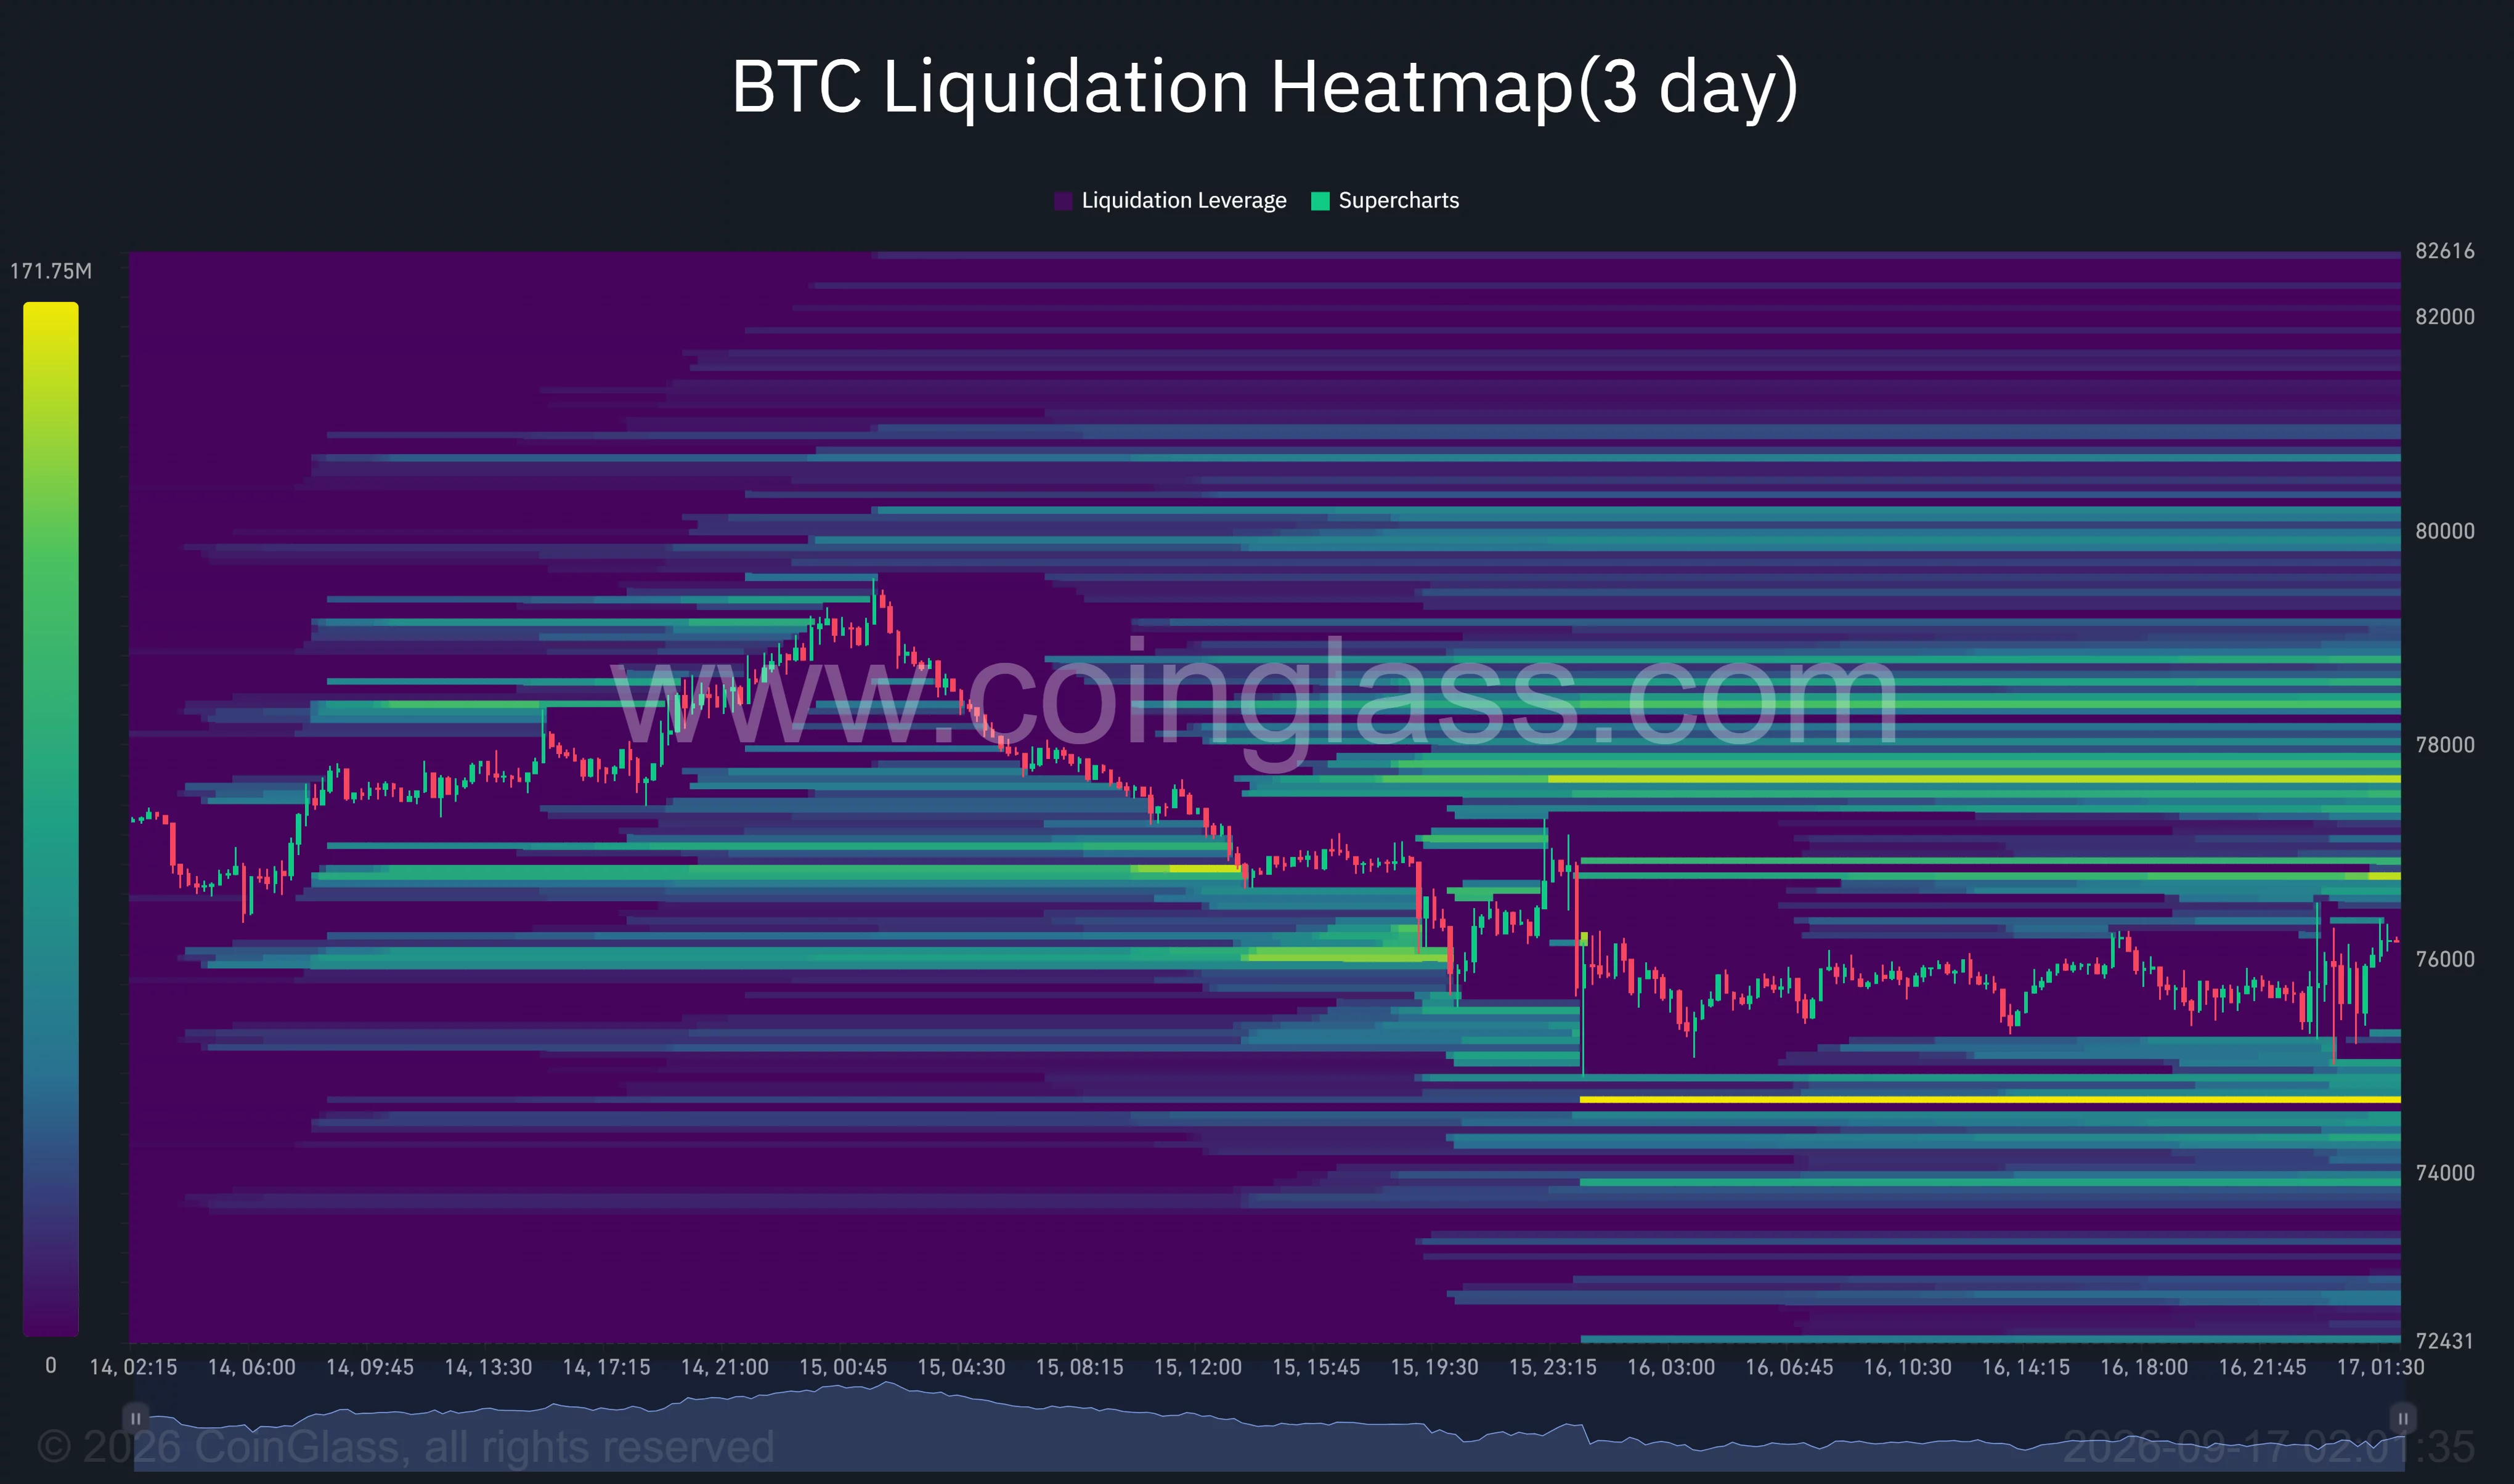
Liquidity is also concentrated above the market. The closest large bands appear between approximately $76,600 and $76,900, followed by a stronger zone around $77,500 to $77,800.
Further clusters are visible near $78,300 and $80,000. A rebound through the closest overhead bands could force short liquidations and accelerate a move toward the 4-hour Supertrend resistance.
The heatmap does not predict direction, but it identifies areas where forced position closures could increase volatility. With liquidity sitting on both sides of the current price, BTC could continue to produce sharp moves until it closes outside the $74,600–$78,600 range.
Ali Martinez identified $71,200 as another downside area, based on Bitcoin’s short-term holder realized price. The metric represents the average acquisition price of coins held by newer investors and can act as an important level during market corrections.
Bitcoin therefore faces two distinct bearish targets if $75,000 breaks: the liquidation concentration near $74,600 and the broader cost-basis and moving-average region between $70,300 and $71,900. Bulls need a sustained recovery above $78,600 to weaken that downside case and reopen a path toward $80,000.
Disclosure: This article does not represent investment advice. The content and materials featured on this page are for educational purposes only.
You must be logged in to post a comment Login