Crypto World
Bitcoin price tests $78K as bearish divergence grows

Bitcoin price slipped below $79,000 on Sep. 9 as weakening short-term momentum and liquidity clusters on both sides of the market raised the risk of a sharper move.
Summary
- Bitcoin price traded near $78,900 after falling from above $81,000 on Sep. 4.
- The 4-hour price dropped below its Bollinger Band midpoint at $79,188.
- An ADX reading of 18.31 points to weak short-term trend strength.
- Liquidation liquidity is concentrated near $80,000 above and $77,000–$78,000 below.
Bitcoin price struggles to hold $79,000
According to data from crypto.news, Bitcoin (BTC) price traded near $78,900 at the time of writing, down from an opening price of $81,271 on Sep. 4. The asset briefly fell to $78,455 during the latest daily session before buyers pushed it back toward $79,000.
The six-day pullback followed Bitcoin’s failed attempt to extend its rally above $81,000. Price reached a local high above $82,000 earlier in the period but could not hold those gains as macro concerns and leveraged liquidations weighed on demand.
Bitcoin’s broader daily structure remains constructive despite the decline. BTC is trading slightly above its 10-day simple moving average at $78,732, while the 20-day SMA is much lower at $70,242.
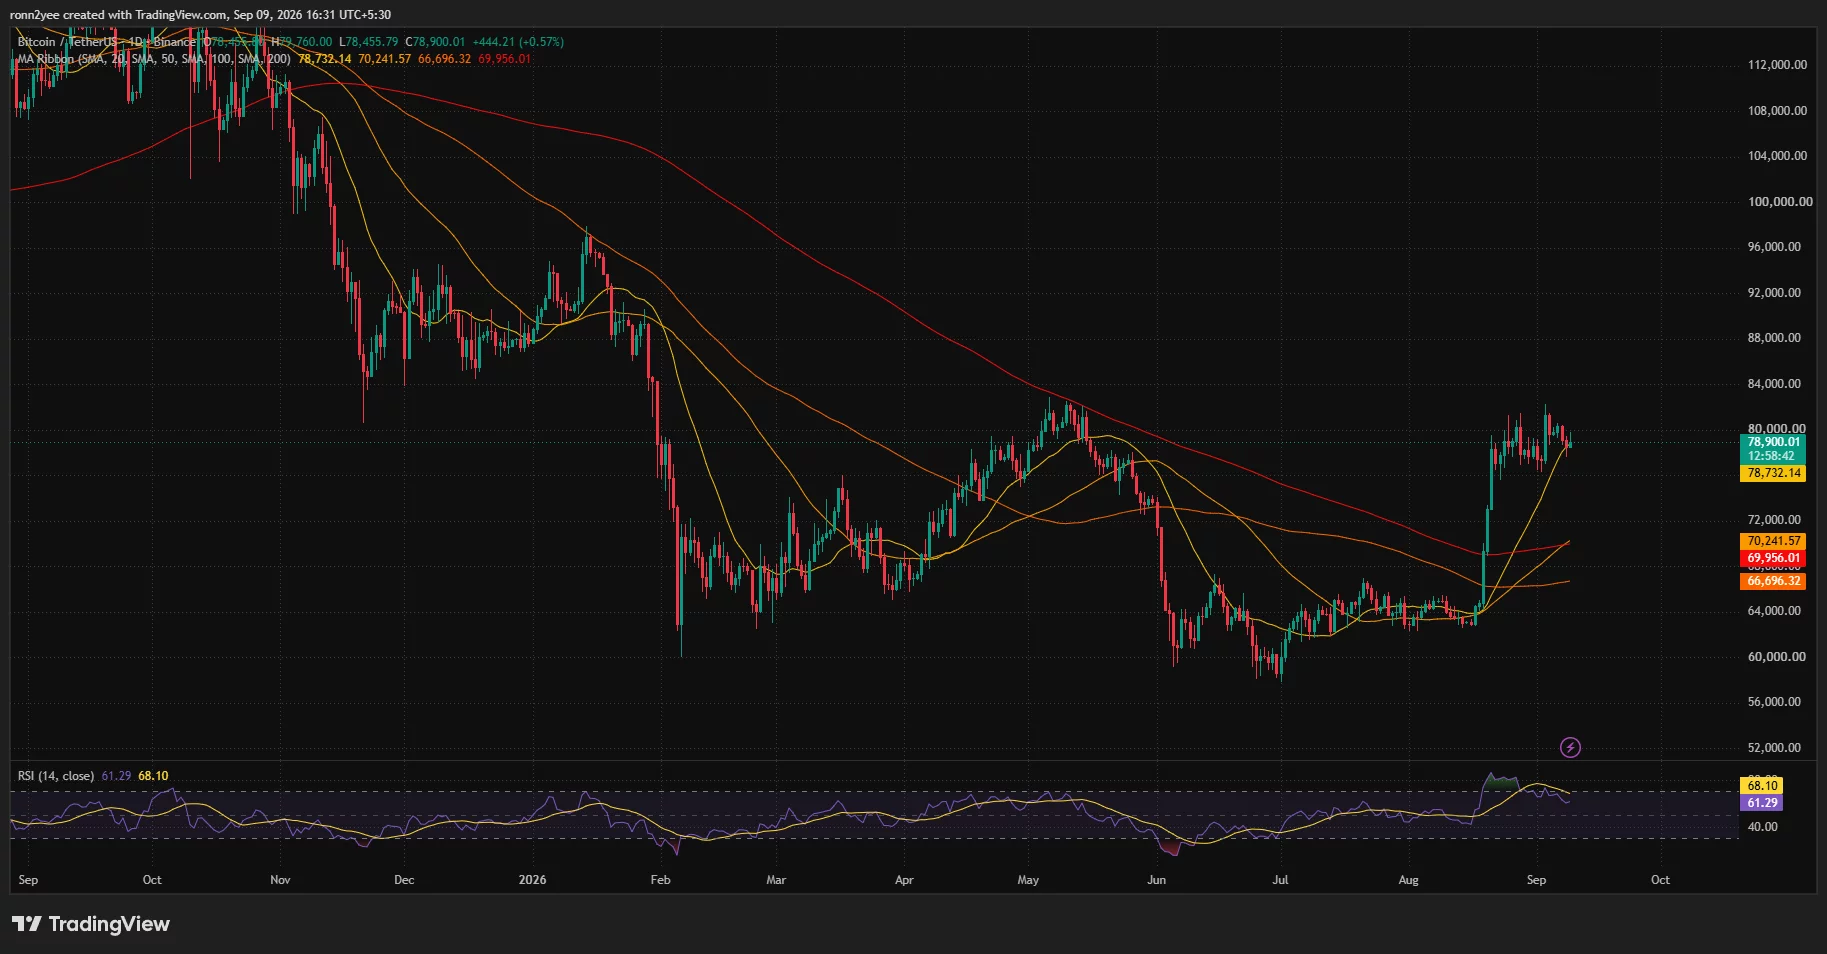

The 50-day, 100-day, and 200-day averages are grouped between approximately $66,700 and $70,000. Bitcoin’s position above those longer-term indicators shows that the larger recovery has not broken down, even as short-term momentum cools.
Daily relative strength has also weakened. The RSI stands at 61.29, down from recent highs and below its signal average of 68.10. The reading remains above the neutral 50 level, but the decline suggests buyers have lost some momentum since BTC tested $82,000.
4-hour indicators show weak momentum
Bitcoin’s 4-hour chart presents a less favorable picture. BTC is trading below the Bollinger Band midpoint at $79,187, which now acts as immediate resistance.
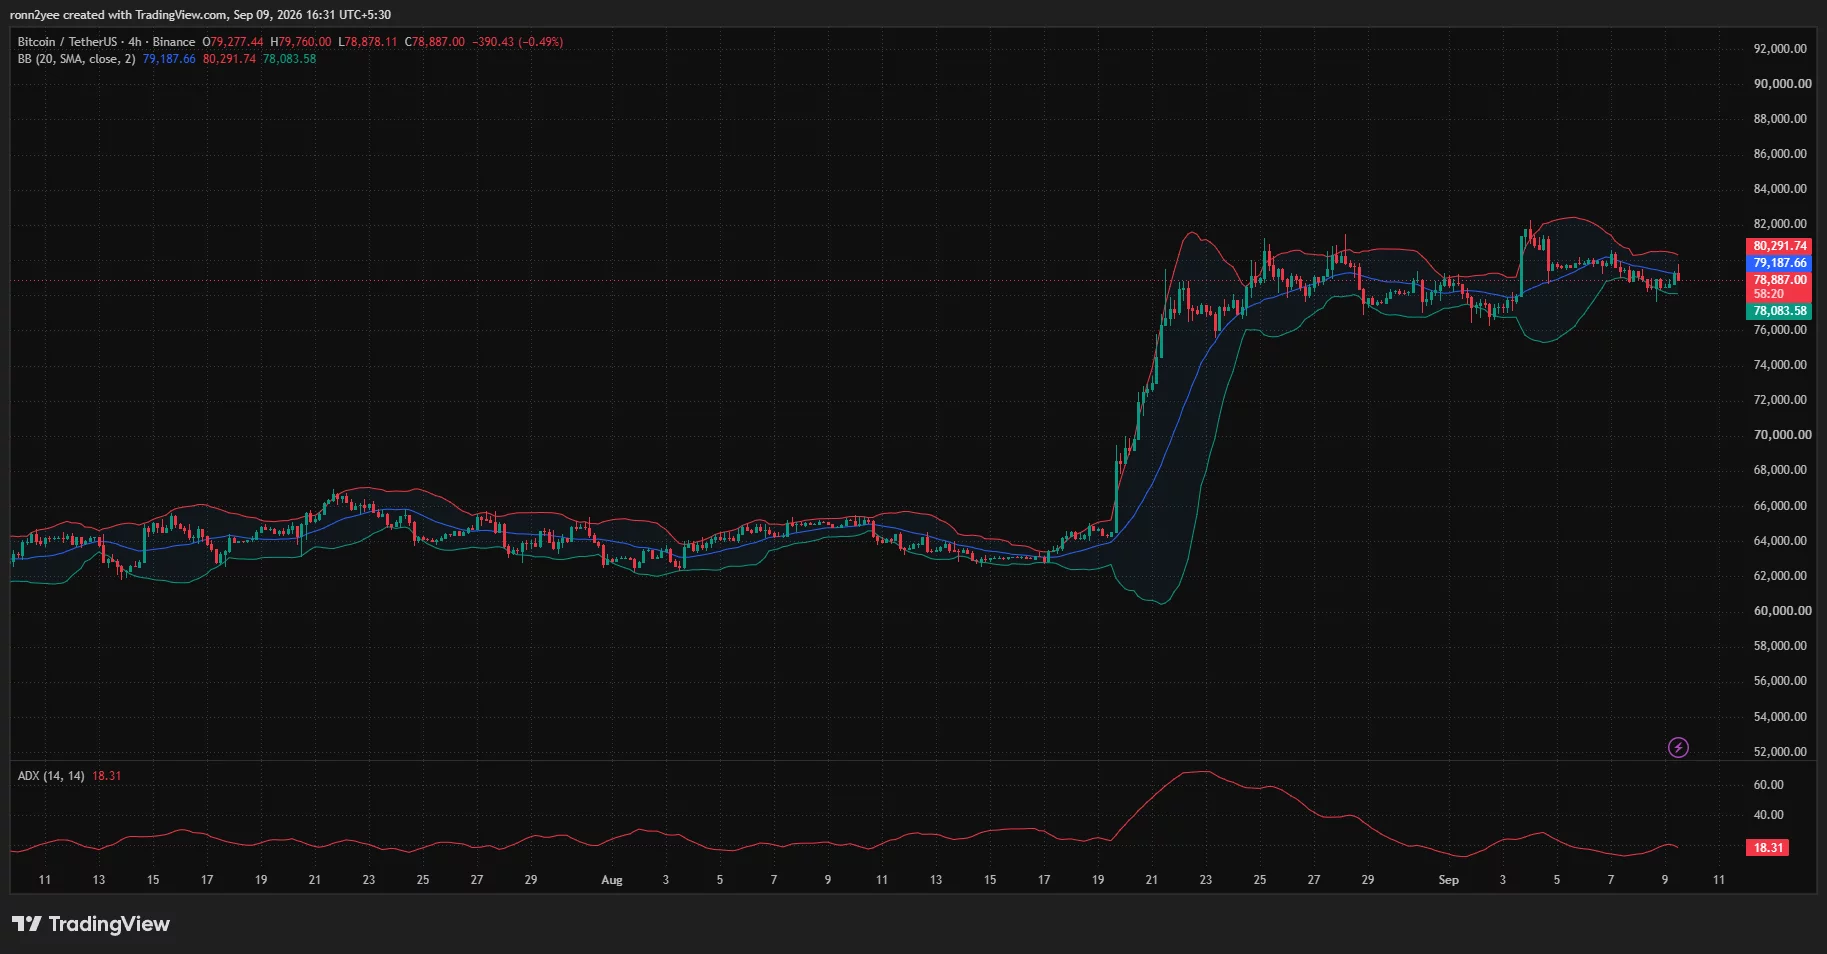
The upper band is near $80,292, while the lower band sits at approximately $78,084. Price has moved toward the bottom half of the range after repeatedly failing to establish support above the midpoint.
A break below the lower band could expose the intraday low around $78,450, followed by the psychological $78,000 level. Buyers would need to reclaim $79,200 before attempting another move toward the upper band and the $80,000 mark.
The average directional index stands at 18.31 on the 4-hour chart. ADX readings below 20 generally indicate that the market lacks a strong trend, which supports the possibility of further sideways movement before a larger breakout.
Low trend strength does not identify the direction of the next move. However, it can leave Bitcoin vulnerable to sudden volatility when the price reaches concentrated areas of leveraged positions.
Liquidation heatmap puts $77,000 and $80,000 in focus
CoinGlass’ 24-hour liquidation heatmap shows several liquidity bands around Bitcoin’s current price. The nearest concentrations above the market appear between approximately $79,200 and $80,000.

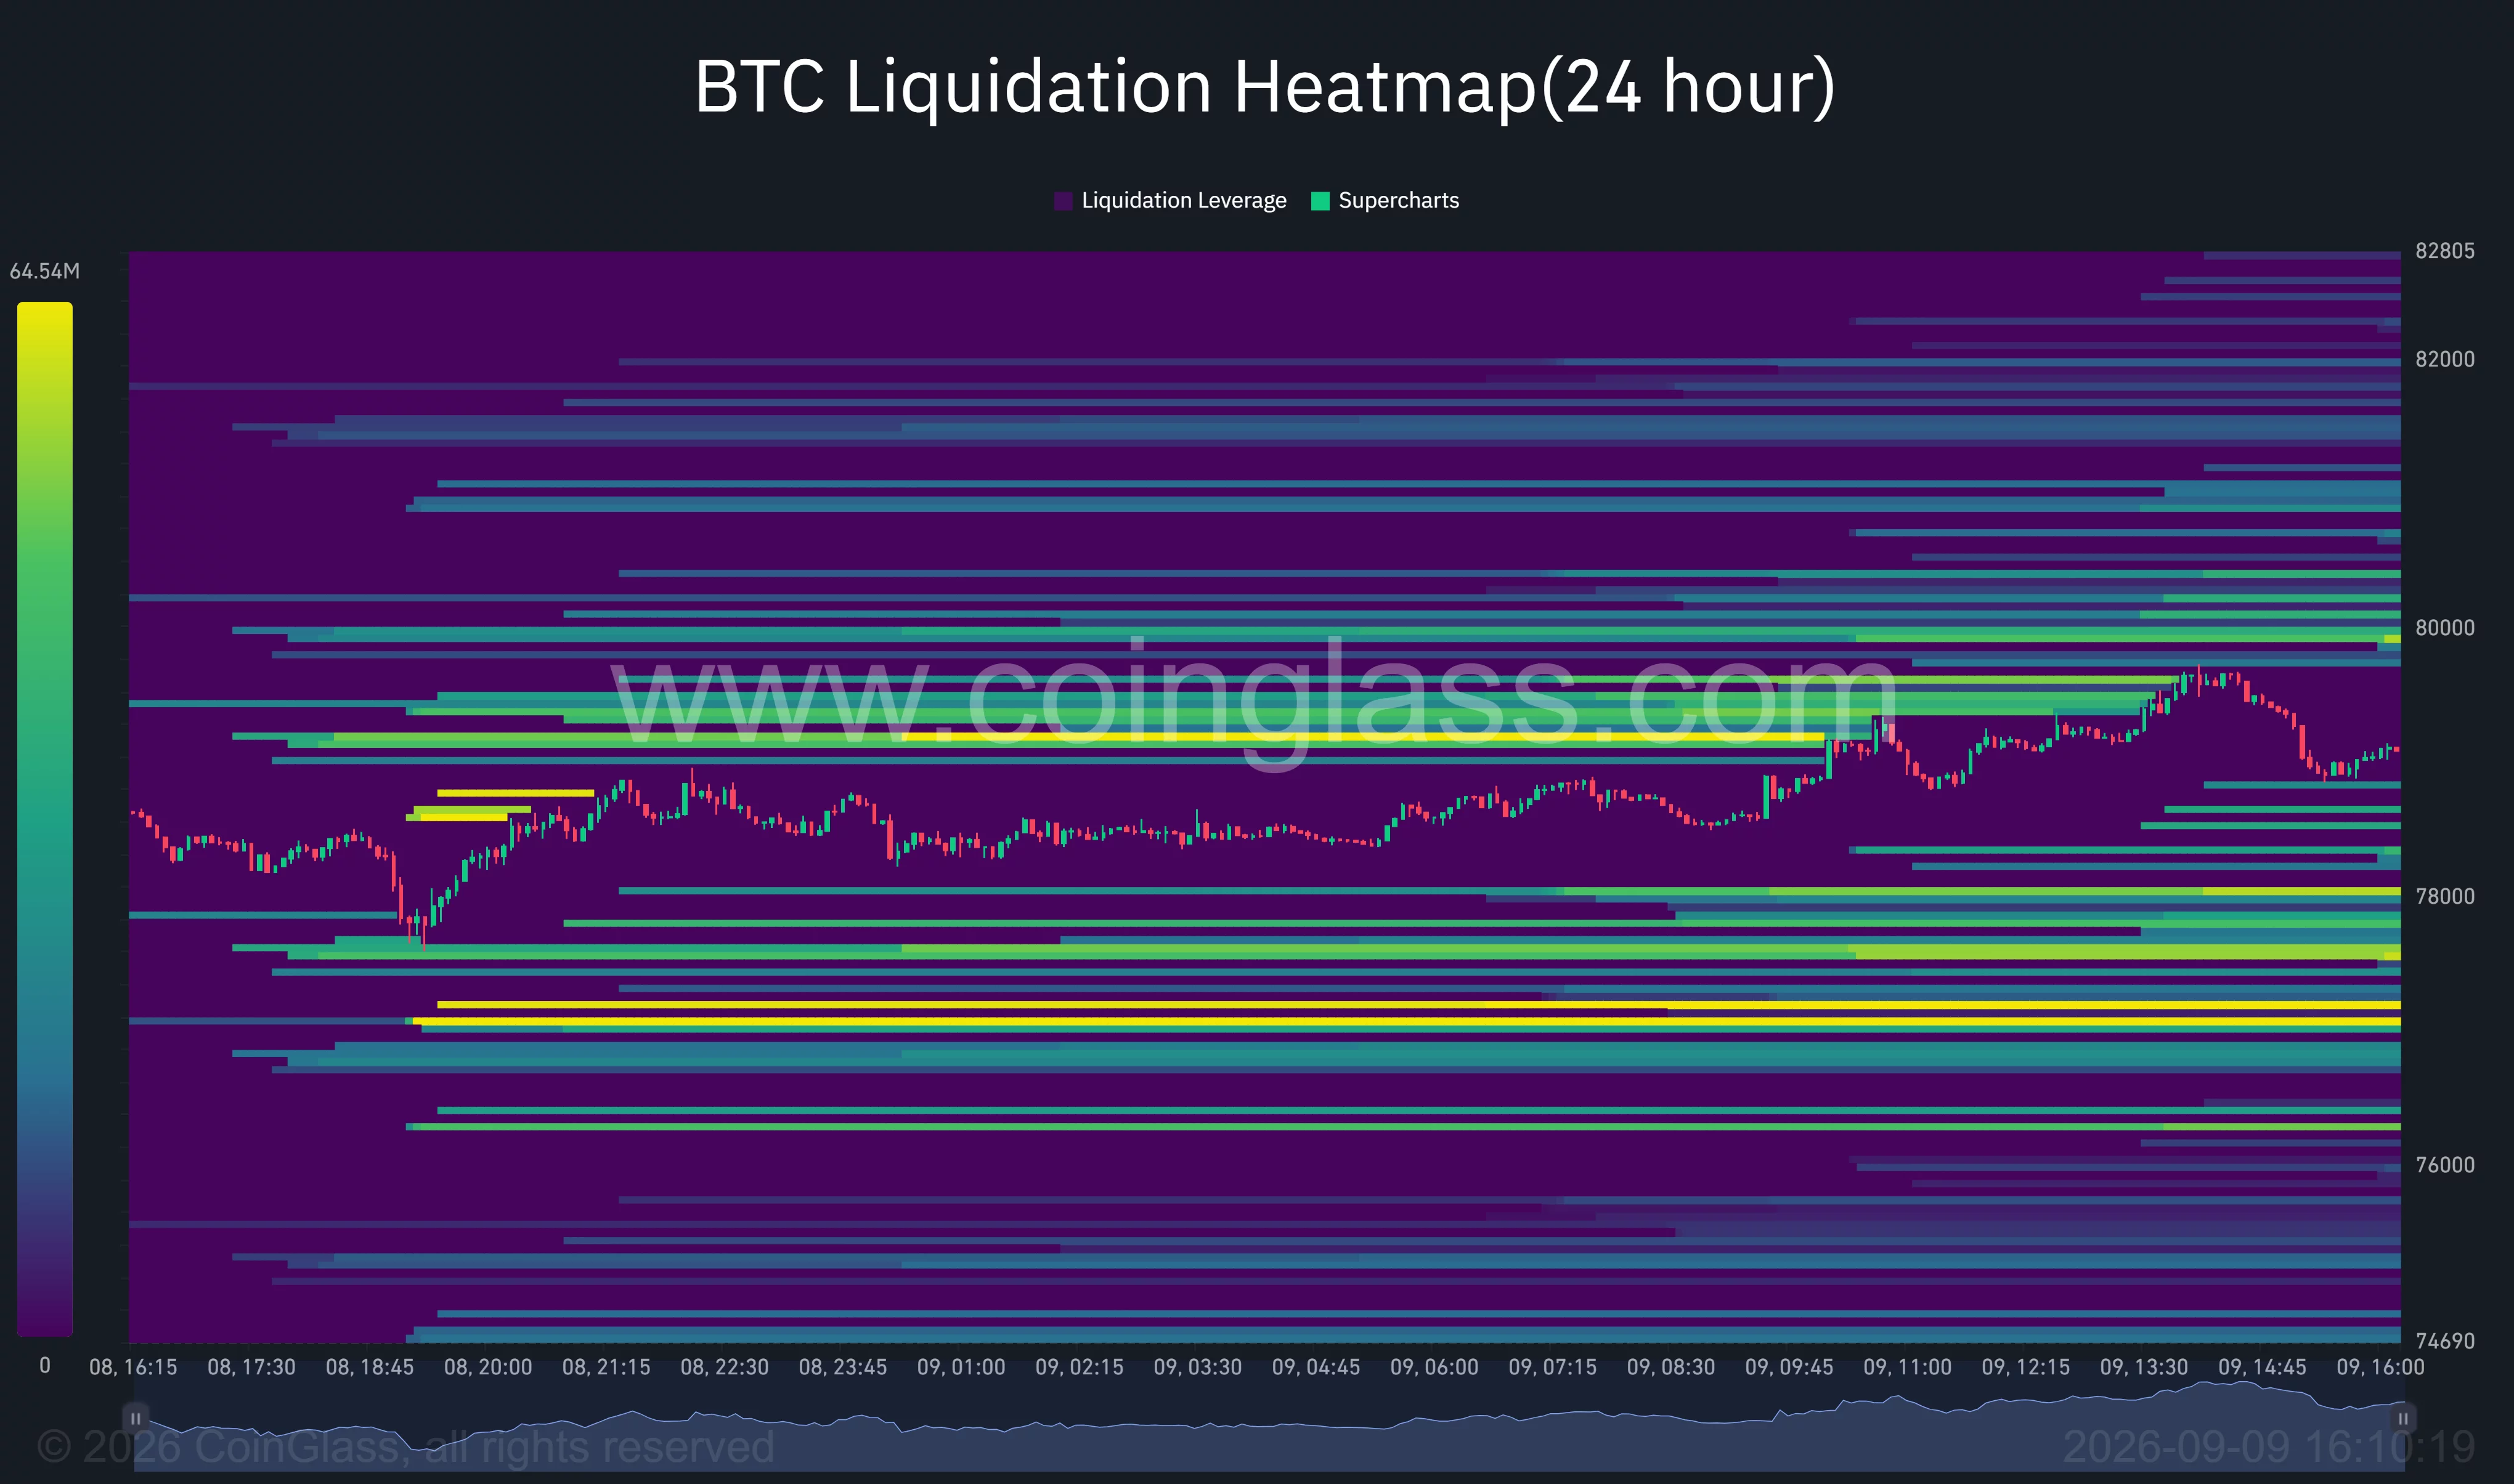
A move into that area could force leveraged short positions to close, adding buy pressure and helping BTC retest $80,300. Further liquidity is visible around $80,500 and between $81,500 and $82,000.
Liquidity is also stacked below the market. The heatmap shows a large concentration near $78,000, followed by a brighter and potentially larger band around $77,000.
A break below $78,000 could therefore trigger long liquidations and accelerate a fall toward $77,000. Additional liquidity appears near $76,300, making that level relevant if the $77,000 area fails.
Market commentator Whale Factor also pointed to a “tug of war” around $80,000, citing a separate 30-day liquidation map. The analyst noted that leveraged positions are concentrated both above and below Bitcoin, creating conditions for a cascade in either direction.
Bearish divergence raises risk of a $76K retest
Crypto analyst Gerla identified a bearish divergence between Bitcoin’s price and RSI. According to the analyst, BTC may still sweep the $82,000 region and form a higher high, but RSI has recorded lower highs at the market’s recent peaks.
A bearish divergence forms when price reaches higher highs while a momentum indicator moves lower. Traders often view the pattern as a warning that an advance is losing strength, though it does not confirm a reversal by itself.
Gerla said the bearish setup would activate only after a confirmed break below channel support near $76,000. A move above $84,000 would weaken the bearish view, according to the analyst.
The chart levels create three immediate scenarios. Holding $78,000 could keep Bitcoin inside its current range, while a recovery above $79,200 would put $80,000–$80,300 back in play. A daily or sustained 4-hour break below $78,000 would increase the chance of a liquidity-driven move toward $77,000 and then $76,000.
For US traders, Treasury yields and expectations for Federal Reserve policy remain important external factors. Higher yields can reduce demand for risk assets, while any shift in rate expectations could add volatility to Bitcoin’s densely positioned derivatives market.
Bitcoin is therefore caught between long-term technical support and fading short-term momentum. The next confirmed break outside the $78,000–$80,300 range could determine whether BTC revisits $82,000 or extends its correction toward $76,000.
Disclosure: This article does not represent investment advice. The content and materials featured on this page are for educational purposes only.
You must be logged in to post a comment Login