

Crypto World
Bitcoin Rebounds Off Yearly Lows But US Stocks Flash Warning Sign

Key takeaways:
- Surging spot Bitcoin ETF outflows and a put-heavy options expiry point to fading institutional demand.
- Risk-reward shifts toward tech stocks, leaving crypto traders to seek catalysts beyond macroeconomic tailwinds.
Bitcoin (BTC) traded down 9% in three days, hitting its lowest level since September 2024. The $58,000 retest triggered over $1 billion in liquidations across bullish BTC leveraged positions. Despite a modest recovery to $59,500, Bitcoin traders remain uneasy as the S&P 500 index and gold prices fully erased their intraday losses.
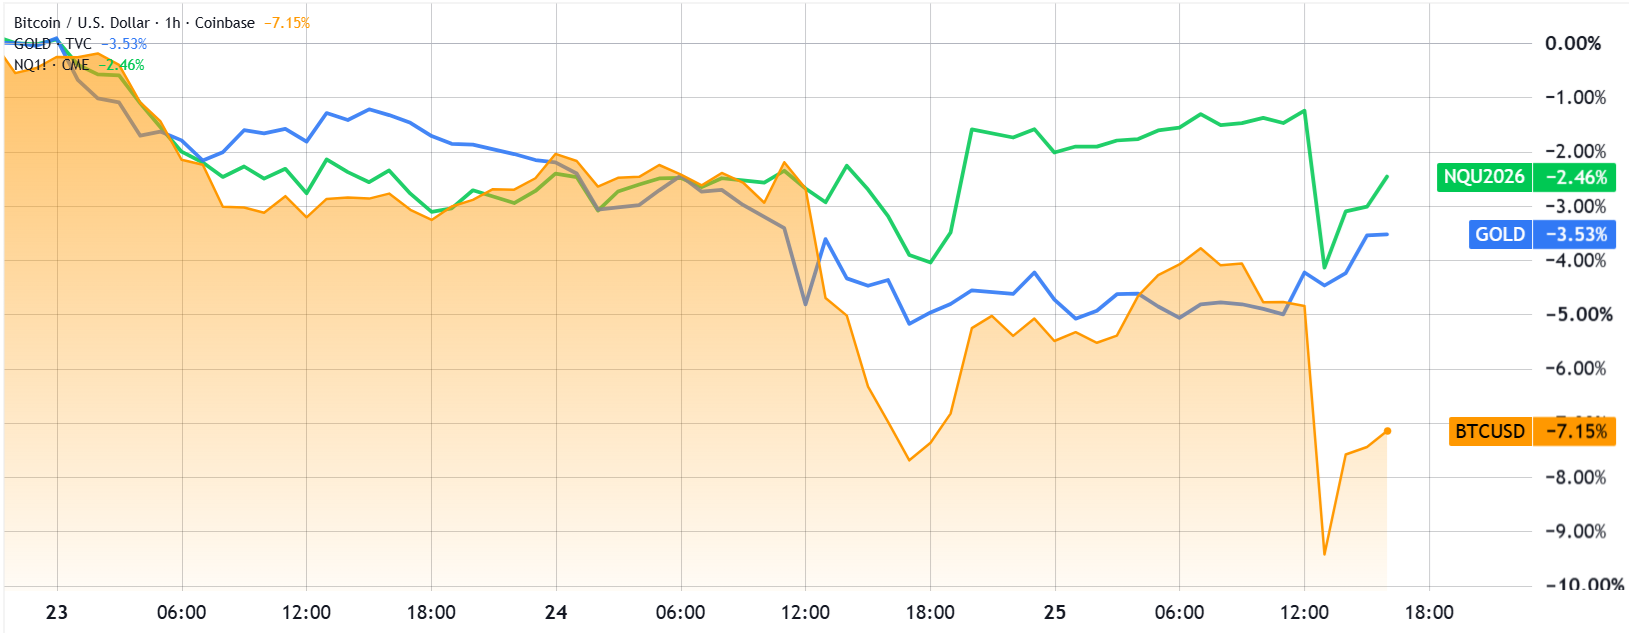
Bitcoin/USD (orange) vs. gold/USD & Nasdaq 100 futures (green). Source: TradingView
The market downturn on Thursday lined up with the release of the US Personal Consumption Expenditures index, which showed a 4.1% increase in May from the prior year. Yet as Crude Brent oil prices pulled back to $75 from $95 just one month earlier, investors grew more confident that inflation had peaked. As a result, the cash freed up by lower energy costs is boosting the stock market.
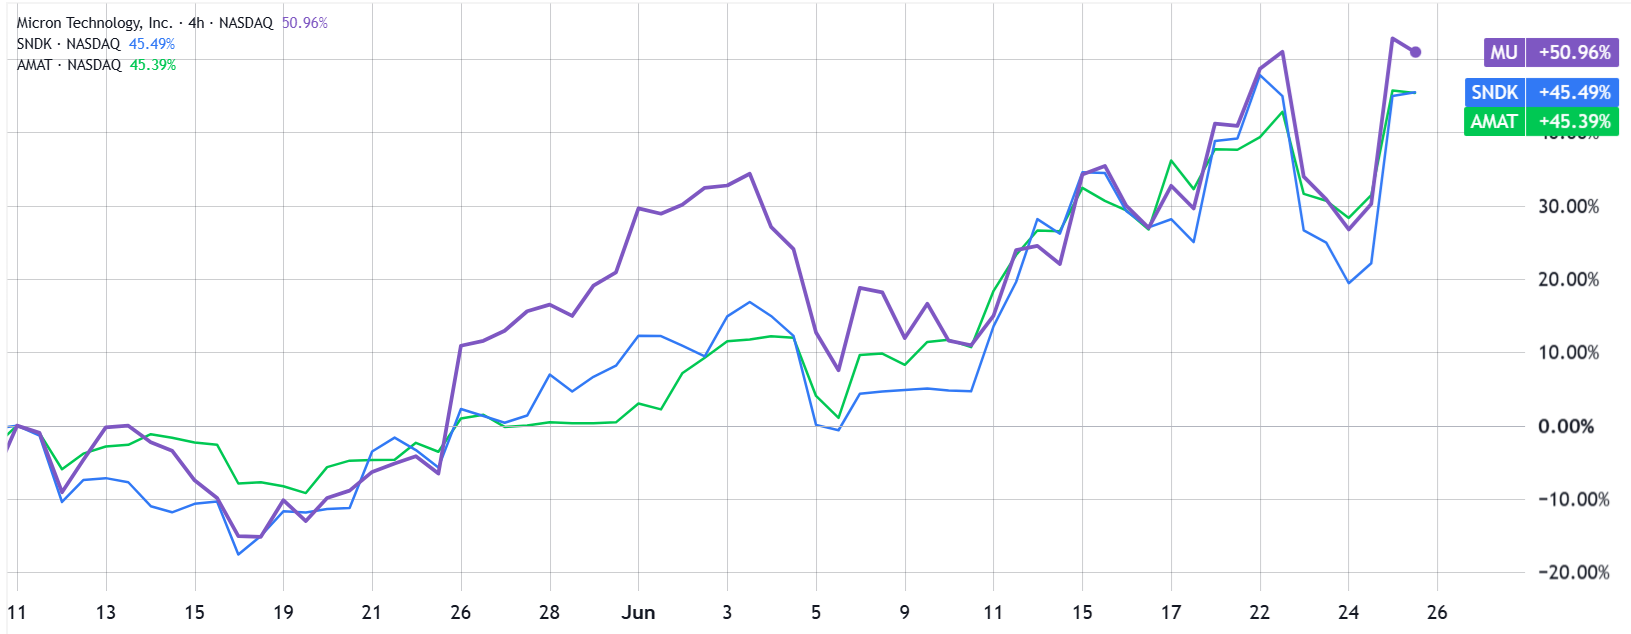
Shares of Micron, Sandisk, Applied Materials. Source: TradingView
The tech sector kept delivering strong surprises, with Micron Technology (MU) jumping 16% after solid quarterly earnings and Sandisk (SNDK) riding along with an 18% gain. Applied Materials (AMAT) rose 10% thanks to its new chipmaking tools. Investors’ renewed faith in the sector also mirrors the US government administration’s recent emphasis.
Fixed income offers a more compelling hedge alternative
Even if Bitcoin does not directly compete with the artificial intelligence sector, traders’ risk-reward views have likely tilted toward stocks. This shift followed the US government taking a 9.9% stake in Intel, proposing $2 billion for quantum computing firms, opening federal lands for data center projects, and setting a framework for “frontier models” releases.
Investors worried about inflated AI valuations after Elon Musk’s SpaceX (SPCX) shares fell 32% from their peak can find comfort in 5-year US Treasuries yielding 4.15%. Demand for non-yielding assets like Bitcoin faded as traders now see an 80% chance of US interest rate hikes by December, up from 68% a month ago, according to the CME FedWatch Tool.
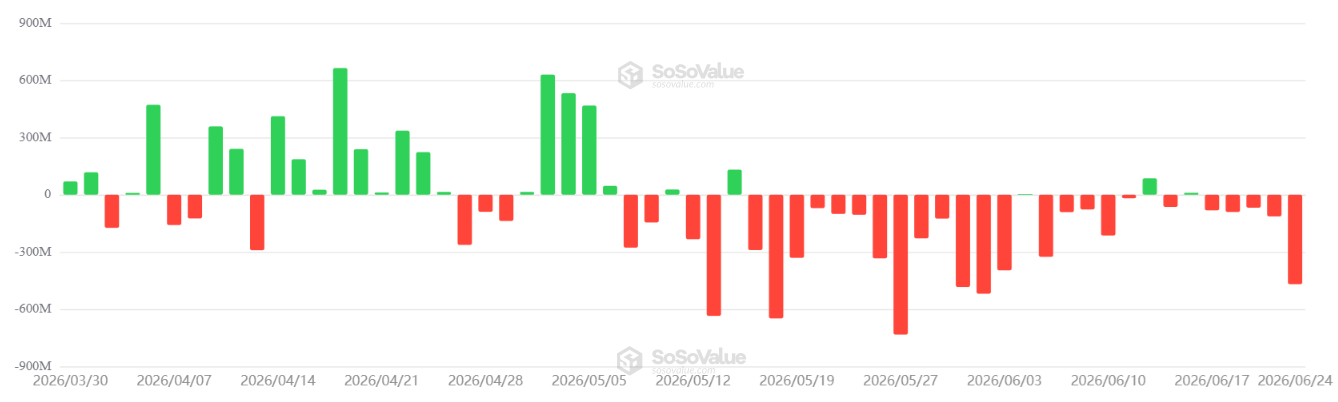
US-listed spot Bitcoin ETFs daily net flows, USD. Source: SoSoValue
Bitcoin’s appeal also took a hit from the massive $469 million net outflows in spot BTC exchange-traded funds (ETFs) on Wednesday. The metric serves as a key proxy for institutional demand. Sentiment worsened further as Strategy (MSTR) now sits on a huge unrealized loss after buying $64.1 billion worth of Bitcoin since 2020.
Related: 21shares trims 2026 crypto forecasts despite institutional adoption gains
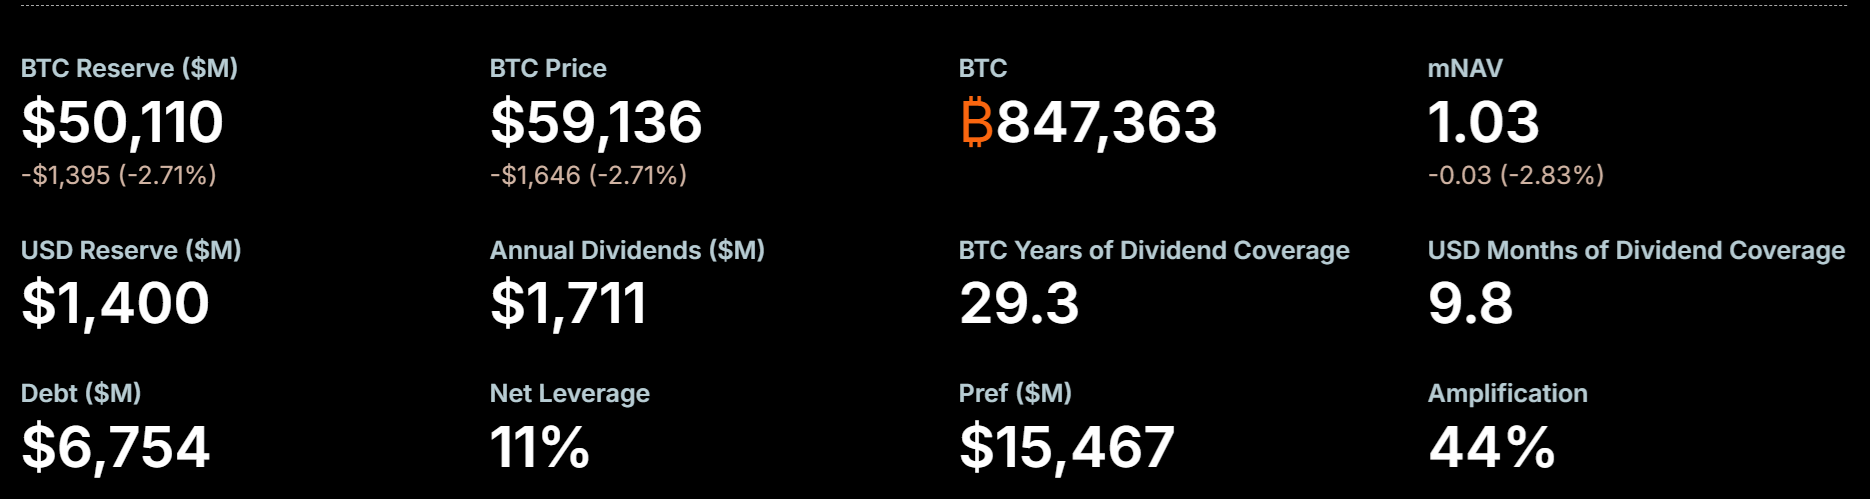
Strategy (MSTR) Bitcoin reserves and cash position, USD. Source: Strategy
The upcoming $13 billion Bitcoin options expiry on Friday heavily favors put (sell) instruments. Most neutral-to-bullish strategies will likely expire worthless, since 78% of call (buy) options are priced at $72,000 or above. Put options open interest on Deribit will exceed call options by $3.4 billion.
Bitcoin’s price momentum shows little tie to stocks due to heavy ETF outflows, a bearish options expiry skew and Strategy’s mounting unrealized losses. Bitcoin traders must now hunt for unique catalysts beyond equity market tailwinds to spark a turnaround.


Decentralized cloud storage provider Storj Labs has filed for Chapter 11 bankruptcy protection. The company said it plans to keep its network running while restructuring legacy liabilities and exploring an ownership pathway for STORJ tokenholders.
On Sunday, Storj said it filed the voluntary case in the US Bankruptcy Court for the Northern District of West Virginia. The company said ordinary operations and customer services would continue during the process, subject to court oversight, while its parent company, Inveniam, would continue to support the business.
The restructuring could become an unusual test of whether utility-token holders can participate in the ownership of a company emerging from bankruptcy.
In an open letter to its community, Storj said its liabilities largely predate its current strategy and are too substantial to resolve through business growth alone. It said the network continues to operate normally and its token’s utility is unchanged.
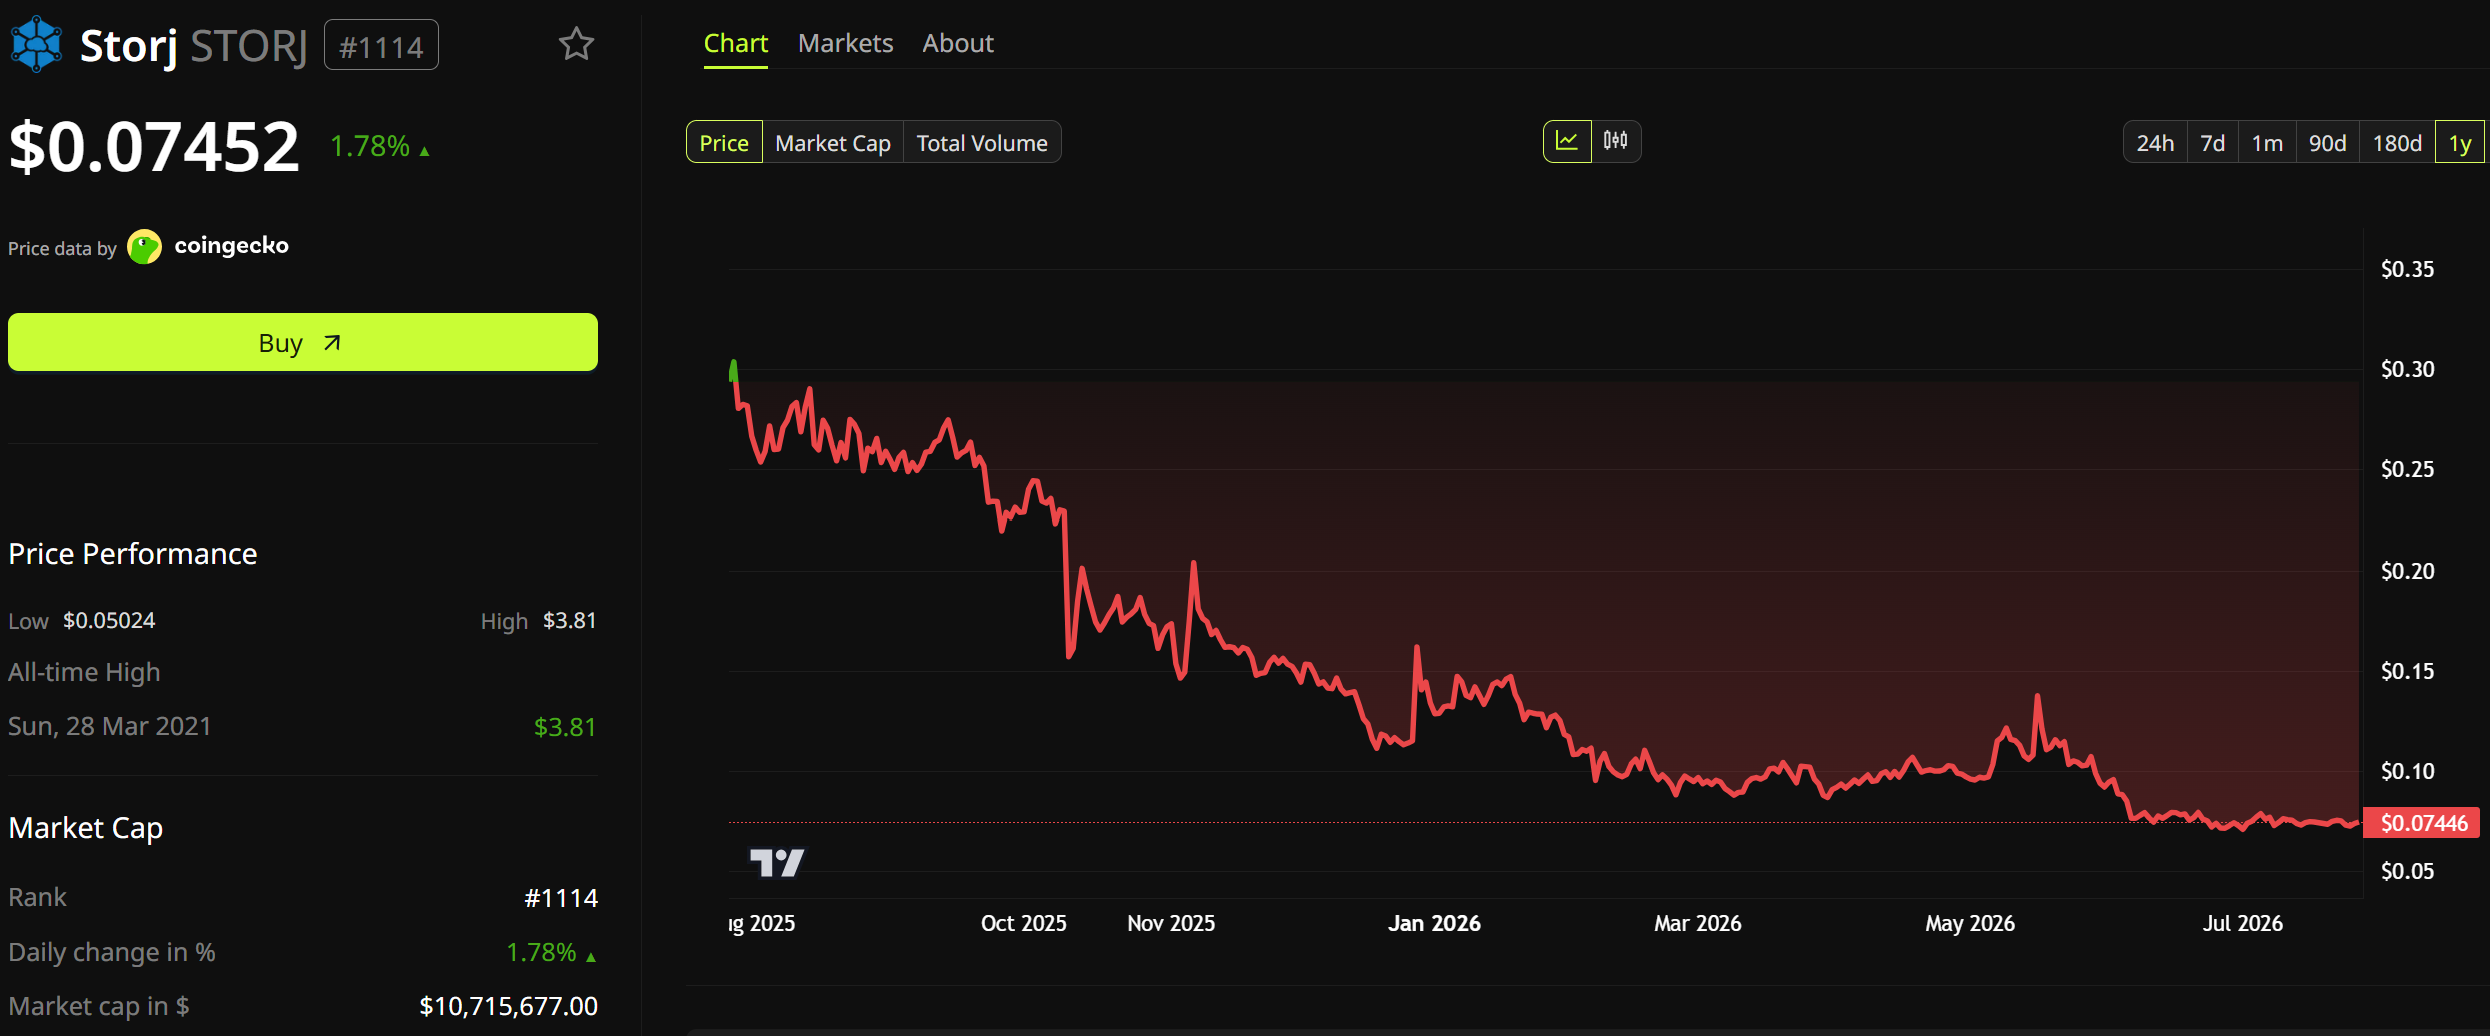
STORJ showed no significant immediate price reaction following the announcement, trading around $0.072 at the time of writing, according to CoinGecko.
Storj explores equity pathway for tokenholders
Storj said management intends to propose a mechanism allowing tokenholders to participate in the reorganized company’s equity.
However, Storj has not disclosed how tokenholder eligibility would be determined, whether participation would involve a token snapshot or lockup, or how much equity might be allocated. The company acknowledged that any plan must follow bankruptcy priorities and receive court approval.
Cointelegraph reached out to Storj for comment but did not receive a response before publication.
Storj is among the crypto industry’s longest-running decentralized infrastructure projects. Storj began in 2014 as an open-source peer-to-peer cloud storage project that sought to let users rent storage from other network participants rather than rely on centralized providers.
Related: BitMEX hit with 623 BTC lawsuit on day it announces shutdown
Storj’s bankruptcy filing comes in the same month as at least two other crypto companies sought Chapter 11 protection.
Movement Labs filed under Subchapter V on July 15 after months of turmoil linked to its MOVE token, while Bitcoin mining pool Poolin filed on July 22 as it pursued a court-supervised sale of two Texas mining sites.
BitMEX also announced in July that it would shut down after 11 years. Still, the derivatives exchange did not file for bankruptcy, instead opting for an orderly wind-down following a strategic review.
Magazine: CLARITY hopes fade, BitMEX shuts as lawsuit looms: Hodler’s Digest
With the August recess deadline closing in, U.S. lawmakers are still negotiating the Clarity Act—an ethics-focused proposal tied to digital asset activity that would also restrict officials from issuing or sponsoring crypto. Senate Majority Leader John Thune has signaled skepticism that there are enough votes for passage, but said a floor vote could still be pursued to “get Clarity started” and test support.
The bill is also at the center of a deeper political struggle over enforcement. Democrats want ethics rules to be enforced by state attorneys general, while the White House and Republicans have advanced an approach that hinges on the federal Attorney General—an official appointed by President Trump. The dispute, along with provisions that Democrats criticize as giving the President special leeway, is leaving the legislation in limbo even as industry and law enforcement groups begin to line up behind the latest version.
Key takeaways
- Clarity Act momentum depends less on technical drafting and more on whether lawmakers can reconcile a major enforcement disagreement and the scope of presidential exceptions.
- Senate Majority Leader John Thune doubts the bill has the votes for passage, but may still move toward a vote to gauge support.
- Institutional backers—including Fidelity and Charles Schwab, and a statement of support from Goldman Sachs CEO David Solomon—suggest the bill remains attractive to parts of traditional finance despite imperfections.
- Outside politics, crypto infrastructure news continues with BitMEX announcing it will shut down operations in September after 11 years, while S&P Dow Jones and Pantera launch an institutional digital asset benchmark index that excludes Bitcoin and XRP.
Clarity Act: ethics rules collide with enforcement politics
At the heart of the Clarity Act negotiations is a proposed ethics deal that would bar U.S. officials from issuing or sponsoring digital assets. However, the plan also includes exceptions Democrats say amount to a “get out of jail free” arrangement for the President. One sticking point raised in reporting is that certain rules would expire on the day President Trump is scheduled to leave office in 2029—an element that has been criticized as undermining the durability of the restrictions.
The enforcement mechanism is another major fault line. The ethics provisions would be administered by the Attorney General appointed by Trump, but Democrats have pushed for state attorneys general to enforce the rules instead. That expansion would create a broader enforcement footprint across jurisdictions—something Republicans and the White House appear unlikely to support, especially given the likelihood that the President would resist changes that empower many independent state-level prosecutors.
According to Cointelegraph, Senate Majority Leader John Thune does not believe the bill has enough votes to pass yet. Still, he indicated he may bring it to the floor to “get Clarity started” and determine where the remaining votes stand as the August recess deadline nears.
Support from institutions and law enforcement—while trust remains strained
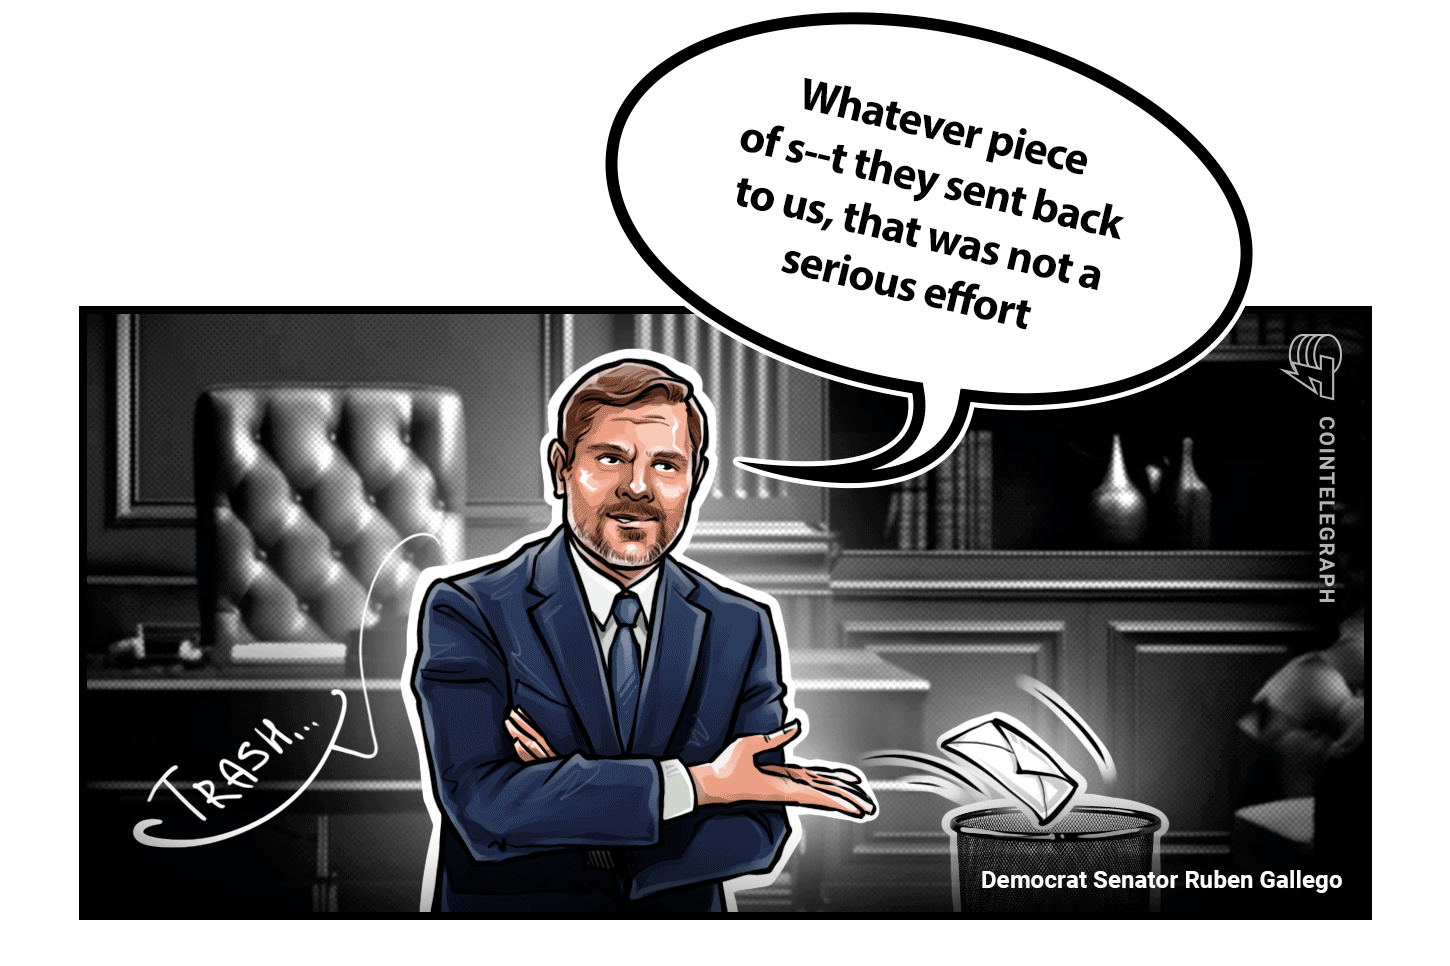
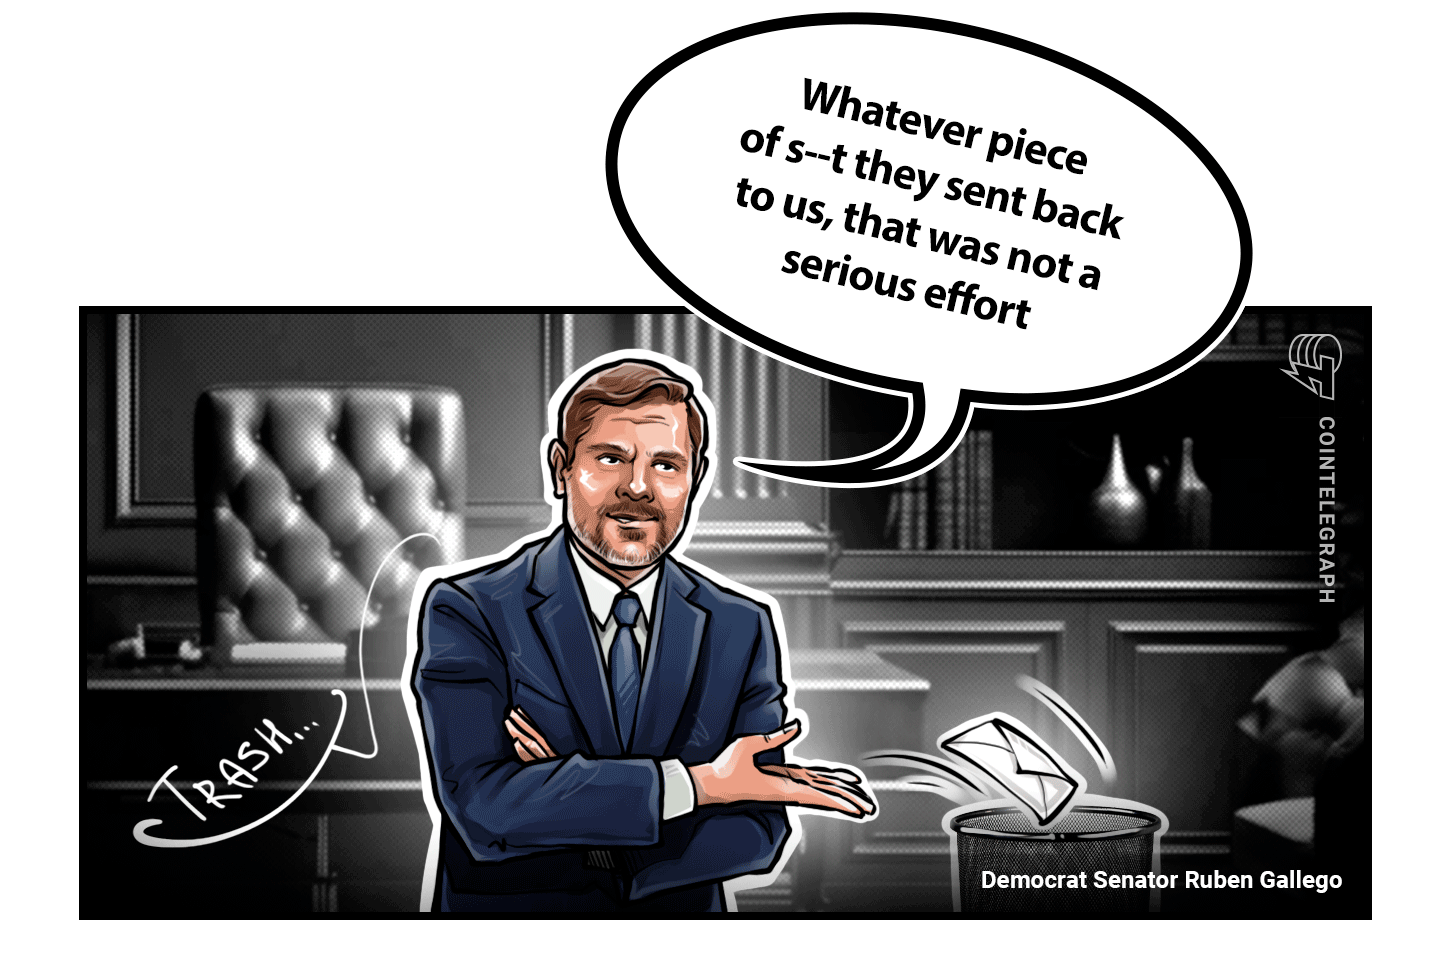
While political factions remain divided, signals of support from outside government have started to build. The White House described the bill as the “most comprehensive and wide-ranging ethics provision in history,” while Democratic Senator Ruben Gallego characterized it with unusually blunt language, calling it neither serious nor acceptable. Negotiations are reportedly continuing in an effort to find wording that both sides can accept.
Financial institutions have also weighed in. Goldman Sachs CEO David Solomon acknowledged the proposal is “not perfect,” but still supported it. Cointelegraph also reported that Fidelity and Charles Schwab have backed the initiative. Taken together, these endorsements suggest the bill’s advocates see it as a workable baseline for reducing perceived conflicts—particularly for firms that want clearer conduct expectations involving digital assets.
Law enforcement signals have been another ingredient. The National Fraternal Order of Police said the latest version of the BRCA—described as protecting developers of decentralized protocols—would not impede investigations into money laundering and fraud. That point matters for the bill’s political sell: proponents want ethics restrictions to target conflicts of interest without unintentionally constraining legitimate enforcement activity.
Still, the level of distrust between parties appears to be the dominant constraint. Negotiators may be able to close gaps on implementation details, but the bill’s most consequential disagreements—presidential exceptions and who can enforce the rules—go to the core of each side’s incentives.
What the odds say—and what to watch next
Market odds also reflect uncertainty. According to Polymarket, the odds of the Clarity Act passing this year are currently 38%. Even if a floor vote is scheduled, that number implies the bill could still face serious headwinds, particularly if negotiations fail to produce a package that enough senators can defend publicly.
Investors and market participants should watch for two developments in the near term: whether the enforcement framework shifts meaningfully toward a multi-enforcer model, and whether the presidential exception provisions remain intact or are narrowed. Those items likely determine whether additional lawmakers feel comfortable turning a political compromise into a concrete vote.
BitMEX to shut down, highlighting consolidation in derivatives trading
Elsewhere in crypto policy and markets, BitMEX—one of the early pioneers of crypto derivatives trading—announced it will shut down operations in September after 11 years. BitMEX launched in 2014 and gained notoriety for introducing 100x leverage perpetual swaps.
But in recent years, volumes fell as competition intensified, with major centralized exchanges such as Binance and fast-growing decentralized venues like Hyperliquid taking share. CryptoQuant CEO Ki Young Ju said BitMEX’s share of the Bitcoin futures market has dropped to 0.08%, with about $84 million in daily trading volume.
Ju described the closure as an industry “torch” moment—an exchange that helped shape the market now stepping aside for the next wave it inspired. Cointelegraph also reported that BitMEX’s utility token, BMEX, fell sharply after the shutdown announcement. The same day, a class action lawsuit surfaced alleging that BitMEX fraudulently engineered liquidations to seize trader collateral. BitMEX denied the accusations and said it previously defended itself successfully against similar claims.
Analysts tied the shutdown to broader structural changes. Cointelegraph reported restructuring adviser Roshan Dharia saying BitMEX’s demise reflects accelerated consolidation. A quoted passage highlighted that the top five platforms control an estimated 80% of global spot volume, squeezing mid-tier operators as structural headwinds—rather than temporary cycles—reduce margins and limit scaling pathways.
That consolidation narrative continued quickly: Cointelegraph also reported that BitMart later announced it would close in the coming months, underscoring how pressure is spreading across crypto venues rather than concentrating on a single platform.
Institutional benchmarks expand: S&P and Pantera launch a crypto index
Index providers are also moving deeper into digital assets. S&P Dow Jones Indices and Pantera Capital launched the S&P Pantera Digital Asset Index, positioned as an institutional benchmark that tracks major crypto assets but excludes Bitcoin and XRP.
According to Cointelegraph, the index is designed to serve institutions by filtering blockchains based on minimum thresholds for protocol revenue, market capitalization, and liquidity. The index launched with 18 constituents. Ether (ETH), BNB (BNB), Solana (SOL), TRON (TRX), and Hyperliquid (HYPE) make up the five largest holdings, while Bitcoin (BTC) and XRP remain the largest non-constituents.
The effort fits a broader industry push for institutional-grade benchmarks. Cointelegraph cited related products such as the Nasdaq Crypto Index US ETF, a Franklin Crypto Index ETF, and a Coinbase Store of Value Index—signaling that tradfi-style benchmarking continues to shift from concept to increasingly concrete infrastructure.
Robinhood prediction markets grow as regulators focus on event contract specificity
On the U.S. consumer-facing side, Robinhood is reportedly discussing an expansion of its prediction markets business by integrating yes-or-no event contracts supplied by Crypto.com. Cointelegraph noted that Robinhood began prediction markets in March 2025, initially facilitated by Kalshi to satisfy compliance requirements from the U.S. Commodity Futures Trading Commission (CFTC).
At the same time, regulatory scrutiny is intensifying around how event contracts are certified. Cointelegraph reported that the CFTC issued another warning that platforms must be more specific rather than relying on broad template-style certifications covering multiple potential variations of events. The regulatory push matters because it can constrain how quickly providers scale new contract templates or broaden the range of covered scenarios.
Cointelegraph also referenced legal commentary linking potential clarity on market structure oversight to the Clarity Act, framing the ethics legislation as possibly supportive of the CFTC’s ability to monitor prediction market growth.
Across governance, exchanges, and benchmarks, the throughline is clear: crypto is entering a phase where regulation, institutional infrastructure, and market structure pressures are reshaping outcomes. For the Clarity Act specifically, the next signals to monitor are whether negotiations produce a durable enforcement compromise and whether senators are willing to translate that compromise into votes before the August recess deadline.
Clarity may get a vote, but don’t get your hopes up yet
Despite wealthy memecoin entrepreneur Donald Trump agreeing to an ethics deal, the Clarity Act is floundering as the August recess deadline looms.
Senate Majority Leader John Thune doesn’t believe the Act has the votes to pass just yet, but may bring it to a vote anyway to “get Clarity started. We’ll see where the votes are.”
The ethics deal would prohibit all US officials from issuing or sponsoring digital assets, but contains some “get out of jail free” provisions for the President that the Democrats are unhappy with, including the fact the rules expire the day he is scheduled to leave office in 2029.
The ethics provisions will also be enforced by the Attorney General that Trump appointed. The Democrats instead want state Attorney Generals to enforce it — but Trump seems unlikely to agree to empower dozens of state AGs to attempt to prosecute him.
The White House described the bill as the “most comprehensive and wide-ranging ethics provision in history,” while Democratic Senator Ruben Gallego described it as a “piece of shit” and “not a serious effort.”
Negotiations are continuing to find a deal both sides can live with, but given the lack of trust, it’s not going to be easy to find a compromise.
Goldman Sachs CEO David Solomon conceded the bill is “not perfect” but has supported it anyway, along with Fidelity and Charles Schwab who represent many trillions in assets under management each.
Law enforcement organizations have also begun to signal support, with The National Fraternal Order of Police representing hundreds of thousands of members, stating the latest version of the BRCA (which protects developers of decentralized protocols) would not impede investigations into money laundering and fraud.
The odds of the bill passing this year are at 38% on Polymarket.

BitMEX to shut down after 11 years as class action launched against it
BitMEX, one of the pioneers of cryptocurrency derivatives trading, announced it will shut down operations in September after 11 years.
BitMEX launched in 2014 and became known for introducing the 100x leverage perpetual swaps.
In recent years volumes have tanked increased competition from major exchanges like Binance and decentralized protocols like Hyperliquid.
CryptoQuant CEO Ki Young Ju said BitMEX’s share of the Bitcoin futures market has fallen to just 0.08%, with roughly $84 million in daily trading volume.
“It was a great exchange that helped shape the industry, and now it is passing the torch to the next generation of exchanges it inspired,” Ju said.
BitMEX’s utility token BMEX collapsed in value after the announcement. That same day, news emerged of a class action lawsuit accusing the crypto derivatives platform of fraudulently engineering customer liquidations to seize traders’ collateral. BitMEX denied the allegations and said it had successfully defended itself against similar claims in the past.
Restructuring adviser Roshan Dharia told Cointelegraph the exchange’s demise shows the industry is consolidating.
The top five platforms now control an estimated 80% of global spot volume, leaving mid-tier and regional exchanges with shrinking margins and no viable path to scale… The headwinds are structural, not cyclical.
As if to undescore the point, BitMart subsequently announced it would also close in the coming months.

S&P launches blockchain fundamentals index for digital assets
S&P Dow Jones Indices and Pantera Capital have launched a digital asset index that tracks the major crypto assets — but doesn’t include Bitcoin or XRP.
The S&P Pantera Digital Asset Index is designed to be the benchmark crypto index for institutions, but it screens out blockchains based on minimum thresholds for protocol revenue, market capitalization and liquidity.
The index launched with 18 constituents, with Ether (ETH), BNB (BNB), Solana (SOL), TRON (TRX) and Hyperliquid (HYPE) as its five largest holdings, while Bitcoin (BTC) and XRP (XRP) are the largest non-constituents.
The latest index follows a broader industry push to develop institutional-grade benchmarks for digital assets, with similar products including the Nasdaq Crypto Index US ETF, the Franklin Crypto Index ETF and the the Coinbase Store of Value Index among others.
Robinhood to expand prediction markets as CFTC issues new warning
Robinhood is reportedly discussing plans to expand its existing prediction markets offerings with crypto exchange Crypto.com.
According the Wall Street Journal the talks involve integrating yes-or-no event contracts supplied by Crypto.com. Robinhood launched its prediction markets in March 2025, initially facilitated by Kalshi in order to comply with regulatory requirements from the US Commodity Futures Trading Commission (CFTC).
Bernstein analysts last week raised its price target on Robinhood (HOOD) stock to $160 from $130 per share, based on the company’s outlook for prediction markets and tokenized equities.
Meanwhile the CFTC, which aims to become the primary regulator of prediction markets, issued a shot across the bow of providers last week, telling platforms they need to get a lot more specific about event contracts certifications.
The advisory addresses concerns about the practice of submitting broad, template-style certifications that combine many potential event contract variations into a single certification.
Carl Kennedy, a partner at New York law firm Katten Muchin, also told a House Agriculture Committee hearing last week, that the CLARITY Act could help the CFTC’s efforts to oversee the “explosive growth of prediction markets.”
Balaji’s Network School turns to Kazakhstan amid Malaysia setback
Balaji Srinivasan’s Network School, a community of “digital nomads,” is eyeing a new campus in Kazakhstan after its Forest City campus had its business license in Malaysia revoked over alleged premises-use violations.
A memorandum of understanding was signed between Kazakhstan’s relevant Minister Zhaslan Madiyev and Srinivasan to establish the first Network School campus in the country, which aims to become a digital hub.
The School was forced out of Johor in Malaysia, following a controversy in Malaysia over allowing Israeli dual citizens to attend. The Muslim majority country has no diplomatic relations with Israel. Despite an investigation finding no visa violations, the Network School was ordered to shut down on another pretext.
Dragonfly Capital managing partner Haseeb Qureshi said the drama has validated Balaji’s Network State thesis.
“The whole idea of a network state is taking a dense group of talent and capital, and collectively negotiating with states. The Malaysia drama set up Balaji to negotiate better terms with another state to copy and paste the network there.“

Winners and losers
At the end of the week, Bitcoin (BTC) is at $65,395, Ether (ETH) is at $1,958, and XRP (XRP) is at $1.11. The total market cap is at $2.24 trillion according to CoinMarketCap.
Among the biggest 100 cryptocurrencies, the top three altcoin winners of the week are Audiera (BEAT), which gained 53%, Shinba Inu (SHIB) with a 29% gain, and Venice Token (VVV), which increased 19%.
The top three altcoin losers of the week are DeXe (DEXE), which lost 89%, Midnight (NIGHT), which fell 26%, and Pyth Network (PYTH), which dropped 10%.
Prediction of the Week
Bitcoin will get ‘lift’ from Hyperliquid, Robinhood in next crypto bull market
Bitcoin (BTC) is “finally showing signs of a bottom,” according to Matt Hougan, chief investment officer at Bitwise.
Houghan predicts that TradFi integrations, particularly Hyperliquid and Robinhood, will drive the next crypto bull market, and the resulting tide should “lift” the largest cryptocurrencies including Bitcoin and Ether.
Houghan believes crypto is bringing major benefits like 24/7 trading to traditional markets, and noted that today “nearly half the volume on Hyperliquid is in conventional assets like oil, silver, and the S&P 500 [and] it’s expanding into spot commodities, prediction markets, and options,”
Bitwise data also suggests apparent demand for BTC is showing signs of reversal. The metric measures the difference between newly-mined BTC and the supply inactive for at least one year.

Top FUD of the Week
Home invasions became most common crypto wrench attack in H1 2026: CertiK
Home invasions became the most common form of crypto wrench attacks during the first half of 2026, rising to 20 publicly reported incidents from just one a year earlier, according to blockchain security firm CertiK.
On Thursday, CertiK said it verified 52 wrench attacks worldwide in the first half of 2026, up 33.3% from 39 incidents during the same period in 2025. Kidnappings rose to 16 from 12, while robberies declined from five incidents to one.
CertiK said the recorded financial exposure linked to the attacks reached about $124.1 million, up from $10.5 million a year earlier.
The increase in home invasions suggests criminals are increasingly bypassing digital safeguards by physically coercing crypto holders and their families.
Hackers steal $31.6M in 2 crypto bridge attacks within 7 hours
Hackers stole more than $31.6 million across two unrelated crypto bridge exploits spaced just hours apart, targeting bridges operated by decentralized perpetual exchange AFX and Verus Protocol.
According to Blockaid, AFX, a decentralized perpetual exchange operating on Arbitrum, reportedly lost $24.15 million on Wednesday through a hack targeting one of its cross-chain bridges. Hours later, Blockaid said it detected an exploit targeting the Verus Ethereum Bridge that resulted in about $7.5 million in crypto being stolen.
“Another bridge, another exploit. Bridges will always be a weak link, until security is upgraded,” onchain investigator TheCrypticWolf said in a post on X.
Ethereum ETFs close week in red, end 5-day inflow streak
US-listed spot Ethereum exchange-traded funds (ETFs) logged $70.62 million in net outflows on Friday, ending a five-day inflow streak.
Ethereum funds saw $211.25 million in net inflows over the previous five sessions from July 17, according to SoSoValue data. They still posted $103.9 million in net inflows for the week ended Friday.
Despite the outflows, Ethereum ETFs extended their weekly inflow streak to three straight and have attracted $337.74 million in net inflows so far in July.
The Bitcoin ETFs reversed gains made earlier in the week to end up with $33.9 million of inflows.
Top Magazine Stories of the Week

Both parties say they want US crypto market structure legislation, but a dispute over ethics rules and who enforces them is becoming the bill’s biggest obstacle.
A Bitcoin development roadmap that addresses quantum computing risks could see the price surge by “double digits” very quickly, according to Charles Edwards.
Are the fears of an AI driven hacking epidemic totally overblown, or is this just the lull before the storm?
Cointelegraph publishes long-form journalism, analysis and narrative reporting produced by Cointelegraph’s in-house editorial team with subject-matter expertise. All articles are edited and reviewed by Cointelegraph editors in line with our editorial standards. Content published in here does not constitute financial, legal or investment advice. Readers should conduct their own research and consult qualified professionals where appropriate. Cointelegraph maintains full editorial independence.


POSCO International, South Korea’s largest trading company, has begun tokenizing trade receivables on blockchain in a test that could speed up commercial payments between its global subsidiaries.
The company, which generated $22.2 billion in revenue last year from businesses spanning steel, energy and battery materials, is working with LG CNS, the technology arm of LG Group, to issue, transfer and settle receivables on layer-1 blockchain Injective , the firms told CoinDesk in a press briefing.
The pilot is using receivables generated by real trade between POSCO’s overseas operations and their counterparties rather than simulated transactions.
Trade receivables represent money owed to a company after goods have been shipped but before payment is received. Today, those claims are typically tracked separately by buyers, sellers and banks, with reconciliation often taking days before cash can be released.
The companies said putting receivables on a shared blockchain ledger creates a single record that can be transferred and settled while carrying compliance rules with the asset itself.


WEMIX suspended bridges, liquidity-pool trading and several services after an attacker compromised a WEMIX$-linked contract and moved 724,198 USDC.e.
The Federal Reserve (Fed) decides on interest rates this Wednesday. Almost every economist expects no change. Traders are far less sure.
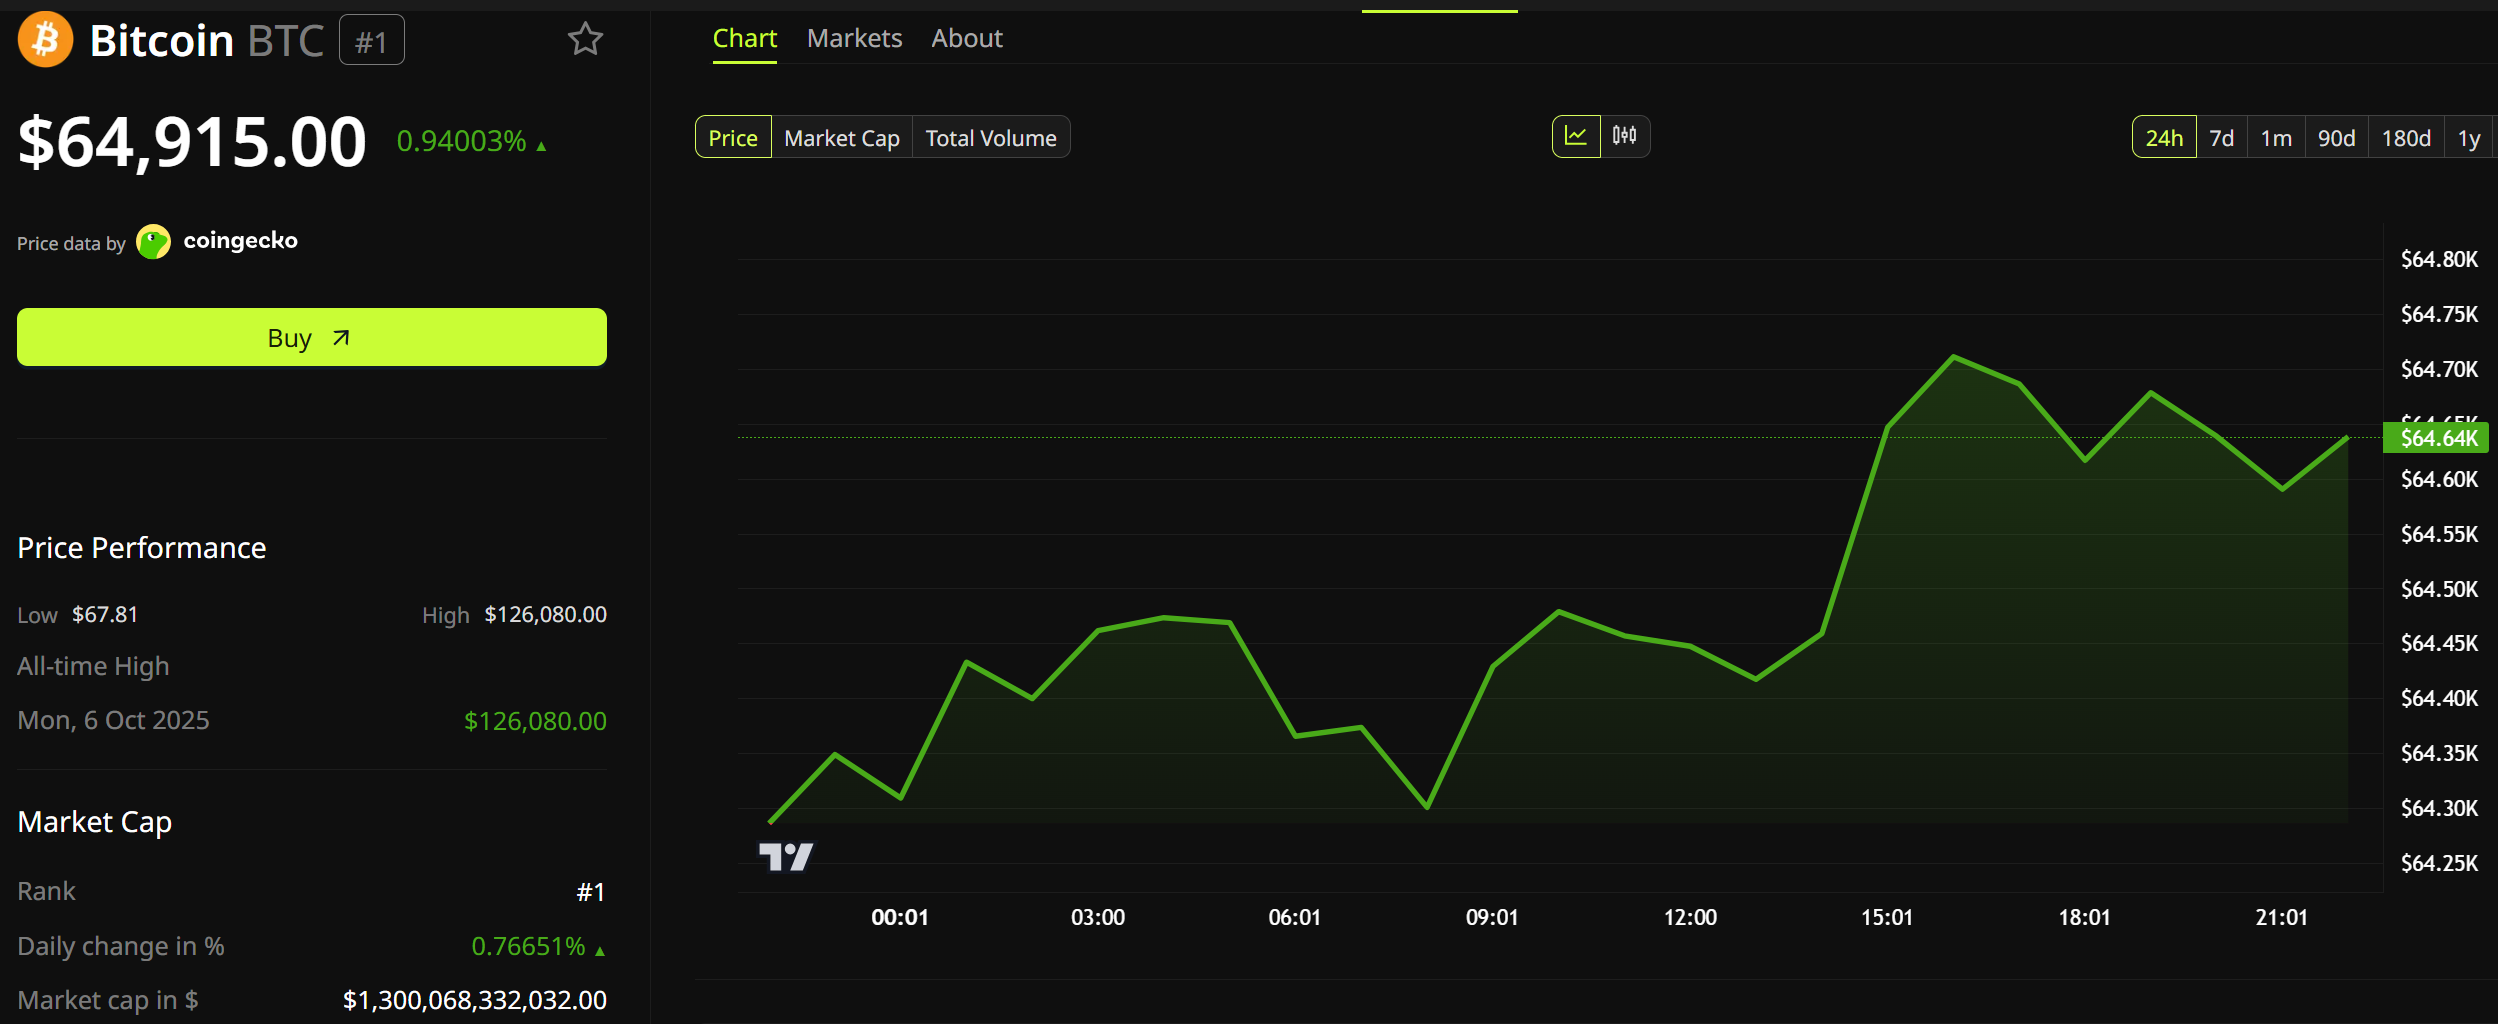
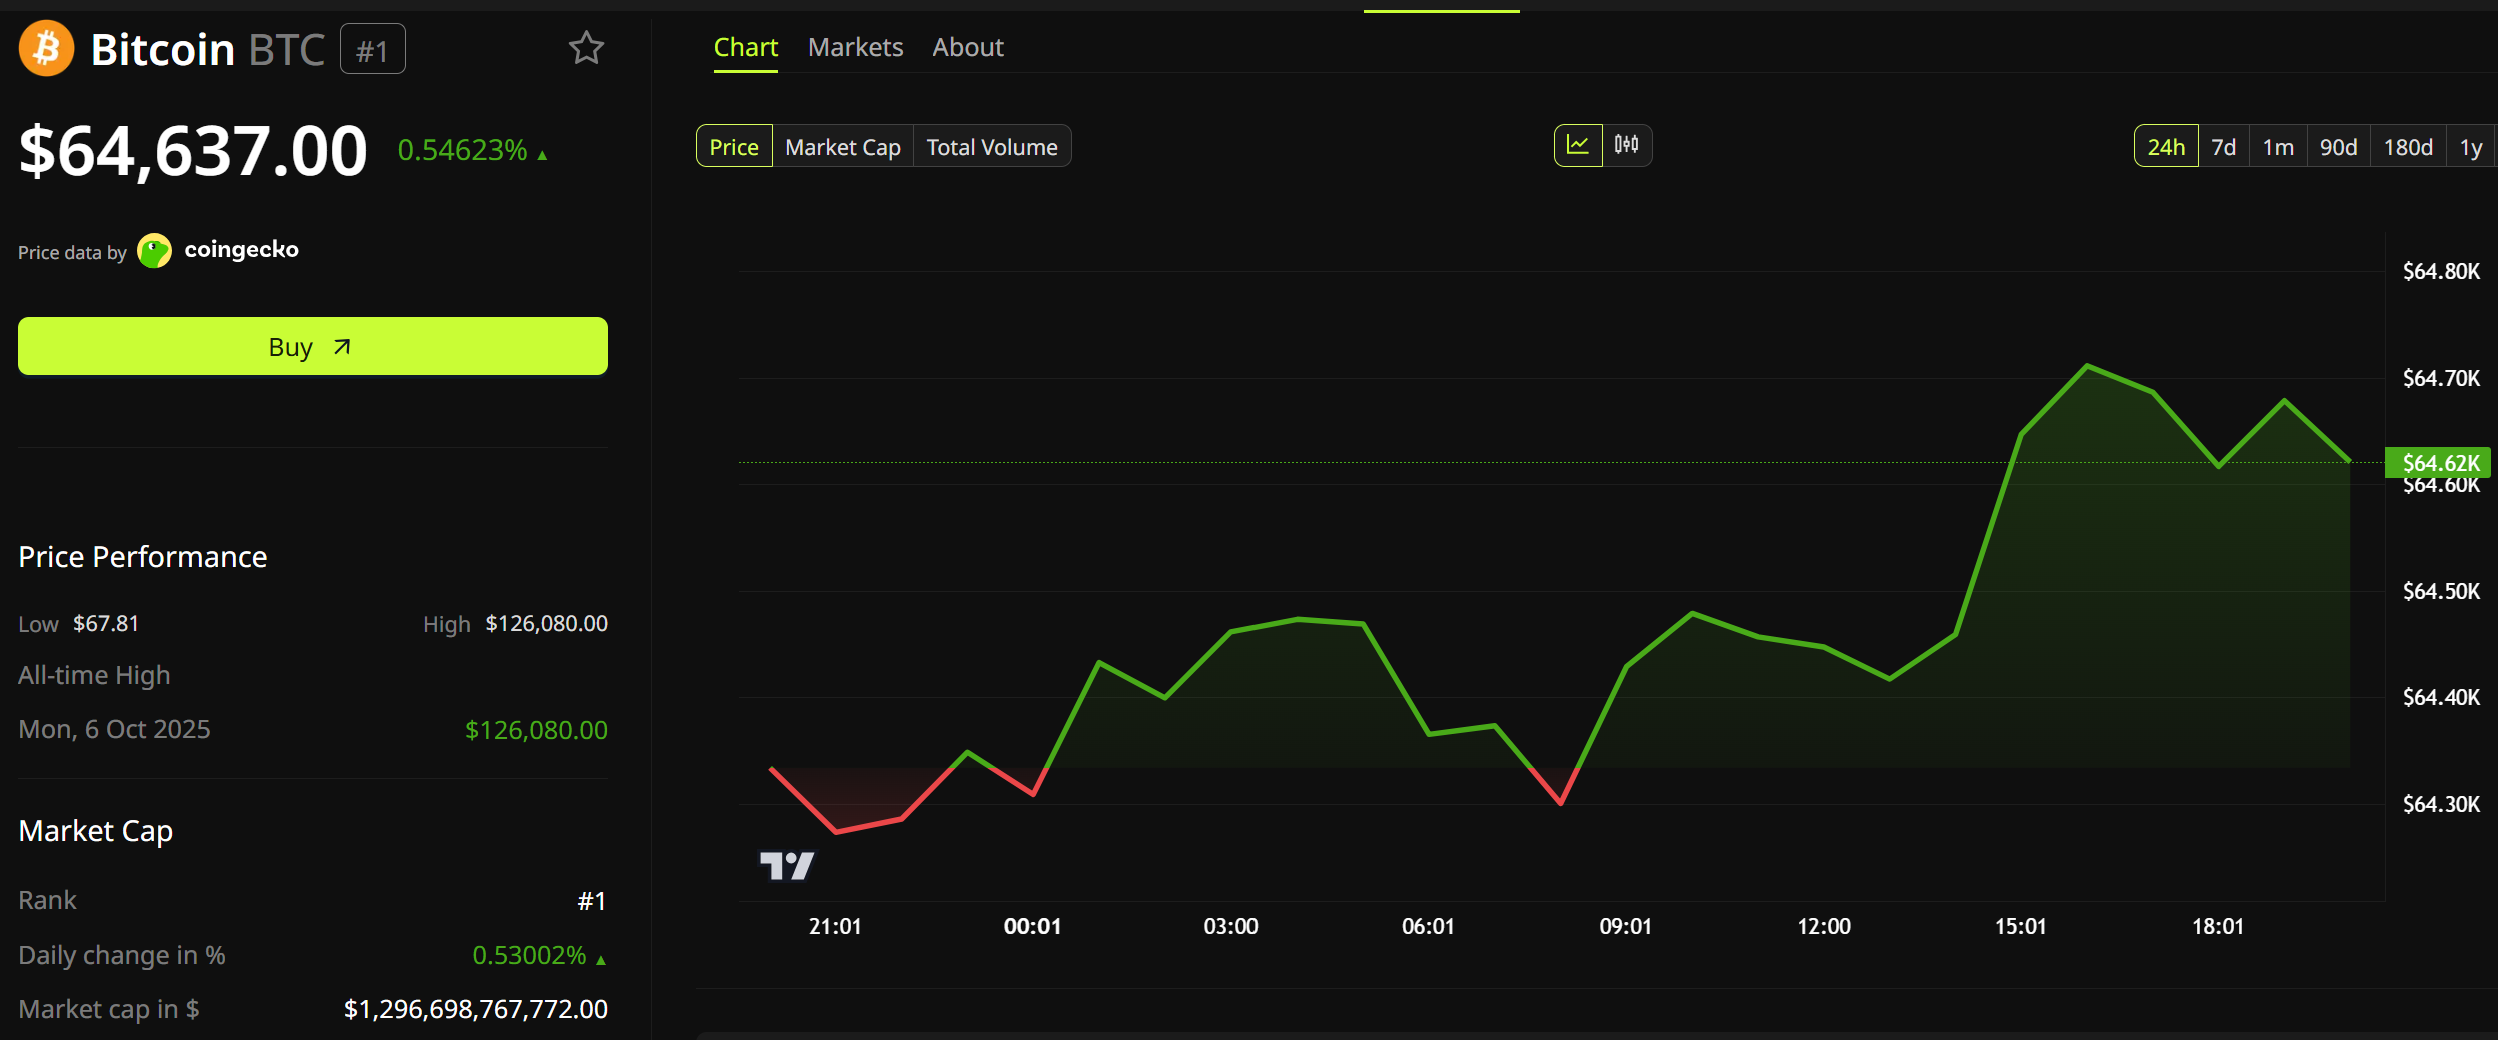
That gap matters. If the Fed surprises, stocks, bonds, oil and Bitcoin (BTC) all move fast. Bitcoin traded near $64,915 on Monday, up 0.7%.

Economists Say Hold, Traders Say Maybe Not
The Fed’s main interest rate has sat between 3.50% and 3.75% for four meetings. The FactSet consensus says it stays there.
Reuters asked 104 economists in mid-July. All 104 said hold. Fully 78 expected no change through December.
Traders tell a different story. Fed funds futures put the chance of a rate rise at 13% a week ago. By Friday it had jumped to 38%. It now sits near 36%.

“We are currently seeing the biggest indecision by the markets regarding the expected outcome for some time,” analyst The Martini Guy noted.
Follow us on X to get the latest news as it happens
The two camps are not really arguing. Economists name the single likeliest outcome. Futures price every outcome, including the unlikely ones.
The panel is also shifting. Most of those same economists now rate the chance of a hike later in 2026 as high. A month ago, most said low.
Why the doubt? Chair Kevin Warsh has stopped hinting at what comes next. The Fed will not publish new forecasts either. That leaves traders guessing ahead of this week’s central bank decisions.
“Absent, also, is so-called forward guidance, which we agreed was not well suited to the current policy conjuncture,” said Warsh.
Gregory Daco of EY-Parthenon calls a July hike unlikely. Even so, he puts the rest of the year at 60-40. Larry Meyer, a former Fed governor, expects a hold but sees Lorie Logan and Beth Hammack voting against it.
Oil and Tariffs Brought Inflation Back
Oil is the trigger. Brent crude closed at $100.69 on July 23, its first close above $100 since May 26. Prices are up over 30% this month.
Costlier oil means costlier fuel, and that lifts inflation. A weekend pause in Iran strikes has calmed things a little.
Tariffs came next. On Friday, the US added new import taxes of 10% and 12.5% on goods from 60 trading partners.
These replace tariffs the Supreme Court threw out in February, using a law that is harder to challenge.
Bond markets reacted. The 10-year Treasury yield closed Friday at 4.69%, its highest since January 2025. That is the rate the US government pays to borrow for a decade.
The two-year yield is the real tell. It ended the week at 4.33%, above the Fed’s own 3.75% ceiling. Bond traders are already braced for higher rates.
What It Means for Bitcoin
Bitcoin trades near $64,915. That is roughly 49% below its record of $126,080, set in October 2025.
When safe bonds pay 4.69%, risky bets look less appealing. That has capped Bitcoin all month.
A rate rise would be the Fed’s first since July 2023, ending three years of pauses and cuts.
A calm hold could do the opposite. Bitcoin stalled near $66,000 earlier this month, when AI-driven inflation worries capped the rally.
Warsh speaks 30 minutes after the decision. With forecasters and traders this far apart, his tone will matter more than the vote. Priced-in outcomes rarely move markets. Surprises do.
The post Fed Rate Decision Pits 104 Economists Against a 36% Hike Bet appeared first on BeInCrypto.
Bitcoin ended the first half of 2026 near $60,000 after falling about 32% since January, Binance Research reported. Its Half-Year 2026: Macro & Bitcoin report described the decline as a third consecutive quarterly loss across broader financial markets worldwide.
The weak first-half performance also extended Bitcoin’s longer-term drawdown. According to the report, the asset has fallen more than 50% from its October 2025 record high near $126,000. It has also spent 275 days below that peak, underscoring the depth and persistence of the current market downturn.
On-Chain Data Signals Market Stress
On-chain data showed 10.83 million BTC ended the period in unrealized loss, while 9.22 million units remained profitable instead. Binance Research said this marked the first loss-over-profit crossover during the current market cycle, making conditions important for analysts.
The researchers noted similar crossovers have historically appeared near major Bitcoin market bottoms before stronger recoveries eventually followed. However, they cautioned that historical patterns alone cannot confirm the current cycle will produce the same outcome.
Beyond the on-chain signals, Binance attributed Bitcoin’s weak performance mainly to broader macroeconomic conditions rather than crypto-specific developments. The report said markets shifted from liquidity-driven expectations toward economic fundamentals as monetary policy remained restrictive throughout the first half of 2026.
Expectations for interest rates also changed as hopes for aggressive cuts faded. Futures markets instead reflected an 80% probability of another Federal Reserve rate increase before December, adding pressure across financial markets.
Macro Pressures Weigh on Bitcoin
The report also said higher real yields, a stronger U.S. dollar, and tighter liquidity continued to weigh on Bitcoin. While technology stocks rebounded on optimism around artificial intelligence, BTC lagged behind many major asset classes during the same period.
A resilient U.S. economy also reduced expectations that the Federal Reserve would cut interest rates soon. Binance Research said artificial intelligence was a key driver of first-quarter economic activity. At the same time, core PCE inflation rose to 3.4%, its highest level since late 2023, reinforcing concerns that price pressures remain stubborn.
That backdrop also weakened demand for crypto. U.S. spot Bitcoin ETFs recorded $5.4 billion in net outflows during the first half of the year.
The post Down 32% in 6 Months: What Binance Research Says About Bitcoin’s Next Move appeared first on CryptoPotato.
Storj filed for bankruptcy protection on Sunday. The company says its network still works and STORJ tokens still work. Its owner made similar promises nine months ago.
Storj now wants to hand token holders a slice of the rebuilt company. But a judge must approve that. And creditors get paid first.
Why Storj Filed Chapter 11
Storj Labs filed in a federal bankruptcy court in West Virginia. The case number is 5:26-bk-00512.
Follow us on X to get the latest news as it happens
Chapter 11 is not a shutdown. It lets a company keep trading while a court helps it clear its debts.
Storj says those debts are old. They came from an earlier phase of the business. The company cannot grow its way out of them.
“The business underneath is strong and right-sized. What holds it back are legacy obligations from an earlier chapter.”
That was Kaloyan Raev, Storj’s director of software engineering. He also signed the letter to token holders, not Chief Executive Colby Winegar.
What It Means for STORJ Holders
Nothing changes for the token today, Storj says. Data still moves across tens of thousands of storage locations in more than 100 countries.
The company plans to offer holders equity in the new Storj. Equity means part-ownership. The rules for who qualifies have not been written yet.
Those rules will matter. About 143.8 million STORJ trade freely out of 425 million in total. Two-thirds of the supply sits elsewhere.
Bankruptcy also has a payment order. Creditors come before owners. Storj’s letter to token holders admits it can promise intent, not results.
The Warning Sign From October
Inveniam Capital Partners announced it was buying Storj on Oct. 22, 2025. It promised no changes to contracts, pricing, or leadership.
“We’re particularly excited to integrate the STORJ token into our ecosystem, driving greater utility and alignment across our platforms.”
That was Patrick O’Meara, Inveniam’s chairman and chief executive. STORJ traded near $0.1872 that day. It has fallen about 60% since.

A closer warning came this month. MVMT Labs filed Chapter 11 in Delaware on July 15. Its Movement (MOVE) token hit a record low of $0.00964 ten days later.
STORJ has held up so far. It trades near $0.0745, up 1.5% on the day. Volume is $5.6 million and market value is $10.7 million.
The wider sector is soft too. Storage and infrastructure tokens have lagged even as network usage grew.
Storj says it will share court dates as they land. But the fine print of the equity offer will decide what holders actually get.
The post Storj Chapter 11 Raises the Biggest Question for STORJ Token Holders appeared first on BeInCrypto.
Some analysts say Bitcoin (BTC) could reach $200,000 if the CLARITY Act becomes law. That is a very big if. Seven roadblocks now stand between the bill and a Senate vote.
The CLARITY Act would decide which US agency polices crypto. It has sat on the Senate’s to-do list since June 1 without a vote.
Why $200,000 Depends on One Bill
Start with the number. It describes one scenario, not a firm forecast. Research desk FM Intelligence sees Bitcoin between $135,000 and $200,000 over the next year. It gives that outcome one-in-four odds, and only if the bill is signed before the November midterms. Its main case is far lower at $95,000 to $130,000, per its published scenarios.
Now look at the gap. Bitcoin trades at $64,671, up 0.48% in a day, with a market value of $1.29 trillion.

Reaching $200,000 means the Bitcoin market price would need to roughly triple. It already sits about 49% below its record of $126,080, set on October 6, 2025.
Sentiment has turned this month, though. Treasury Secretary Scott Bessent said on July 21 that Congress was on the “1-yard line.” Bitcoin jumped toward $67,000, ending roughly 15% above its early July low.
“The formal passage of the Clarity Act into law will be the ultimate catalyst, sparking a new bull market as institutional allocators race to gain exposure out of a fear of missing out,” Forbes reported, citing CK Zheng of ZX Squared Capital.
CK Zheng once ran risk for Credit Suisse. He now runs the hedge fund ZX Squared Capital.
Wall Street Has Already Priced In Some Failure
Big banks have moved the other way. Citi cut its 12-month Bitcoin target to $82,000 on July 1. That was its second cut of 2026. The bank opened the year expecting $143,000, then trimmed that to $112,000 in March.
Its target has fallen 43% this year. Each time, Citi blamed the stalled bill rather than Bitcoin.
Alex Saunders leads the bank’s macro and decentralized finance (DeFi) research. He warned in March that the window for US legislation was closing.
Standard Chartered is warmer but still modest. Geoffrey Kendrick kept its year-end target at $100,000 in mid-July, which would need a 55% climb.
7 Roadblocks in the Bill’s Way
The following roadblocks make the case for what may make the Clarity Act not get the passage analysts are wagering their passage best on.
1. The senators blocking it are not crypto opponents
Seven Democrats rejected the current text in a joint statement on July 22. They are Catherine Cortez Masto, Angela Alsobrooks, Cory Booker, Ruben Gallego, John Hickenlooper, Mark Warner and Raphael Warnock.
Here is the surprise. All seven voted for the GENIUS Act, the stablecoin law, in June 2025.
That bill passed 68-30 with 18 Democrats behind it, Senate records show. Trump signed it into law weeks later.
Elizabeth Warren voted against it and remains opposed today. She was never a winnable vote, so she is not the obstacle.
The wall is built from proven crypto supporters.
2. Republicans cannot reach 60 without them
Senators can stall any bill by refusing to end debate. Breaking that stall takes 60 votes. Republicans hold 53 seats, so seven must come from Democrats.
3. Trump earned $1.4 billion from crypto
Senate Banking’s minority staff reviewed the President’s financial disclosures. They found more than $1.4 billion in crypto income for 2025 alone.
World Liberty Financial, the Trump family’s DeFi venture, supplied $799 million. The $TRUMP meme coin added another $636 million.
4. Only Trump’s Justice Department could enforce the new rules
Republicans released fresh ethics language on July 22, and Trump agreed to it. Ranking Member Warren says it has holes.
State attorneys general could not enforce it, she argues. The rules would also expire once Trump leaves office.
“Donald Trump raked in more than $1.4 billion from cryptocurrency ventures, and this bill does nothing to prevent him from vacuuming up his next $1.4 billion in crypto profits… This bill should be dead on arrival,” said Senator Elizabeth Warren.
Follow us on X to get the latest news as it happens
5. The real deadline is August 7
The Senate’s summer break starts August 10, its own calendar shows. Friday, August 7 is therefore the last working day before members head home.

6. September offers only 14 working days
Senators return on September 14. They leave again on October 5 to campaign for the midterms.
That leaves 14 scheduled working days. It is a thin window for a bill that took a year to negotiate.
7. The House may reject the Senate’s version
Chairman Tim Scott moved the bill through committee 15-9 on May 14. The Senate then swapped in its own text.
The House passed a different version 294-134 in July 2025. It must now accept the 300-page Senate draft text or negotiate a compromise.
The Trap at the Center of the Bill
Traders have turned optimistic quickly. On Kalshi, the odds of passage before April 2027 jumped to 52% from 33% in one week.

Yet the bull case contains a trap. Bitcoin needs the bill signed before the midterms. The unresolved fight is over how much the President may keep earning from crypto.
Passing it would hand Trump a win weeks before voters decide control of Congress. Blocking it costs Democrats little, since the hurdles facing the bill run out the clock anyway.
Seven senators who already backed crypto once must decide whether this version is worth the price.
The post Analysts See Bitcoin at $200,000 on CLARITY Act Passage, But 7 Roadblocks Remain appeared first on BeInCrypto.

Sberbank, Russia’s largest bank, says it plans to roll out cryptocurrency trading infrastructure by Dec. 1, including a “digital depository” designed to record customers’ crypto ownership and handle transactions largely outside the public blockchain.
Interfax reported that the depository will track rights in clients’ cryptocurrency positions and process most transfers off-chain, while Sberbank will also run active wallets for deposits, withdrawals, and client-initiated transfers.
Key takeaways
- Sberbank’s scheduled Dec. 1 rollout would add a regulated-style custody and settlement layer, using a digital depository to record ownership and process transactions off-chain.
- Russia’s crypto market framework is progressing toward an effective date of Sept. 1, 2026, defining regulated participant categories and expanding central bank oversight.
- Regulatory preparation is unfolding alongside intensifying EU and UK sanctions affecting crypto-asset service providers linked to Russia-related activity.
- Investors and market participants should watch how Russia’s central bank sets licensing rules and eligibility for which assets can be offered through intermediaries.
Sberbank’s digital depository: custody and off-chain settlement
According to Interfax, the digital depository will serve as the core component of Sberbank’s planned infrastructure. It is intended to maintain records of customers’ cryptocurrency rights and to account for transactions outside the main blockchain.
The state-affiliated press service quoted Alexander Vedyakhin, Sberbank’s first deputy chairman of the management board, explaining that the depository would also support transfers requested through “active wallets.” In other words, customers’ interactions—depositing, withdrawing, and moving crypto via the bank—would be handled through a banking-operated system that mirrors custody and payment workflows more than traditional on-chain exchange mechanics.
The practical implication is that, if implemented as described, Sberbank could reduce reliance on direct peer-to-peer blockchain settlement for everyday client movements, instead concentrating transaction processing and ownership accounting inside the bank’s infrastructure.
Russia’s regulated crypto framework heads toward 2026
The Sberbank announcement arrives as Russia’s legislators have advanced the country’s first comprehensive crypto market framework. Earlier in the month, lawmakers completed final readings on a bill intended to bring crypto trading, custody, and settlement into a regulated financial system.
Earlier coverage from Cointelegraph noted that the bill would grant the Bank of Russia broad oversight of the regulated market. That oversight would include determining which crypto assets may be offered via licensed intermediaries and issuing implementing regulations.
Cointelegraph’s reporting also highlighted that the central bank has established liquidity thresholds for participating in the regulated market. Those thresholds include an average market capitalization above 5 trillion rubles (about $64 billion) and an average daily volume above 1 trillion rubles (about $12.8 billion) over a two-year period.
Once the framework takes effect, it establishes five categories of regulated market participants: crypto exchanges, brokers, asset managers, custodians, and exchange service providers. The framework is set to define what market participants can do—such as buying, selling, holding, and exchanging crypto assets—as of the effective date, Sept. 1, 2026.
Infrastructure rollout meets tightening sanctions environment
While Russia builds out domestic infrastructure, external compliance pressure continues to rise. The move toward a working crypto system inside Russia is unfolding as the European Union expands sanctions targeting Russia amid its war on Ukraine.
Last week, the EU listed cryptocurrency exchange HTX (formerly Huobi Global) among sanctioned entities. In a Thursday decision, the European Council amended earlier measures “in view of Russia’s actions destabilizing the situation in Ukraine,” adding HTX to a list of 18 entities “providing crypto-assets services or payment services established outside of the Union that are significantly frustrating the purpose of the prohibitions” against Russia.
Earlier, Cointelegraph reported that EU officials said they would prohibit Belarusian nationals and residents from owning, controlling, or managing crypto exchanges and digital asset service providers, aligning the approach with the EU’s Markets in Crypto Assets (MiCA) framework.
The sanctions on HTX were not limited to the EU. The UK government imposed similar measures in May, stating there were “reasonable grounds to suspect” HTX supported Russia’s government by using financial services and funds facilitated by sanctioned entities.
For market participants, the key tension is that Russia is tightening domestic regulation while many foreign-facing crypto service providers remain exposed to sanction risks and compliance constraints. That gap can shape where liquidity flows, which counterparties can operate with certain clients, and how banks and exchanges structure their services.
What to watch next: licensing mechanics and depository operations
Sberbank’s planned digital depository—alongside the broader Russia framework set for Sept. 1, 2026—puts the spotlight on implementation details. Readers should watch how the Bank of Russia operationalizes licensing requirements, how asset eligibility is defined under the liquidity thresholds, and whether bank-operated off-chain custody and transfer accounting becomes a model for other regulated intermediaries.
Outside Russia, the sanctions trajectory suggests that cross-border partnerships and access to international payment rails may remain a moving target for crypto businesses tied to the region.

XRP Breaking AI Records, Massive CANTON USER at Ripple SWELL, Doppler XRPL AirDrop, Internal DEBATE
The best places to stay in Wales this summer which you simply won’t regret

Okta Stock: Rewarding Patience With Plenty Of Rally Left To Go (NASDAQ:OKTA)

Renter of Home in Anne Heche Crash Denies Settlement With Son

No Jackpot Winner as $257 Million Prize Rolls Over to $269 Million Monday Draw

Weekend Open Thread: Staud – Corporette.com
XRP Breaking AI Records, Massive CANTON USER at Ripple SWELL, Doppler XRPL AirDrop, Internal DEBATE

Fast Money: INCREDIBLE Scores & Comebacks (Season 11)

Crypto World Cup Bottom Indicator! London Stock Exchange! New *HUGE* Crypto Report! IRAN AWS Attack!
-

 Fashion2 days ago
Weekend Open Thread: Brooks Brothers
-

 Crypto World6 days ago
Grayscale Files For Worldcoin ETF, WLD Registers Sharp Rise
-

 NewsBeat5 days ago
How a former Blue Peter presenter stunned America’s Got Talent judges
-
 Tech6 days ago
Sail Virtually Aboard The “Itanic” With IA-64 Emulator
-
 Tech6 days ago
Turtle Beach Command Series KB7 review: a nifty screen-equipped gaming keyboard
-

 NewsBeat7 days ago
Unregistered fitter used Gas Safe logo on business flyers
-
 Business5 days ago
New Jersey voter registration controversy explained: How 6,600 noncitizens got on the rolls, and what happens next
-
 Entertainment5 days ago
Johnny Depp’s R-Rated Gothic Cult Classic Gets New Release Ahead of Sydney Sweeney Remake
-

 Tech6 days ago
Watch Flock Safety CEO Garrett Langley discuss the future of surveillance at TechCrunch Disrupt 2026
-

 Crypto World4 days ago
Ethics, other provisions in crypto Clarity Act to be further discussed
-
 NewsBeat6 days ago
Shanghai science forum photos show China’s AI and robotics advances in rivalry with US
-
 Crypto World7 days ago
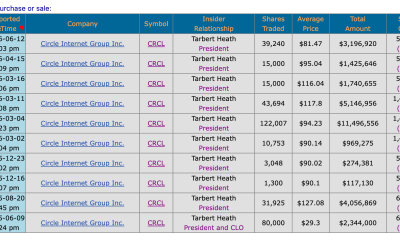
Circle’s President Sold Over 360,000 Shares, The Filings Explain Why
-

 Tech7 days ago
Subway Sandwich Computers Get a Second Life as Gaming Machines
-
 Sports5 hours ago
Commonwealth Games boxing: Jadumani Singh seals dominant 5-0 win over Pakistan’s Sumama Rehman to enter quarter-finals | Commonwealth Games News
-

 News Videos3 days ago
The Peugeot Family: How 200 Years of an “Old Money” Dynasty Died in A Boardroom
-

 Sports3 days ago
2026 3M Open leaderboard: Scottie Scheffler finds putter in Round 1, sits three back
-

 Fashion3 days ago
16 Dresses for the High Summer Event
-

 Tech57 minutes ago
Intel is reversing course and bringing hyper-threading back to its server chips
-

 Entertainment7 days ago
Stephen Colbert Returns to Social Media After Late Show End
-

 Tech7 days ago
The 35 Best Board Games for Family Game Night
You must be logged in to post a comment Login