
Crypto World
Bitcoin Rebounds to $68K After Death of Iranian Supreme Leader
Bitcoin prices have recovered from a dip tied to geopolitical headlines, shifting sentiment in a market that has grown increasingly sensitive to macro risk events. In early Sunday trading, Bitcoin (CRYPTO: BTC) climbed toward the upper end of a recent range after yesterday’s volatility driven by reports of U.S.-and-Israel strikes on Iran. The asset had briefly touched a floor near $63,000 before a run higher helped recoup the losses in less than a day. By Sunday morning, price data circulated by TradingView placed BTC on Coinbase at about $68,200, signaling a relief rally as traders weighed the potential implications for risk assets in the near term. The bounce comes after a weekend that saw liquidity stress and rapid re-pricing as newsflow evolved.
The market’s day-long swing was notable not just for the price spike but for the underlying fragility it exposed. In the 24-hour window, roughly 157,000 traders were liquidated, translating to about $657 million in total liquidations, with a near-even split between leveraged long and short positions. The figure, tracked by CoinGlass, underscored the extent to which risk-on and risk-off trades collide in a geopolitical backdrop that has kept many participants on edge. While the move higher drew some relief, the overall liquidity environment remains sensitive to headlines, complicating calls about sustained momentum in the weeks ahead.
Key takeaways
- Bitcoin briefly surged to around $68,200 on Coinbase before a pullback left it near $67,350, continuing a three-week trading range around the $67k level.
- Over the past 24 hours, about 157,000 liquidations occurred, totaling roughly $657 million, with roughly equal shares of longs and shorts liquidated, per CoinGlass.
- Unverified but widely circulated reports of high-level leadership casualties in Iran fed sudden volatility, though the situation remained fluid as markets awaited official confirmation.
- February closed as Bitcoin’s third-worst February on record, with a decline close to 15%, marking one of the worst month-ends since 2013 and contributing to a difficult start to the year (Q1) for the asset.
- Analysts cautioned that de-escalation signs before the week’s opening could help sustain gains, though upside remains contingent on geopolitical clarity and macro risk sentiment.
Tickers mentioned: $BTC
Sentiment: Neutral
Price impact: Neutral. The bounce offset a steep intraday drop, but BTC remains within a tight, range-bound pattern rather than establishing a clear breakout.
Market context: The price action sits amid a broader backdrop of geopolitical risk and risk-off liquidity dynamics, with intraday moves driven by headlines as traders recalibrate exposure to macro and policy risks. Recent data show concentrated volatility around major news events, reinforcing a cautious stance among most market participants.
Why it matters
For traders, the brief rebound toward the mid-to-high $60k zone after a sharp decline emphasizes Bitcoin’s role as a potential haven within a high-risk environment, even as it remains tethered to overall risk sentiment. The rapid liquidations in a 24-hour period highlight how quickly leveraged positions can unwind when headlines shift, underscoring the importance of risk management and hedging in crypto portfolios. The episode also demonstrates that, despite episodic spikes, price action continues to reflect a balance between demand from allocators seeking a store of value and the pressure from macro and geopolitical headlines that can compress liquidity and amplify moves in either direction.
Analysts’ commentary around the potential for de-escalation to support further gains captures a common thread: Bitcoin’s near-term trajectory in this environment is highly contingent on the speed and visibility of political developments. One analyst noted that if conflict signals resolve ahead of the next market open, BTC could stabilize and potentially push higher. Others warned that any renewed escalation or uncertainty could quickly reverse the recent rebound, given the asset’s history of volatile responses to global tensions. In this context, the market’s probability distribution shifts with every fresh headline, making prudent risk management more important than ever for participants navigating this space.
Beyond geopolitics, Bitcoin’s February performance remains a cautionary signal. The asset finished the month down about 15%, marking its third-worst February in the data set and contributing to a challenging start to the year. This performance places Bitcoin on track for its worst first quarter since 2018, with losses approaching the mid-20% range year-to-date in a few scenarios. Such numbers reinforce that the cryptocurrency market is not immune to broader cyclicality and risk-off periods, even when episodic catalysts temporarily provide support. The data points to a market still digesting a period of elevated volatility, with traders weighing whether a more sustained recovery can emerge from macro normalization and improved liquidity conditions.
Against this backdrop, traders continue to monitor on-chain activity and liquidations as practical indicators of market risk appetite. The scale of recent liquidations suggests a broad reticence among highly leveraged participants, and it remains to be seen whether this sentiment translates into a more durable bid or gives way to renewed selling pressure if the geopolitical picture remains uncertain. The episode also highlights the constant tension between macro risk signals and crypto-specific fundamentals, where retail and institutional participants alike seek price discovery in a market characterized by 24/7 trading and near-instantaneous reaction to news flow.
What to watch next
- Any official statements or de-escalation signals from U.S. or allied authorities regarding Iran and the region, ahead of the next market open.
- Price action around key support and resistance levels near the current three-week range, with attention to whether BTC maintains momentum above or retreats below the mid-$60k zone.
- Changes in liquidity and funding rates on major exchange platforms as risk sentiment shifts in response to headlines and macro data releases.
- Updates on geopolitical developments, including any verification of leadership changes or military assessments, that could alter risk-on versus risk-off dynamics for crypto markets.
Sources & verification
- Bitcoin price data and range observations from Coinbase trading data and TradingView.
- Liquidation figures (157,000 traders; about $657 million total) reported by CoinGlass.
- BBC reporting on Iran’s leadership developments and attribution of events to the Iranian leadership.
- Public posts and commentary on the geopolitical situation, including statements on Truth Social by former U.S. President Donald Trump.
- Reported US-Israel air strikes on Iran as referenced in market commentary.
Bitcoin price moves amid geopolitical tensions and liquidity shifts
Bitcoin (CRYPTO: BTC) kept a close watch on news flow as markets absorbed headlines about U.S.-led strikes in the Middle East and the broader risk landscape. After a dip that briefly carried prices toward the low $60k region, BTC staged a partial recovery, briefly topping $68,200 on Coinbase before easing back. The rebound unfolded within a roughly three-week trading band centered near $67,000, illustrating the market’s struggle to establish a durable directional bias amid ongoing geopolitical uncertainty. The intraday swing, while dramatic, did not necessarily translate into a lasting breakout, and traders remained cautious about the asset’s medium-term trajectory.
From a risk-management perspective, the latest price action coincided with large liquidation activity. In the last 24 hours, data indicated around 157,000 liquidations totaling approximately $657 million—an amount that underscores how quickly highly leveraged positions can be unwound when volatility spikes. The liquidations appeared roughly evenly split between longs and shorts, suggesting a broad spectrum of market participants faced margin pressure regardless of their directional stance. These dynamics are emblematic of a market where liquidity can be episodically thin and sentiment-sensitive, particularly in the wake of geopolitical events and shifting macro cues.
The geopolitical narrative surrounding Iran added another layer of complexity. Reports from credible sources suggested that Ayatollah Khamenei, Iran’s Supreme Leader, had been killed in a Saturday operation, with subsequent coverage by outlets such as the BBC. Such claims, whether confirmed or refuted, tend to catalyze rapid price revision as traders reassess risk premia and potential spillover effects on regional stability. Notably, commentary from market observers emphasized that the trajectory of Bitcoin would likely hinge on whether the conflict shows signs of de-escalation before the market opens on Monday, a scenario that could preserve or extend the current gains. As one analyst noted on social media, the possibility of a peaceful trajectory could help Bitcoin maintain momentum, while renewed hostilities could precipitate renewed volatility.
Despite the back-and-forth, February’s performance looms large in the narrative surrounding BTC. The asset closed the month with a near-15% slide, marking its third-worst February on record and continuing a pattern of weak early-year performance. The broader implication is an ongoing risk-off phase that has persisted into 2026, with the question for market participants being whether a combination of de-risking, thin liquidity, and regulatory developments can eventually pave the way for a more sustained recovery. The data point toward a volatile environment where macro and geopolitical developments can overshadow even localized bullish catalysts, compelling traders to adopt disciplined risk controls and clear exit strategies.
As the market awaits more clarity, the path forward appears to be shaped by the interplay between conflict resolution signals and the crypto market’s own liquidity dynamics. The narrative remains unsettled, and the potential for further volatility persists as new information emerges. In this context, BTC’s price action will likely reflect not only technical support and resistance but also broader shifts in risk appetite, funding costs, and investors’ willingness to allocate capital to an asset class that remains highly sensitive to global developments. For now, the market seems to be testing the resilience of Bitcoin’s bid while staying vigilant for the next headline that could swing the balance.

Key points:
-
Buyers are attempting to push Bitcoin toward the $76,000 level but are facing significant selling from the bears.
-
Several major altcoins are likely to pick up momentum if they break above their overhead resistance levels.
Buyers are attempting to sustain Bitcoin (BTC) above the $72,500 level but are expected to face significant resistance from the bears. US spot BTC exchange-traded funds have witnessed a mixed week, with two days of inflows and two days of outflows, according to Farside Investors data. However, a positive sign is that the inflows have been larger than the outflows, resulting in weekly net inflows of $576.5 million.
Although there are signs of recovery, Glassnode said in its latest Week Onchain newsletter that BTC will have to cross the True Market Mean at $78,000 and the Short-Term Holder Cost Basis at $81,600 to transition into a sustainable recovery regime. Until then, the “mid to long-term bias remains tilted to the downside” as any rally into the zone is expected to encounter selling pressure from recent buyers who may want to exit their positions at or near breakeven.

Along with BTC, Ether (ETH) may also be bottoming out. The Capriole Macro Index Oscillator recorded a reading of -2.42, signaling undervaluation. In 2022, ETH had bottomed out in the $1,000 to $1,200 range when the indicator fell to -2.2. That suggests limited downside risk and greater upside potential.
Could BTC and select major altcoins continue their relief rally? Let’s analyze the charts of the top 10 cryptocurrencies to find out.
Bitcoin price prediction
BTC rose above $73,000, but the bulls could not sustain the higher levels. That suggests the bears are attempting to retain the price below the $72,000 level.

A positive in favor of the bulls is that the 20-day exponential moving average ($69,587) has started to turn up, and the relative strength index (RSI) has risen into the positive territory. That increases the possibility of a rally to the $76,000 resistance.
Sellers are expected to defend the $76,000 level with all their might, as a close above it completes a bullish ascending triangle pattern. The BTC/USDT pair may then ascend to $84,000.
The bears will have to swiftly pull the BTC price below the support line to signal a comeback. If they do that, the pair risks dropping to the crucial $62,500 to $60,000 support zone.
Ether price prediction
ETH’s pullback is finding support at $2,200, signaling that the bulls are attempting to flip the level into support.

If the ETH price turns up from the current level and breaks above $2,274, it improves the prospects of a rally above the $2,400 resistance. If that happens, the ETH/USDT pair may surge to $2,800.
This bullish view will be invalidated in the near term if the price turns down and breaks below the moving averages. That suggests the higher levels are attracting sellers. The pair may then slump to the solid support at $1,916.
XRP price prediction
Buyers have failed to push XRP (XRP) above the 50-day simple moving average ($1.38), indicating that the bears are aggressively defending the level.

Both moving averages are flattening out, and the RSI is just below the midpoint, indicating a slight edge to the bears. A break and close below the $1.27 level signals the resumption of the downtrend to $1.11 and later to the support line of the descending channel pattern near $0.9.
On the other hand, a break above the 50-day SMA tilts the short-term advantage in favor of the buyers. The XRP/USDT pair may then rally to the downtrend line, where the bears are expected to pose a strong challenge.
BNB price prediction
BNB (BNB) has failed to rise above the 50-day SMA ($626), indicating that the bears are selling on minor rallies.

Sellers will attempt to strengthen their position by pulling the BNB price below the $570 level. If they succeed, the BNB/USDT pair may resume its downtrend to the next strong support at $500.
Conversely, a close above the moving averages signals that the pair may extend its stay within the range for some time. Buyers will be back in the driver’s seat on a close above the $687 level. That clears the path for a rally to $730 and subsequently to $790.
Solana price prediction
Solana (SOL) has been consolidating inside the $76 to $98 range, signaling buying on dips and selling on rallies.

If buyers drive the SOL price above the moving averages, the recovery may reach the $98 level. Sellers are expected to fiercely defend the $98 level, attempting to keep the SOL/USDT pair inside the range.
The next trending move is expected to begin above the $98 resistance or below the $76 support. If bulls propel the price above the $98 level, the pair may surge to $117. Alternatively, a break below the $76 level may sink the pair to $67.
Dogecoin price prediction
Dogecoin (DOGE) failed to rise above the downtrend line, indicating that the bears continue to exert pressure.

Sellers will have to quickly pull the DOGE price below the $0.09 support to complete the bearish descending triangle pattern. If they do that, the DOGE/USDT pair may plunge to $0.08 and later to the pattern target of $0.06.
Instead, if the price turns up and breaks above the downtrend line, it suggests that the bulls are aggressively defending the $0.09 level. The failure of a bearish setup is a positive sign as it is likely to attract buyers. The pair may then start its climb toward the $0.11 resistance.
Hyperliquid price prediction
Hyperliquid (HYPE) has been gradually moving higher toward the $41.59 to $43.76 resistance zone, signaling solid demand from the bulls.

The 20-day EMA ($37.91) has started to turn up, and the RSI is in the positive zone, indicating that the bulls are in command. A close above the overhead resistance zone opens the gates for a rally to $50.
Sellers will have to swiftly yank the HYPE price below the 50-day SMA ($35.27) to signal a comeback. If they do that, the HYPE/USDT pair may plummet to the $29.42 level.
Related: Bitcoin analysis sees $55K BTC price ‘iron bottom’ by December 2026
Cardano price prediction
Sellers are defending the 50-day SMA ($0.26) in Cardano (ADA), but the bulls have not allowed the price to dip back below the $0.25 support.

The first sign of strength will be a close above the 50-day SMA, as it opens the doors for a rally to the downtrend line. Sellers are expected to fiercely protect the downtrend line, as a close above it signals a potential short-term trend change.
On the contrary, a drop below the $0.23 level indicates that the bears have overpowered the bulls. That may sink the ADA/USDT pair to $0.22 and later to the support line near the $0.16 level.
Bitcoin Cash price prediction
Bitcoin Cash (BCH) is facing resistance at the 20-day EMA ($451), but the bulls have not given up much ground to the bears.

That increases the likelihood of a break above the 20-day EMA. If that happens, the BCH/USDT pair may climb to the 50-day SMA ($465) and subsequently to the $486 resistance. A close above the $486 level suggests that the market has rejected the break below the $443 support.
Sellers are likely to have other plans. They will attempt to defend the moving averages and pull the BCH price below the $420 level. If they do that, the pair may plummet to $375.
Chainlink price prediction
Chainlink (LINK) has been stuck between the $8 and $10 level for several days, indicating a balance between supply and demand.

The longer the price remains within a range, the stronger the eventual breakout. The flattish moving averages and the RSI near the midpoint do not give either bulls or bears a clear advantage.
If the LINK price turns up from its current level and breaks above the $10 resistance, it suggests the start of a new uptrend. The LINK/USDT pair may then reach $11.61. Conversely, a close below the $8 support may resume the downtrend toward the $6 level.
This article does not contain investment advice or recommendations. Every investment and trading move involves risk, and readers should conduct their own research when making a decision. While we strive to provide accurate and timely information, Cointelegraph does not guarantee the accuracy, completeness, or reliability of any information in this article. This article may contain forward-looking statements that are subject to risks and uncertainties. Cointelegraph will not be liable for any loss or damage arising from your reliance on this information.

TLDR
- Dom Kwok said XRP growth now extends beyond the SWIFT comparison narrative.
- Ripple focuses on institutional adoption and financial applications on XRP Ledger.
- RLUSD stablecoin supports real-world blockchain transactions and liquidity use.
- Developer activity increases through global hackathons and funding initiatives.
- Ripple executives confirmed plans to replace SWIFT, not partner with it.
Ripple’s long-standing comparison with SWIFT is losing focus as new XRP use cases expand across financial markets. EasyA co-founder Dom Kwok said the ecosystem now targets broader applications beyond cross-border payments. He stated that XRP growth now centers on institutional adoption, stablecoins, and blockchain-based financial systems.
Kwok said the early narrative helped XRP gain traction, but the market has evolved quickly. He explained that new developments now shape how participants evaluate XRP’s long-term role.
Ripple Focus Expands Beyond SWIFT Benchmark
Kwok said the SWIFT comparison once helped explain XRP’s utility to new users. However, he added that the benchmark now limits understanding of the ecosystem’s broader direction. He stated, “SWIFT is no longer the limiting factor for XRP’s growth.”
He explained that XRP Ledger now supports various financial applications beyond payments. These include liquidity management, tokenization, and enterprise financial tools. As a result, the ecosystem attracts attention from institutions exploring blockchain integration.
Kwok said XRP Ledger’s design supports both messaging and settlement within one system. This structure differs from SWIFT, which separates communication and transaction settlement processes. He noted that this technical advantage supports faster and more efficient transactions.
He also said enterprise adoption plays a central role in XRP’s expansion strategy. Companies entering the ecosystem bring existing clients and transaction flows. Even partial migration of operations to blockchain can increase on-chain activity.
Institutional Deals and RLUSD Drive XRP Ecosystem Growth
Kwok highlighted acquisitions involving firms like Hidden Road and GTreasury. He said these deals aim to integrate traditional finance operations with blockchain infrastructure. The approach focuses on gradually shifting financial processes onto XRP Ledger.
He explained that onboarding firms with active customer bases accelerates ecosystem growth. These companies already handle large transaction volumes across global markets. Moving even a small share of these transactions on-chain increases network usage.
Kwok also pointed to RLUSD as a driver of recent activity within the ecosystem. He described the stablecoin as a strong addition supporting real-world financial use cases. RLUSD enables easier access to digital payments and liquidity services.
He said developer participation is also rising through hackathons and educational programs. Events in Hong Kong and Singapore have attracted new builders to the network. Some developers have already secured funding for XRP Ledger-based projects.
Kwok stated that this growth in developer activity supports broader ecosystem expansion. More applications increase network utility and attract institutional interest. This trend also contributes to renewed attention from market participants.
XRP Strategy Targets On-Chain Financial Systems
Kwok said the XRP thesis now focuses on bringing financial systems onto blockchain networks. He explained that multiple blockchains will likely serve different financial roles. However, he maintained that XRP remains focused on enterprise adoption.
He added that XRP does not require integration with SWIFT to succeed. XRP Ledger validator Vet stated that blockchain systems combine messaging and settlement functions. This approach replaces traditional systems that separate these processes.
Ripple executive Eric van Miltenburg confirmed this direction. He said the company aims to replace SWIFT rather than collaborate with it. This position aligns with the broader shift toward blockchain-based financial infrastructure.
Recent developments show continued progress in institutional adoption and stablecoin use. These factors continue to shape XRP Ledger activity and ecosystem growth. Market participants continue monitoring updates related to RLUSD and enterprise integration.


The crypto yield pitch was simple: accept smart contract risk, earn more than with a bank. It doesn’t work like that anymore.
Nowadays, Aave, the largest DeFi lending protocol by deposit base, offers just 1.84% on the world’s largest stablecoin, USDT, and an equally dismal 2.61% APY on the Coinbase-Circle stablecoin USDC.
Lido, the largest Ethereum liquid staking service, returns just 2.53%.
By contrast, Interactive Brokers pays 3.14% on idle cash with no lockup and zero crypto exploit risk. Another basic high-yield savings account at Axos Bank pays 4.21%.
The risk premium that justified DeFi’s existence has inverted.
Many of DeFi’s flagship products now pay less than a federally insured deposit account. Trader James Christoph posted what the rest of the market has started to think: “DeFi — Earn 1% below Treasury bills and lose all of your money one time per year.”
The yield compression is structural
Ethereum staking yields have fallen from above 5% shortly after its Merge blockchain fork to just 2.7%, as over 38 million ether now competes for the same validator rewards.
Yield from Ethena, whose crypto dollar sUSDe once delivered above 50% APY in 2024, has compressed 93% to just 3.56% while its total value locked has more than halved.
The CoinDesk overnight rate which benchmarks to Aave’s daily borrowing costs — a crypto play on words to the actual overnight rate for Fed funds — has collapsed from rate peaks in the double-digit percentages before settling to approximately 3% today.
Depending on the day over the last month, CoinDesk’s overnight rate has actually and quite embarrassingly been less than the actual overnight rate for US banks.
Across the stablecoin lending landscape, the picture is uniformly grim. Compound pays just 2.55% on USDC deposits. Sky’s USDS savings rate sits at 3.75%, the highest among blue-chip protocols, but derives around 70% of its income from offchain sources including US Treasuries and Coinbase USDC rewards.
Bitcoin, which used to attract high interest rates from borrowers demanding BTC loans, now earns nearly nothing on platforms that formerly paid handsome premiums.
Many DeFi investors have to walk way out onto the risk curve toward insanity to outperform TradFi.
Read more: DeFi yields exceed 60% APY on bitcoin with insane risks
Tokenized TradFi displaces DeFi
While crypto-native yields collapse, tokenized versions of traditional fixed-income products are growing into a deca-billion dollar sector.
- BlackRock’s BUIDL fund holds over $2 billion in assets and delivers 3.47% APY.
- Ondo Finance’s USDY manages $1.8 billion yielding 3.55%.
- Franklin Templeton’s BENJI holds over $1 billion paying 3.54%.
- Superstate’s USTB, a tokenized US government securities fund, holds $646 million paying 3.47%.
The average seven-day APY across the tokenized treasury sector is roughly 3.38%. That TradFi yield, tokenized, beats Aave’s offer from crypto’s two largest DeFi stablecoin pools.
The inversion is complete. An investor choosing Aave’s USDC pool over a tokenized Treasury fund accepts smart contract risk, regulatory uncertainty, and the possibility of a protocol exploit for a lower yield.
The premium for accepting smart contract risk has not just compressed. For many average depositors in average liquidity pools, it’s flipped negative.
Got a tip? Send us an email securely via Protos Leaks. For more informed news, follow us on X, Bluesky, and Google News, or subscribe to our YouTube channel.


Aave price is trading around $91, slipping 3–4% in 24 hours as traders derisk DeFi blue chips to chase hotter themes, even though the protocol still anchors more than $20 billion in on‑chain lending.
Summary
- AAVE’s price hovers near $90–$92 with about $296m in 24h volume against a roughly $1.5b market cap, pointing to active de‑risking rather than a dead market.
- Token Terminal’s March report shows Aave overseeing around $23–$24b in TVL across 14–20 chains and holding roughly 50–62% of DeFi lending share.
- Technicals show a controlled downtrend: mid‑band RSI, neutral‑to‑bearish signals, and futures data that looks more like long unwinds than aggressive new shorts.
Aave (AAVE) price is trading around $91 on April 10, 2026, under pressure as traders derisk from DeFi blue chips to chase newer narratives, even as the protocol maintains one of the deepest lending books in crypto. Over the past 24 hours, AAVE has fallen roughly 3–4%, with daily volume near $296 million — a high figure for a token with a market capitalization of about $1.5 billion — suggesting active trimming in size rather than illiquid drift.
Aave March 2026 data compiled by CoinStats and Token Terminal shows the protocol operating with a market cap near $1.49 billion at a price of roughly $98.37, while supporting about $23.8 billion in total value locked across more than 20 blockchains and controlling an estimated 50–62% share of DeFi lending. That dominance is echoed in Token Terminal’s latest report, which notes Aave ended March with over $42 billion in deposits across 14 chain deployments, with Ethereum alone accounting for more than 80% of capital.
On TradingView, the AAVEUSDT chart places spot around $90–$92, down from recent local highs near the mid‑$90s but still well above the early‑cycle lows. The daily trend is lower but orderly, with most candles printing inside a gentle descending channel rather than a vertical collapse. Technical dashboards for AAVEUSDT label the setup as neutral‑to‑slightly bearish: RSI sits in the mid‑band rather than at capitulation levels, and aggregate signals tilt toward “sell” or “neutral” rather than “strong sell,” indicating a controlled cooldown rather than panic.
Perpetual futures data adds nuance. Binance‑linked summaries point to a small positive funding basis and soft open‑interest changes, a pattern more consistent with the slow unwinding of existing longs than with aggressive new shorting. In other words, traders appear to be trimming DeFi beta to free up capital for faster‑moving plays in areas such as meme coins, AI tokens or on‑chain perps, rather than specifically targeting AAVE for downside.
From a price‑prediction standpoint, that positioning argues for patience. CoinStats’ April outlook frames current levels in the context of three scenarios: a conservative market‑cap range of $2.2–$2.6 billion, implying $145–$165 per token; a base case of $3.6–$6.3 billion, implying $225–$395; and an optimistic band of $10–$14.5 billion, implying $625–$906, all hinging on Aave v4 execution, real‑world‑asset integration and sustained institutional flows. With the token currently near $91 and the trend pointing modestly lower, the market is not pricing in those upside paths yet.
In the near term, the more likely path is continued range‑trading and drift until either a volatility spike flushes out remaining longs or a clear catalyst — such as a major v4 launch, new L2 integrations or a headline RWA partnership — forces traders to reprice the token. Until then, Aave looks less like a broken protocol and more like a blue chip being sold to fund whatever the market’s next story happens to be.


Bitcoin’s largest holders are quietly tightening their grip on supply again, and derivatives markets are starting to price that shift in conviction with a clear upside bias toward $88,000.
Summary
After four days locked in a tight band between $70,000 and $72,000, Bitcoin punched to an intraday high of $73,255 on Friday, a move traders say echoes the Q2 2025 breakout that followed weeks of compression below key moving averages. Then, as now, price is pressing against a descending trend line; this time, the crucial trigger sits near $76,000, the upper boundary of the downtrend that began after Bitcoin’s slide from roughly $126,000. A clean break there, one desk notes, would “remove the psychological lid that has capped every rally for months.”
Under the surface, on‑chain data has flipped from distribution to accumulation. Crypto analyst Amr Taha highlights that 30‑day whale inflows to exchanges have dropped to $2.96 billion, falling below $3 billion for the first time since June 2025, versus about $8 billion as recently as February. At the same time, long‑term holders have booked a realized market value change of $49 billion, a shift Taha argues signals that “chips are moving from weak hands to strong hands,” with supply migrating toward investors willing to sit through volatility. CryptoQuant similarly frames the pattern as long‑duration capital “resuming accumulation to absorb available supply.”
Liquidity maps from CoinGlass show visible concentrations between $86,000 and $90,000, a zone now doubling as both magnet and battleground. “The chart shows a very pronounced liquidity structure,” one analysis notes, pointing to a thick cluster of orders that could accelerate a move once price enters that band. Market sentiment has turned bullish, with traders explicitly targeting $88,000 as the next waypoint if $76,000 gives way.
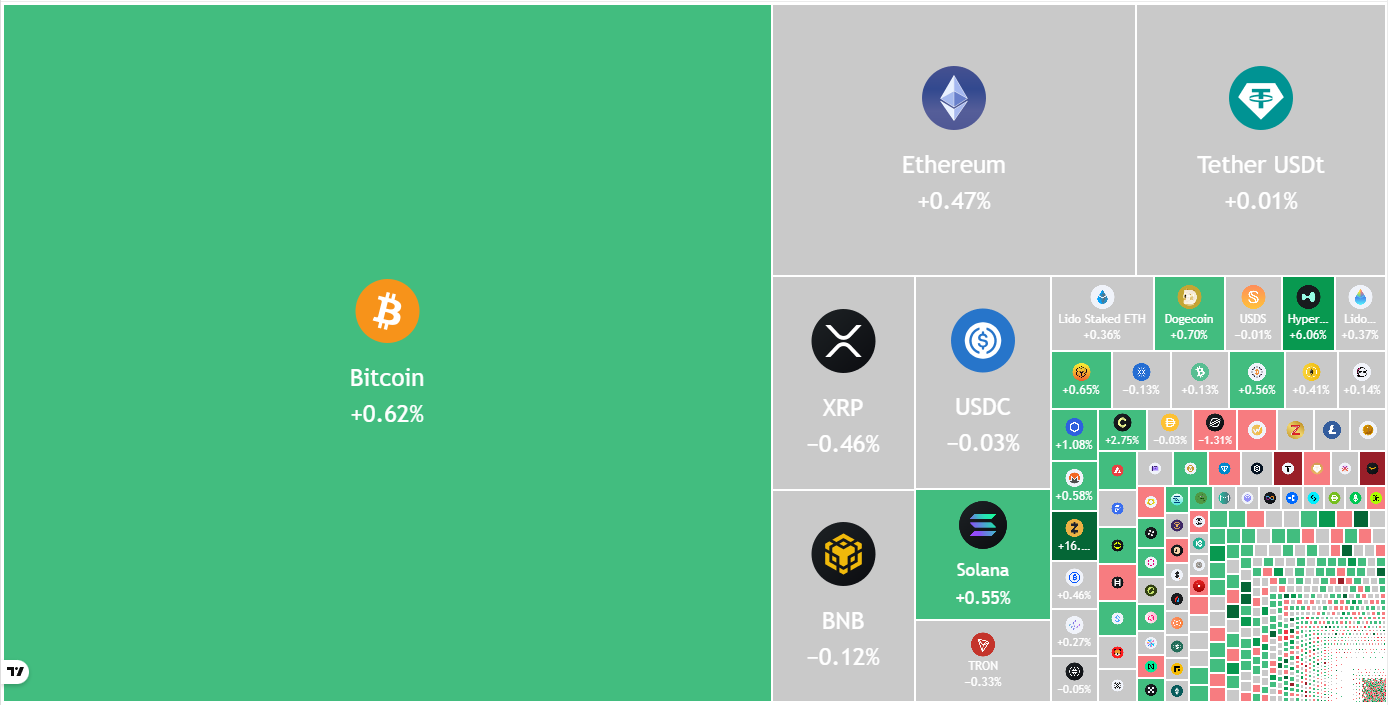
This parabolic move comes as digital assets continue to trade as the purest expression of macro risk appetite. Bitcoin (BTC) is hovering around $71,800, with a 24‑hour range roughly between $71,400 and $72,400 on close to $229.2B in combined spot and derivatives volume. Ethereum (ETH) changes hands near $2,214, up about 0.4% over the last day, with roughly $3.1B in spot volume and $54.2B in futures turnover. Solana (SOL) trades around $83, with about $0.55B in spot and $11.1B in futures volume over 24 hours.
Against that backdrop, broader crypto coverage has zeroed in on positioning and macro cross‑currents, from ETF flow whiplash to regime‑shift debates in volatility. For now, though, the tape is simple: whales have stepped back from the sell button, long‑term capital is quietly buying, and the market has a number in mind. It’s $88,000.
TLDR
- BitFuFu produced 214 BTC in March while selling 80 BTC from its treasury.
- The company’s Bitcoin holdings declined to 1,794 BTC valued at nearly $131 million.
- Previous holdings peaked at 1,959 BTC in October 2025 before decreasing.
- Hashrate dropped to 25.9 EH/s, and power capacity declined to 457 MW.
- Cloud mining contributed 171 BTC, supporting overall production stability.
A Nasdaq-listed Bitcoin miner reported lower holdings after selling part of its treasury while maintaining steady production. The firm produced 214 BTC in March and sold 80 BTC during the same period. Its total Bitcoin balance now stands at 1,794 BTC, valued near $131 million at current prices.
BitFuFu Trims Holdings While Maintaining Production
BitFuFu confirmed it produced 214 BTC in March while selling 80 BTC from reserves. The company stated that the sale aligns with its balance sheet management approach and liquidity planning.
The firm reported total holdings of 1,794 BTC after the sale, reflecting a decline from earlier levels. It had previously disclosed 1,664 BTC in late 2024 before reaching 1,959 BTC in October 2025.
Chief executive Leo Lu addressed the change and linked it to internal strategy decisions. He said the company continues to target long-term growth in Bitcoin reserves.
Lu stated, “The sale supports our balance sheet strategy while we maintain our long-term objective of increasing Bitcoin holdings.” The company emphasized that treasury adjustments follow routine financial planning.
Operations Show Stable Output Despite Lower Capacity
BitFuFu reported a slight drop in total hashrate to 25.9 EH/s during March operations. Power capacity also declined to 457 MW as older mining rigs were phased out.
The company stated that performance remained stable despite reduced capacity levels. It explained that equipment updates aim to improve long-term efficiency.
Cloud mining contributed 171 BTC to the total monthly production figure. This segment continues to form a large portion of the company’s output.
The firm said its platform adapts to changes in network difficulty and Bitcoin price movements. It added that system flexibility supports consistent production results.
Lu explained that hardware upgrades will occur over time to improve efficiency levels. He said new machines will replace older units in a phased manner.
He also stated that changes in hashrate from external partners remained within normal operating ranges. The company confirmed that these shifts did not disrupt overall output stability.

The integration marks the latest expansion of Visa’s stablecoin infrastructure, which now spans settlement, card spending, and direct on-ramp capabilities.
Nasdaq-listed fintech firm OwlTing Group (OWLS) has expanded its collaboration with Visa to integrate Visa Direct into its OwlPay payment infrastructure, creating a card-to-wallet on-ramp that lets eligible U.S. debit cardholders fund USDC transactions without needing a standalone exchange account.
The capability is now live inside OwlPay Harbor, the company’s enterprise-grade on/off-ramp layer, and is also accessible to consumers through OwlPay Wallet Pro, a self-custody digital wallet. A subsequent phase will bring the on-ramp to OwlPay Cash, the firm’s consumer remittance app.
Once funded, users can spend USDC at U.S. retailers via gift cards, transfer assets to third-party platforms, or send funds globally through settlement channels including pushes to eligible Visa debit cards, local bank accounts via the Circle Payments Network, and cash pickup through MoneyGram.
OwlTing CEO Darren Wang framed the integration as an effort to close the gap between existing card infrastructure and digital dollar rails. The company holds money transmission licenses or equivalents in 41 U.S. states as of March 2026, according to the announcement.
Visa’s Expanding Stablecoin Footprint
The partnership adds another layer to Visa’s rapidly growing stablecoin strategy.
The payments giant launched USDC settlement in the U.S. in December 2025 with Cross River Bank and Lead Bank on Solana, and in March expanded its collaboration with Stripe-owned Bridge to bring stablecoin-linked Visa cards to more than 100 countries. Visa’s stablecoin-linked card spending alone hit a $3.5 billion annualized run rate in late 2025, growing roughly 460% year over year, according to an Artemis report.
This article was written with the assistance of AI workflows. All our stories are curated, edited and fact-checked by a human.
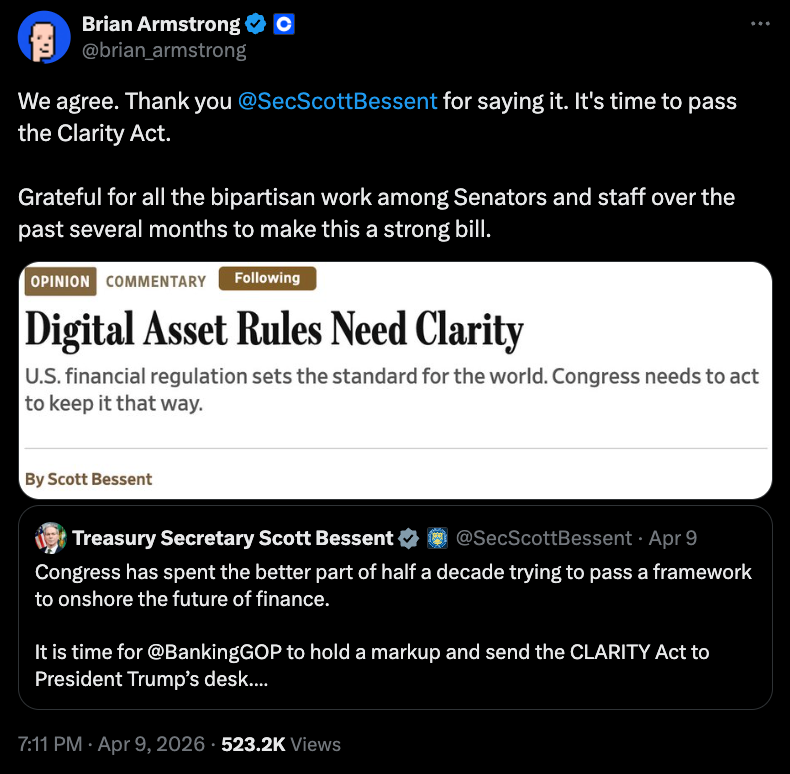
Brian Armstrong, the Coinbase CEO who withdrew the crypto exchange’s support for the Digital Asset Market Clarity Act in January, said “it’s time” for the legislation to pass after months of delays.
In a Thursday X post, Armstrong said that Coinbase agreed with comments from US Treasury Secretary Scott Bessent in a recent Wall Street Journal op-ed, in which he urged Congress to act on the crypto bill soon. According to the CEO, the current version of the legislation, after months of negotiations between lawmakers and representatives from the crypto and banking industries, was a “strong bill.”
“It’s time to pass the Clarity Act,” said Armstrong.

Armstrong’s endorsement of the bill came about three months after the CEO said that the company could not support the legislation “as written,” leading to lawmakers in the Senate Banking Committee postponing a markup on CLARITY necessary for its approval.
At the time, Armstrong said that he expected the bill to pass “in a few weeks,” but concerns over ethics, tokenized equities, stablecoin yield and other crypto-related issues have stalled progress since January.
Related: Coinbase CEO denies White House clash, says negotiations are ongoing
The expected markup for the bill in the banking committee, not scheduled as of Friday, will follow approval from the Senate Agriculture Committee in January. Both committees need to address different aspects of securities and commodities regulations before a potential vote for the CLARITY Act in the full chamber.
Coinbase legal chief Paul Grewal said last week that lawmakers were “very close to a deal” on the bill.
Is the crypto industry’s influence growing in Washington?
Since before the inauguration of US President Donald Trump, many experts have questioned the influence of the crypto industry on elections, lawmakers’ decisions and White House policies.
Executives at Coinbase and Ripple Labs have been parties to the discussions with administration officials on the CLARITY Act, and Armstrong reportedly met with the president before Trump posted a social media message calling for immediate action on crypto market structure.
The relationships may have benefited Coinbase and other companies seeking crypto-friendly laws and regulations under Trump. Last week, the Office of the Comptroller of the Currency approved Coinbase’s application for a national bank trust charter, following December approvals for Paxos, Ripple Labs, BitGo, Circle and Fidelity Digital Assets.
Magazine: Should users be allowed to bet on war and death in prediction markets?

Key Highlights
- Fair Isaac shares plummeted approximately 13% during Friday’s trading session, ranking among the S&P 500’s weakest performers
- Shares are headed toward their lowest closing level since November 2023
- FHFA’s Bill Pulte called for more affordable credit score pricing on March 24
- Missouri Senator Josh Hawley launched a formal probe into the company’s pricing strategy
- Wall Street firm Barclays reduced its price objective to $1,950 while maintaining an Overweight stance
Shares of Fair Isaac experienced a severe downturn Friday, plummeting approximately 13% to close at $954.43. This level represents the stock’s lowest closing price since it finished at $927.76 on November 6, 2023. The credit scoring giant ranked as the second-worst performer in the S&P 500 index, trailing only Akamai Technologies.
The benchmark indices painted a contrasting picture. While the S&P 500 managed a modest 0.2% gain, the Dow Jones Industrial Average slipped 0.3%. FICO’s performance clearly diverged from the broader market trend in a decidedly negative direction.
The selloff extended beyond Fair Isaac. Other credit reporting companies also faced downward pressure. TransUnion shares declined 4.2%, Equifax retreated 2.7%, and Experian similarly finished the session lower.
Regulatory concerns surrounding FICO have been mounting in recent weeks. Federal Housing Finance Agency Director Bill Pulte took to social media on March 24 to declare that both credit score and credit bureau pricing “must be more affordable.” His statement came as a response to comments made by Missouri Republican Senator Josh Hawley.
Hawley escalated the matter by announcing the commencement of a formal examination into Fair Isaac’s pricing methodology. The company has not yet issued a public statement regarding the senator’s investigation.
This type of regulatory scrutiny presents significant challenges for any stock, particularly one already experiencing downward momentum prior to the week’s events.
Wall Street Analyst Reduces Target
Adding to the regulatory concerns, Barclays released a more reserved outlook. The investment bank suggested that FICO’s strong first-quarter financial results might not be sufficient to counterbalance mounting investor anxiety regarding the company’s positioning in the artificial intelligence landscape.
Barclays adjusted its price objective downward to $1,950 from its previous forecast, though the firm retained its Overweight rating on the shares. While the bank continues to see potential for long-term appreciation, it anticipates near-term investor sentiment will remain subdued as macroeconomic uncertainty and AI-related narratives influence trading patterns.
Management’s forward guidance is likely to face heightened examination, especially considering geopolitical uncertainties that weren’t comprehensively factored into prior projections.
Year-to-Date Struggles Intensify
Fair Isaac’s performance throughout 2026 has been notably challenging. Shares have declined roughly 43% year-to-date, with March alone accounting for a 24% drop. Friday’s decline marks the fifth consecutive monthly decrease for the stock.
Daily trading volume averages approximately 337,499 shares, and technical indicators currently signal a Sell recommendation. The company’s market capitalization has contracted to roughly $25.44 billion.
Prior to Friday’s trading action, FICO shares had already fallen around 36.57% for the year, positioning it among the S&P 500’s poorest performers in 2026.
Senator Hawley’s pricing investigation continues to progress, and Fair Isaac has not yet publicly responded to the affordability concerns articulated by both Hawley and Pulte.
TLDR
- Ethereum gained 7.12% in March 2026 while Bitcoin rose 1.83%.
- Ethereum market cap increased by 2.97% while Bitcoin declined slightly.
- ETH showed higher volatility at 62.8% compared to Bitcoin’s 49.8%.
- Exchange outflows indicated reduced selling pressure for Ethereum.
- Network activity on Ethereum increased with rising active addresses.
Ethereum advanced over Bitcoin in March 2026 as capital shifted across crypto markets. Data showed stronger price gains and rising activity on Ethereum. Analysts linked the trend to liquidity response and network usage growth.
Ethereum Gains Momentum With Price and Activity Growth
Ethereum recorded a 7.12% monthly increase while Bitcoin posted a 1.83% gain. Market data showed investors favored assets with stronger short-term movement. Analysts stated, “Ethereum responded faster to liquidity changes during March.”
At the same time, Ethereum’s market capitalization rose by 2.97% during the period. Bitcoin’s market value slipped by 0.43%, reflecting slower capital inflows. This shift pointed to active repositioning by market participants.
Ethereum’s realized volatility reached 62.8%, while Bitcoin showed 49.8%. The higher volatility indicated sharper price reactions to market conditions. Analysts described Ethereum as a “higher beta asset in the current cycle.”
Meanwhile, Ethereum maintained a strong correlation with Bitcoin near 0.94. Despite this link, Ethereum displayed larger price swings in short periods. This pattern supported its role in rapid trading strategies.
Bitcoin Trails as Capital Moves Toward Ethereum
Bitcoin continued to attract steady demand but showed limited price expansion. Its modest growth aligned with its store-of-value positioning. Analysts said, “Bitcoin remained stable but lacked short-term momentum.”
On-chain data showed Ethereum exchange outflows increased during the same period. Reduced exchange balances suggested lower immediate selling pressure. This trend indicated stronger holding behavior among participants.
Meanwhile, Ethereum network activity expanded with rising active addresses. Increased usage pointed to broader engagement across applications and services. Analysts linked this growth to DeFi and tokenization demand.
The Coinbase Premium Gap for Ethereum stayed negative but improved over time. This movement suggested a gradual return of demand from U.S. investors. Analysts noted steady recovery signals in regional trading flows.
Stablecoins and decentralized finance activity supported Ethereum’s ecosystem growth. Real-world asset tokenization also gained traction on the network. These factors reinforced Ethereum’s position as a financial infrastructure layer.

Weakest Engineer In the Room: Turn Fear Into Fuel

Families call on UK regulator to ‘find the truth’ of Air India crash amid ‘serious concerns ‘about probe

Great at gaming? US air traffic control wants you to apply


-

 Business5 days ago
Three Gulf funds agree to back Paramount’s $81 billion takeover of Warner, WSJ reports
-

 Sports6 days ago
India men’s 4x400m and mixed 4x100m relay teams register big progress | Other Sports News
-

 Business7 days ago
Expert Picks for Every Need
-

 Tech3 days ago
How Long Can You Drive With Expired Registration? What Florida Law Says
-

 Business5 days ago
No Jackpot Winner, Prize to Climb to $231 Million
-

 Politics1 hour ago
US brings back mandatory military draft registration
-

 Fashion4 days ago
Massimo Dutti Offers Inspiration for Your Summer Mood Board
-
 Sports2 hours ago
Man United discover Nico Schlotterbeck transfer fee as defender reaches Dortmund agreement
-

 Fashion3 days ago
Let’s Discuss: DEI in 2026
-

 Crypto World2 days ago
Bitcoin recovers as US and Iran Agree a Ceasefire Deal
-

 Business6 days ago
Akebia Therapeutics, Inc. (AKBA) Discusses Pipeline Progress and Strategic Focus on Kidney Disease Treatments at R&D Day – Slideshow
-

 Crypto World1 day ago
Canary Capital Files SEC Registration for PEPE ETF
-

 Politics7 days ago
The UK should not pay a penny in slavery reparations
-

 Business8 hours ago
OpenAI Halts Stargate UK Data Centre Project Over Energy Costs and Copyright Row
-

 NewsBeat7 days ago
Kemi Badenoch talks ‘spring cleaning’ Reform defections
-

 Tech4 days ago
Samsung just gave up on its own Messages app
-

 Tech4 days ago
Haier is betting big that your next TV purchase will be one of these
-
Sports7 days ago
A Kevin O’Connell Theory Can Now Be Retired
-

 Tech4 days ago
The Xiaomi 17 Ultra has some impressive add-ons that make snapping photos really fun
-

 Tech4 days ago
Gamer Restores the Original PlayStation Portal From Two Decades Ago
You must be logged in to post a comment Login