
Crypto World
Bitcoin Rebounds to $70,000 as Middle East Conflict Rages On
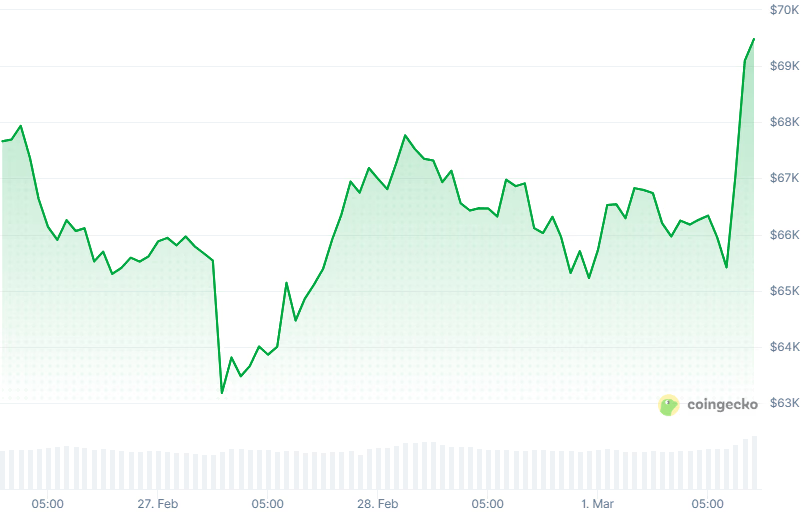
After dropping over the weekend, total crypto market capitalization is up 3.5% to $2.43 trillion.
Crypto markets are starting the week in the green despite the ongoing conflict in the Middle East, with most major altcoins posting gains.
Bitcoin (BTC) is trading at around $69,000, up nearly 5% over the past 24 hours, after reaching as high as $70,100 earlier in the day. Meanwhile, ETH and SOL are up 4% at $2,050 and $87, respectively, and BNB is up 3% on the day.

The overall crypto market capitalization is up 3.5% at $2.43 trillion, according to Coingecko.
The rebound comes after crypto markets initially sold off sharply over the weekend as the U.S. and Israel conducted a series of airstrikes against Iran, killing its head of state and high-ranking military commanders. Iran subsequently retaliated against its U.S.-allied neighbors, sparking fears of a wider war.
Most of the Top 100 digital assets posted gains over the last 24 hours.
Top gainers include Near Protocol (NEAR), MORPHO, and Ethena (ENA), which rallied 14%, 12% and 10%, respectively.
Polygon (POL) and Canton (CC) are today’s biggest losers, down around 3%.
Around 112,000 leveraged traders were liquidated for $437 million in the past 24 hours, according to CoinGlass. Bitcoin accounted for $182 million, while ETH positions made up $114 million.
Elsewhere, U.S. stocks reversed pre-market losses to trade relatively unchanged on the day, while precious metals pulled back. Gold is changing hands at $5300/oz, while silver fell 7% to $87/oz.

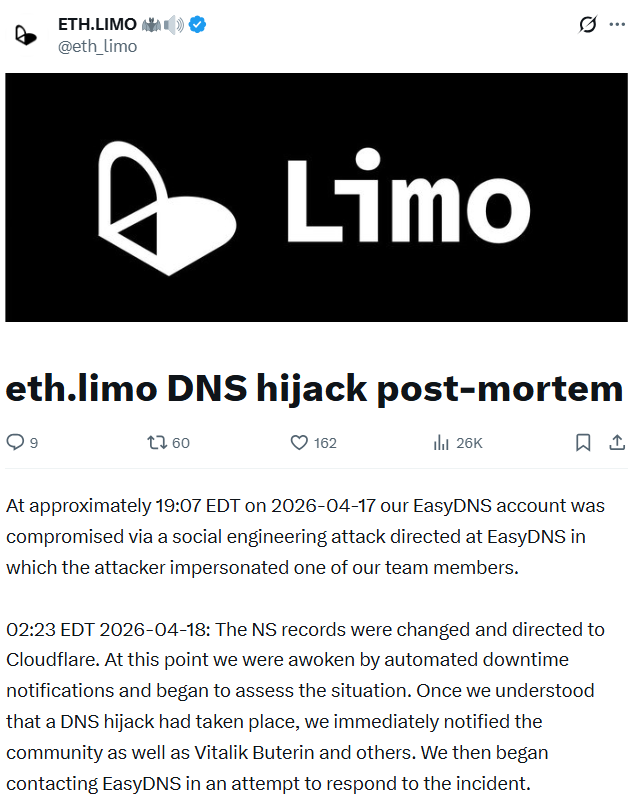
Ethereum Name Service gateway eth.limo has revealed that the domain hijacking on Friday was caused by a social engineering attack directed against EasyDNS, its domain name service provider.
According to a postmortem published by eth.limo on Saturday, an attacker impersonated one of its team members to initiate an account recovery process with easyDNS, granting access to the eth.limo account and allowing them to alter domain settings.
“The NS records were changed and directed to Cloudflare… Once we understood that a DNS hijack had taken place, we immediately notified the community as well as Vitalik Buterin and others. We then began contacting EasyDNS in an attempt to respond to the incident,” the company said.
Eth.limo serves as a Web2 bridge, providing access to around 2 million decentralized websites using the .eth domain name. Hijacking the service could allow an attacker to redirect users to malicious websites. Ethereum co-founder Vitalik Buterin warned users Friday to avoid his blog until the incident was resolved.
Mark Jeftovic, CEO of easyDNS, has publicly accepted responsibility for the incident in its own postmortem report.
“We screwed up and we own it,” said Jeftovic on Saturday.
“This would mark the first successful social engineering attack against an easyDNS client in our 28-year history. There have been countless attempts.”
Both companies have pointed to the Domain Name System Security Extension (DNSSEC) in thwarting the hacker’s attempts to do further damage.
The attacker couldn’t produce valid cryptographic signatures, so Domain Name System resolvers rejected the attacker’s forged DNS responses, causing users to see error messages instead of being redirected to malicious sites.
“DNSSEC was enabled for their domain when the attackers attempted to flip their nameservers, presumably to effect some manner of phishing or malware injection attack, DNSSEC-aware resolvers, which most are these days, began dropping queries,” Jeftovic said.

In its postmortem, eth.limo noted that because the attacker lacked the signing keys, they were unable to bypass the safeguards, which likely “reduced the blast radius of the hijack. We are not aware of any user impact at this time. We will provide updates if that changes.”
easyDNS makes changes since the attack
Jeftovic described the social engineering attack as “highly sophisticated,” and said easyDNS is still conducting a post-mortem on how the breach occurred, and has already begun rolling out changes to prevent a recurrence.

“In eth.limo’s case, we will be migrating them to Domainsure, which has a security posture more suited toward enterprise and high-value fintech domains, TLDR there is no mechanism for an account recovery on Domainsure, it’s not a thing,” he added.
“On behalf of everyone here, I apologize to the eth.limo team and the wider Ethereum community. ENS has always had a special place in our heart as the first registrar to enable ENS linking to web2 domains and we’ve been involved in the space since 2017.”
Related: RaveDAO denies manipulation as Binance, Bitget probe RAVE trading activity
The eth.limo incident is the latest in a series of domain hijackings targeting crypto projects. Days earlier, decentralized exchange aggregator CoW Swap lost control of its website after an unknown party hijacked its domain.
Steakhouse Financial, a DeFi advisory and research firm, similarly disclosed at the end of March that it had lost control of its domain to an attacker.
Prediction market platform Polymarket is reportedly in talks with investors to raise another $400 million in fresh capital, The Information reported Monday.
The $400 million raise would be made at a $15 billion valuation, The Information said, citing two people familiar with the matter.
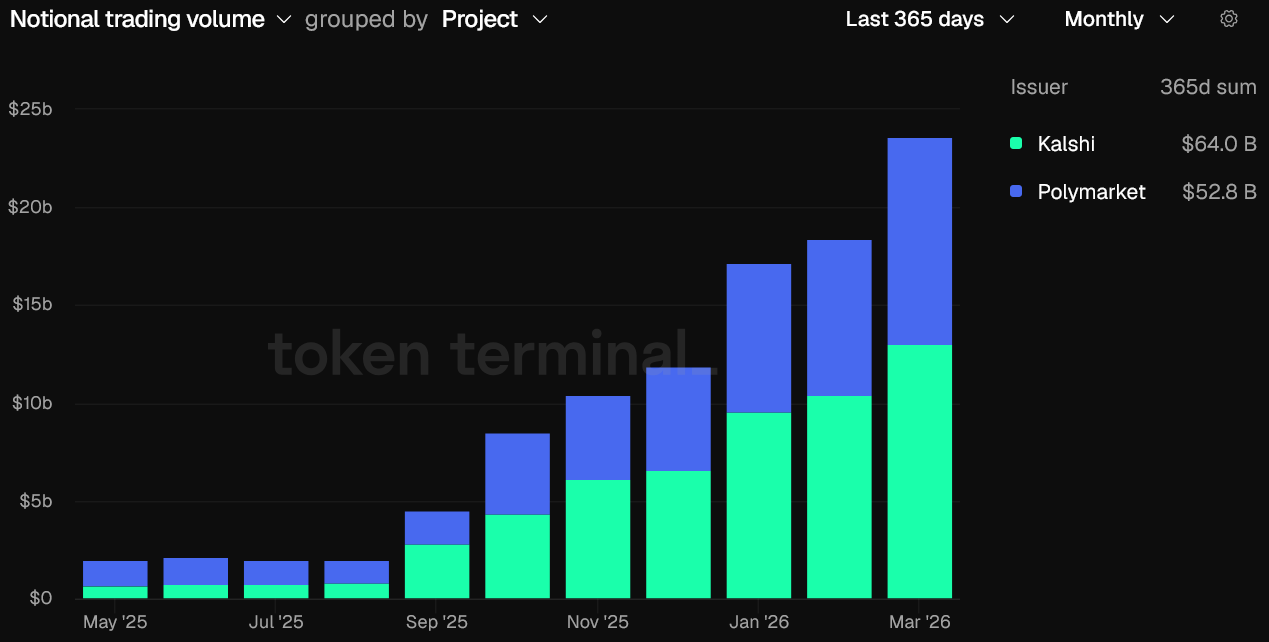
The raise would add to a wave of institutional capital flowing into the predictions market space in recent months. New York Stock Exchange parent Intercontinental Exchange (ICE) invested $600 million into Polymarket in late March, while competitor platform Kalshi’s valuation was marked at about $22 billion in its last funding round.
The Information said Polymarket is looking to add strategic investors beyond ICE in its next funding round, which could total $1 billion.
Prediction markets started booming around the time of the 2024 US election and are now consistently recording over $10 billion in monthly trading volume across markets covering everything from sports and political elections to financial results and cultural events.

With that rise has come surging institutional interest from some of Wall Street’s biggest players.
In early March, one of Nasdaq’s options exchanges, Nasdaq MRX, filed to offer cash-settled, binary-style contracts on the Nasdaq-100 index.
Cboe Global Markets is also launching a prediction market-style offering, while CME Group partnered with American gambling company FanDuel, which will enable traders to bet on markets outside of finance.
Related: Kalshi to create ‘portal for parents‘ on prediction markets: Report
Last week, TradFi firms Charles Schwab and Citadel Securities said they are also weighing a move into prediction markets.
Legal issues linger over prediction markets
Despite the rise in prediction market activity, Kalshi and others have faced regulatory scrutiny over widespread insider trading and market manipulation allegations.
Kalshi is currently engaged in a court battle with the Nevada Gaming Control Board after a lower court temporarily blocked Kalshi from operating in the state.
The state regulator argues that Kalshi’s contracts facilitate unlicensed gambling. Coinbase chief legal officer Paul Grewal has predicted that the case could reach the US Supreme Court, potentially creating precedent over the regulatory treatment of prediction markets and event-based derivatives.
Magazine: Should users be allowed to bet on war and death in prediction markets?


The International Monetary Fund (IMF) lowered its global growth forecast for 2026 to 3.1% in its April update. This marks a 0.2 percentage point downgrade from its January estimate.
The Fund noted that the latest downgrade largely reflects economic disruptions stemming from the ongoing Middle East conflict. It added that in its absence, the outlook would have instead been revised upward by 0.1 percentage point to 3.4%.
IMF Cuts Growth, Lifts Inflation Forecast in 2026
The report added that the global growth forecast for 2027 remains unchanged from the January 2026 World Economic Outlook update.
Follow us on X to get the latest news as it happens
Meanwhile, global headline inflation is expected to edge higher in 2026 before resuming its downward trajectory in 2027. It is currently projected at 4.4% this year, before easing to 3.7% in 2027.
The economic impact remains uneven across regions. Emerging markets saw their 2026 growth outlook downgraded by 0.3 percentage points. Yet, projections for advanced economies were largely unchanged.
“Crucially, there is a high degree of cross-country dispersion in the reference forecast. While the growth and inflation revisions seem relatively modest at the global level, the toll on the conflict region and more vulnerable economies elsewhere—in particular, commodity-importing emerging market and developing economies with preexisting fragilities—is much more pronounced,” the report read.
The IMF also outlined additional downside risks. In a scenario where energy prices rise more sharply and persistently, global growth could slow to 2.5% in 2026.
At the same time, inflation may climb to 5.4%. A more severe disruption, particularly involving damage to energy infrastructure in the conflict region, would deepen the impact, dragging global growth to around 2% and pushing inflation above 6% by 2027. Emerging and developing economies would be disproportionately affected again, with nearly twice the impact as advanced economies.
The IMF said its latest World Economic Outlook uses a “reference forecast” rather than a traditional baseline. This reflects the difficulty of forming stable assumptions amid ongoing uncertainty.
Subscribe to our YouTube channel to watch leaders and journalists provide expert insights
The post IMF Cuts 2026 Global Growth Forecast by 0.2 Points as Middle East War Hits Momentum appeared first on BeInCrypto.


Bitcoin is absorbing the return of Middle East risk better than oil or equities.
Bitcoin traded at $74,335 on Monday morning, down 1.6% over 24 hours but still up 4.8% on the week after the U.S. Navy seized an Iranian ship over the weekend and Tehran reimposed controls on the Strait of Hormuz.
Ether slipped 2.6% to $2,272, Solana fell 1.5% to $84, and BNB held flat at $618, with the broader top-10 showing red across the board but none of the moves breaching 3%.
Brent crude jumped 5.7% to $95.50 a barrel, European natural gas futures surged as much as 11%, S&P 500 futures fell 0.6% after Friday’s record close, and European equity futures indicated a 1.2% drop at the open. Gold fell 0.8% to $4,790, and the dollar edged up as traditional war-hedge demand returned.
The weekend flare-up reversed a three-week unwind of war risk premium. Iran had declared the Strait “completely open” on Friday, prompting the S&P 500’s record close and a broad rally across emerging markets.
By Sunday morning, Trump was threatening to destroy every power plant and bridge in Iran if negotiations fail, and Tehran was signaling it may skip a second round of talks while the U.S. maintains its naval blockade.
This is the fourth major Iran-related risk event crypto has absorbed since the conflict began, and the pattern of shrinking sell-offs continues. Earlier escalations produced sharper drawdowns in bitcoin than this one, with each successive flare-up compressing the magnitude of the crypto reaction even as oil and equities continue to price each headline fresh.
The divergence suggests crypto has largely finished pricing the geopolitical tail risk that traditional markets are still reacting to, either because holders who were going to sell on Iran headlines have already sold, or because the spot ETF bid has become a more reliable floor than the futures-driven weekend gaps that defined earlier cycles.
What traders will watch through the U.S. session is whether the 10-year Treasury yield holding near 4.27% and the dollar bid pull bitcoin lower through the risk-parity channel, or whether the equity correlation that dominated Q1 loosens on a day when the driver is explicitly geopolitical rather than macro-liquidity.
If bitcoin holds $74,000 through the European open and the Strait of Hormuz situation deteriorates further, the asset’s emerging reputation as a geopolitical shock absorber gains another data point. If the move extends below $73,000 on any incremental Iran headline, the shrinking-sell-off thesis breaks.

Geopolitical tensions surrounding the Strait of Hormuz renewed a risk-off mood across cryptocurrency markets over the weekend, pressuring Bitcoin after a brief rally earlier in the week. On Friday, Bitcoin surged above $78,300 on Coinbase — its highest level since early February — but the rally faded as broader developments escalated. By weekend’s end, BTC had retreated to the $75,000–$76,000 zone, and late Sunday slid further to briefly dip below $74,000 in the wake of a U.S. military operation in the region.
The U.S. military announced that it opened fire on and later seized an Iranian cargo ship it said was attempting to breach a blockade of Iranian ports, a move that Tehran characterized as a violation of a two-week ceasefire between the two nations. The ceasefire, which had contributed to a calmer backdrop for energy markets and crypto trading alike, is due to expire this week, with investors watching how any renewal or breakdown could influence risk assets.
As tensions escalated, Tehran signaled retaliation and reportedly rejected a new round of peace talks slated for Monday in Islamabad, citing the U.S. blockade. The combined stance from Washington and Tehran underscored the fragility of a de-escalation path, complicating the outlook for both oil and crypto markets in the near term.
The broader market backdrop reflected the tension. U.S. stock futures opened Sunday night lower, with S&P 500 futures down about 0.8%, Nasdaq-100 futures off 0.6%, and Dow futures down roughly 0.9% (around 450 points). Oil markets reacted in kind, with crude futures rising more than 4.5% and trading above $95 a barrel as supply concerns and geopolitical risk re-entered the narrative.
Crypto market sentiment also shifted. The Crypto Fear & Greed Index edged higher to 29 out of 100 on Monday, signaling a return to fear after a period of relative calm, though it remained in the cautious end of the spectrum rather than outright panic.
Bitcoin’s price trajectory over the weekend underscores how sensitive the crypto market remains to macro-driven risk factors in addition to its own supply-and-demand dynamics. The move back toward the mid-$70,000s after a weekend foray into the mid-$70k range highlighted the potential for renewed volatility should the conflict persist or escalate around Hormuz and related channels.
Cointelegraph has previously noted how macro tensions, including geopolitical flare-ups and oil price swings, have historically fed into bitcoin’s price action, offering a potential liquidity tilt during periods of global uncertainty. The current sequence — a Friday peak followed by a weekend retreat and a Sunday plunge tied to military actions — illustrates the ongoing intersection between energy markets, geopolitical risk, and crypto liquidity.
Looking ahead, the key question for traders is whether the ceasefire holds long enough for markets to re-price risk more calmly or if renewed escalation magnifies volatility. The end-date of the current two-week ceasefire looms large for both oil markets and digital assets, as any renewal terms or new conflict dynamics could reintroduce abrupt shifts in sentiment, liquidity, and hedge demand.
Analysts will also be watching how the U.S. and Iranian sides approach diplomacy in the coming days. Tehran’s rejection of new talks and its vow of retaliation, alongside the U.S. military actions, suggests that any easing in risk appetite may depend heavily on clear signals of de-escalation rather than the mere absence of headlines.
In the near term, Bitcoin and other major cryptocurrencies may continue to trade within a risk-off framework so long as geopolitical headlines dominate. Traders will likely weigh potential upside toward prior resistance levels against the risk of renewed volatility if tensions intensify or the ceasefire breaks down again. As always, liquidity, macro cues, and the evolving diplomatic calculus will shape the path forward for BTC and the broader crypto market.
What to watch next: the timing and outcome of any renewed discussions around the ceasefire, ongoing responses from both Tehran and Washington, and the corresponding reactions in oil and traditional equity markets. The coming days could reveal whether this episode marks a temporary pause in risk appetite or a more sustained shift in how investors price geopolitical risk into digital assets.
Crypto World
LayerZero blames Kelp’s setup for $290 million exploit, attributes it to North Korea’s Lazarus


LayerZero has placed responsibility for the $290 million Kelp DAO exploit on Kelp’s own security configuration, saying the liquid restaking protocol ran a single-verifier setup that LayerZero had previously warned against.
The attack used a novel vector targeting the infrastructure layer rather than any protocol code.
Attackers, whom LayerZero attributed with preliminary confidence to North Korea’s Lazarus Group and its TraderTraitor subunit, compromised two of the remote procedure call (RPC) nodes that LayerZero’s verifier relied on to confirm cross-chain transactions.
RPC nodes are the servers that let software read and write data on a blockchain, and LayerZero’s verifier used a mix of internal and external ones for redundancy.
The attackers swapped the binary software running on two of those nodes with malicious versions designed to tell LayerZero’s verifier that a fraudulent transaction had occurred, while continuing to report accurate data to every other system querying those same nodes.
That selective lying was engineered to keep the attack invisible to LayerZero’s own monitoring infrastructure, which queries the same RPCs from different IP addresses.
Compromising two nodes was not enough. LayerZero’s verifier also queried uncompromised external RPC nodes, so the attackers ran a distributed denial-of-service attack on those to force failover to the poisoned ones.
Traffic logs LayerZero shared show the DDoS running between 10:20 a.m. and 11:40 a.m. Pacific Time on Saturday. Once the failover triggered, the compromised nodes told the verifier a valid cross-chain message had arrived, and Kelp’s bridge released 116,500 rsETH to the attackers. The malicious node software then self-destructed, wiping binaries and local logs.
The attack only worked because Kelp ran a 1-of-1 verifier configuration, meaning LayerZero Labs was the sole entity verifying messages to and from the rsETH bridge.
LayerZero’s public integration checklist and direct communications to Kelp had recommended a multi-verifier setup with redundancy, where consensus across several independent verifiers would be required to confirm a message. Under that configuration, poisoning one verifier’s data feed would not have been enough to forge a valid message.
“KelpDAO chose to utilize a 1/1 DVN configuration,” LayerZero wrote, using the protocol’s term for decentralized verifier networks. “A properly hardened configuration would have required consensus across multiple independent DVNs, rendering this attack ineffective even in the event of any single DVN being compromised.”
LayerZero said it has confirmed zero contagion to any other application on the protocol. Every OFT-standard token and application running multi-verifier setups was unaffected.
The LayerZero Labs verifier is back online, and the company said it will no longer sign messages for any application running a 1-of-1 configuration, forcing a protocol-wide migration off single-verifier setups.
The architectural distinction matters for how DeFi prices LayerZero risk going forward.
A protocol-level bug would have implied every OFT token on every chain was potentially at risk. However, a configuration failure by a single integrator, combined with a targeted infrastructure attack, implies the protocol worked as designed and that Kelp’s security choices, not LayerZero’s code, created the opening.
Kelp has not yet publicly responded to LayerZero’s framing or addressed why it operated a 1-of-1 verifier setup despite the explicit recommendations against it.
Lazarus Group has been linked to the Drift Protocol exploit on April 1 and now Kelp on April 18, meaning the same North Korean unit has drained more than $575 million from DeFi in 18 days through two structurally different attack vectors: social engineering governance signers at Drift and poisoning infrastructure RPCs at Kelp.
The group is adapting its playbook faster than DeFi protocols are hardening their defenses.


Crypto protocols lost over $606 million to hacks in just 18 days of April 2026. That makes it the single worst month for exploits since February 2025.
The surge comes from two attacks on KelpDAO and Drift Protocol. Together, they account for 95% of April’s losses and 75% of 2026’s total of $771.8 million.
April 2026 Crypto Hack Losses Dwarf Q1 Combined
According to data from DefiLlama, April’s $606.2 million total across 12 incidents, it has already eclipsed the first quarter’s $165.5 million haul. That makes the month roughly 3.7 times as large as January, February, and March combined.
Follow us on X to get the latest news as it happens
| Month | Number of Hacks | Amount Lost |
| January | 12 | $100.1M |
| February | 8 | $24.2M |
| March | 15 | $41.3M |
| April (to April 18) | 12 | $606.2M |
| YTD Total | 47 | $771.8M |
Every month since February 2025 has held under $240 million, per DefiLlama’s tracker. That earlier figure was skewed by the $1.4 billion Bybit breach, which drove February 2025’s total to $1.466 billion.
April 2026’s losses arrived without any headline exchange hack of that size. The pattern shows how quickly attackers pivoted to Decentralized Finance (DeFi) infrastructure.
BeInCrypto reported that KelpDAO lost over $290 million on April 18, now the year’s largest single hack. Drift Protocol sits just behind at $285 million.
The damage has stacked up in recent days. Incidents at Vercel, Hyperbridge, Grinex Exchange, and Rhea Finance have piled in 2026.
“None of these accounts for the collateral damage seen across TVL, user trust, valuations, and the space’s morale. DeFi remains a niche market until risk can be properly priced; at this time, we’re far from it,” an anlyst wrote.
DeFi TVL Slides as Sentiment Cracks
DeFi total value locked (TVL) fell by more than 7% over the past 24 hours following the Kelp exploit. Aave alone dropped from $26.4 billion to near $17.9 billion.
“Every protocol is taking a hit now,” analyst Ted Pillows wrote.
Hack frequency is also climbing sharply. DeFi recorded 47 incidents in the first 4.5 months of 2026, compared with 28 over the same period in 2025. That works out to a roughly 68% year-over-year rise.
The reactions point to rising concern that DeFi’s risk pricing has not caught up with infrastructure-layer exploits. Dollar losses sit below 2025’s Bybit-skewed pace, yet incidents keep stacking. The next few weeks will show whether DeFi can tighten security before April’s trend defines the year.
The post April 2026 Becomes Worst Month for Crypto Hacks Since February 2025 appeared first on BeInCrypto.


The decentralized finance (DeFi) ecosystem is experiencing a sharp capital outflow following the weekend exploit of the KelpDAO protocol.
Leading DeFi lending platform Aave has lost $8.45 billion in deposits over the past 48 hours, driving a broader $13.21 billion decline in total value locked (TVL) across DeFi. TVL refers to the combined dollar value of crypto assets deposited across DeFi protocols, such as Aave, and is widely used as to measure liquidity and overall market activity.
Total value locked across DeFi fell from $99.497 billion to $86.286 billion, while Aave’s TVL declined by $8.45 billion to $17.947 billion over the same period, according to DefiLlama. Protocol-level data shows double-digit percentage drops across platforms, including Euler, Sentora, and Aave, with losses concentrated in lending, restaking, and yield strategies tied to the affected collateral.
The move stems from a $292 million exploit of Kelp’s bridge that allowed attackers to use stolen rsETH, a liquid re-staking token widely used in DeFi, as collateral to borrow funds on lending platforms.
Because these stolen tokens lacked legitimate collateral backing, borrowing against them created potential shortfalls for lenders. It’s similar to conning a traditional bank by depositing fake fiat and taking out loans against it, ultimately leaving the lender with bad debt.
Protocols responded by freezing affected markets, while panicked users withdrew funds, leading to a broad decline in total value locked.
Token prices have moved less sharply than deposits. The AAVE token is down about 2.5% over 24 hours, while UNI and LINK are down less than 1% over the same period, according to CoinDesk market data.
Peter Chung, head of research at Presto Research, said in a note the incident highlights risks in cross-chain infrastructure, particularly in verification systems used by bridges.
Early analysis suggests the issue may have originated in the verification layer rather than in smart contracts themselves.
Chung added that the episode also shows how interconnected DeFi protocols can transmit shocks beyond the initial point of failure, with withdrawal activity and market freezes extending to platforms without direct exposure to the exploit.
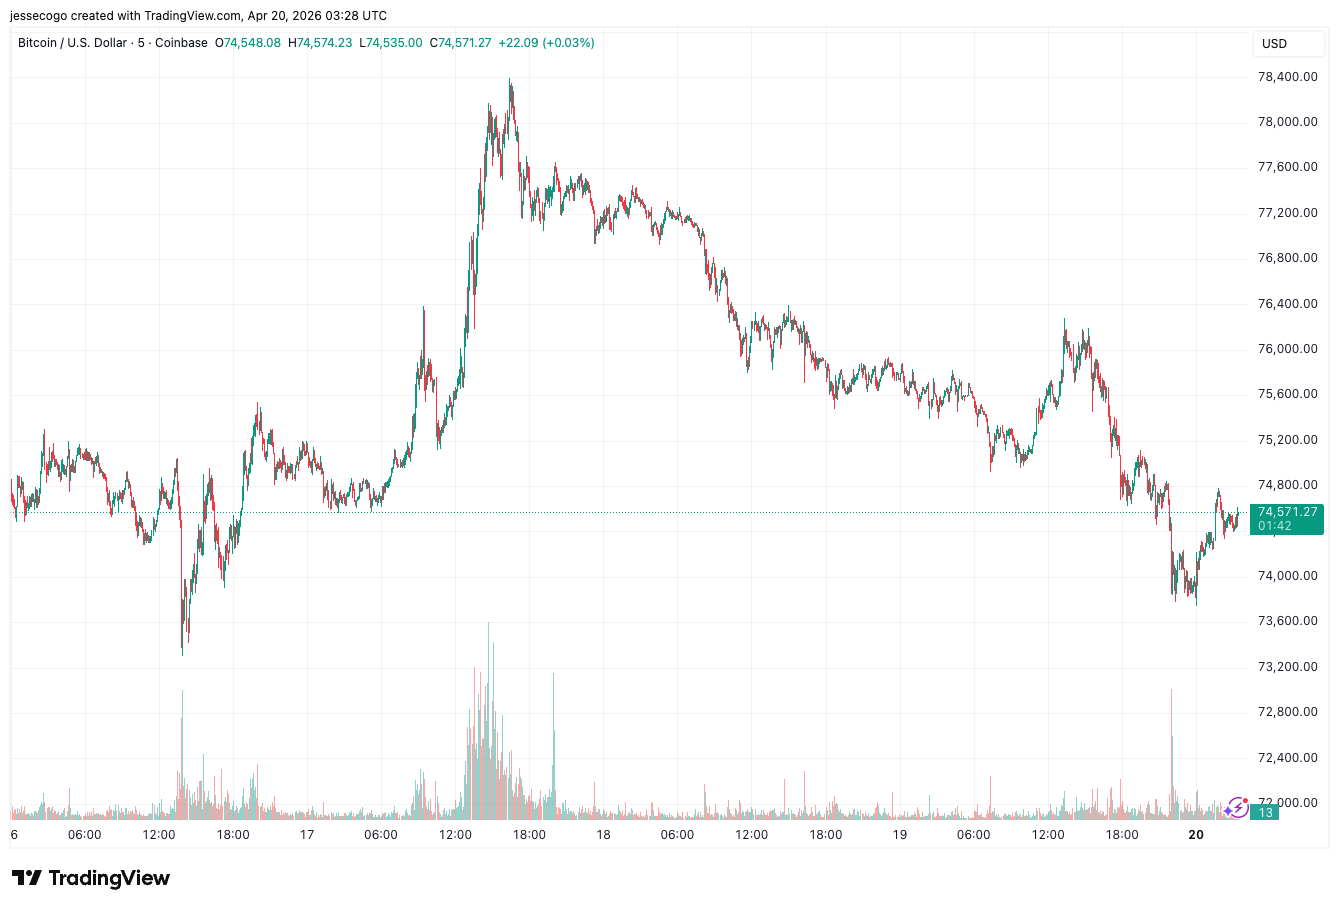
Bitcoin erased its weekend gains as it fell below $74,000 on Sunday after the US military seized an Iranian cargo ship, putting pressure on a ceasefire between the two countries.
Bitcoin (BTC) had soared above $78,300 late Friday on Coinbase, its highest price since early February, but dropped to between $75,000 and $76,000 over the weekend after Iran said it would close vital oil routes in the Strait of Hormuz.
The cryptocurrency then sank sharply late on Sunday to briefly trade below $74,000 after the US military said it opened fire on, and later seized, an Iranian cargo ship it claimed tried to run its blockade of Iranian ports, with Tehran accusing the US of violating an agreed ceasefire.
The two-week ceasefire between the US and Iran, which had helped boost the markets and temper oil prices, is set to end on Wednesday.

Tehran has vowed to retaliate over the US military’s seizure of the ship and has rejected a new round of peace talks slated for Monday in Islamabad, Pakistan, due to the US blockade, Iranian state media reported.
Related: Bitcoin eyes $90K as whales absorb 20x daily BTC supply in 30 days
US stock futures sank Sunday night amid rising tensions, with S&P 500 futures dropping 0.8%, Nasdaq-100 futures falling 0.6% and Dow Jones futures declining 0.9%, or about 450 points.
Oil futures also soared amid the hostilities and Iran’s threat to close the Strait of Hormuz, with crude oil futures rising over 4.5% to over $95 a barrel.
The Crypto Fear & Greed index rose by two points to a score of 29 out of 100 on Monday, its highest score since late January, but which still indicated a sentiment of “fear.”
Magazine: Bitcoin will not hit $1M by 2030, says veteran trader Peter Brandt
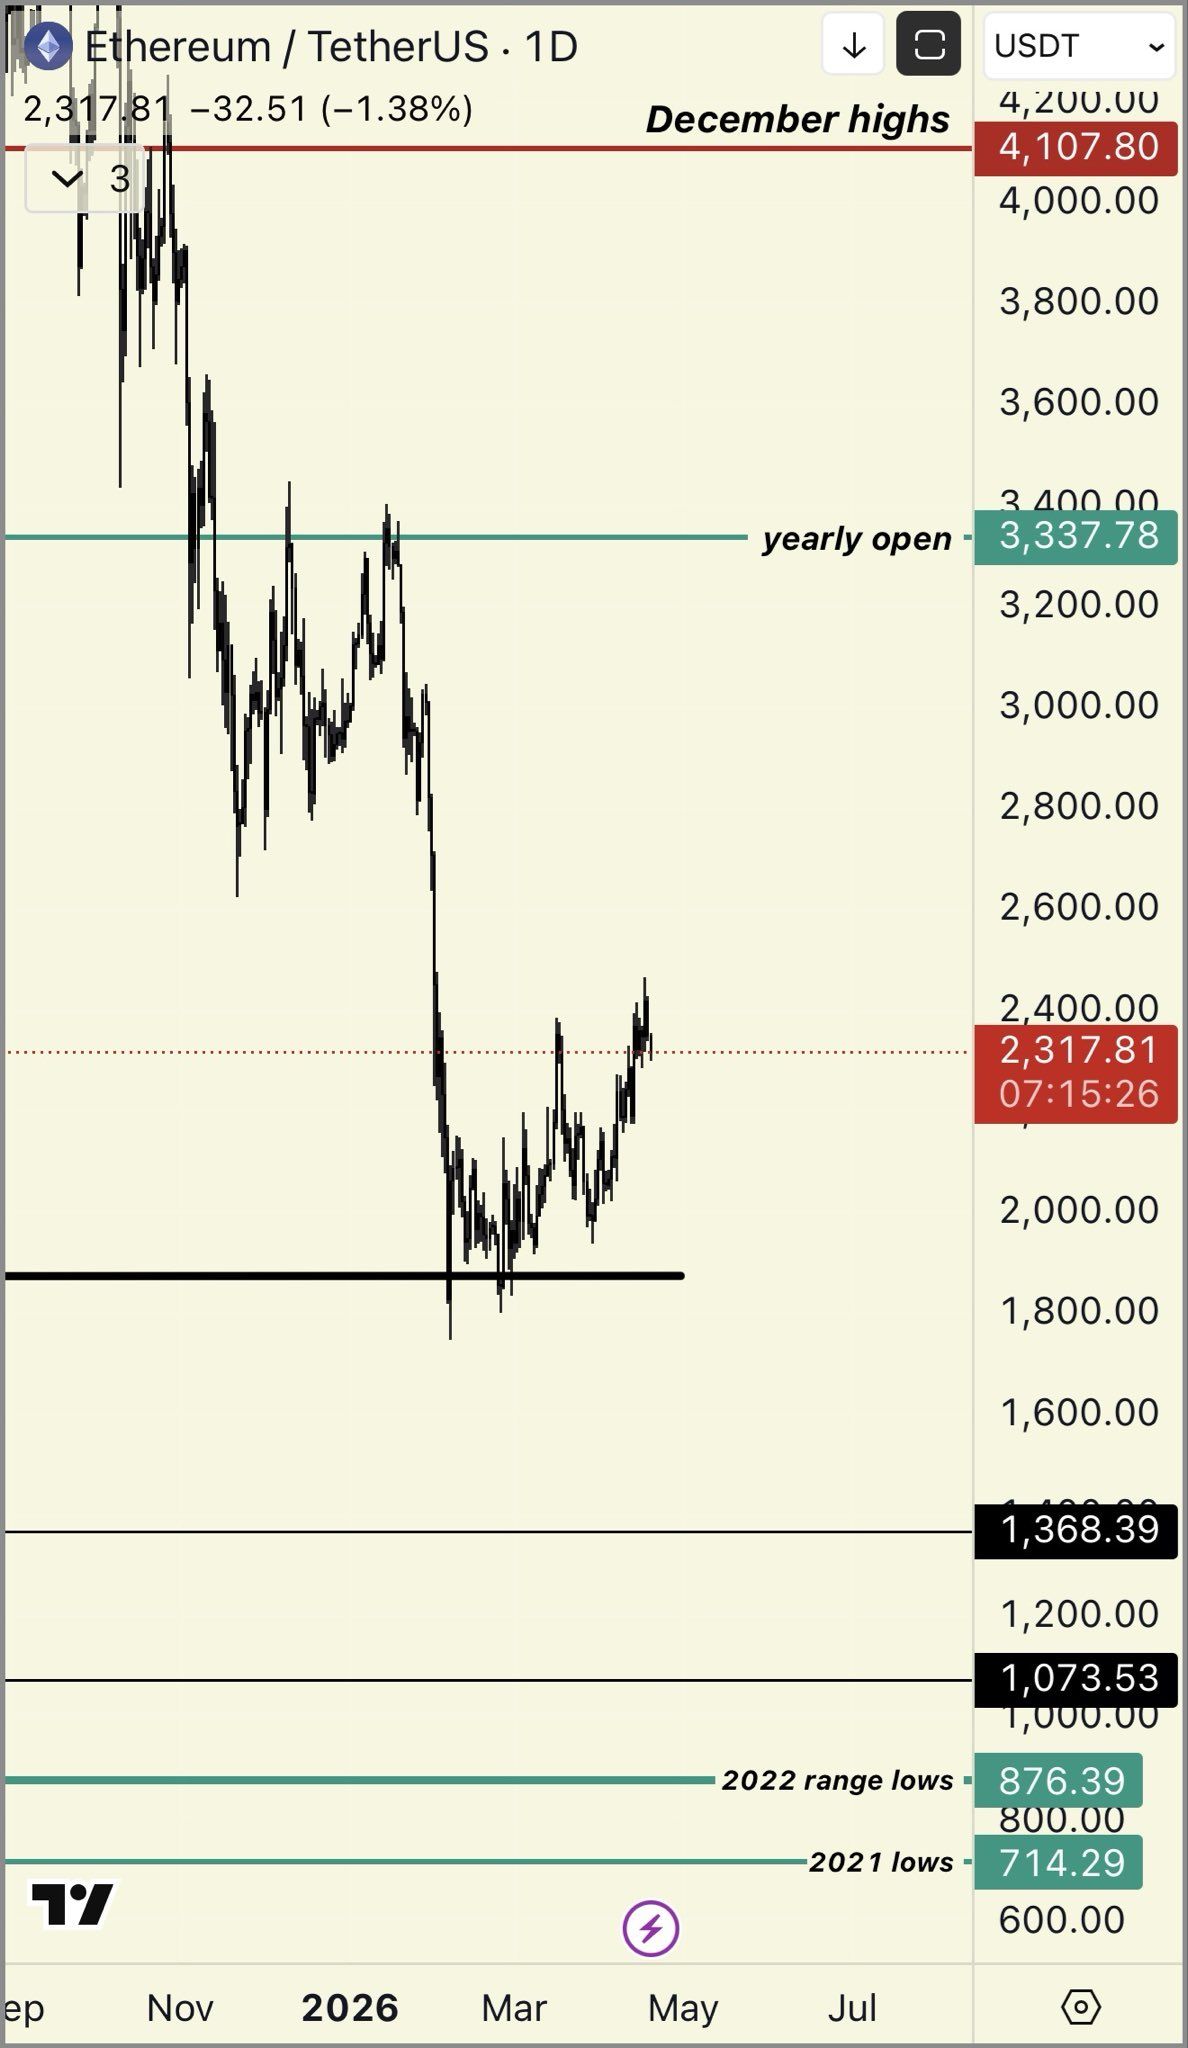
Crypto analyst Ansem argues that Ethereum (ETH) is in a “worse spot” in 2026 than it was in 2023, pointing to a thesis he says has been eroding for years.
His bearish take drew rebuttals from some members of the community. Meanwhile, on-chain activity and technical indicators elsewhere on the network flash bullish signals.
Ansem Lists Cracks in the ETH Thesis
Ansem argues that Solana (SOL) has dominated retail activity this cycle. Hyperliquid has taken the lead in perpetual futures trading, while rollups have failed to gain traction.
He also noted that Vitalik Buterin “publicly abandoned” the general-use rollup thesis. The ongoing Aave (AAVE) situation around the KelpDAO rsETH exploit, Ansem said, is a mark on Ethereum’s core value proposition of “safety + security of defi & insto interest.
“ETH thesis has been weakening consistently for years,” the analyst wrote. ETH in 2026 is in a worse spot than it was in 2023, amplified by AI doing extremely well & tech stocks being much more favorable investments with real revenues / emerging narratives / increasing momentum, ETH is a $300B asset with a ton of overhang from Tom Lee topblasting + complacent ETH holders sitting idle in defi protocols.”
Follow us on X to get the latest news as it happens
Technically, the analyst noted that ETH remains in a sustained downtrend after failing to break multi-year resistance. He projected that the second-largest cryptocurrency could slip to 2025 lows near $1,300 and to the bear-market lows from 2022.
“Tight invalidation 2377 assuming problems worsen if you want to play it loose assuming other risk assets continues doing well & drags it up probably somewhere around 2700/2800 invalidation fundamentals wise would want to see breakout activity from some new vertical,” the post read.

Community Members Push Back
The take triggered notable pushback. Ryan Berckmans accused Ansem of not understanding fundamentals. Leo Lanza went further, sharply dismissing the analyst’s bearish case on X.
Another user pointed to a 56% drop in the SOL/ETH pair this cycle.
“Soleth is down 56% after being up 12x+ *this cycle* because one guy decided to buy 5% of the eth supply after it had underperformed all cycle. idk why you guys act like i dont also bearpost solana i havent posted anything bullish about sol in over a year,” Ansem replied.
Not everyone shares the bearish view on Ethereum. BeInCrypto recently highlighted that network activity remains strong, while technical indicators like the Rainbow Chart and MACD are also flashing bullish signals.
With macro and geopolitical uncertainty still in play, the question is whether ETH slides further this year or stages a renewed rally.
Subscribe to our YouTube channel to watch leaders and journalists provide expert insights
The post Ansem Says Ethereum Is in a Worse Spot Than 2023 as Thesis Weakens appeared first on BeInCrypto.

Woman arrested at LAX on Iranian arms trafficking charge

Is Mediacom Internet Down Now? Frustrated Customers Report Ongoing Reliability Issues

Elena Rybakina’s Porsche vs Ben Shelton’s BMW: Comparing the massive value of new cars duo won this weekend


![Crypto Leverage Shocker: $61B Risks EXPOSED [Full Report]](https://wordupnews.com/wp-content/uploads/2026/04/1776665179_maxresdefault-80x80.jpg)


-

 Crypto World6 days ago
The SEC Conditionalises DeFi Platforms to Be Avoided for Broker Registration
-

 Fashion3 days ago
Weekend Open Thread: Theodora Dress
-

 NewsBeat6 days ago
Trump and Pope Leo: Behind their disagreement over Iran war
-

 Crypto World6 days ago
SEC Signals Exemption for Crypto Interfaces From Broker Registration
-

 News Videos5 days ago
Secure crypto trading starts with an FIU-registered
-

 Sports3 days ago
NWFL Suspends Two Players Over Post-Match Clash in Ado-Ekiti
-

 Crypto World6 days ago
SEC Proposes Certain Crypto Interfaces Don’t Need to Register as Brokers
-

 Business15 hours ago
Powerball Result April 18, 2026: No Jackpot Winner in Powerball Draw: $75 Million Rolls Over
-

 Politics2 days ago
Palestine barred from entering Canada for FIFA Congress
-

 Crypto World2 days ago
Russia Pushes Bill to Criminalize Unregistered Crypto Services
-

 Sports7 days ago
NWFL opens Pathway for new Clubs ahead of 2026 Season
-
 Business3 days ago
Creo Medical agree sale of its manufacturing operation
-
 Entertainment6 days ago
Brand New Day’ Footage Reveals the Devastating Impact of ‘Now Way Home’
-

 Politics20 hours ago
Zack Polanski demands ‘council homes not luxury flats for foreign investors’
-

 Crypto World7 days ago
Trump whales load up ahead of Mar-a-Lago luncheon.
-
Business7 days ago
Kering slides after Morgan Stanley downgrade, Gucci woes loom
-

 Tech7 days ago
Apple glasses won’t go brand shopping like Meta did with Ray-Ban and Oakley
-

 Tech7 days ago
Google adds E2E encryption to Gmail for iOS and Android enterprise users
-
 Tech5 days ago
Microsoft adds Windows protections for malicious Remote Desktop files
-
Entertainment7 days ago
How Euphoria Season 3 Premiere Paid Tribute to Eric Dane After Death
You must be logged in to post a comment Login