Crypto World
Bitcoin Risks 7% Dip to $72K as BTC Demand Weakens and Bears Return

Bitcoin (BTC) has fallen 6.5% from its recent high above $82,000, as a bearish technical structure, weakening demand, and increasing sell pressure now point to the risk of further losses ahead.
Key takeaways:
- BTC price risks a drop toward $72,000 as bearish momentum strengthens on higher time frames.
- Binance BTC inflows tripled in under two weeks, signaling rising sell pressure and weaker investor confidence in the market.
- Bitcoin’s apparent demand fell to 2026 lows, raising risks of deeper losses if spot demand fails to recover in the coming weeks.
Bitcoin bears eye BTC price drop to $72,000
Bitcoin’s failure to hold above key support levels suggested buyers were unable to sustain the upward momentum.
“$BTC has officially lost the 100 & 50d EMA,” analyst CryptoJelleNL said in a recent post on X, adding:
“The local market structure is back to bearish.”
“Bitcoin lost its bullish impulse exactly when macro sharply deteriorated,” fellow analyst Axel Adler Jr said in a Sunday X post, adding:
“The market looks risk-off, and every BTC bounce remains unconfirmed.”
The rejection at $82,000 coincided with the upper trend line of an ascending parallel channel, which has capped BTC’s price action since early February.
The chart below shows that every time the price has been rejected from this trend line, it has lost between 11%-14% of its value, dropping toward the lower support trend line.
If this price behaviour continues, Bitcoin will fall toward the lower boundary of the channel at $72,000, which is 13% below the upper boundary and a 7% drop from the current price.
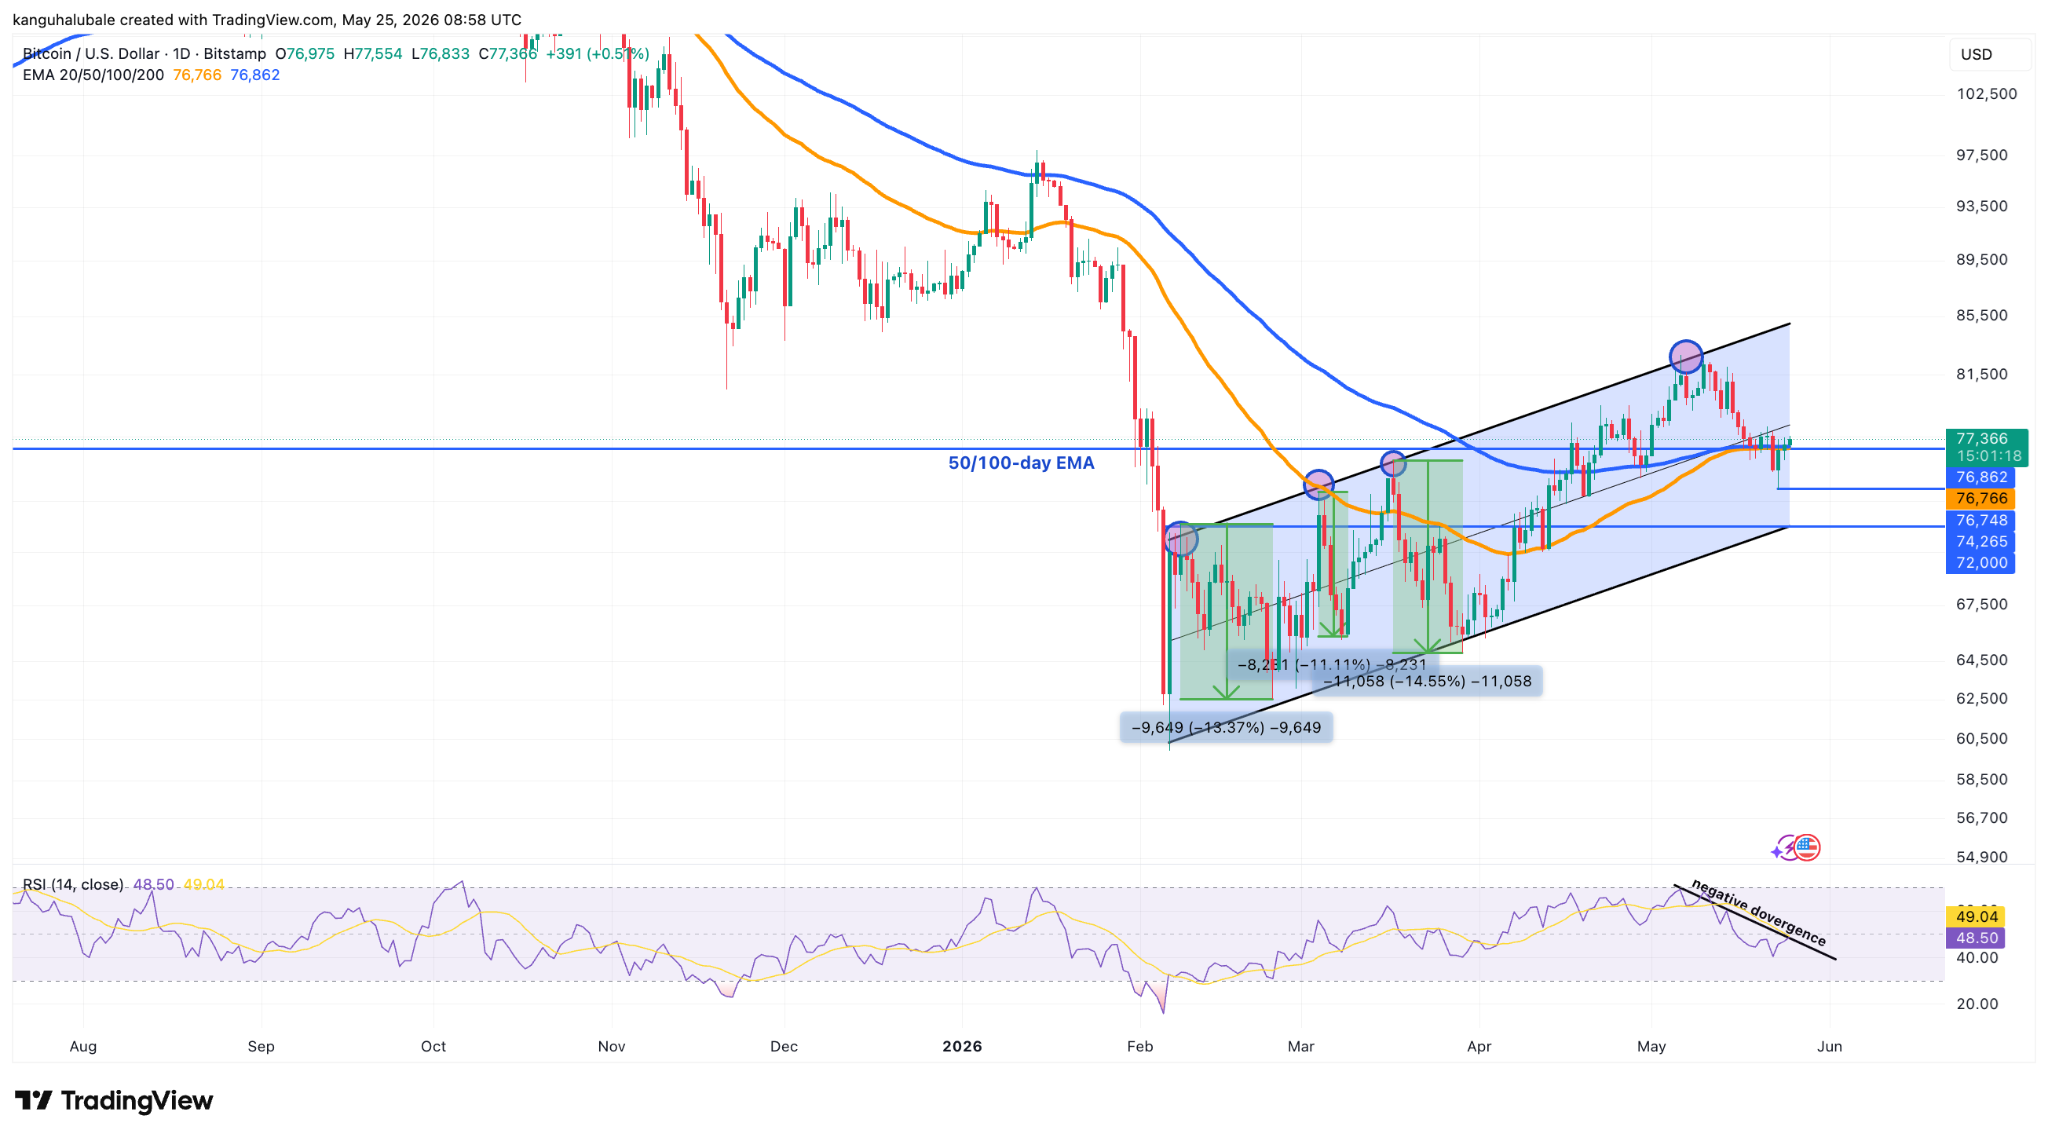

BTC/USD daily chart. Source: Cointelegraph/TradingView
Meanwhile, the relative strength index has dropped to 48 from near overbought conditions at 69 on May 6, suggesting increasing downward momentum.
“Bitcoin briefly dipped as low as $74.1K, sweeping the May VCPR liquidity zone before seeing a quick reaction,” trader and analyst Anup Dhungana said in his latest analysis on X, adding:
“Losing this support area could send $BTC swiftly back toward the $70K region, while holding it keeps the door open for another recovery attempt.”
MN Capital founder Michael van de Poppe shared a chart showing that if the “crucial” support zone between $75,000 and $76,000 is lost, the price could retreat toward the next lines of defense at $74,000 and $71,400, before potentially retesting the 2026 lows at $60,000.
On the other hand, Van de Poppe said BTC/USD could break to “higher grounds” above $80,000 if “there’s going to be a peace deal in the Middle East” in the coming days.
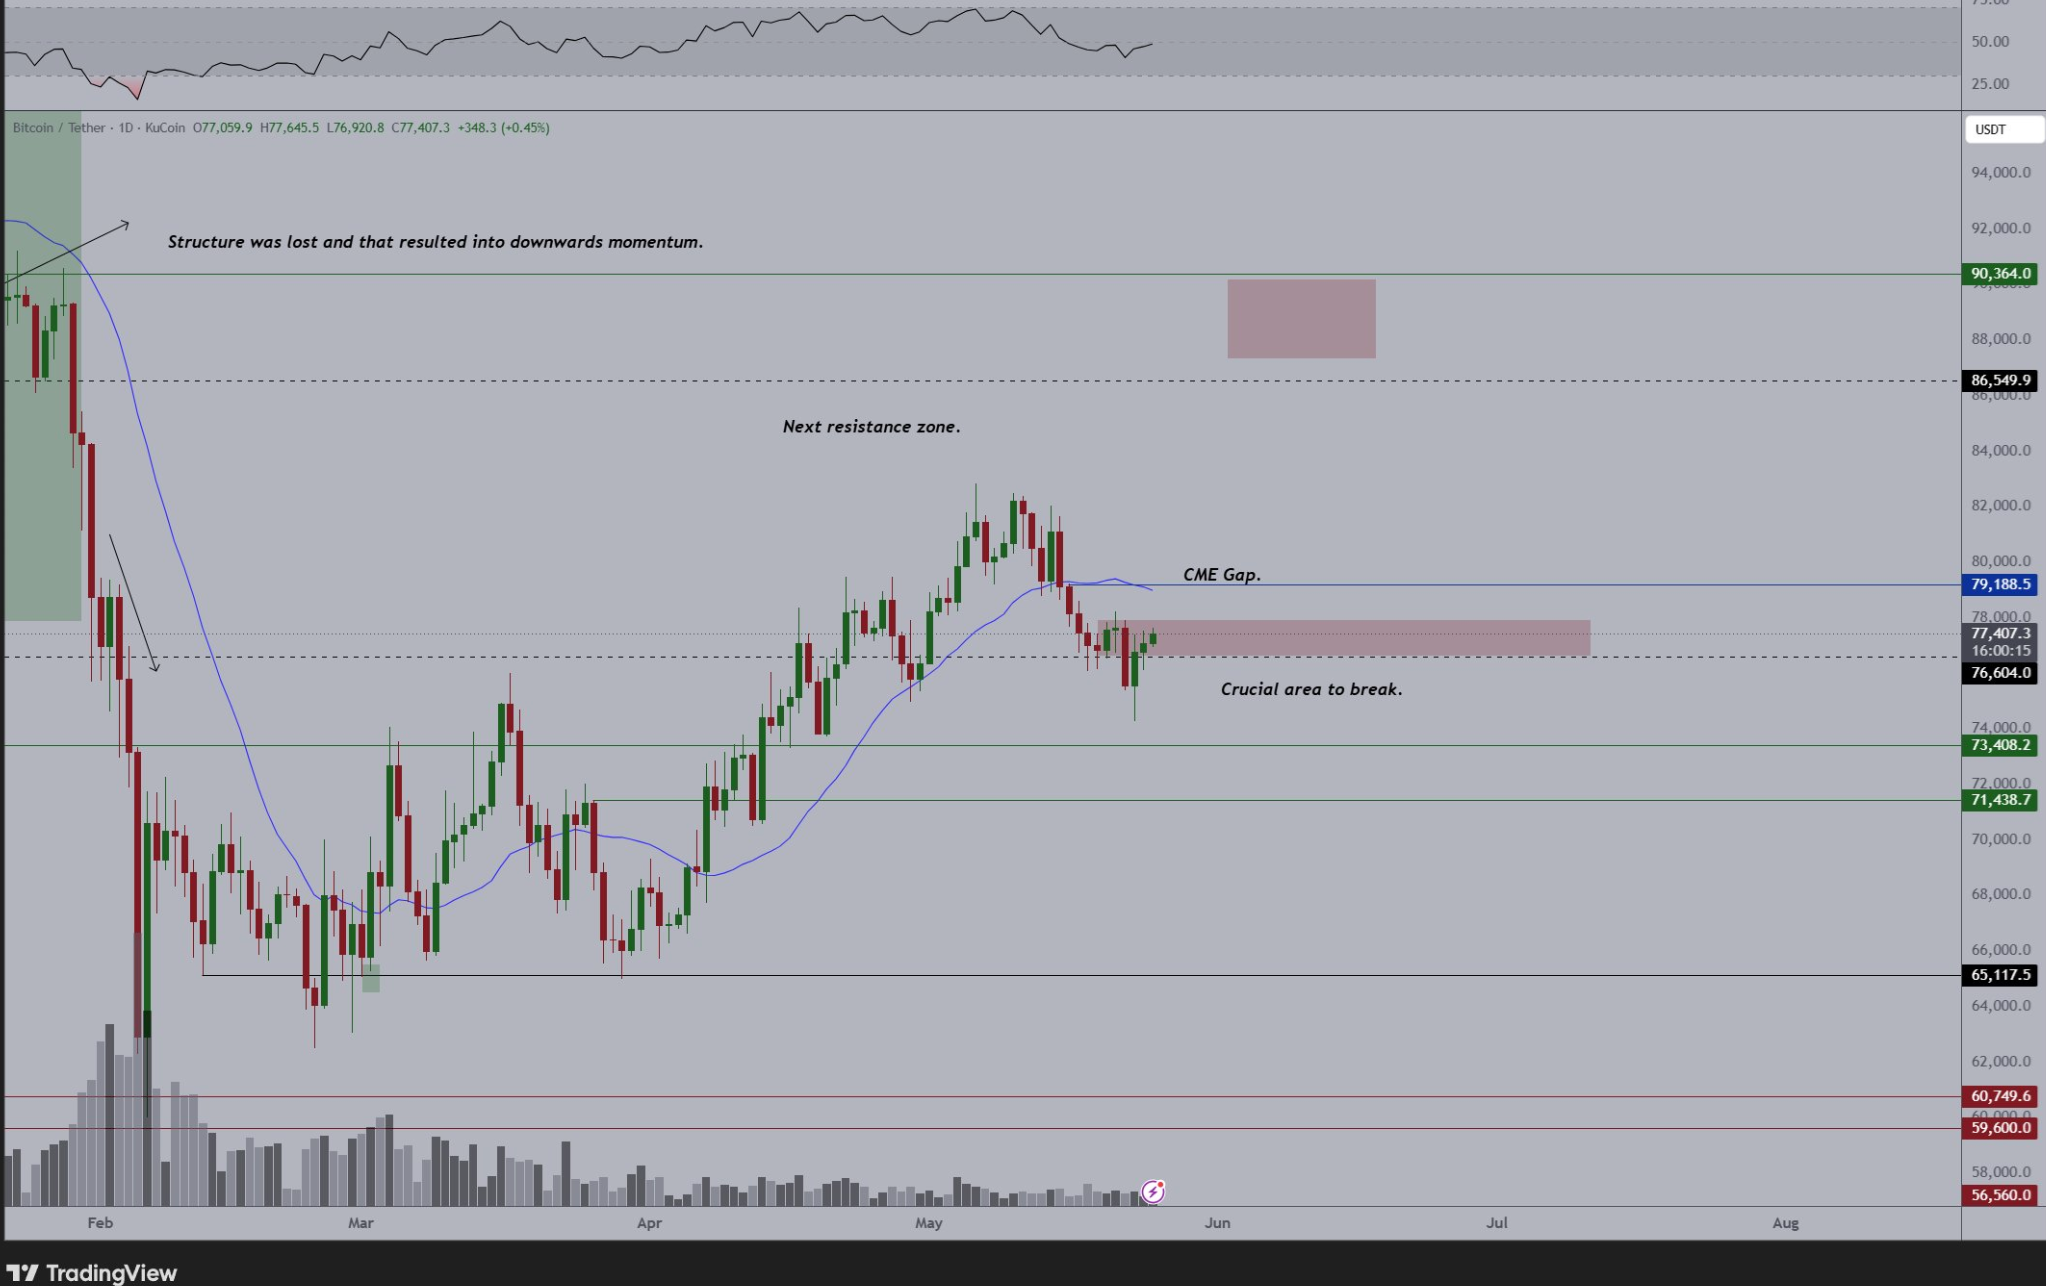

BTC/USD daily chart. Source: X/Michael van de Poppe
As Cointelegraph reported, the $76,000 level is the critical level to watch, as a close below it would increase the risk of a drop to the multi-month support line around $72,000.
Bitcoin apparent demand hits 2026 lows
Bitcoin’s “warning is flashing” after its Risk Index re-entered “high-risk” territory, according to private wealth manager Swissblock.
“That doesn’t confirm breakdown yet,” Swissblock said in a recent X post, adding:
“But it confirms that selling pressure is no longer being fully absorbed.”
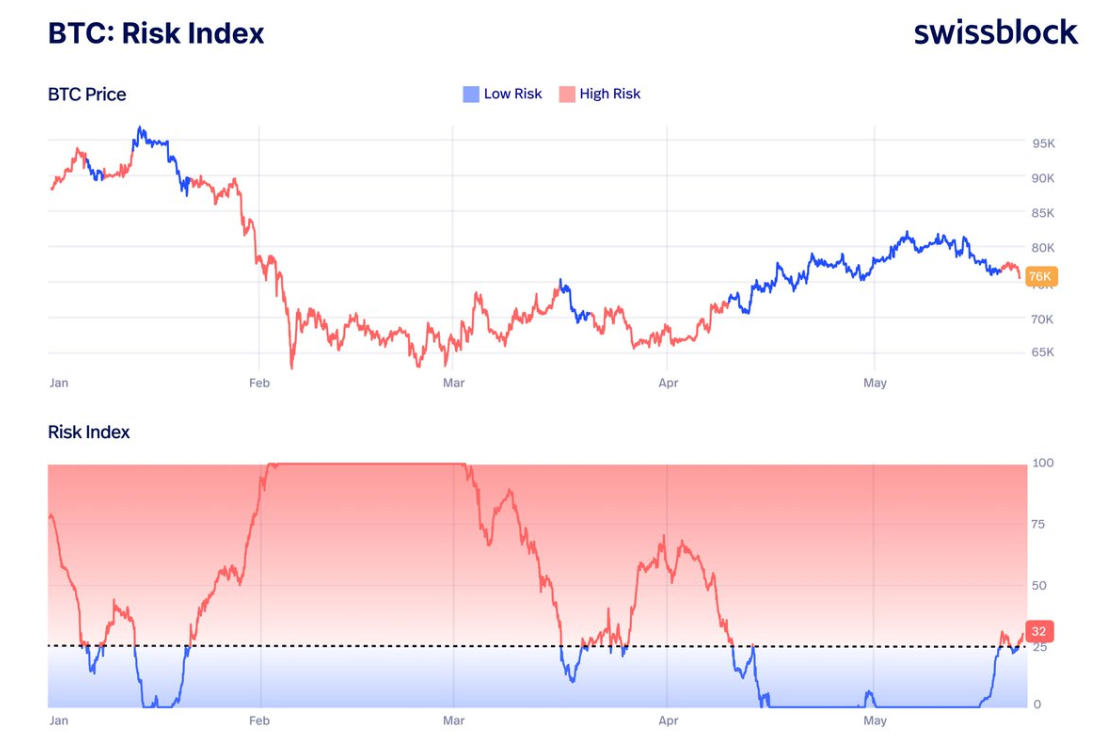

Bitcoin risk index. Source: Swissblock
That high-risk signal also aligns with increasing selling pressure on exchanges, with Binance recording nearly 10 straight days of net BTC inflows. The weekly average inflows rose to 1,190 BTC from 378 BTC on May 16, marking a more than threefold increase in less than two weeks.
“When inflows become dominant and consistent on a platform like Binance, this is traditionally interpreted as a potential sell signal,” CryptoQuant analyst Darkfost said in a QuickTake note on Monday, adding:
“Holders transferring their BTC to an exchange most often do so with the intent to sell, whether it be profit taking, reducing exposure, or a more defensive repositioning.”
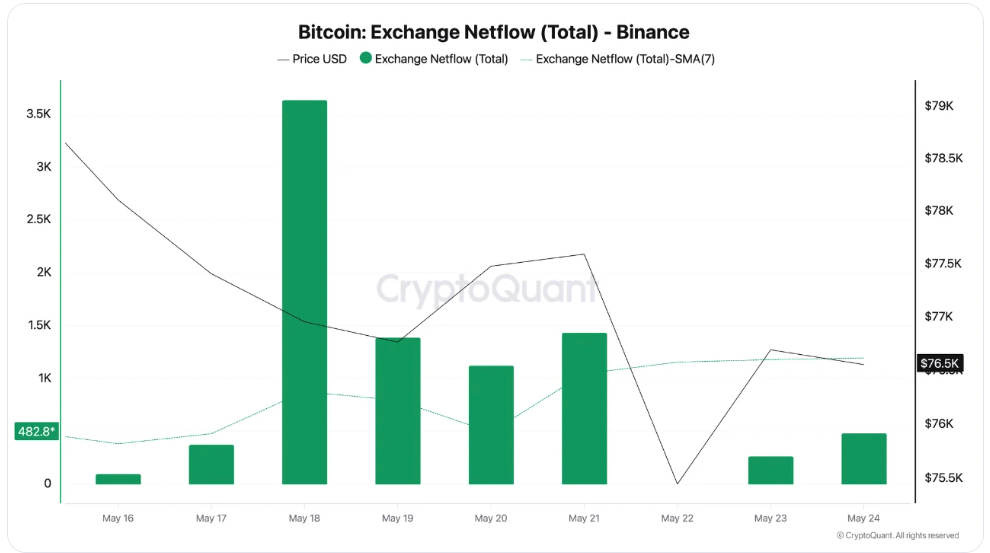

Binance exchange’s Bitcoin net flow. Source: CryptoQuant
Meanwhile, Bitcoin’s apparent demand has fallen to around -147,000 BTC, its most negative level since the start of the year and the weakest reading since December 2025.
“This development suggests that demand continues to gradually contract,” Darkfost said in an X post on Sunday, adding:
“Without a meaningful recovery in spot demand, it becomes difficult to imagine Bitcoin sustaining a durable rally.”
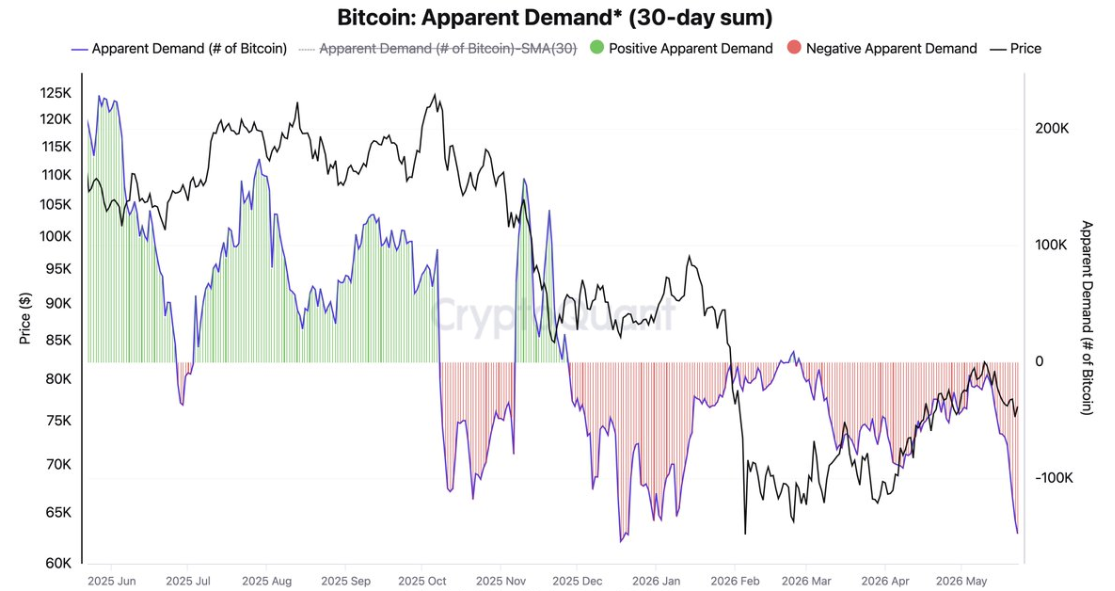

Bitcoin’s apparent demand. Source: CryptoQuant
The last time this metric was this low was in December 2025, before another 33% drop to multi-year lows below $60,000 was reached on Feb. 6.
As Cointelegraph reported, Bitcoin’s weakening demand and increasing spot ETF outflows have raised the risk of prolonged consolidation or a drop toward $65,000 in the short to medium term.
You must be logged in to post a comment Login