
Crypto World
Bitcoin Short-Term Holders Win Streak as Bull Signs Rise


Bitcoin’s rebound narrative is getting a data point that historically shows up before stronger upside attempts: short-term holders (STHs) appear to be keeping at least part of their paper gains rather than flipping back into losses.
According to onchain analysis from CryptoQuant, Bitcoin wallets holding coins for less than six months have maintained partial profitability for nearly a month, marking the longest consecutive in-profit stretch of 2026. At the same time, the broader Bitcoin investor base has remained in net profit since Aug. 19, suggesting the market’s cost-basis landscape is improving rather than merely bouncing off support.
Key takeaways
- CryptoQuant says STHs have spent roughly 30 straight days in at least partial profit, the longest such run in 2026.
- STH profitability is measured as $168.2 billion in profit versus $102.6 billion in losses, with gains currently outweighing drawdown.
- CryptoQuant frames sustained STH profitability as a prerequisite for a more durable reversal in Bitcoin’s trend.
- STH profitability is being supported particularly by wallets in the one-to-three-month age band, with higher realized cost bases toward the three-to-six-month cohort.
Why short-term holder profitability matters
CryptoQuant’s analysis focuses on the behavior of STHs—wallets that still hold unspent transaction output (UTXO) for less than six months. In practice, these holders are often more responsive to recent price moves: they tend to buy and sell in shorter cycles, making their profit-and-loss state sensitive to market volatility.
The key observation from the data is persistence. CryptoQuant reports that since Aug. 16, the STH cohort has been split between coins in profit ($168.2 billion) and coins below acquisition price ($102.6 billion), but the overall period qualifies as an extended in-profit stretch. Even CryptoQuant emphasizes that the absolute profit-versus-loss ratio is less important than the fact that STHs have maintained at least some profitability continuously for about 30 days.
In an accompanying CryptoQuant blog post, the firm argues this is the first time STHs have held profit territory for a sustained period since the market top. CryptoQuant also points to prior cycles—most notably an earlier January episode that was shorter than a week, and a May period where losses dominated—to frame how unusual the current streak appears.
CryptoQuant’s broader claim is that longer stretches of STH profitability have historically preceded the kind of trend reversal traders look for after bear-market phases. The firm ties the setup to market recoveries across Bitcoin’s prior cycles and cites observations from the end of the 2022 bear market.
Profit persistence across the broader investor base
The short-term picture is reinforced by a wider investor-level profitability condition. Cointelegraph’s earlier market coverage noted that the spent output profit ratio (SOPR)—which tracks net profit or loss for investors spending coins—crossed above breakeven at SOPR level 1 on Aug. 19 and has stayed narrowly above it since.
While SOPR and STH profitability are not identical metrics, they overlap conceptually: both are concerned with whether real-world trading behavior is occurring at profits rather than losses. When both measures tilt positive and remain there, it usually indicates fewer forced exits and less capitulation-like selling embedded in the market’s cost basis.
Cointelegraph also referenced an argument from Checkonchain that STH profitability “starting to look more like those early bull-market recoveries.” That aligns with CryptoQuant’s framing of the current streak as a step toward a more sustained upside attempt, not just a short-lived bounce.
Which STH cohorts are driving the shift
CryptoQuant’s data suggests the improving profitability isn’t uniform across all short-duration holders. The firm says profitability is being driven primarily by entities holding between one and three months. For that subgroup, CryptoQuant reports a realized cost basis of $63,372—an important detail because it represents the average price at which their holdings were accumulated.
Meanwhile, the more “mature” end of the STH base—wallets holding for three to six months—shows a higher realized cost basis. CryptoQuant places this realized price at $73,190, meaning that while gains exist across the STH population, the market still has to clear more expensive acquisition levels for the older slice of short-term demand.
For traders and investors, this matters because the distribution of realized cost bases often influences where selling pressure could reappear. If price pushes through the higher realized band with momentum, it tends to reduce the probability that the newer profit holders will quickly become loss holders again.
In other words, the market’s health here isn’t only about being above a single breakeven line; it’s about whether the improving profitability can extend across aging cohorts inside the short-term bucket—especially those with higher cost bases.
What to watch next
CryptoQuant’s historical signal is clear on what it considers a prerequisite for stronger upside: STHs need to remain in profit long enough that they are more likely to “ride the upside” rather than re-enter sell-the-rally behavior. The next checkpoint for readers is whether this profitability persistence continues beyond the current streak, particularly as price interacts with higher realized cost bases in the three-to-six-month segment.

Chainlink price traded near $11.41 after failing to hold its latest rebound, while weak momentum and liquidity below $11.20 raised the risk of another decline.
Summary
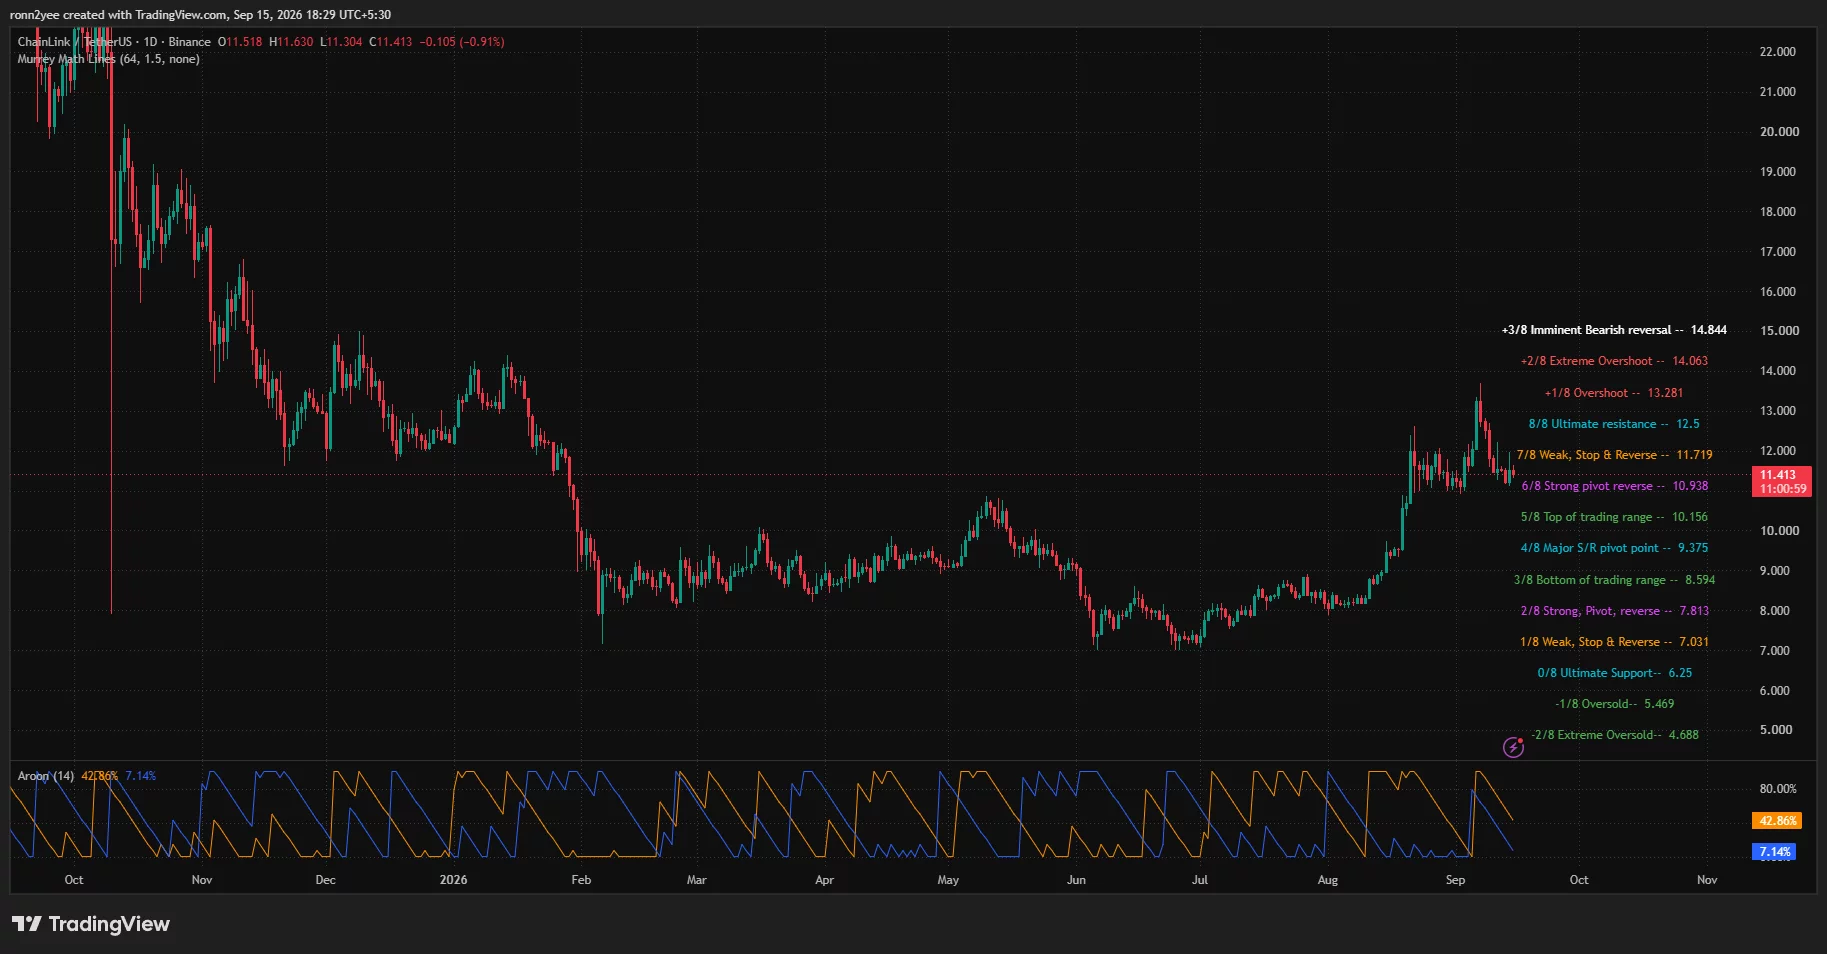
- Chainlink price remained below the $11.72 resistance after retreating from its September peak near $13.60.
- Daily Aroon readings showed fading upward momentum, with Aroon Up falling to 7.14%.
- 4-hour Bollinger Bands placed immediate support near $11.20 and resistance around $11.68.
- Liquidation clusters near $11.00 could draw the price lower if the current support range fails.
Chainlink price remains under pressure
Chainlink (LINK) price was trading around $11.41 at the time of writing, down 0.91% on the daily candle after moving between $11.30 and $11.63. The token remained close to the lower end of its intraday range as buyers struggled to extend a brief recovery.
LINK has lost much of the advance that carried it from approximately $8.20 in early August to a September high near $13.60. The rally accelerated after the price broke through $9.40 and later cleared $11.00, but selling increased once the token moved above $13.00.
Price has since formed a sequence of lower highs and lower lows. The latest bounce stalled below $11.70, leaving LINK beneath the $11.72 Murrey Math resistance level on the daily chart.
The broader crypto market also faced pressure as investors assessed inflation, energy prices and the outlook for U.S. interest rates. Expectations that the Federal Reserve could keep borrowing costs restrictive reduced demand for higher-risk assets, including cryptocurrencies that do not offer a fixed yield.
Uncertainty surrounding the Digital Asset Market Clarity Act added another U.S.-specific risk for crypto traders. A delayed or unsuccessful Senate vote could weaken expectations for near-term regulatory clarity, although LINK’s immediate move remained closely tied to its technical setup and wider market direction.
Daily indicators show fading LINK momentum
The daily chart showed LINK holding above the 6/8 Murrey Math level at $10.94, which now serves as the nearest major pivot. Price previously used the area around $11.00 as a breakout level during its August rally, making the zone important for the short-term trend.
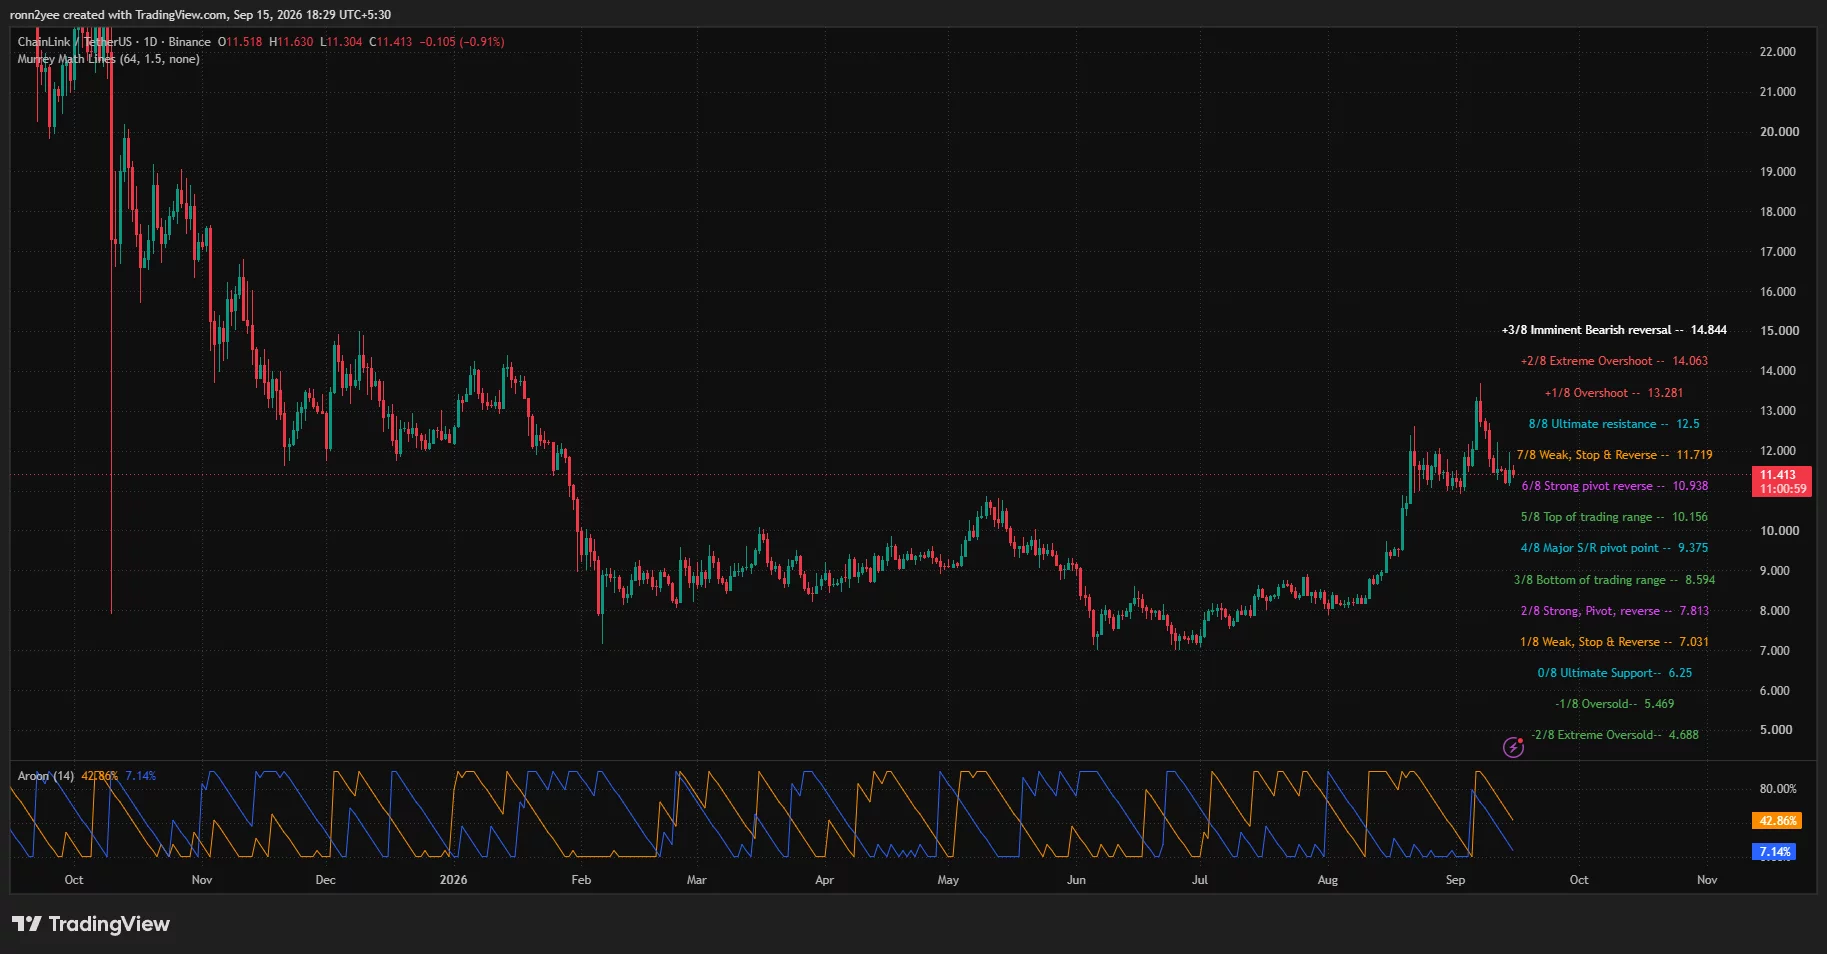
Aroon readings pointed to weakening bullish control. Aroon Up stood at 7.14%, while Aroon Down was at 42.86%. The wide gap suggests that LINK has not recorded a recent high, while downside pressure remains more active.
The readings do not confirm a fresh breakdown on their own, but they support the pattern of declining momentum since the early September peak. Buyers would need to reclaim $11.72 before LINK could attempt another move toward the 8/8 resistance at $12.50.
A break above $12.50 would expose the next Murrey Math targets at $13.28 and $14.06. LINK would still need stronger volume and broader market support to reach those levels, particularly after its rejection from the $13.00–$13.60 region.
If $10.94 fails, the daily chart places the next support at $10.16. A deeper correction could then bring the major $9.38 pivot into focus, although such a move would require a clear loss of the current $11.00 support area.
4-hour chart keeps $11.20 support in focus
LINK was trading slightly below the 4-hour Bollinger Band midpoint at $11.44. The upper band stood near $11.68, while the lower band was around $11.20.
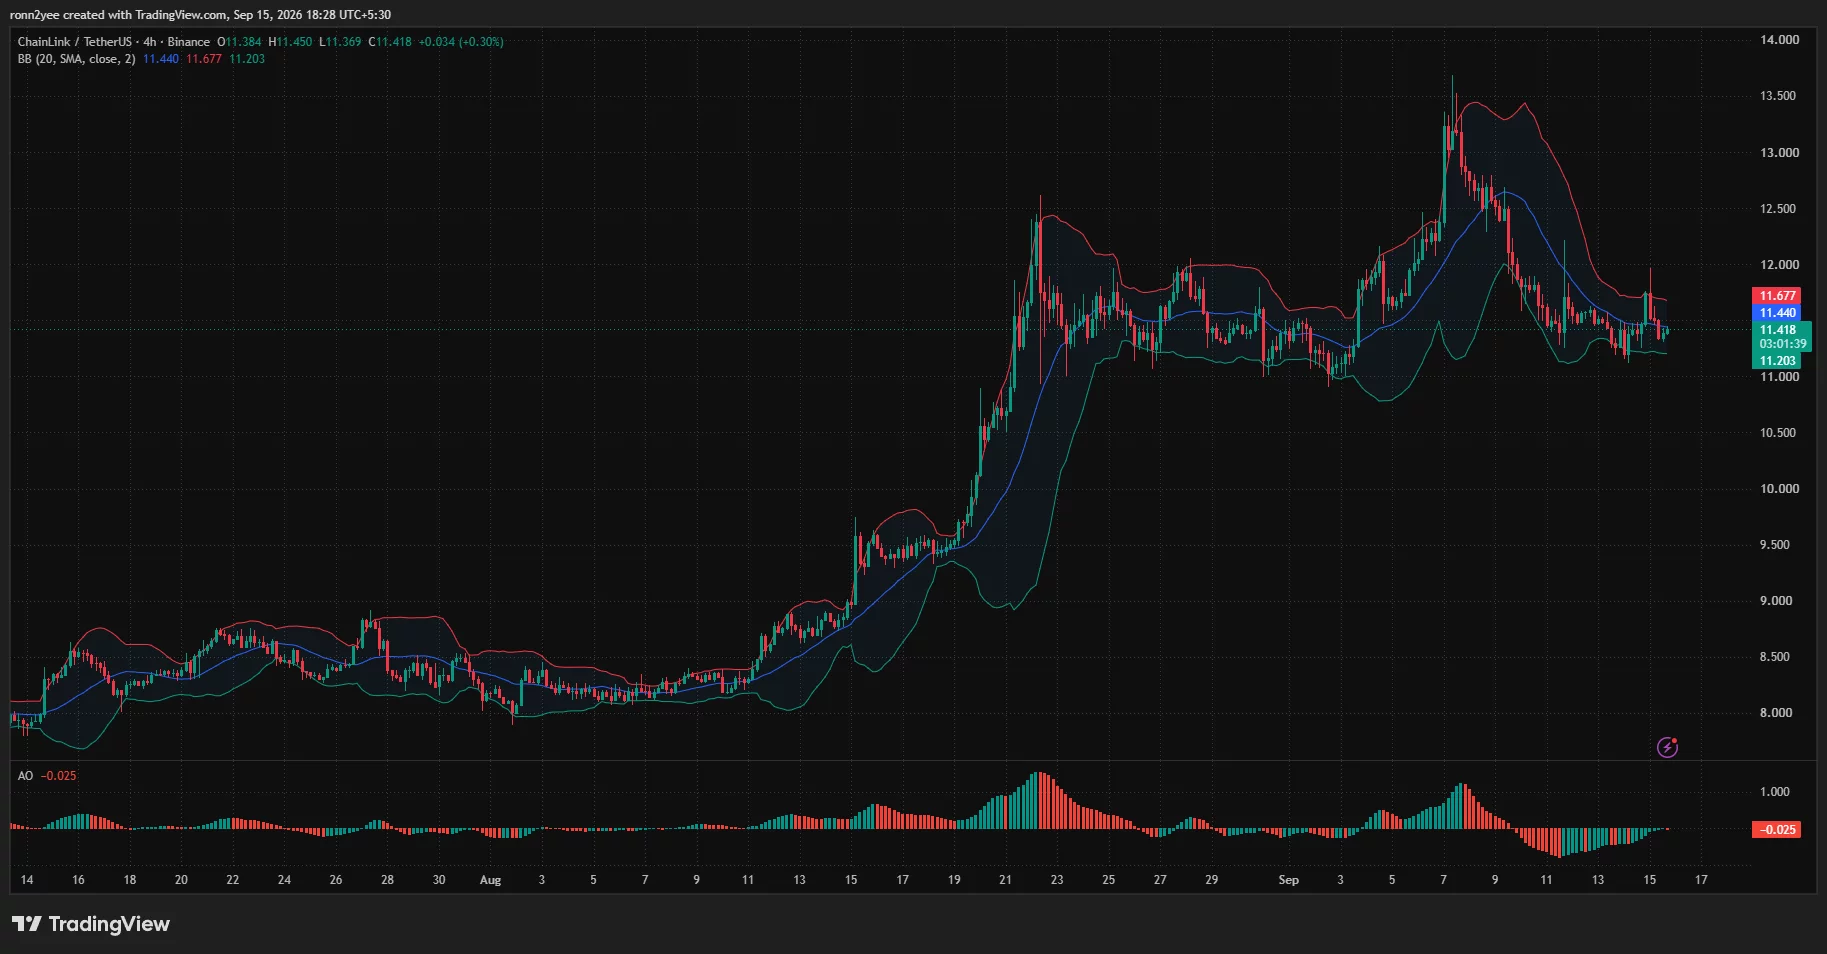
The narrow distance between the bands reflected reduced volatility following the sharp decline from the September high. Price has moved sideways between roughly $11.20 and $11.70, creating a short-term consolidation range.
A close above the Bollinger midpoint would be an early sign that buyers are regaining control. LINK would then need to break $11.68–$11.72 to challenge the psychological $12.00 level.
The Awesome Oscillator remained marginally negative at -0.025. Its red bars had shortened, indicating that bearish momentum was easing, but the indicator had not yet moved decisively above zero to confirm a bullish shift.
Failure to defend the lower Bollinger Band could send LINK toward the daily pivot at $10.94. Conversely, a breakout above the upper band would weaken the short-term bearish structure and increase the chance of a recovery toward $12.00 and $12.50.
Liquidation map points to liquidity near $11
CoinGlass’ one-week liquidation heatmap showed a dense concentration of leveraged positions below the current price, particularly around $11.00–$11.15. The strongest lower cluster appeared close to $11.05, with additional liquidity extending toward $10.90.
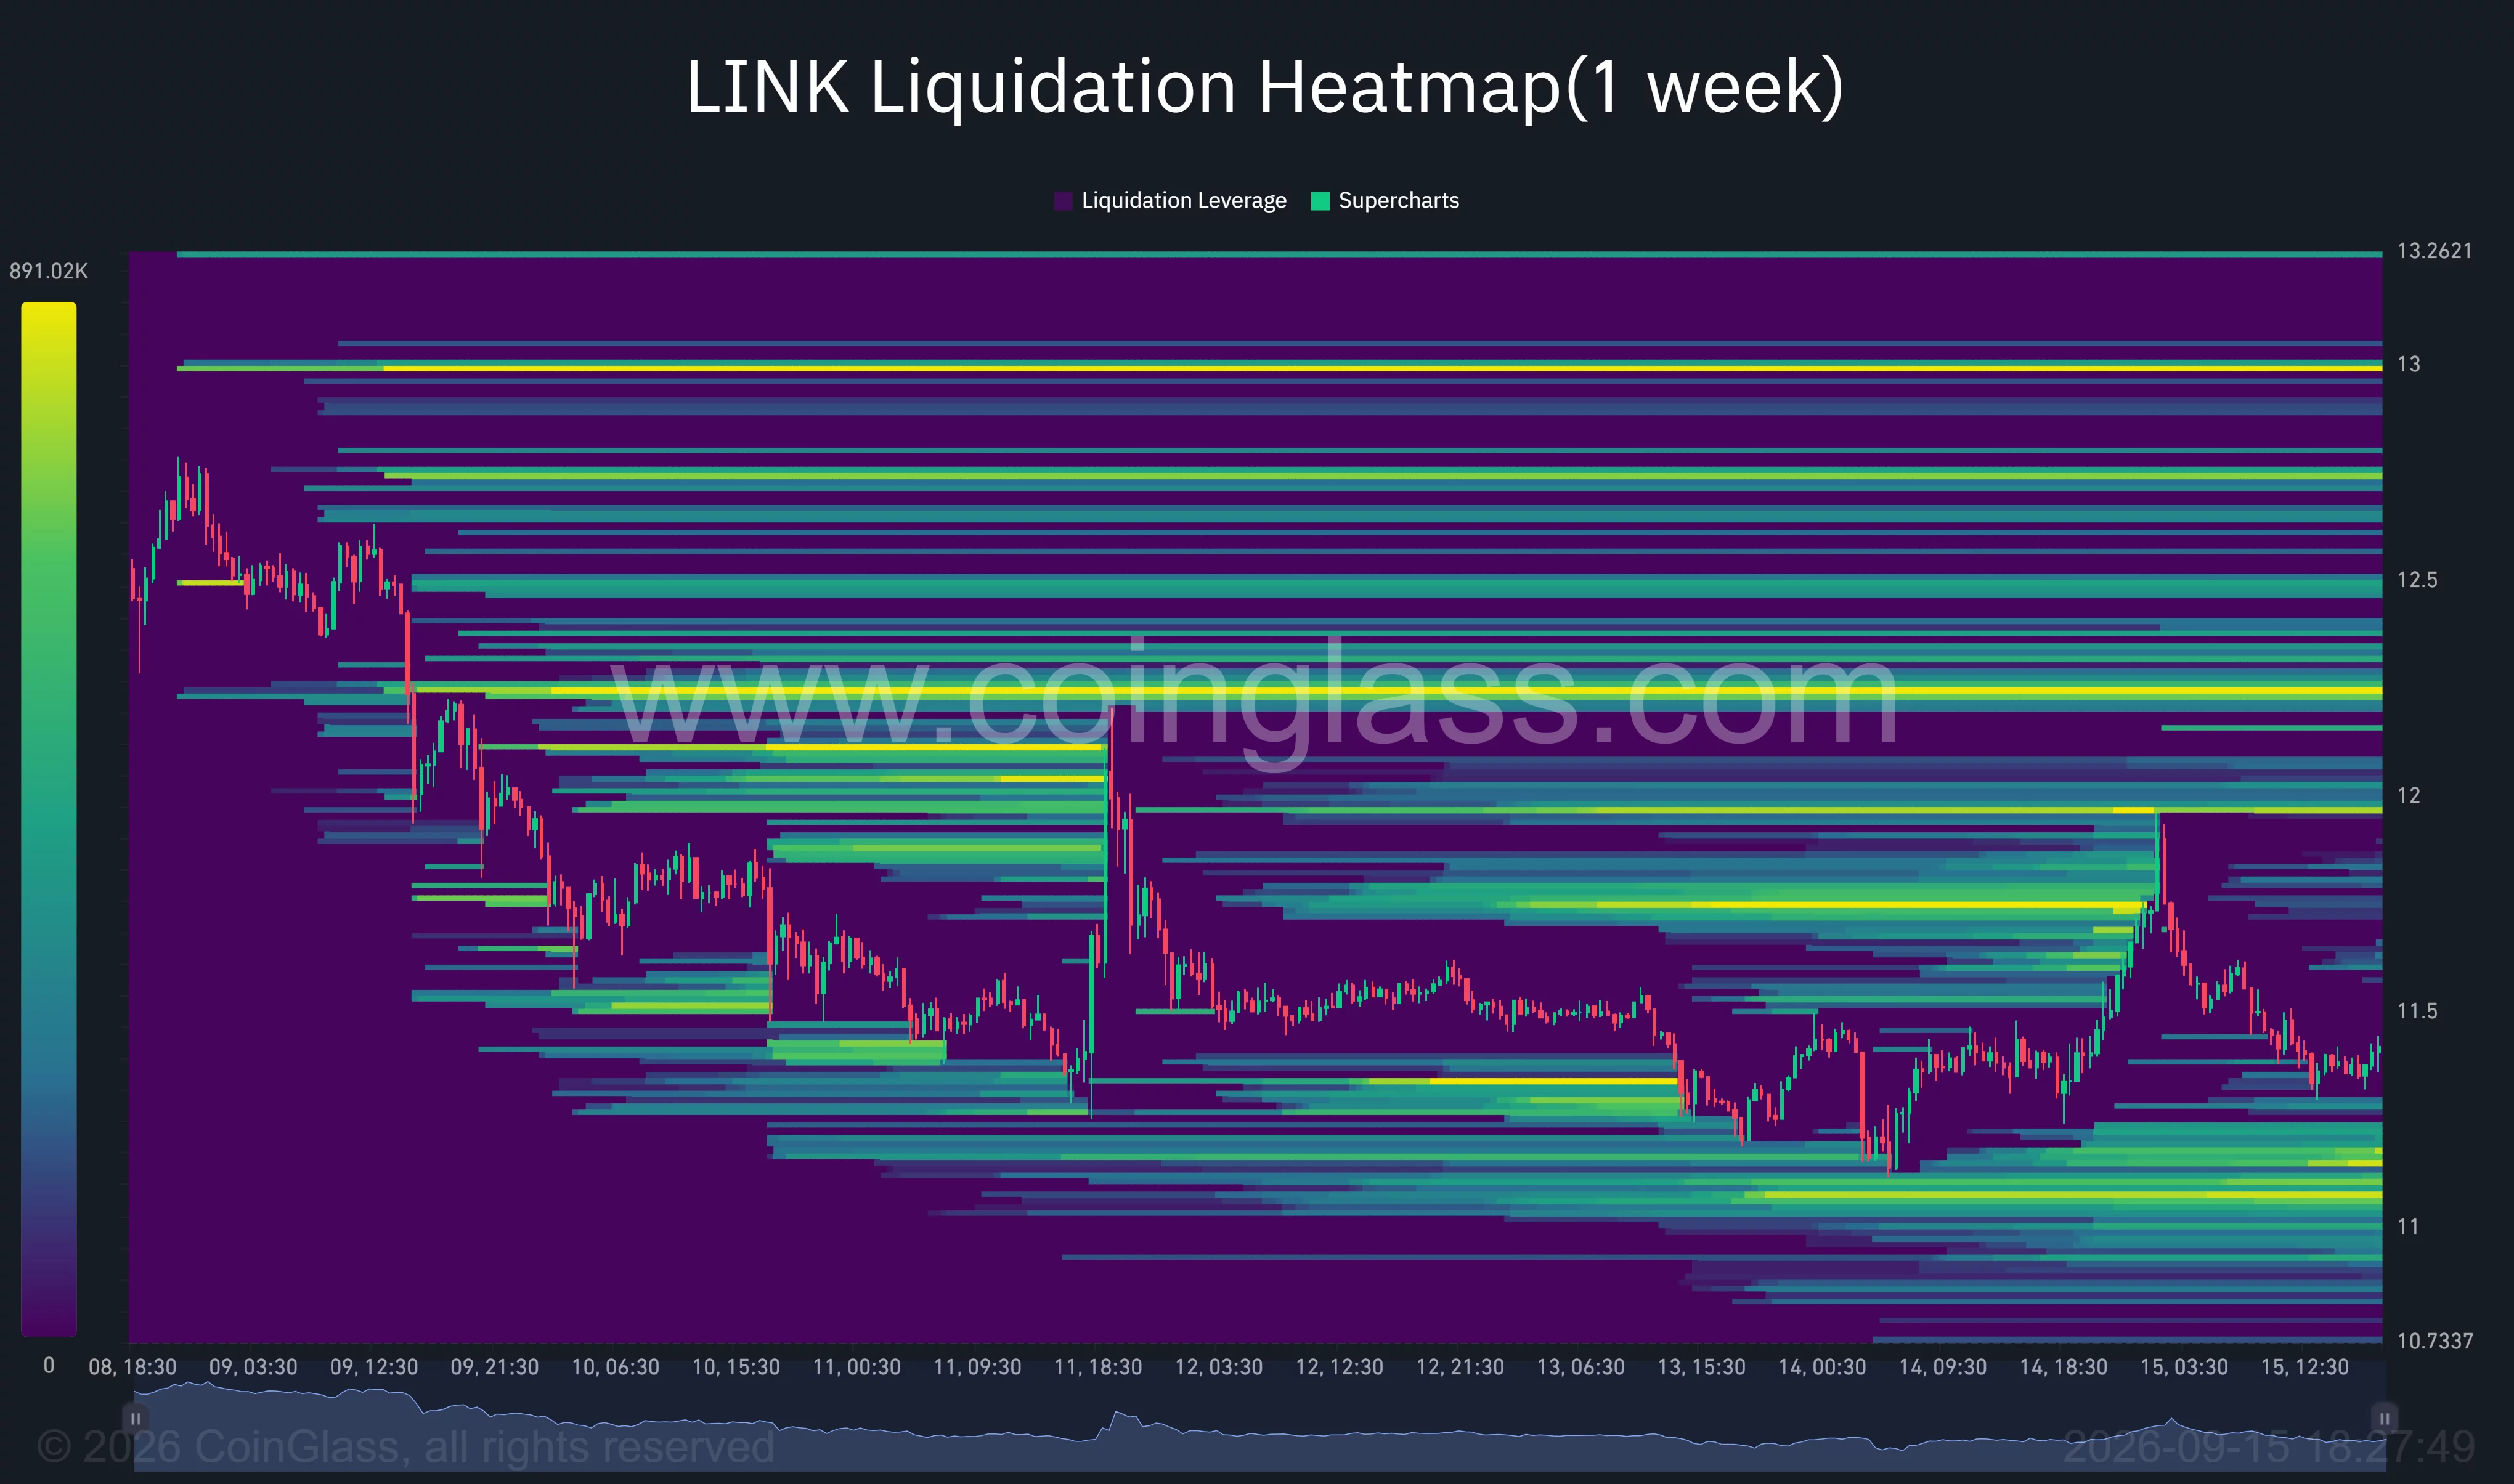
Large liquidation concentrations can attract price as traders target areas where leveraged positions may be forced to close. A drop below $11.20 could therefore accelerate toward $11.00 if long liquidations add mechanical selling pressure.
Upside liquidity was spread across several levels. The nearest visible concentrations sat around $11.70–$12.00, followed by stronger bands near $12.20 and $12.50. A particularly large cluster was visible around $13.00, although LINK would first need to reverse its lower-high structure to approach it.
The uneven distribution leaves LINK exposed to volatility in either direction. Lower liquidity sits closer to the current price, making the $11.00 region the more immediate level, while a break above $11.72 could force short positions to close and support a faster recovery.
For now, $10.94–$11.20 forms the main support zone, while $11.68–$11.72 remains the first resistance range. A decisive close outside those boundaries could determine whether LINK extends its correction toward $10.16 or begins another attempt at $12.50.
Disclosure: This article does not represent investment advice. The content and materials featured on this page are for educational purposes only.

TIME’s 2026 LATINO LEADERS LIST INCLUDES:
Ana Valdez, president and CEO of Latino Donor Collaborative
Cástulo de la Rocha, president and CEO of AltaMed Health Services Corporation
Jose Alvarado, NBA champion
Julián Castro, CEO of the Latino Community Foundation
Luana Lopes Lara, COO and co-founder of Kalshi
Marina Larroudé, co-founder of Larroudé
Mónica Ramírez, founder and president of Justice for Migrant Women
Nelson German, chef and restaurateur
Rachel Zegler, actor and singer
Ronaldo Salgado and Lorenzo Salgado Jr., advocates
Sofia Carson, actor, singer, and advocate
PepsiCo is the premier partner of TIME Latino Leaders.
To recognize this year’s honorees, TIME will host a special cocktail reception celebrating TIME’s fourth annual Latino Leaders list in Miami on October 27th, presented by premier partner PepsiCo. The evening will feature remarks from actor, singer, and advocate Sofia Carson, CEO of the Latino Community Foundation Julián Castro, CEO, Latin America, and Global Chief Strategy & Transformation Officer at PepsiCo Athina Kanioura, and more.


Two software bugs allowed the attacker to create more than 2,000 times Bitcoin’s maximum supply in unbacked syBTC. Symbiosis puts preliminary losses at 9.97 BTC.

Ethereum and the Base ecosystem are moving toward different account abstraction (AA) standards after an effort to align on a shared approach reportedly stalled last week. The split could have practical consequences for wallet developers, potentially requiring support for multiple transaction formats to deliver a consistent user experience across networks.
In an X post on Monday, Derek Chiang—founding member and researcher at Ethlabs and a co-author of Ethereum’s EIP-8141—warned that interoperability standards have taken a back seat to each chain’s primary goals. “Putting the burden on wallets,” Chiang wrote, framing the divergence as a shift in where the compatibility work will land.
Key takeaways
- Ethereum and Base are pursuing different native account abstraction paths after a previously sought shared standard failed to materialize.
- Wallets may need to handle separate transaction formats to maintain a uniform experience across networks.
- Ethereum is progressing account abstraction under EIP-8141 via “Frame Transactions” as part of its Hegotá upgrade plan.
- Base’s native account abstraction implementation via Keystore is aligned with EIP-8130 and is already live on devnet.
- The divergence reflects a broader tension: L1 priorities around security and resistance themes vs. L2 alignment with scalability-oriented standards.
Why the account abstraction split matters
Account abstraction is designed to move transaction logic out of fixed protocol rules and into programmable authorization mechanisms. That enables more flexible transaction policies—for example, defining how users authorize actions and how network fees are handled—without relying solely on traditional externally owned account behavior.
But as AA becomes native to more chains, standardization becomes increasingly important for the application layer. When chains choose different AA schemes, wallet software often becomes the integration point. In that scenario, developers may have to map user actions into multiple formats, or maintain separate signing and fee-handling flows depending on which chain the transaction targets.
Chiang’s framing suggests that while technical progress continues, the interoperability “cost” is shifting away from cross-chain AA agreements and toward wallet infrastructure. For end users, that tradeoff can surface as inconsistent behavior across networks—especially in edge cases involving authorization rules, fee sponsorship patterns, or signature semantics.
Ethereum’s Hegotá direction: EIP-8141 and Frame Transactions
On Ethereum, the roadmap for native account abstraction is closely tied to EIP-8141. According to the proposal’s materials, Ethereum is advancing “Frame Transactions” as a “headliner” item under its Hegotá upgrade, which is planned to introduce native account abstraction and create a path toward post-quantum authentication.
Ethereum Foundation communications also identify protocol Hegotá as an upgrade with multiple items, and EIP-8141 is highlighted as a key feature. The intent, as described in these sources, is to make account abstraction an integrated capability rather than an external add-on—an approach that could influence how wallets, dApps, and security tooling interact with Ethereum accounts going forward.
Timing is still dependent on broader upgrade sequencing. The same coverage notes that Ethereum developers could begin implementing Hegotá in late 2026 following Glamsterdam. Glamsterdam, per Ethereum’s public roadmap as discussed in prior reporting, is expected to improve scalability, harden the network, and make the system easier to use, with a mainnet launch expected in the second half of 2026.
Base’s native AA: EIP-8130 and Keystore on devnet
Base, meanwhile, is taking a separate route to native account abstraction through Keystore. The project’s documentation describes native account abstraction under EIP-8130, and the specification indicates that the implementation is currently live on devnet.
The significance of Base’s approach is twofold. First, it suggests that Base is treating the AA feature as something it will integrate and iterate on quickly in its own ecosystem, rather than waiting for a cross-chain convergence point. Second, if Base’s AA model differs from Ethereum’s, wallet teams will likely have to build a more adaptable abstraction layer to support both ecosystems.
For developers building across networks, the divergence may also affect application assumptions around transaction structure and how authorization and fee-related operations are packaged. Even if user-facing features remain similar, the underlying transaction format can change—forcing more careful integration work for cross-chain dApps and tooling.
L1 vs. L2 priorities: different visions, different standards
Chiang’s argument connects the technical divergence to differing design priorities between layer-1 networks and layer-2 networks. He suggested that L1s are increasingly focused on elements such as censorship resistance, capture-resistance, open-source values, privacy, and security features—factors that could naturally lead to different account abstraction standards than those favored by scalability-focused L2 environments.
In contrast, he implied that L2s may be more aligned with standards such as EIP-8130. That difference helps explain why standardization efforts may stall: each network is optimizing for its own constraints and goals rather than minimizing complexity for shared infrastructure.
Still, Chiang cautioned against treating the separation as an automatic negative. He argued that the outcome doesn’t necessarily end badly because Ethereum and Base are “free to innovate” on account abstraction within the boundaries of their respective visions. Practically, however, the gap creates work for wallets and middleware, which must bridge distinct transaction behaviors for users who expect portability.
What to watch next
Wallet developers and cross-network builders should watch for how EIP-8141-based “Frame Transactions” and Base’s EIP-8130 Keystore model evolve into production-ready interfaces, and whether any new compatibility layer emerges to reduce fragmentation. The next milestone will be less about theoretical AA support and more about how transaction formatting differences are surfaced—or hidden—from users and developers in real tooling.
UnitedHealth finds itself in a genuinely split narrative right now, trading near $388, down about 15.9% from its 52-week high, even as the fundamental picture keeps improving. Q2 earnings beat expectations, with revenue of $112.03 billion, and the company followed through with a significant policy shift: lifting prior-authorization requirements on roughly 1,700 diagnostic codes starting October 1, a move that could meaningfully ease administrative friction with providers and support margins going forward.
Wall Street’s conviction has only grown stronger as a result. Wells Fargo and Bernstein both reaffirmed Buy ratings this month, with price targets near $526 and $512 respectively, while the broader consensus, a Moderate Buy across 27 analysts, points to an average target of $456.56, implying roughly 17% upside from current levels.
The stock has nonetheless struggled to find sustained momentum, weighed down by lingering concerns over Medicare Advantage margin recovery and, more recently, the shock of losing a senior executive, an event that has triggered internal restructuring and closer scrutiny of governance and security practices.
The result: a company delivering genuinely solid operational improvement, but one whose stock price has yet to fully reflect it.
Technical Analysis of UnitedHealth
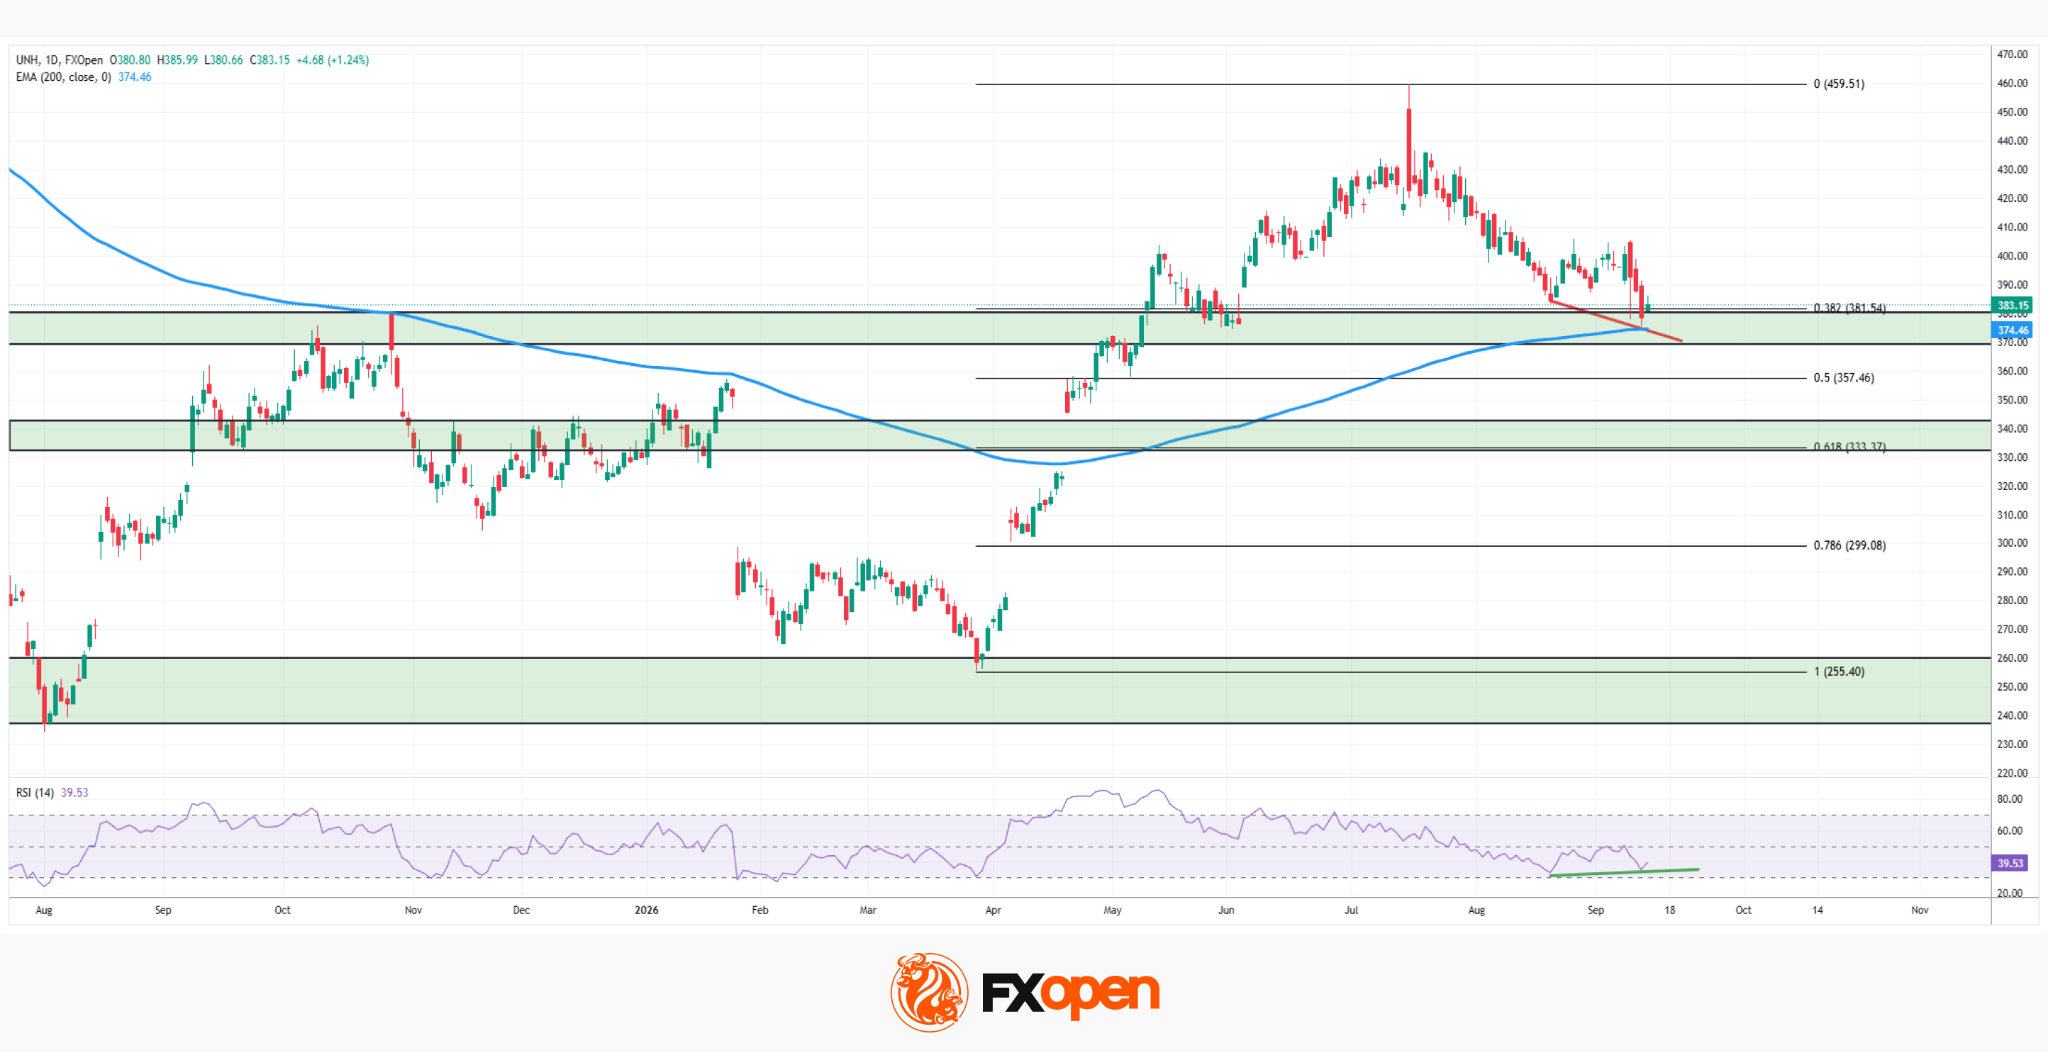
As the UNH daily chart shows, the stock remains in a broader downtrend from July’s highs near $459.51, currently testing a critical confluence near $374–383, where the 0.382 Fibonacci retracement and the 200-period EMA all converge. Adding intrigue to the setup, the RSI is forming a bullish divergence, printing higher highs even as price carved a fresh low in recent sessions.
Bullish Scenario
Should buyers break above this EMA-Fibonacci confluence, the divergence would gain real technical credibility, opening the path towards a retest of the broader downtrend structure and potentially challenging the $450–$460 area, where the stock has its recent high in July.
Bearish Scenario
Conversely, a rejection at this confluence would keep sellers in control, invalidating the divergence and exposing the 0.5 retracement near $357.46, with a deeper slide risking a retest of the 0.618 level around $333.37, the support zone that held throughout last autumn and winter.
With price testing a stubborn multi-factor confluence while the RSI quietly hints at fading downside momentum, UnitedHealth’s next move looks set to determine whether the fundamental recovery story finally gains technical confirmation, or whether the broader downtrend still has room to run.
Buy and sell stocks of the world’s biggest publicly-listed companies with CFDs on FXOpen’s trading platform. Open your FXOpen account now or learn more about trading share CFDs with FXOpen.
This article represents the opinion of the Companies operating under the FXOpen brand only. It is not to be construed as an offer, solicitation, or recommendation with respect to products and services provided by the Companies operating under the FXOpen brand, nor is it to be considered financial advice.
Ethereum price fell toward $2,475 after a brief move above $2,600 failed, leaving ETH exposed to weaker momentum and leveraged volatility ahead of two major U.S. events.
Summary
- Ethereum price reversed from above $2,600 and fell about 2% toward $2,475.
- 4-hour Bollinger Bands place immediate support near $2,469 and resistance near $2,550.
- Daily MACD has turned bearish, while an ADX reading of 17.73 signals weak trend strength.
- The Federal Reserve decision and CLARITY Act vote could keep volatility elevated.
Ethereum price falls back below $2,500
According to data from crypto.news, Ethereum (ETH) price traded near $2,475 on Sept. 15 after dropping approximately 2% over the previous 24 hours. The decline followed a sharp rejection above $2,600, where buyers failed to sustain a breakout.
The daily chart shows ETH opening at $2,515.72 before trading between $2,465.60 and $2,520 during the latest session. The token was down 1.65% at the time of writing.
Price action remains volatile after ETH climbed above $2,600 during the prior session and quickly surrendered the entire move. The reversal pushed the token below the $2,500 psychological level and back into the consolidation range that has controlled trading since late August.
Crypto trader Daan Crypto Trades described the move as pre-positioning ahead of the U.S. Senate’s CLARITY Act vote and the Federal Open Market Committee meeting. According to the analyst, the initial rally removed leveraged short positions before the decline forced out traders positioned long.
The pattern shows traders reducing risk before events that could affect both monetary policy and U.S. digital-asset regulation. Failure to advance the bill could produce another move lower before attention shifts to the Fed decision, Daan added.
Weak momentum leaves Ethereum near 4-hour support
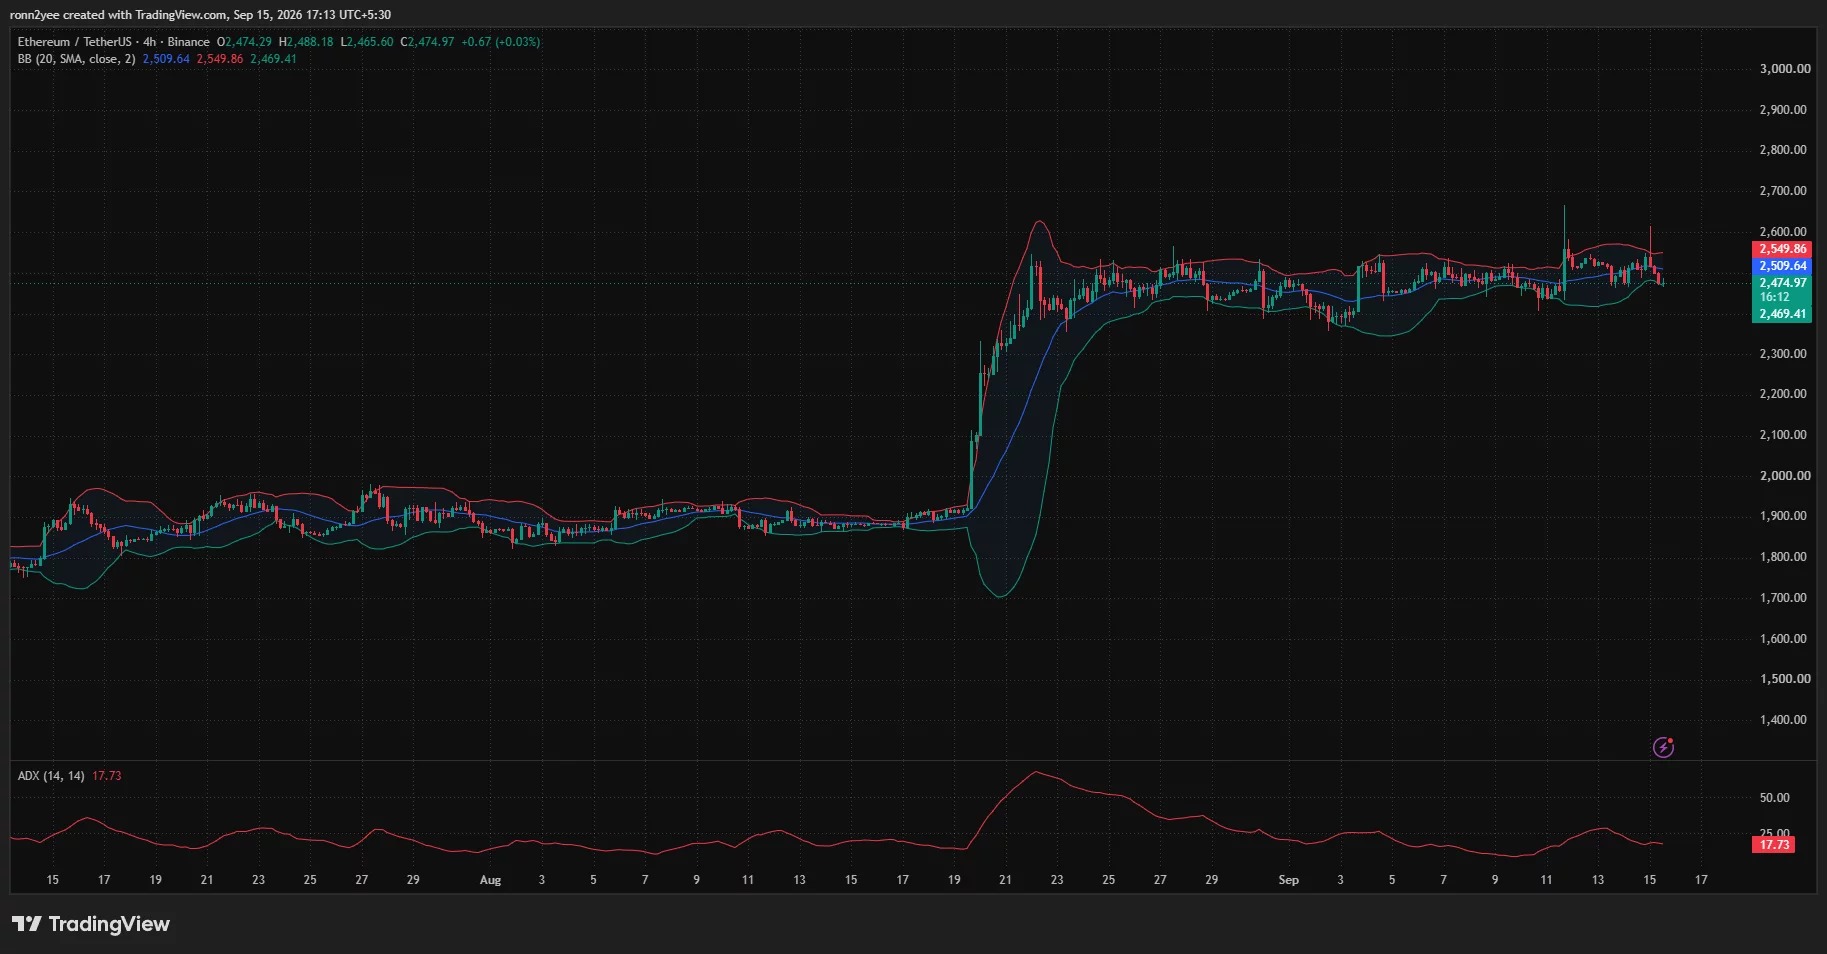
On the 4-hour chart, ETH has moved below the Bollinger Band midpoint at $2,509.64. The lower band stands at $2,469.41, placing the current price close to its first immediate volatility support.
A break below that band would expose the recent intraday lows and the $2,450 area. Buyers would need to recover the midpoint before attempting another move toward the upper Bollinger Band at $2,549.86.
The Average Directional Index is at 17.73. Readings below 20 normally indicate that the prevailing trend lacks strength, meaning ETH could remain range-bound even as short-term swings become sharper.
Daily indicators also show fading momentum. The relative strength index has dropped to 56.89 from its recent highs and sits below its moving average of 62.14. ETH is not oversold, leaving room for further downside if sellers retain control.
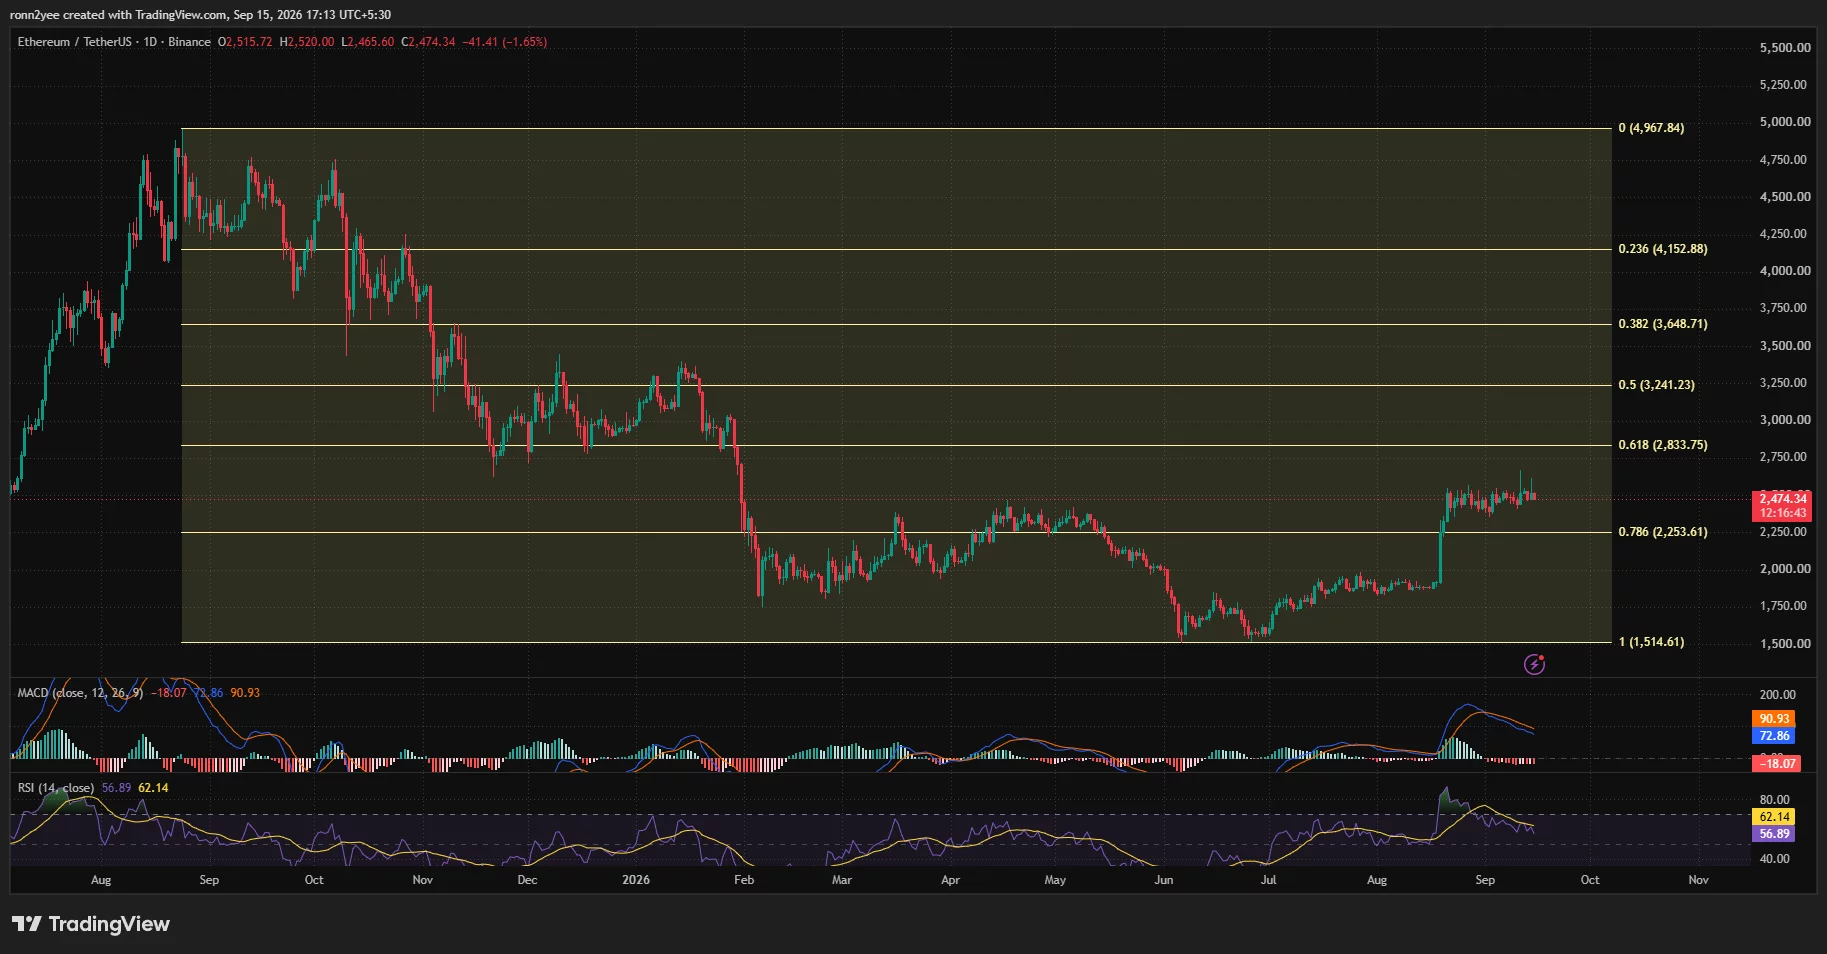
The daily MACD line remains positive at 72.86 but has fallen below the signal line at 90.93. The histogram has turned negative at -18.07, showing that the momentum behind the August rally is weakening.
Liquidation clusters frame the next ETH move
CoinGlass’s one-week liquidation heatmap shows a concentration of leveraged positions immediately below the market around $2,450–$2,470. ETH’s decline toward that area increases the chance of further volatility if the price moves through the cluster.
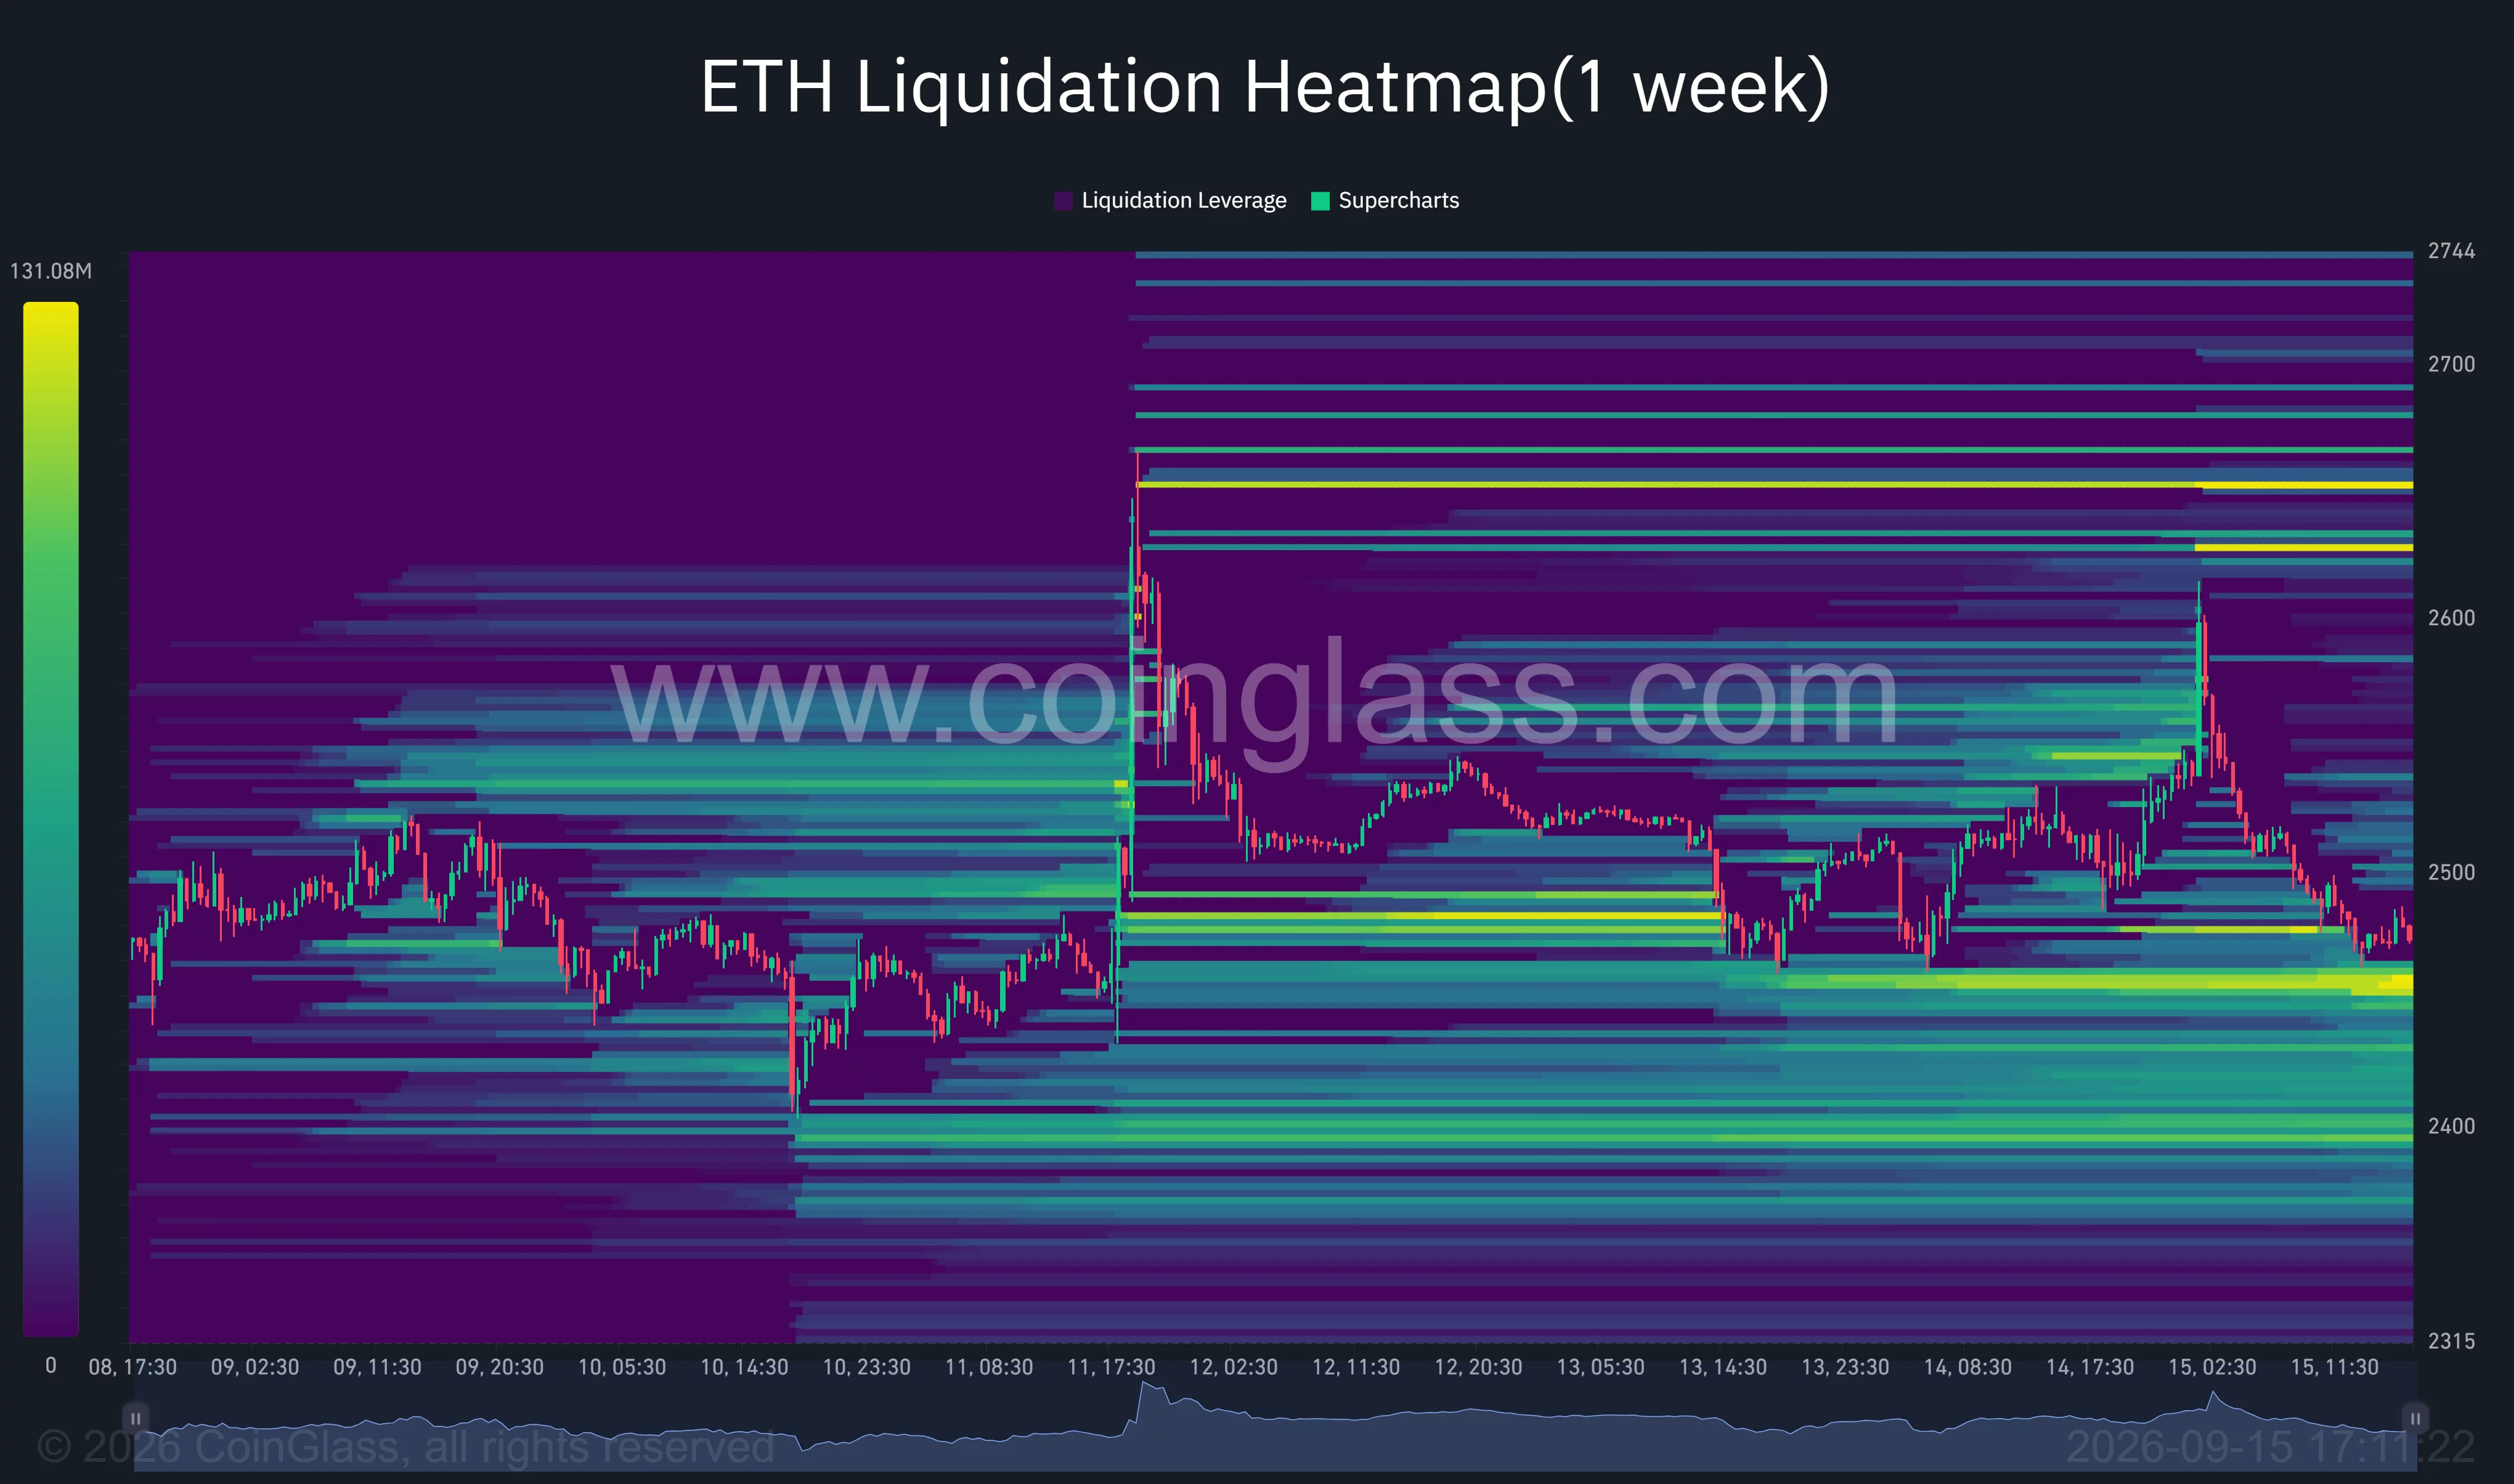
A stronger pocket of downside liquidity appears around $2,390–$2,410. Failure to hold the current range could draw price toward that zone, particularly if leveraged long positions are forced to close.
Liquidity also sits above ETH around $2,535–$2,580, followed by brighter concentrations near $2,630 and $2,650. A recovery above $2,550 could therefore trigger short liquidations and support another attempt at $2,600.
The heatmap does not establish the direction of the next move. It identifies areas where forced position closures could accelerate volatility after ETH reaches those levels.
On the broader daily chart, the 0.786 Fibonacci retracement at $2,253.61 remains the main structural support. The next major upside Fibonacci level stands at $2,833.75, but ETH must first overcome the nearer resistance between $2,550 and $2,600.
Analysts identify $2,550 as the key resistance
Crypto analyst Ted Pillows said ETH’s upside would remain capped until the asset reclaims $2,550 on the weekly timeframe. His chart places the first major support near $2,175 and the next resistance around $2,860 if buyers establish a weekly close above the current ceiling.
The immediate structure provides closer levels for short-term traders. A move above $2,510 would return ETH to the middle of its 4-hour Bollinger range, while a break through $2,550 would weaken the current bearish setup.
A close below $2,465 would place the $2,450 liquidity area at risk. If sellers clear that zone, $2,400 becomes the next visible target before the larger daily support at $2,254.
Fed and CLARITY Act keep US traders cautious
U.S. macro conditions could determine whether ETH holds its current support. Oil prices climbed above $107 per barrel while the 10-year Treasury yield moved above 5%, increasing concerns that higher energy costs could keep inflation elevated.
CME FedWatch data showed markets assigning a probability above 90% to a 25-basis-point rate increase at the Fed’s Sept. 16 meeting, according to Reuters. Higher Treasury yields can reduce demand for risk assets by giving U.S. investors access to stronger returns in traditional fixed-income markets.
The Senate’s procedural vote on the CLARITY Act adds a separate regulatory catalyst. Until both events are resolved, ETH may remain vulnerable to sharp moves through nearby liquidation zones.
Disclosure: This article does not represent investment advice. The content and materials featured on this page are for educational purposes only.
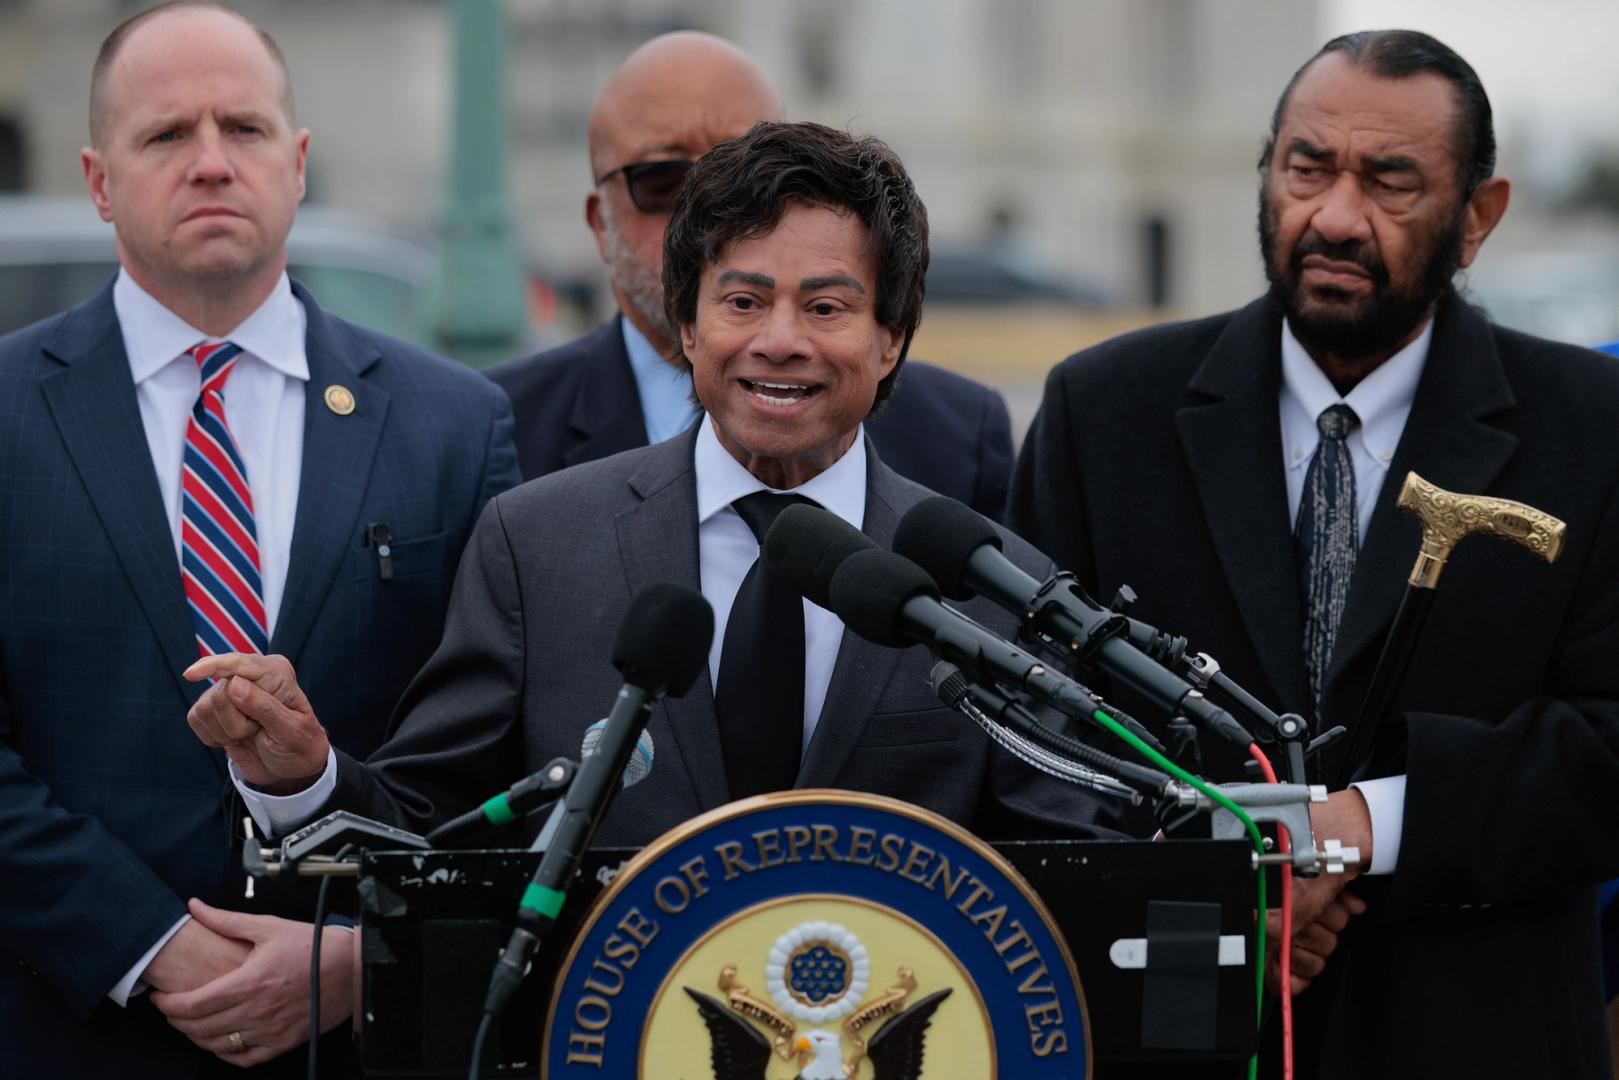
Congress needs 60 Senators willing to put innovation first and provide critical relief to the digital asset industry, argues Rep. Shri Thanedar (D-Mich.)

Although the entire cryptocurrency market rallied on Monday, perhaps to the surprise of a lot of people given the upcoming expectations for a Fed rate hike, XRP was at the forefront, surging from under $1.35 to $1.50 to mark a three-week peak.
It was rejected there, but still remains close to $1.40 ahead of what could be a major day for all crypto assets, including XRP.
XRP Braces for CLARITY Vote
The US Senate is expected to vote shortly after 2 p.m. ET today on cloture for the motion to proceed with the landmark crypto market-structure legislation. It’s worth noting that this is not a final passage vote. Instead, it will show whether the bill has legs to run in the Senate, as it requires 60 votes simply to advance to formal debate. This means that Republicans need support from several Democrats or independents while also avoiding defections within their own party.
The latest developments on the matter were somewhat promising as Senate Republicans released another revised version over the weekend in an attempt to address disagreements surrounding stablecoins, banking competition, and public officials’ crypto interests. However, Senate Democrats sent a counterproposal late last night, even though their Republican counterparts had said their version was “best and final.”
For XRP, the implications are particularly interesting as it already enjoys substantially more regulatory certainty than before or during Ripple’s years-long battle with the SEC. However, the CLARITY Act would establish a durable statutory framework dividing oversight between the SEC and the CFTC and provide clearer rules for digital-asset intermediaries.
$2 Next?
In a previous article, we discussed (with the help of ChatGPT) what could go wrong for XRP in case of a negative vote. In this one, we will reverse course, as most analysts are quite bullish on the asset. One thing they all agree on is that volatility is likely to go wild.
CasiTrades sees the next important upside objective around $1.74-$1.78, followed by an even higher target at $2.00 if momentum continues. EGRAG CRYPTO, who has been among the most bullish XRP commentators, highlighted the importance of the asset maintaining its 100-day EMA around $1.38-$1.40, which is currently being tested again. Holding that level would preserve the broader bullish structure, but losing it could result in a major leg down.
Other analysts, including Mikybull Crypto and Bird, also pointed to improving XRP momentum immediately ahead of the Senate vote. The first test, though, is very close. A sustained breakout above the $1.50 area could open the door toward $1.60, with $1.74-$1.78 coming into focus shortly after. Naturally, $2.00 would return as the obvious next psychological objective.
The post Huge Day for XRP: CLARITY Act Vote Could Spark the Next Big Move appeared first on CryptoPotato.

Futures for the Dow Jones Industrial Average and the other major stock indexes traded lower Tuesday as the 10-year Treasury yield reached its highest level since 2007 and oil prices continued to rise. On deck is the start of the Federal Reserve’s two-day policy meeting. Meanwhile, Nvidia (NVDA) and other artificial intelligence stocks looked to rebound on the stock market today…
Copyright ©2026 Investor’s Business Daily, LLC. All rights reserved. 87990cbe856818d5eddac44c7b1cdeb8


Key takeaways
- Bitcoin’s four-hour chart is forming a potential rounded-top pattern after its rally from $63,000.
- The $76,000–$76,300 region serves as the pattern’s critical neckline and support zone.
- A decisive breakdown could produce a technical downside target near $70,900–$71,000.
Bitcoin could decline toward $71,000 if a potential rounded-top pattern on its four-hour chart confirms with a decisive breakdown below the $76,000 support level.
BTC rallied from approximately $63,000 in mid-August before reaching the $80,000–$81,500 region.
However, bullish momentum has since weakened, with the price gradually curving lower and forming the dome-like structure associated with a rounded top.
Weak spot-market demand is adding to the bearish risk, even as demand for Bitcoin perpetual futures remains positive.
Bitcoin rounded top places $71,000 in focus
Bitcoin’s potential rounded top has developed following its strong recovery from the August lows.
The cryptocurrency was trading near $76,870 on Monday, September 15, holding above an important support zone between $76,000 and $76,300. This area effectively represents the neckline of the bearish chart formation.
A decisive four-hour candle close below the zone could confirm the pattern and increase the probability of a deeper correction.
The distance between the pattern’s peak and neckline is approximately $5,000 to $5,300. Subtracting this range from a possible breakdown near $76,000 produces a downside target between $70,900 and $71,000.
Technical indicators show market indecision
Bitcoin’s four-hour Relative Strength Index stood near 54.5, reflecting broadly neutral momentum rather than strongly overbought or oversold conditions.
BTC was also trading around its 20-period, 50-period, and 100-period exponential moving averages. The clustering of these indicators highlights the continuing struggle between buyers and sellers.
A sustained recovery above the $79,500–$80,000 range would weaken the rounded-top scenario. A breakout above the recent highs near $81,500 would largely invalidate the bearish formation and restore the case for further gains. Until then, the $76,000 support remains the most important level to monitor.
Bitcoin’s underlying demand profile provides limited support for the bullish outlook. CryptoQuant’s 30-day demand-growth data shows that demand in the perpetual futures market remained positive during September. Spot demand, however, stayed negative.

Consequently, Bitcoin’s overall demand remained below zero despite continued activity from derivatives traders.
The divergence suggests that leveraged futures positions are driving much of the recent buying pressure rather than investors accumulating BTC directly through the spot market.
Futures-led demand makes BTC vulnerable
A rally driven primarily by derivatives can be more fragile than one supported by strong spot buying.
Futures demand can disappear quickly when traders close leveraged positions or face liquidations during a price decline. This can accelerate selling and increase volatility if Bitcoin breaks below an important support level.
A somewhat similar divergence developed in January and February 2026, when futures demand briefly recovered before overall demand and Bitcoin’s price weakened.
The current structure does not guarantee the same result. However, without a recovery in spot demand, a confirmed breakdown below $76,000 would make the rounded-top target near $71,000 increasingly relevant.

Inde Navarrette Is Preparing Rogue’s Southern Accent for Marvel’s X-Men

EGO UK Floral Texture Dress sale

College Football Power Ratings: Ohio State still No. 1 despite collapse, Oregon plummets



-

 Fashion4 days ago
Weekend Open Thread – Corporette.com
-

 Business6 days ago
Micron Stock Climbs Above $1,031 as AI Memory Crunch and a $50 Billion Outlook Fuel the Rally
-
 Tech2 days ago
The Latest Weird Thing to Play Doom Is the Mapped-Out Brain of a Fruit Fly
-

 Business6 days ago
AMD Stock Climbs After Management Lifts 2027 Data Center Outlook Toward $70 Billion in AI Sales
-

 Crypto World7 days ago
Robinhood Stock: How To Take Advantage With Reduced Risk
-
 Crypto World7 days ago
Bitcoin price risks $76K drop as $78K support weakens
-

 Crypto World4 days ago
XAG/USD: Silver’s Short-Term Rally Meets Its Moment of Truth
-
 Crypto World5 days ago
2 Chip Stocks Broke Out This Week. Neither Was Nvidia
-
 Crypto World7 days ago
Ethereum price stalls below $2,500 as ADX drops to 11
-

 Business4 days ago
10 Most-Streamed Songs On Spotify In 2026 So Far, Led By Ella Langley’s Dominant Run On The Charts This Year
-

 Tech5 days ago
Battery life is the only iPhone 18 Pro and iPhone Duo upgrade I care about. Apple didn’t disappoint
-

 Crypto World5 days ago
OKX launches 10x OpenAI, Anthropic X-Perps in Europe
-
 Crypto World7 days ago
Intel Stock Jumps 9% on Chip Price Hike Report, US Stake Gains $36 Billion
-

 Crypto World6 days ago
Pi Network ships Protocol 27 on a network with 14 million users and zero DeFi
-

 Crypto World4 days ago
Diesel Tops $6 a Gallon for the First Time as 28 States Set Records
-

 Tech6 days ago
Apple Watch Ultra 4 vs Watch Ultra 3: Should you really spend another $799?
-

 Crypto World7 days ago
CLARITY Act runs out of calendar as crypto regulation stalls
-

 News Videos4 days ago
Facing Financial Fears
-
 Crypto World6 days ago
Bitcoin price risks $70K if $78K neckline breaks
-
 Crypto World6 days ago
Bitcoin price holds near $79K as cycle drawdowns narrow
You must be logged in to post a comment Login