
Crypto World
Bitcoin slides 3% as assets rout; Gold smashes to $5K on oil fears

Bitcoin (CRYPTO: BTC) pulled back from its recent tilt toward the $70,000 threshold as geopolitical tensions in the Middle East intensified concerns about oil supply and global inflation. The closure of the Strait of Hormuz sparked a broad risk-off mood, with equities slipping and safe-haven assets showing mixed performance. By midday, BTC hovered near the $66,000 area after retreating from its earlier highs, underscoring how macro headlines continue to drive crypto liquidity and price action. A data point from TradingView highlighted a roughly 3.2% intraday decline, reinforcing traders’ focus on momentum and key technical levels in a volatile environment.
Key takeaways
- Bitcoin (CRYPTO: BTC) failed to sustain a move toward $70,000 as energy-market tensions resurfaced following Hormuz-related disruptions.
- Major equity indices were weaker at the open, with the S&P 500 and Nasdaq each down around 2%, and gold also retreating as risk appetite deteriorated.
- BTC price action remained range-bound and failed to break through critical trend lines, a dynamic traders described as evidence of persistent bearish pressure.
- Analysts linked the session to a broader risk-off cycle driven by oil supply concerns and potential inflationary stress, affecting both crypto and traditional markets.
- While some voices cautioned that BTC could see a rotation opportunity if macro conditions stabilize, the near-term path remained uncertain.
Tickers mentioned: $BTC
Sentiment: Bearish
Price impact: Negative. BTC dropped about 3.2% on the day, returning to the $66,000 region as volatility in oil and cross-asset liquidity weighed on prices.
Market context: The move sits within a broader risk-off backdrop where energy-market shocks, inflation concerns, and geopolitical headlines shape appetite for both traditional assets and digital currencies. The episode underscored how crypto trading remains tethered to macro risk sentiment and liquidity dynamics that can shift quickly in response to geopolitical developments and energy data.
Why it matters
The day’s price action sheds light on Bitcoin’s evolving role in diversified portfolios during periods of geopolitical stress. As oil markets react to potential supply disruptions, the resulting spillovers to equities and currencies can compress risk-on assets, including digital currencies. The observed dynamics imply that BTC is not immune to macro shocks and that its appeal as an inflation hedge or portfolio diversifier may be contingent on broader liquidity conditions and investor risk tolerance.
For market participants, the session highlighted the importance of risk controls and scenario planning. While some analysts had suggested a rotation from gold into BTC as a store of value during periods of stress, the evidence from this single session indicates a more nuanced relationship. The price resilience of BTC in some shorter timeframes contrasts with the larger-timeframe momentum that favored bears, suggesting a wait-and-watch period for a clearer directional signal.
Looking ahead, the interplay between oil-market volatility, inflation expectations, and crypto liquidity will likely calibrate how traders approach BTC in the near term. If macro headwinds ease and risk assets stabilize, BTC could retest upside levels; if not, a continuation of range-bound trading or further downside pressure remains plausible. Investors should monitor whether BTC can reclaim key levels or remain anchored in a consolidative range while macro headlines evolve.
What to watch next
- Oil-price trajectories and official updates on energy supply risks, particularly around chokepoints like Hormuz, over the next several sessions.
- BTC price levels: watch for a decisive move above $70,000 or a clear break below $66,000 to signal a new short- or medium-term direction.
- General risk sentiment: observe moves in the S&P 500 and Nasdaq for continued correlation or decoupling from crypto markets.
- Geopolitical developments: any escalation or de-escalation could rapidly reframe liquidity and volatility in crypto markets.
Sources & verification
Market reaction and key details
Bitcoin (CRYPTO: BTC) traded in a narrow corridor as macro headlines continued to drive prices. The market faced a risk-off tilt after the Strait of Hormuz closed, amplifying concerns about oil-supply interruptions and potential inflationary pressures. In this environment, equities pulled back and safe-haven assets vacillated, with gold not providing the shelter some had anticipated. Data from TradingView captured BTC’s movement, showing a roughly 3.2% decline on the day and a retreat toward the $66,000 mark. The price action followed a broader pattern of cross-asset sensitivity to geopolitical risk and energy-market signals.
“The market is beginning to price-in a longer war,” The Kobeissi Letter wrote on X, reflecting a shift in risk perception as geopolitical tensions persisted.
From a technical standpoint, traders highlighted that BTC once again failed to flip key trend lines that would signal renewed bullish conviction. Keith Alan, cofounder of Material Indicators, observed that “So far $BTC bulls have failed to muster any momentum,” underscoring the lack of a clear breakout above resistance levels. A weekly chart review suggested a memory-like pattern of consolidation spanning 2021 through late 2024, with recent rallies not carrying the DNA of a sustained bull recovery.
“After losing the 2021 Top and the 21-Day SMA again, I’m having flashbacks to March – Nov 2024 when we endured 8 months of consolidation in this range. Nothing about Monday’s rally has the DNA of a bull recovery.”
Despite the bearish tone, some participants sought opportunities in the near term. A widely cited observation from traders noted that, relative to other assets, Bitcoin appeared to hold up better than some precious metals during the crisis, a theme that prompted discussions of potential capital rotation. Yet the prevailing consensus emphasized that volatility remained elevated and that BTC’s intermediate-term direction would hinge on how the oil-market dynamics and inflation outlook evolved in the days ahead.
“Not doing the worst since the escalation in the middle east. Actually outperforming stocks & precious metals for a change,” commented Daan Crypto Trades, highlighting the nuanced performance within a broad risk-off phase.
As the session progressed, gold came under pressure as macro concerns persisted. Nik Bhatia, founder of The Bitcoin Layer, described gold as “absolutely smashed,” while noting it had posted year-to-date gains of around 16%. This juxtaposition—gold weakening even as Bitcoin remains in a tight range—helped illustrate the complexity of risk markets during this period. Some observers, including Michaël van de Poppe, suggested that a rotation of capital from gold to BTC could be underway, a narrative that would require more data to confirm but remains a subject of debate among market watchers.
What’s next in the oil-BTC dynamic
The current episode underscores how energy-market shocks can feed into crypto liquidity, especially when inflation expectations are in flux. As traders reassess macro scenarios, BTC could either test higher resistance levels if risk appetite returns or continue trading within a defined range until new catalysts emerge. The next steps will hinge on how quickly energy markets stabilize, how central banks respond to any escalation in oil prices, and whether risk-on assets regain footing in a global environment of heightened uncertainty.


Crypto has gone mainstream as a financial asset class and TradFi institutions now feel obligated to dip their toes into the space, if only to show their existing clients that they aren’t afraid to handle innovative technologies.
The problem, for some of them, is that staking — one of crypto’s most basic primitives — is still considered too dangerous. It exposes institutions to risks they are structurally unwilling to accept, like slashing, downtime, operational failures and returns that resist forecasting. As a result, many firms have limited themselves to holding spot ETH or spot SOL or avoided the assets entirely.
That dynamic is now changing. A new generation of insurance-backed staking products, structured around the Composite Ether Staking Rate (CESR) benchmark and underwritten by regulated insurers, is reframing staked ETH as something closer to an institutional yield product than a speculative crypto experiment.
For cautious TradFi firms, this shift matters far more than marginal improvements in headline yield. It opens up a fundamental crypto vertical to a new set of investors.
The institutional appeal of staked ETH
Holding spot ETH offers pure exposure to price appreciation and drawdowns. But staked ETH introduces a recurring yield component that improves total return over time and partially offsets volatility. For institutions accustomed to thinking in risk-adjusted terms, this reframes ETH exposure closer to dividend-paying equities rather than growth assets.
Liquid staking tokens further strengthen the case, because they allow institutions to earn staking rewards while retaining balance-sheet flexibility. Positions can be rebalanced, used as collateral, or exited — without interrupting yield generation.
Just as importantly, staked ETH derivatives are increasingly accepted as transparent, over-collateralized instruments. For TradFi firms designing secured lending products, yield-enhanced notes, or delta-neutral strategies, staked ETH becomes usable in structure, not just in theory.
Yet despite these advantages, one obstacle has remained stubborn: risk.
How CESR and insurance change the equation
The CESR is a daily, standardized benchmark rate developed by CoinDesk Indices and CoinFund to measure the average annualized yield of ETH validator staking. It serves as a trusted reference rate for institutional staking and derivatives.
Thanks to this benchmark, a new method to earn a safe, long-term yield on ETH is emerging. Insurance companies like Chainproof (in partnership with IMA Financial Group) offer policies that essentially top up investors’ yield if their validator’s returns fall below the CESR benchmark and guarantee reimbursements if slashing occurs.
Benchmarking staking returns to the CESR — and wrapping that exposure with insurance — fundamentally alters how institutions perceive staking. Instead of open-ended technical risk, institutions get a defined, underwritten exposure. Downtime and operational failures are no longer existential threats to expected returns.
With insurance in place, CESR-linked staking begins to resemble instruments that TradFi already understands. The parallels are familiar: insured municipal bonds, enhanced money-market products, or short-duration credit with external credit support. These are not risk-free instruments, but they are priceable. Suddenly, staked ETH can be slotted into existing risk frameworks.
And once staking risk is benchmarked and insured, institutions can responsibly structure CESR-linked products. Capital-protected notes with staking yield, yield-plus strategies combining staking returns with basis trades, or delta-neutral ETH strategies with insured yield floors all become viable. Without insurance, compliance teams block these ideas.
TradFi firms cannot rely on informal assurances when dealing with regulators, LPs, or internal model validation teams. The CESR insurance model allows them to say: “Our exposure to ETH is benchmarked, insured, and underwritten by a regulated third party.” That single sentence materially changes how staking exposure is evaluated across compliance and fiduciary review processes.
Introducing ETH to the broader economy
With appropriate risk mitigation, CESR-linked staking begins to resemble infrastructure yield rather than speculative crypto return. That shift, more than yield itself, is why cautious TradFi firms are finally paying attention.
Ethereum’s long-term value proposition has always rested on its role as a global settlement infrastructure. Staking is the mechanism by which that infrastructure is secured and value accrues to participants. Insurance-backed staking does not change Ethereum’s economics; it translates them into a language institutions can understand.
Cautious TradFi firms are doing what they have always done: adopting new assets once risks are legible, bounded and transferable. They are not suddenly becoming crypto-native. CESR-linked, insured staking meets their needs, and that’s why they’re now quietly embracing staking, even though they once dismissed it.
Ether’s (ETH) 9% rally on Monday stalled at $2,200 due to stiff overhead resistance and weak ETF demand. Still, technical and onchain setups suggested that upward momentum may increase as long as ETH stays above the $2,000 mark.
Key takeaways:
-
Ether bulls must flip the $2,200 level into new support.
-
Spot ETF outflows continue, reflecting increasing institutional sell pressure.
Ether price must hold $2,200 as support
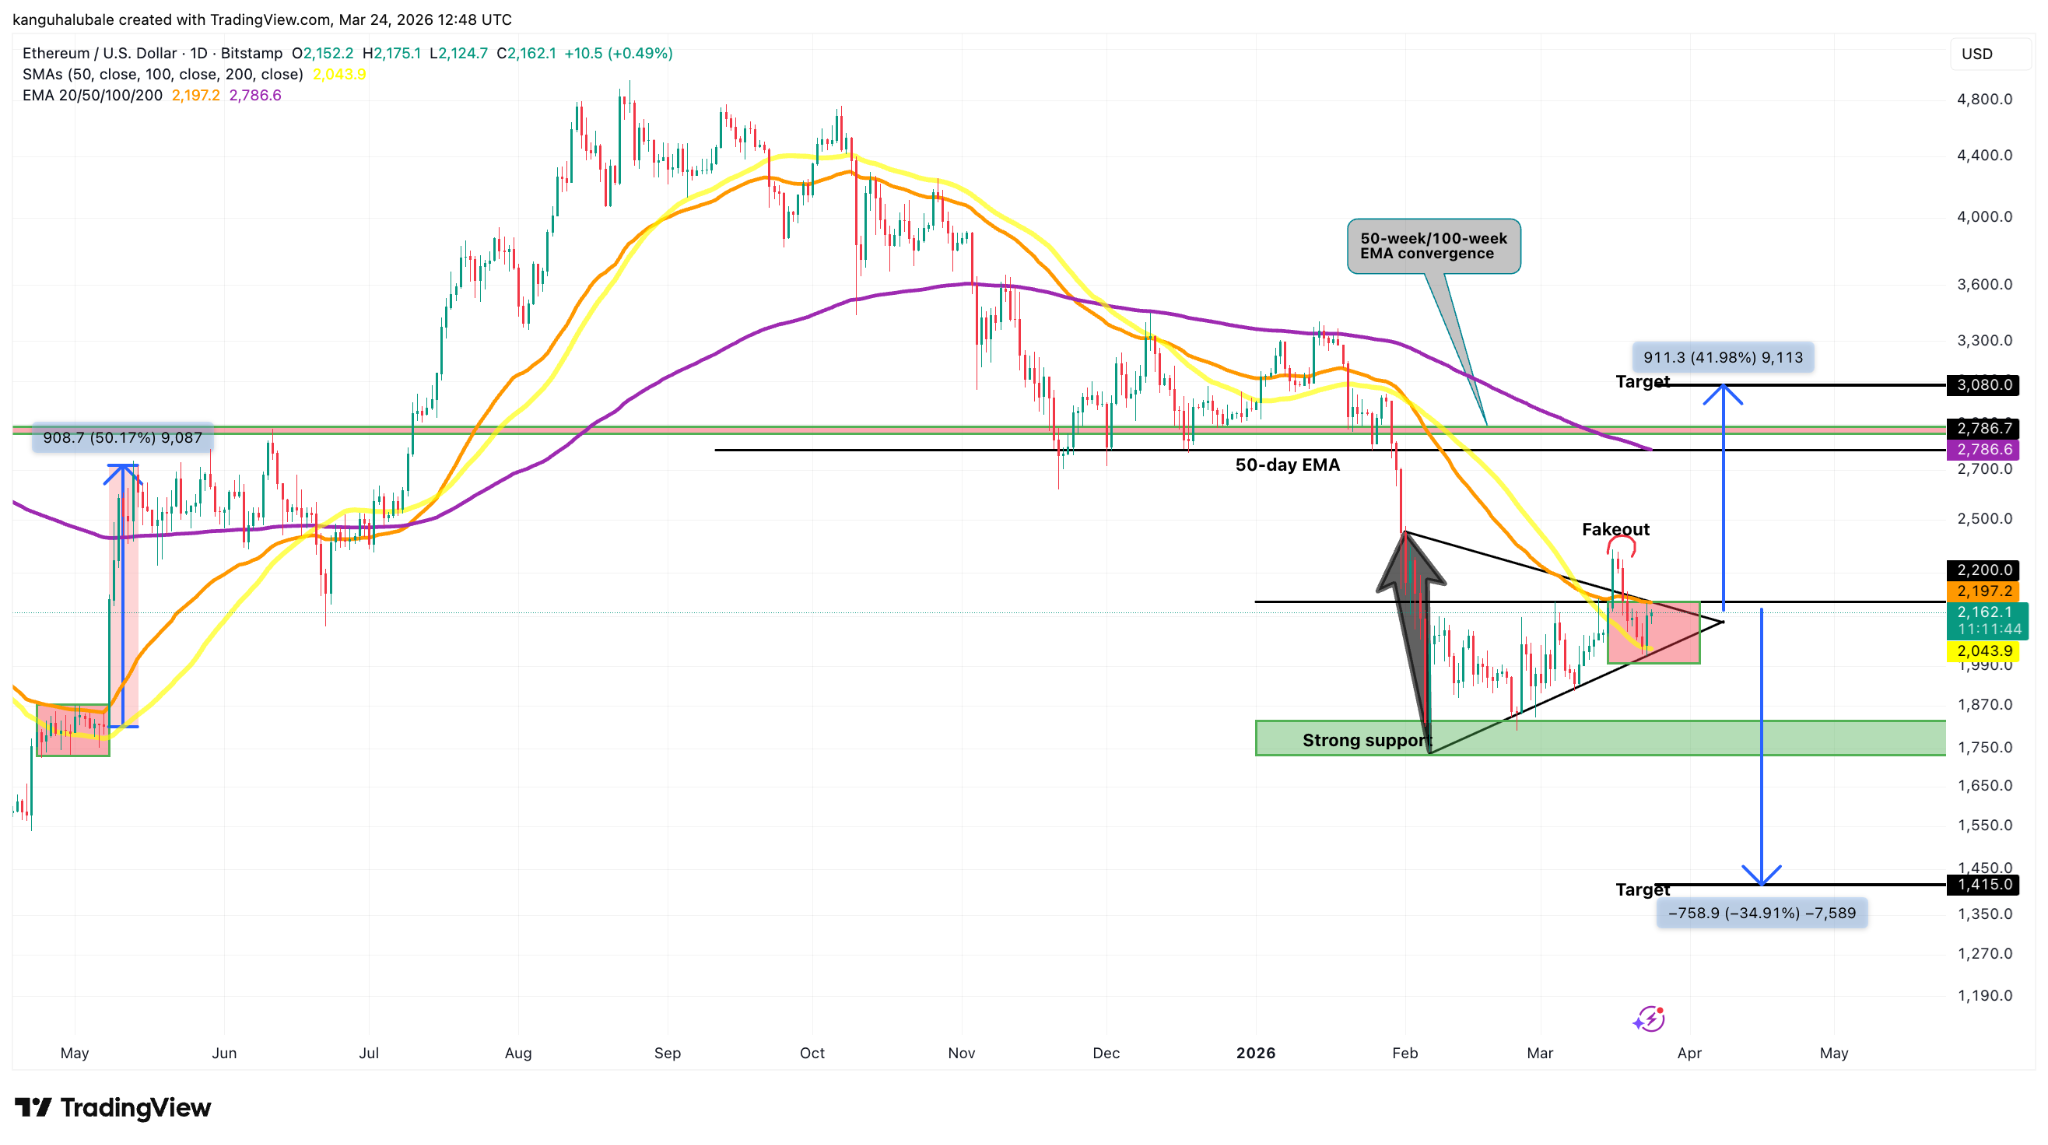
Data from TradingView shows that ETH price is stuck between two key trend lines: the 50-day exponential moving average (EMA) at $2,200 acting as resistance and the 50-day SMA at $2,000 as support.
Related: Ethereum may see 25% rally as richest ETH whales return to ‘profitable state’
ETH bulls must now reclaim the 50-day EMA to ensure a sustained recovery toward $3,000.
The last time ETH/USD broke out of such a range was in May 2025, triggering a 50% rally in less than seven days.

A break above $2,200 would confirm a bullish breakout from a symmetrical triangle pattern, with a measured target of $3,080, or a 42% rise from the current level.
Before this, however, the bulls would have to contend with stiff resistance between $2,780 and $2,880, where the 200-day EMA, the 50-week EMA, and the 100-week EMA converge.
Glassnode’s cost basis distribution heatmap shows a heavy accumulation at $2,750-$2,850, where investors acquired more than 7.5 million ETH.
Notably, there is a relatively low concentration of supply between $2,200 and the $2,700 cost-basis cluster, meaning a break above the current range may allow the price to move more freely toward the bigger overhead resistance.

On the downside, a dense accumulation cluster sits around $1,850, where investors previously acquired 1.3 million ETH.
If the $1,850-$2,000 support gives in, it could trigger the next leg lower toward the bearish target of the triangle at $1,400.
“$ETH failed to reclaim the $2,100 level and is now moving down,” analyst Ted Pillows said in a Monday post on X, adding:
“Now, the only crucial support level for Ethereum is $2,000 and if ETH loses it, the dump will accelerate to new lows.”

As Cointelegraph reported, holding above $2,000 would keep the medium-term trend intact, while a break below shifts the positioning toward aggressive short exposure, with the lower targets in focus.
Ethereum ETF inflows must return
One factor that could trigger an ETH price breakout is a resurgence in institutional demand, which has diminished with outflows from spot Ether exchange-traded funds (ETFs) over the last four days.
Data from Glassnode shows the 30-day average of the US spot ETH ETF flows drifting back into the negative zone after a short period of inflows.
If flows can re-accelerate into consistent positive territory, it would strengthen the case for renewed trend continuation for ETH.

Similarly, investors reduced exposure to global Ethereum investment products, which recorded over $27.5 million in net outflows during the week ending March 20.
Meanwhile, the number of Ethereum treasury companies buying ETH on a daily basis has dropped sharply since August 2025, reinforcing the decline in institutional demand.

Tom Lee’s Bitmine Immersion Technologies, the largest corporate Ethereum treasury holder, is the only company that appears to be buying, adding $139 million worth of ETH last week.
Bitmine’s total ETH holdings are now 4.66 million ETH, bringing it closer to its goal of acquiring 5% of the token’s circulating supply.
⚡️ LATEST: Bitmine ($BMNR) now holds 4.66 million $ETH and $11 billion in total crypto and cash assets. pic.twitter.com/mijC9tANBN
— Cointelegraph (@Cointelegraph) March 23, 2026
This article does not contain investment advice or recommendations. Every investment and trading move involves risk, and readers should conduct their own research when making a decision. While we strive to provide accurate and timely information, Cointelegraph does not guarantee the accuracy, completeness, or reliability of any information in this article. This article may contain forward-looking statements that are subject to risks and uncertainties. Cointelegraph will not be liable for any loss or damage arising from your reliance on this information.
BTC price fell below $70,000 on macro tensions as analyst considered a possible bullish “regime shift” already starting to play out for Bitcoin.
Bitcoin (BTC) fell below $70,000 at Tuesday’s Wall Street open as macro assets fell over Iran war tensions.
Key points:
-
Bitcoin fails to turn $70,000 support as macro selling pressure sparks losses across global assets.
-
Middle East tensions remain at the forefront, but analysis sees hope in Bitcoin’s “surprising resilience.”
-
Traders stay split over whether bulls can rescue the current range.
Bitcoin comeback could be in “early stages”
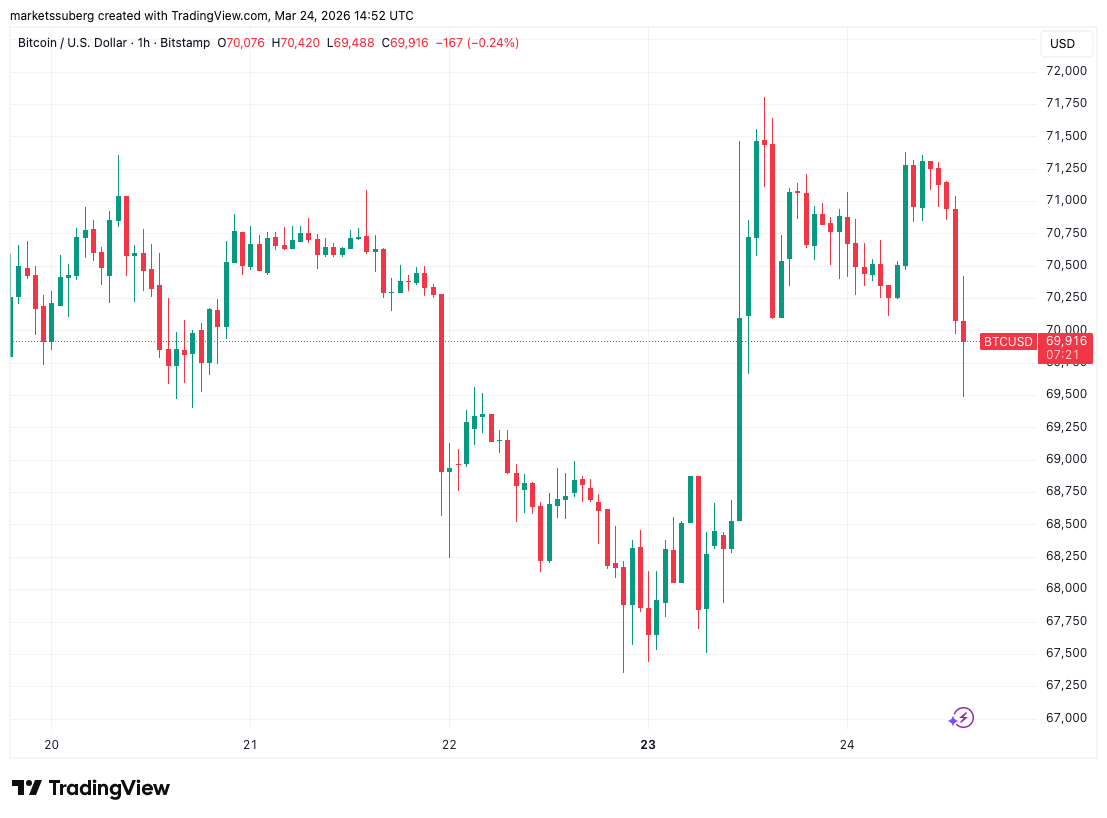
Data from TradingView showed 1.5% daily BTC price losses, with BTC/USD giving back some of its early-week sprint to $71,800.

US stocks opened down on the day, with the Nasdaq Composite Index losing nearly 1%, while gold failed to pass $4,450. Oil inched toward $95 per barrel after an initial drop to start the week on the back of Iran peace rumors.
Markets remained on edge over the fate of oil passage through the Strait of Hormuz amid new Israeli strikes on Lebanon.

Commenting, trading company QCP Capital said that US President Donald Trump was seeking market stability despite the ongoing military action.
“Trump is navigating an increasingly complex geopolitical minefield and now has very little room to manoeuvre,” it wrote in its latest “Market Color” analysis.
“With equities hovering near key support and inflation pressures lifting rate-hike expectations, he cannot afford to unsettle markets.”

QCP said that BTC price action showed “surprising resilience” in the face of an escalating war.
“This resilience may reflect lower leverage across the system, but it could also signal the very early stages of a regime shift for BTC, where it no longer competes with traditional risk assets in the same way,” it added.
BTC price not “out of the woods entirely”
Continuing the cautiously bullish tone, crypto trader Michaël van de Poppe flagged a series of higher lows for BTC/USDT beginning late last month.
Related: Bitcoin value ‘off the chart’ as BTC price metric hits record lows in 2026
“Bitcoin constantly prints higher lows since the crash early in February. It’s a great sign and it shows that we’re about to witness more strength,” he told X followers on the day.
“It doesn’t say that we’re out of the woods entirely, as those higher lows trigger a lot of liquidity if the markets get there. However, overall, as long as we hold these levels, I think that we’re able to reach $77-80K.”

Others remained convinced that new lows were due, with trader Jelle warning of a “Bart Simpson” chart pattern playing out on low time frames.
$BTC – Looks like Bart is going to pull his prank any minute now 👀 pic.twitter.com/c0pLeQBFus
— Jelle (@CryptoJelleNL) March 24, 2026
Trader and analyst Rekt Capital meanwhile confirmed skepticism over the strength of nearby long-term trend line.
As Cointelegraph reported, the 200-week exponential moving average (EMA) at $68,300 recently failed to act either as definitive support or strong resistance.
“The 200-week EMA is acting as both an unreliable resistance and an unreliable support, never truly confirming a clear role. Which thus could lend itself to further meandering in and around here before ultimately breaking down into additional Macro Downside over time,” he summarized on X.

This article does not contain investment advice or recommendations. Every investment and trading move involves risk, and readers should conduct their own research when making a decision. While we strive to provide accurate and timely information, Cointelegraph does not guarantee the accuracy, completeness, or reliability of any information in this article. This article may contain forward-looking statements that are subject to risks and uncertainties. Cointelegraph will not be liable for any loss or damage arising from your reliance on this information.
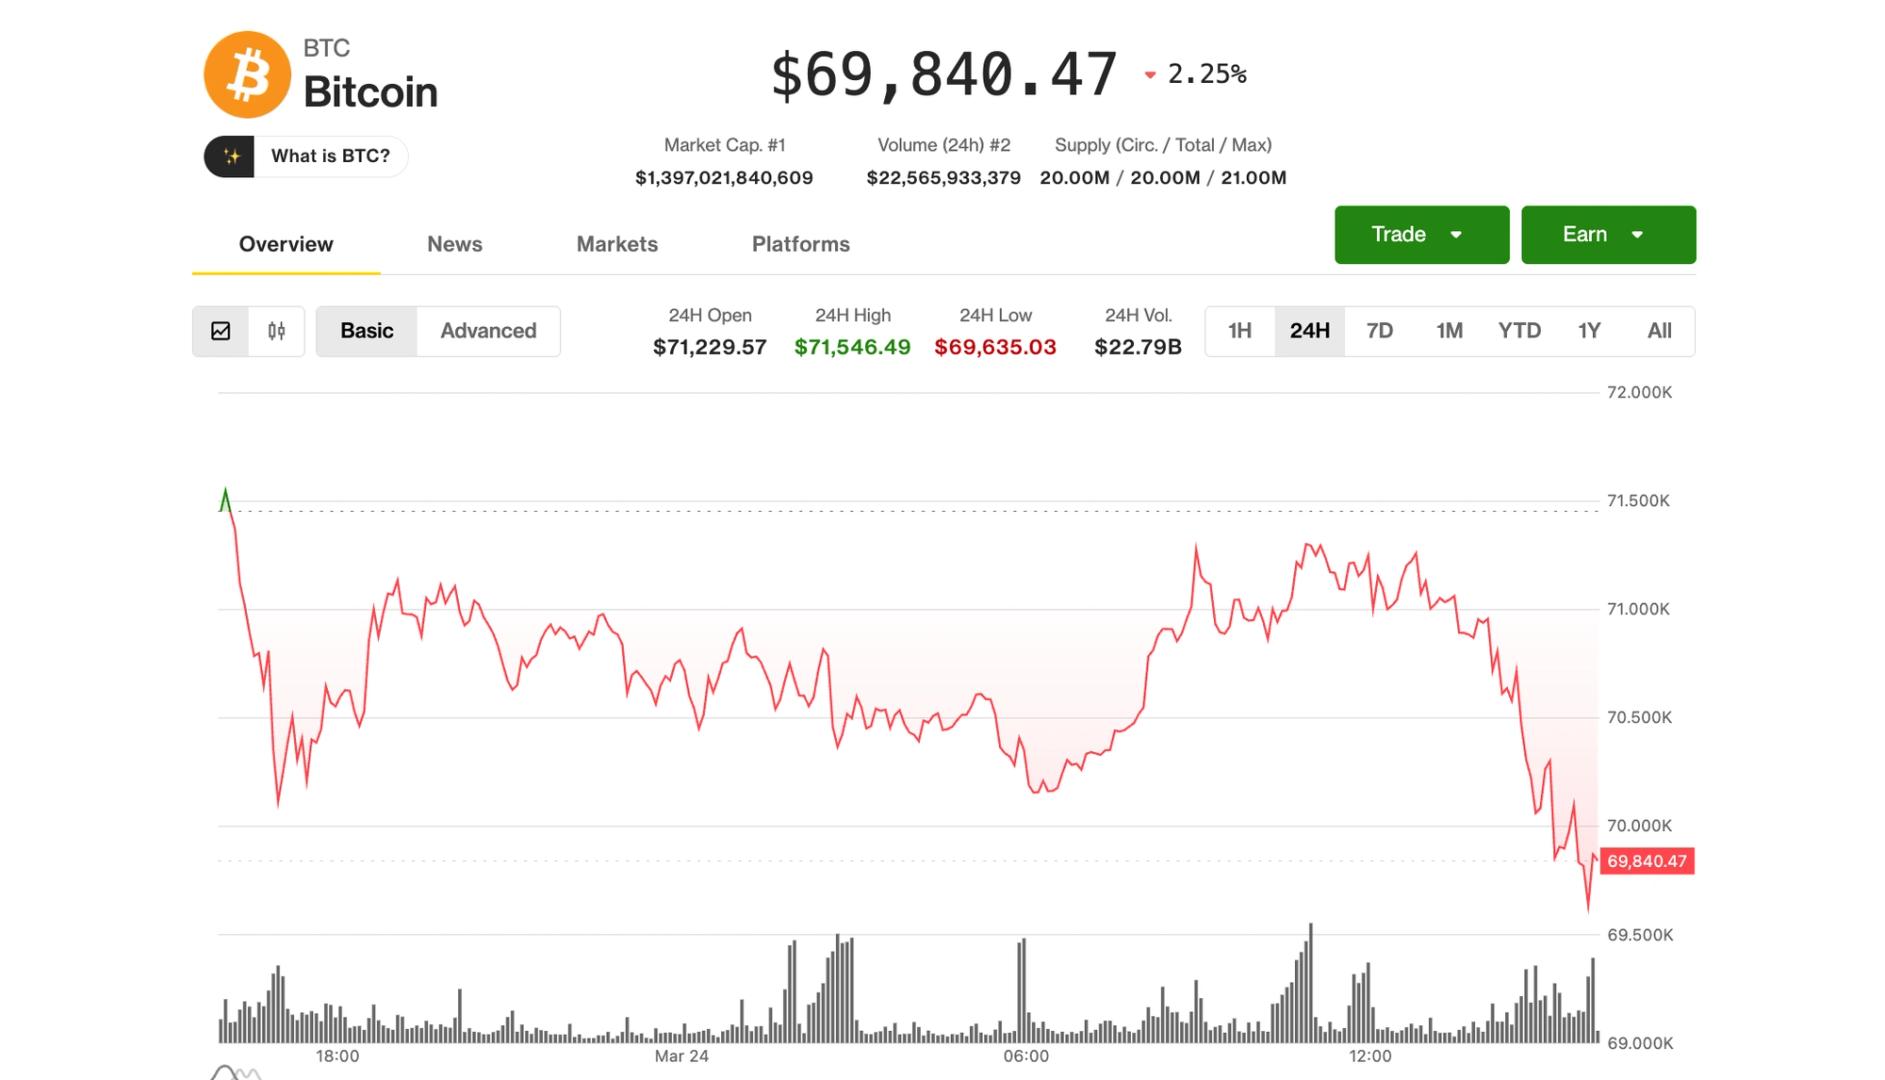

Bitcoin slipped back toward $69,000 on Tuesday morning as a broader pullback in equities spilled over into crypto markets.
After trading near $71,000 earlier in the session, BTC fell to around $69,600 in the early U.S. hours, tracking a broader reversal in risk assets. Ether (ETH), Solana (SOL) and XRP (XRP) were also down 2%-3% over the past 24 hours.
Bitcoin appears to be continuing to follow a familiar trend over the past three months. It has typically risen by just over 1% on Mondays and then fall slightly under 1% on Tuesdays, according to Velo data.
The move also came as software stocks rolled over, with the iShares Expanded Tech-Software Sector ETF (IGV) dropping about 4%. Crypto prices have moved closely in line with the sector in recent months, with both trending lower since October. That relationship was on full display again, with digital assets weakening alongside that particular area of tech.
The S&P 500 and Nasdaq equity indexes were 0.5% and 0.8% lower, giving up much of their Monday gains on news about talks between U.S. and Iran. Global yields continue to climb, the DXY remains firm above 99, and oil has risen 2% over the past 24 hours, reinforcing the broader risk-off tone.
Crypto-linked equities also came under pressure. Circle (CRCL), issuer of the USDC stablecoin, led declines, tumbling 16% in a sharp reversal after its recent rally that took the shares more than 100% higher in a month. Crypto exchange Coinbase (COIN) dropped 8%. The moves happened as CoinDesk reported late Monday that the latest version of the Clarity Act won’t allow rewards on balances, limiting yields on stablecoins. “That weakens a key part of the bull case by making USDC harder to evolve from a payments utility into a real store-of-value product,” Shay Boloor, chief market strategist at Futurum Equities, said in an X post.
USDT issuer Tether, key rival of Circle, also announced that it hired a “Big Four” accounting firm for a complete audit, seen as a major step to improve trust in USDT’s reserve assets.
Shift in interest rate expectations
In one of the more remarkable 180-degree turnarounds in recent years, market participants have gone, in a matter of weeks, from debating how many central bank rate cuts there would be in 2026 to pricing in imminent rate hikes.
According to CME FedWatch, there’s now zero chance of a rate cut at either the April or June Federal Reserve policy meetings, and instead about a 15% chance of a rate hike. The June Fed meeting would presumably be chaired by Kevin Warsh, whom President Trump has nominated to replace Jerome Powell as head of the U.S. central bank with the supposed intention of lowering borrowing costs.
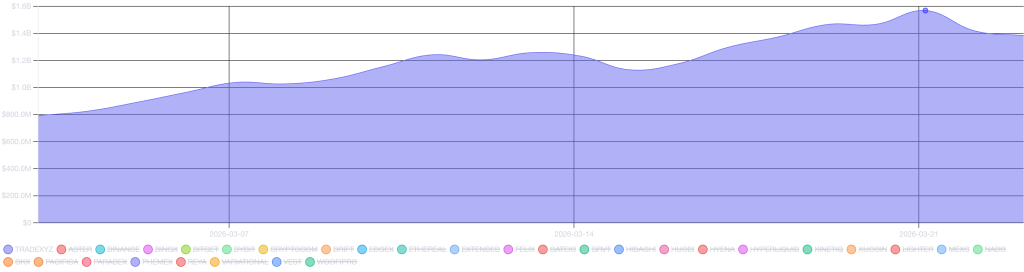
Hyperliquid’s HIP-3 aggregated open interest smashed through records to hit $1.74 billion on Sunday, marking a 25% vertical climb from $1.39 billion just last week.
The surge is not being driven by Bitcoin or Ethereum, but by a massive capital rotation into tokenized commodities via Trade.xyz, the ecosystem’s dominant interface.
While the broader crypto market chugs sideways and traditional commodity markets face volatility, traders are aggressively bidding RWA (real-world asset) perp markets, with WTI crude oil volumes now flipping major crypto pairs.
- Open Interest: Aggregated HIP-3 markets hit a record $1.74B, with Trade.xyz commanding 91.3% market share.
- Key Driver: Tokenized commodities like WTI Crude and Silver are outpacing crypto native assets in volume.
- Market Signal: Traders are using DeFi rails for 24/7 exposure to Middle East geopolitical risks, bypassing legacy market hours.
Data Deep Dive: Oil Flips Ethereum on Hyperliquid
The numbers confirm a structural shift in how traders are using Hyperliquid. Trade.xyz—built by Hyperliquid’s tokenization arm Hyperunit, now holds $1.58 billion in open interest.
That is 91.3% of the total HIP-3 market. This is no longer a crypto-derivative story; it is a traditional asset story running on crypto rails.
On Monday, Trade.xyz reported 24-hour volumes peaking at $5.6 billion with over 45,300 unique daily traders. The composition of this volume is striking.

WTI crude oil generated $1.27 billion in 24-hour volume, followed by Brent oil at $1.04 billion and silver at $1.01 billion. For perspective, these RWA volumes effectively flipped Ethereum trading activity on the platform during peak hours.
Traders are voting with their liquidity: the HYPE token has rallied over 50% year-to-date, decoupling from Bitcoin’s 15% drawdown over the same period.
The driver is geopolitical, not technological. Escalating tensions in the Middle East have injected massive volatility into energy markets, creating an urgent demand for continuous price discovery.
Traditional brokerage accounts close on Friday evenings and do not reopen until Sunday night or Monday morning. Hyperliquid’s HIP-3 markets never close.

When news breaks over the weekend, legacy traders are frozen. On Hyperliquid, you can hedge immediately.
This 24/7 capability is solving a genuine market friction for tokenized commodities. The platform is capturing flows that would usually sit trapped in closed order books. As new derivatives platforms enter the market such as OneBullEx launching AI-native futures, the competition for this 24/7 liquidity layer is intensifying, but Hyperliquid currently has the first-mover massive volume advantage.
What to Watch Next
The growth of Trade.xyz validates the thesis that DeFi infrastructure can service traditional finance flows. However, the regulatory optics are heating up. As lawmakers scrutinize tokenization, the permissionless nature of HIP-3 listings could attract attention from the CFTC if US volumes are significant. Until then, the trend is clear: liquidity is moving on-chain.
Traders should also monitor the rollout of HIP-4, which is currently in testnet. This upgrade introduces permissionless prediction markets, potentially expanding the ecosystem beyond commodities and into event contracts. If HIP-4 replicates the adoption curve of HIP-3, the HYPE token could see another repricing event as the protocol diversifies its fee generation further.
Discover: The best new crypto in the world
The post Hyperliquid HIP-3 Open Interest Hits $1.4B as Tokenized Commodities Surge appeared first on Cryptonews.

Key Highlights
- Grab revealed plans to execute up to $400 million in share buybacks from its authorized $500 million program
- The company entered a $250 million accelerated share repurchase deal with JPMorgan Chase
- An additional contingent forward purchase agreement with Morgan Stanley accounts for up to $150 million
- The entire repurchase initiative is financed through cash on hand without incurring new debt
- GRAB shares increased 4.81% following the announcement; current analyst consensus sits at Buy with a $5.93 target
Shares of Grab Holdings (GRAB) advanced on Tuesday following the company’s disclosure that it plans to execute up to $400 million of its board-approved $500 million share repurchase authorization within the coming four-month period.
The Southeast Asian super-app operator made the disclosure through an SEC filing accompanied by a formal press release dated March 24, 2026.
The repurchase strategy consists of two distinct components. First, Grab established a $250 million accelerated share repurchase (ASR) arrangement with JPMorgan Chase Bank. This agreement provides Grab with an upfront delivery of approximately 54.9 million Class A ordinary shares, with final settlement quantities determined by volume-weighted average pricing through the completion date, anticipated during Q2 2026.
The secondary component involves a contingent forward purchase contract with Morgan Stanley & Co. LLC covering up to $150 million in value. This arrangement operates based on predetermined price levels and is set to conclude in July 2026.
At the time of publication, shares were trading 4.81% higher, signaling market enthusiasm for the capital allocation strategy.
Cash Reserves Power the Repurchase
Grab is financing both agreements exclusively through its current cash position. The company disclosed gross cash liquidity totaling $7.4 billion and net cash liquidity of $5.4 billion as of December 31, 2025.
This robust financial position enables Grab to distribute capital to shareholders while maintaining operational investment capacity. Following completion of this buyback execution, $100 million remains available under the original $500 million authorization for potential future deployment.
The share repurchase program received Board of Directors approval in February 2026. This marks just the second such program in Grab’s corporate timeline.
Analyst Perspective
The latest analyst assessment on GRAB reflects a Buy rating, accompanied by a price objective of $5.93.
Analyst models also identify an elevated P/E multiple and questions regarding cash-flow stability as continuing risk factors.
Grab’s market capitalization was approximately $14.93 billion when the buyback announcement was made.
The stock maintains an average daily trading volume of roughly 46.4 million shares.

Aptos’ APT price jumps off record lows as volume spikes, regulatory clarity lands, and network usage hits new highs, but the token still trades near the bottom of its historical range.
Summary
- APT changes hands around $1.03–$1.04, up roughly 8.6–10% in 24 hours, with daily volume near $205–$239 million.
- Market cap sits around $824.5 million after Aptos bounced off an all‑time low of $0.7926 set in late February 2026.
- The move comes as Aptos processes about 10 million daily transactions and wins a key U.S. regulatory decision classifying APT as a commodity.
Aptos (APT) price is trading near $1.03 today, with CoinMarketCap showing APT up 8.57–10.20% over the last 24 hours and a 24‑hour trading volume of roughly $238.56 million. CMC’s latest analysis notes that APT is up 9.93% to $1.04 in 24 hours, driven by a “high‑conviction volume surge” as spot trading volume jumps 175.51% to about $204.96 million, far above its 7‑day average. Despite this bounce, Aptos remains deeply depressed versus history: the token printed an all‑time low of $0.7926 on February 23, 2026 and still trades more than 94% below its all‑time high around $19.90.
Aptos is a high‑performance Layer 1 blockchain built by former Meta engineers from the Diem/Move initiative, designed for security, scalability and mainstream adoption. According to CoinMarketCap, the network now clears close to 10 million daily transactions with average fees as low as $0.00007, a level of throughput that contrasts sharply with the token’s depressed price. Proposal 183, ratified by the community on March 1, 2026, set a hard supply cap of 2.1 billion APT and permanently directed gas fees to be burned, introducing structural deflation as on‑chain activity grows.
On‑chain and macro news flow has turned more supportive even as price lags. Recent CMC coverage highlights three major developments: the U.S. SEC has classified APT as a commodity, Binance is preparing to delist APT perpetual futures on March 25, 2026, and the network’s 10‑million‑transactions‑per‑day milestone is now paired with deflationary tokenomics. The removal of APT perps from Binance could temporarily sap derivatives liquidity and speculative open interest, but it also pushes price discovery back toward spot markets at a moment when volume is surging and the token is trading near historical capitulation levels.
In the wider smart‑contract sector, Aptos is still underperforming: CoinGecko data shows APT down about 9.90% over the past week, compared with a 0.70% rise in the global crypto market and a 1.70% gain for similar smart‑contract platforms, underscoring how sharp today’s bounce is relative to a still‑bearish medium‑term trend.


Five months after a $128M exploit rocked the protocol, Balancer is proposing its most radical restructuring yet.
The team behind veteran DeFi protocol Balancer has posted two sweeping governance proposals that would wind down Balancer Labs, consolidate all operations under a DAO-controlled entity, and end BAL token emissions entirely.
The operational restructuring proposal, posted on March 23, formalizes the wind-down of Balancer Labs OÜ, the Estonian entity that originally built the protocol, and consolidates all activity under Balancer OpCo Limited, a BVI entity that operates as a direct agent of the DAO.
The team would shrink from roughly 25 to 12.5 full-time equivalents, with an annual operating budget of $1.9 million — a 34% cut from the $2.87 million approved under the previous roadmap.
The accompanying tokenomics revamp proposal, also published on Monday, goes further. It proposes halting all BAL emissions immediately, sunsetting veBAL — the protocol’s governance and yield-bearing token — and routing 100% of protocol fees to the DAO treasury. The move would replace a fragmented split that previously flowed to veBAL holders, core pool incentives, and partners.
To soften the blow for locked veBAL holders, the proposal includes a $500,000 compensation campaign paid in stablecoins over six months. The proposal also offers a BAL buyback and burn program capped at 35% of treasury holdings, or roughly $3.6 million, at net asset value (~$0.16 per BAL) — a slight premium to current market prices that would retire approximately 35% of circulating supply if fully exercised. The buyback and burn program is aimed at “providing exit liquidity for holders who want out.”
The projected impact, per the proposal, includes reducing Balancer’s annual deficit from ~$2.6 million to ~$700,000, and extending its treasury runway from under four years to roughly nine.
In an extended X post following the proposals, Marcus Hardt, CEO and co-founder of Balancer Labs, framed the moves as a necessary reckoning. “The technology works. Balancer v3 works. Boosted pools work. The infrastructure we built is strong,” he wrote. “What stopped working was the economic model around it.”
Hardt acknowledged the pain for veBAL holders directly:
“If you locked in good faith, losing those economic rights is painful. That is exactly why the buyback and the compensation campaign are part of the package. The goal is not to trap anyone into a decision.”
November Exploit
The restructuring comes as Balancer tries to find stable footing after a brutal stretch. The protocol was hit by a $128 million exploit in early November, the same week that Stream’s unwind shook broader confidence in DeFi. The proposals acknowledge that the November exploit “removed the option of growing out of” problems with the economic model that had been building for some time.
The exploit triggered months of crisis response, significant TVL loss, and difficult decisions about what the protocol could realistically sustain. The current restructuring proposals are the clearest signal yet of just how much the event reshaped Balancer’s trajectory.
Despite the severity of the changes, Hardt struck a cautiously optimistic tone. “Balancer still has real products. Boosted pools are generating real usage,” he wrote on X. “I believe the protocol still has room to build products and revenue streams that fit Balancer uniquely well.”
Both proposals are live on the governance forum and open for community discussion ahead of a snapshot vote.
BAL is mostly flat on the news, down less than 1% in the past 24 hours, and over 99% from its 2021 all-time hight.
Labs vs DAO Restructuring
Balancer’s restructuring is the latest in a string of high-profile governance crises forcing DeFi projects to confront whether the Labs-plus-DAO structure — once a standard template for decentralized protocols — is still fit for purpose. At Aave, months of escalating conflict between Aave Labs and the DAO over fee distribution, brand ownership, and token-holder rights eventually pushed Labs to propose routing 100% of product revenue to the DAO treasury — though not before key service provider BGD Labs announced it was leaving amid the fallout.
Meanwhile, cross-chain bridge protocol Across took an even more radical turn, with Risk Labs proposing to dissolve the DAO entirely and convert the project into a U.S. C-corporation, citing friction with institutional partners.
This article was written with the assistance of AI workflows. All our stories are curated, edited and fact-checked by a human.

Ethereum-based decentralized finance (DeFi) lending protocol Fira said on Tuesday it was launching with about $450 million in deposits, highlighting demand for fixed-rate onchain credit.
Fira said the protocol’s fixed-rate credit market allows users to lock borrowing costs and lending returns for defined periods by organizing lending around maturities rather than floating utilization-based rates, according to an announcement shared with Cointelegraph.
The fixed-rate model differs from most DeFi lending protocols, where borrowers cannot lock funding costs, and lenders cannot predict returns, making long-term DeFi lending less predictable. Fira’s said its model organizes markets by maturity and determines interest rates by supply and demand mechanics, replacing utilization algorithms that fluctuate with borrowing activity.
Fira said the design is intended to create a more predictable onchain credit market by introducing yield curves and defined maturities, features that are standard in traditional fixed-income markets but rare in DeFi.
Fira is not the first DeFi lending protocol built around fixed-rate credit. Other protocols with similar structures include Notional Finance, IPOR and Term Finance.

Euler-linked liquidity migrated into Fira
Fira said it debuted with $450 million in deposits, which were “reallocated” from users of the modular lending platform Euler Finance during the pre-launch phase that started on Jan. 8, Pete Siegel, chief financial officer at Fira, told Cointelegraph.
“Fira was pre-launched in January. It opened with a first market called UZR, which enabled roughly a thousand users who were already on Euler, in a product available on Euler to migrate their assets at a fixed rate.”
Siegel said the deposits reflect user interest in fixed-rate lending products.

DefiLlama currently shows Fira with about $451.6 million in total value locked on Ethereum, compared with roughly $25.3 billion for Aave, the sector’s largest lending protocol.
Related: Maestro launches mining-backed Bitcoin credit market for institutions
Fira said its smart contracts have undergone six independent security audits conducted by Sherlock, Spearbit via Cantina, Hexens and yAudit between November 2025 and early 2026.
Fira’s bug bounty program through Sherlock offers up to $500,000 in rewards for users finding critical vulnerabilities in the protocol’s open-source Ethereum-based smart contracts.
Magazine: DeFi will rise again after memecoins die down: Sasha Ivanov

Binance is updating its VIP program to lower entry thresholds and broaden pathways to higher-tier benefits. The release outlines easier access for VIP 1 to 3 by reducing BNB holdings, easing 30-day Futures trading requirements, and a new Holder Program that extends eligibility through VIP 9. It also introduces VIP Rising Star to recognize high-potential users early. The overall aim is to identify and support high-value users as they scale their activity across trading, holdings, and investments, while preserving tier recognition tied to sustained engagement. The changes are positioned to improve liquidity and the service experience for active participants as Binance grows its user base.
Key points
- Lower BNB holding requirements: VIP 1 from 25 to 5 BNB; VIP 2 from 100 to 25; VIP 3 from 250 to 100.
- Lower 30-day Futures trading thresholds: VIP 1 from 15,000,000 USD to 5,000,000 USD; VIP 2 from 50,000,000 to 10,000,000; VIP 3 from 100,000,000 to 50,000,000.
- Holder Program expands eligibility through VIP 9, with BNB holdings and Alpha assets included in asset calculations.
- VIP Rising Star designation for users with a 30-day average net asset balance of 30,000 USD and 5 BNB, plus personalized support and exclusive opportunities.
Why it matters
These adjustments are intended to recognize a broader group of high-value users earlier and to tie VIP status more closely to sustained platform engagement. By lowering thresholds and introducing new pathways, Binance seeks to improve access to VIP benefits, enhance liquidity, and strengthen the service experience for active participants across trading, earn products, and holdings. For readers and builders, the update could affect how users scale on the platform and how partners interact with VIP services as adoption grows.
What to watch
- Activation timeline for the updated VIP thresholds and when users can qualify under VIP 1–3 changes.
- Details of the Holder Program rollout through VIP 9, including asset calculation changes.
- Uptake and onboarding for VIP Rising Star, including benefits and eligibility criteria.
Disclosure: The content below is a press release provided by the company or its PR representative. It is published for informational purposes.
Binance Expands VIP Access to Recognize and Support High-Value Users Earlier
Lower BNB holding and Futures trading thresholds for VIP 1 to VIP 3, a new Holder Program through VIP 9, and an exclusive VIP Rising Star pathway
ABU DHABI, UAE, March 24, 2026 — Binance, the largest cryptocurrency exchange by trading volume and users, today announced updates to its VIP Program eligibility thresholds and qualification framework. The refresh lowers key requirements and introduces new pathways designed to identify and support high-value users earlier as they scale their engagement across the platform. The changes also strengthen the competitiveness of the Binance VIP Program and make VIP benefits more attainable for a broader range of users.
“We are evolving our VIP Program to better recognize the broad base of high-value users contributing to Binance across trading, holdings, and investments, and to identify and support them earlier in their journey as they scale,” said Catherine Chen, Head of VIP and Institutional at Binance.
“By lowering key thresholds and updating holder criteria, we are widening the on-ramp to VIP benefits while keeping tier recognition tied to sustained, measurable engagement. These updates also help strengthen the liquidity and service experience that active participants rely on. Binance surpassed 300 million users in late 2025, and we are focused on reaching 1 billion users over time.”
To make progression more attainable while keeping tier recognition tied to sustained, measurable engagement, Binance is lowering BNB holding requirements for VIP 1 to VIP 3 and aligning them across VIP programs. Required BNB holdings will change as follows: VIP 1 from 25 BNB to 5 BNB, VIP 2 from 100 BNB to 25 BNB, and VIP 3 from 250 BNB to 100 BNB.
Binance is also lowering 30-day Futures trading volume requirements for VIP 1 to VIP 3 to better match current market dynamics. 30-day Futures thresholds will change from 15,000,000 USD to 5,000,000 USD for VIP 1, from 50,000,000 USD to 10,000,000 USD for VIP 2, and from 100,000,000 USD to 50,000,000 USD for VIP 3. With these updated requirements, VIP 1 and VIP 2 Futures trading fees have been slightly adjusted to maintain a balanced fee structure, while VIP 3 trading fees remain unchanged.
In addition, users who qualify through holding or investing activities, including Binance Earn, will now follow a new eligibility framework under the Holder Program, with expanded eligible VIP levels through VIP 9. BNB holdings and Alpha account assets will also be included in overall asset holding calculations, providing greater flexibility for users to allocate assets across products while maintaining the highest VIP tier they qualify for.
Binance is also introducing VIP Rising Star, a new designation created to recognize and support high-potential users on their journey toward Binance VIP. Users with a 30-day average net asset balance of 30,000 USD, including 5 BNB or more, will be eligible for VIP Rising Star and can receive personalized support, access to curated events, and exclusive opportunities designed to accelerate their path to VIP.
Binance VIP is a tiered program designed for users operating at higher levels of activity across trading, loans, and asset holdings, offering benefits that can include lower fees, higher limits, priority support, advanced insights, VIP swag, event invitations, and more. Find out more about the VIP Program updates here.
Disclaimer: Digital asset prices are subject to high market risk and price volatility. The value of your investment may go down or up, and you may not get back the amount invested. You are solely responsible for your investment decisions and Binance is not liable for any losses you may incur. Past performance is not a reliable predictor of future performance. You should only invest in products you are familiar with and where you understand the risks. You should carefully consider your investment experience, financial situation, investment objectives and risk tolerance and consult an independent financial adviser prior to making any investment. This material should not be construed as financial advice. For more information, see our Terms of Use and Risk Warning.
About Binance
Binance is a leading global blockchain ecosystem behind the world’s largest cryptocurrency exchange by trading volume and registered users. Binance is trusted by more than 310 million people in 100+ countries for its industry-leading security, transparency, trading engine speed, protections for investors, and unmatched portfolio of digital asset products and offerings from trading and finance to education, research, social good, payments, institutional services, and Web3 features. Binance is devoted to building an inclusive crypto ecosystem to increase the freedom of money and financial access for people around the world with crypto as the fundamental means. For more information, visit: https://www.binance.com.
About Binance VIP & Institutional
Binance VIP & Institutional empowers institutions and private wealth clients with robust asset management infrastructure, personalized VIP services and advanced end-to-end institutional trading tools on the world’s largest cryptocurrency exchange by trading volume and registered users. With deep financial services experience in both traditional and crypto markets, its global team of trusted experts provides VIP & Institutional clients with the support they need to confidently capitalize on the industry’s deepest liquidity and tightest markets.
For more information, visit: https://www.binanceinstitutional.com

Why cautious TradFi firms love staked ether
One Rookie CB Is Too Fast for the Vikings

Fire out and shelter order lifted after Texas oil refinery explosion

Smart energy pays enters the US market, targeting scalable financial infrastructure

Why Israel is blocking foreign journalists from entering

Bitcoin: We’re Entering The Most Dangerous Phase

XRP MAY BE VOLATILE AFTER THE MARKET OPENS – XRP ISN’T DECOUPLED YET – CRYPTO RUNS ON TRUMP COMMENTS

FINANCIAL FLEX with NFL Players #nfl #financialflex #SuperBowl #relatable

5 highest PAYING Finance Courses other than MBA | The IIM GUY
-
 Crypto World4 days ago
NIO (NIO) Stock Plunges 6.5% as Shelf Registration Sparks Dilution Worries
-

 Fashion4 days ago
Weekend Open Thread: Adidas – Corporette.com
-

 Politics4 days ago
Jenni Murray, Long-Serving Woman’s Hour Presenter, Dies Aged 75
-
 Tech7 days ago
Are Split Spacebars the Next Big Gaming Keyboard Trend?
-

 Crypto World3 days ago
Best Crypto to Buy Now: Strategy Just Spent $1.57 Billion on Bitcoin During Fear While Early Investors Quietly Enter Pepeto for 150x Potential
-

 News Videos6 days ago
RBA board divided on rate cut, unusually buoyant share market | Finance Report | ABC NEWS
-

 Crypto World3 days ago
Bitcoin Price News: Bhutan Sells $72 Million in BTC Under Fiscal Pressure, but the Smart Money Entering Pepeto Sees What the Market Does Not
-

 Politics6 days ago
The House | The new register to protect children from their abusers shows Parliament at its best
-

 Tech4 days ago
inKONBINI Lets You Spend Summer Days Behind the Register
-

 Crypto World6 days ago
Canada’s FINTRAC revokes registrations of 23 crypto MSBs in AML crackdown
-

 Sports1 day ago
Remo Stars and Kano Pillars Strengthen Survival Hopes in NPFL
-
 NewsBeat6 days ago
Residents in North Lanarkshire reminded to register to vote in Scottish Parliament Election
-

 News Videos6 days ago
PARLIAMENT OF MALAWI – PAC MEETING WITH REGISTRAR OF FINANCIAL ON AMARYLLIS HOTEL – INQUIRY LIVE
-

 Politics5 days ago
Gender equality discussions at UN face pushbacks and US resistance
-

 Business2 days ago
No Winner in March 21 Drawing as Prize Rolls to $133 Million for Next
-

 Business6 days ago
Who Was Alex Pretti? 5 Key Facts About the ICU Nurse Killed by Federal Agents in Minneapolis
-

 Sports1 day ago
Gary Kirsten Accuses Pakistan Cricket Board Of ‘Interference’, Mohsin Naqvi Responds
-

 Tech2 days ago
Give Your Phone a Huge (and Free) Upgrade by Switching to Another Keyboard
-

 Sports4 days ago
2026 Kentucky Derby horses, odds, futures, preview, date: Expert who nailed 12 Derby-Oaks Doubles enters picks
-
Sports5 days ago
Vikings Free Agency Enters Phase 2 with Key Questions
You must be logged in to post a comment Login