

Crypto World
Bitcoin Slides to $67K as Whale Profit-Taking Counters Market Optimism
Bitcoin returned to a downward trend after briefly reclaiming the $74,000 level earlier in the week. The cryptocurrency now trades near $67,000 after losing roughly three percent within twenty four hours. Market data shows selling pressure increasing despite recent positive developments across regulation and institutional adoption.
The decline follows a sharp rally that pushed Bitcoin close to $74,000 during the previous trading sessions. However, the upward move quickly reversed as large holders began reducing their recently accumulated positions. Consequently, the market erased about $110 billion in total cryptocurrency value by the end of the week.
Price swings have become frequent during recent months as rallies often face selling pressure before the weekend. Meanwhile, broader market sentiment remains mixed even though institutional and policy developments continue to support long term growth.
Key Highlights
- Bitcoin falls to $67K as whales sell 66% of recent BTC accumulation
- Retail buying increases while large holders lock profits near $74K
- Spot Bitcoin ETFs record $348.9M in net outflows across 11 funds
- Market ignores positive regulatory and institutional crypto news
- Oversold indicators suggest Bitcoin could face deeper correction
Whale Selling Activity Increases After Bitcoin Reaches $74K
Bitcoin currently trades around $67,000 after falling sharply from its weekly high above $74,000. Large holders accumulated significant amounts of BTC between February 23 and March 3. During that period, the asset traded between $62,900 and $69,600 while accumulation steadily increased.
However, profit taking emerged quickly once Bitcoin recovered above the $70,000 threshold. Data analysis indicates that whales have already sold approximately sixty six percent of their recent buying activity. As a result, the market lost upward momentum despite strong retail demand.
Retail buyers entered the market aggressively when Bitcoin dropped below the $70,000 level. Yet large holders began locking in profits while prices remained elevated. This pattern historically appears before deeper price corrections across cryptocurrency markets.
ETF Outflows Add Pressure to the Bitcoin Market
Exchange traded funds linked to Bitcoin also experienced notable capital withdrawals during the same period. Data shows that the eleven spot Bitcoin ETFs recorded a combined $348.9 million in net outflows. This represents the largest withdrawal from these products since February 12.
ETF flows often influence broader market sentiment because institutional exposure enters the market through these vehicles. When funds record strong inflows, prices typically gain upward momentum. However, sustained withdrawals usually signal reduced demand from institutional participants.
The recent outflows therefore reinforced the selling pressure already created by large holders. Consequently, Bitcoin struggled to maintain gains achieved earlier in the week. Market momentum weakened further as price volatility increased across major cryptocurrency exchanges.
Crypto is finally starting to pump
I think the bull market is about to start
My prediction is $240k Bitcoin this cycle
I am very bullish on 2026!! pic.twitter.com/rBuUfJJwYL
— borovik (@3orovik) March 5, 2026
Positive Institutional Developments Fail to Lift Prices
Bitcoin’s price decline occurred despite a series of developments that usually support market rallies. The cryptocurrency approached $74,000 earlier after several positive regulator and institutional updates. However, the market reaction remained muted as selling pressure quickly emerged.
Negotiations surrounding the CLARITY Act reportedly continued progressing in a favorable direction. The legislation aims to provide clearer regulatory guidelines for digital assets in the United States. Such policy clarity historically encourages stronger institutional participation in the sector.
At the same time, a major banking development also strengthened the institutional narrative around Bitcoin. Morgan Stanley selected Bank of New York Mellon as custodian for its spot Bitcoin ETF exposure. The bank also requested approval from the Office of the Comptroller of the Currency for a crypto focused national trust bank.
These announcements would normally support a strong rally during earlier cryptocurrency cycles. Nevertheless, current market conditions show that traders prioritize liquidity flows and whale behavior over headline developments. As a result, Bitcoin continues trading below recent highs while volatility remains elevated across the digital asset market.


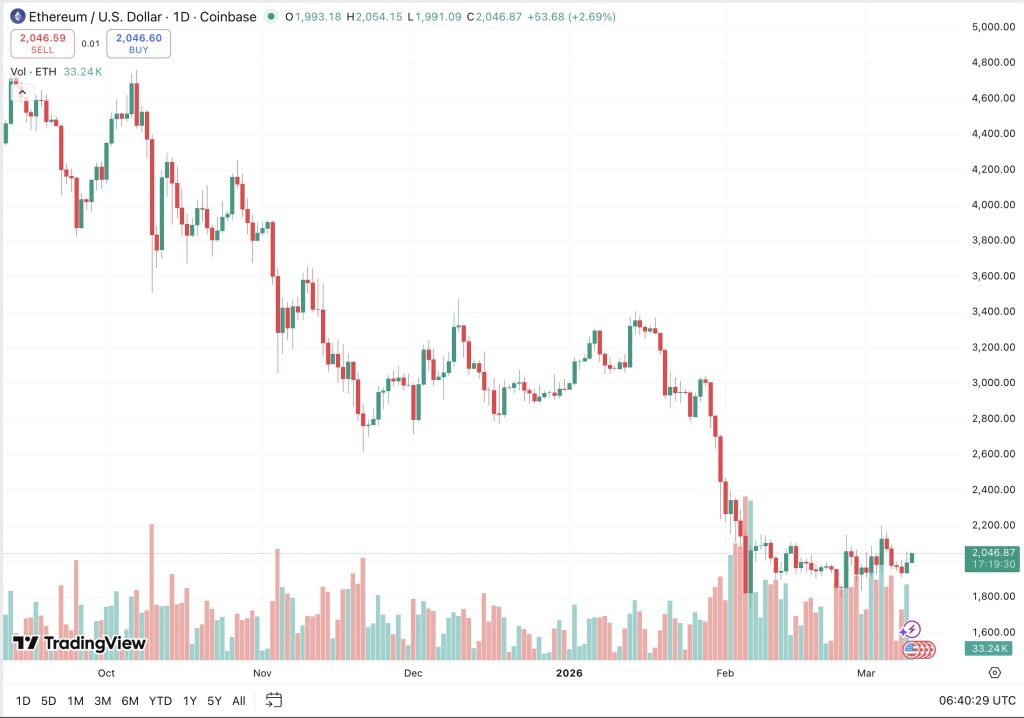
The Ethereum price is fighting to hold the $2,000 line as sellers test the market’s resolve. The asset is trading at $2,050 with a weekly Relative Strength Index (RSI) of 33, signaling a crucial decision point.
$2,000 represents a longstanding psychological level that bulls have defended since the February lows. The ETH RSI reading is arguably the most important metric right now. It sits just above the “oversold” threshold of 30, a zone that has historically preceded sharp relief bounces or accumulation phases.
While macro headwinds and oil macro pressure weigh on the broader sector, due to the ongoing tensions between the US and Israel, Ethereum price action suggests a coil is tightening.
24-hour volume for ETH USD has hit $22.4Bn, with the sell-side slowing, indicating that while aggressive selling has calmed, buyers remain hesitant to commit capital until a confirmed reversal signal is in place.
Ethereum Price Prediction: Is the $2,000 Defense Sustainable?
The daily chart shows the Ethereum price trapped in a high-tension consolidation block between $1,930 and $2,050, and until either side is breached, this ranging is likely to continue.
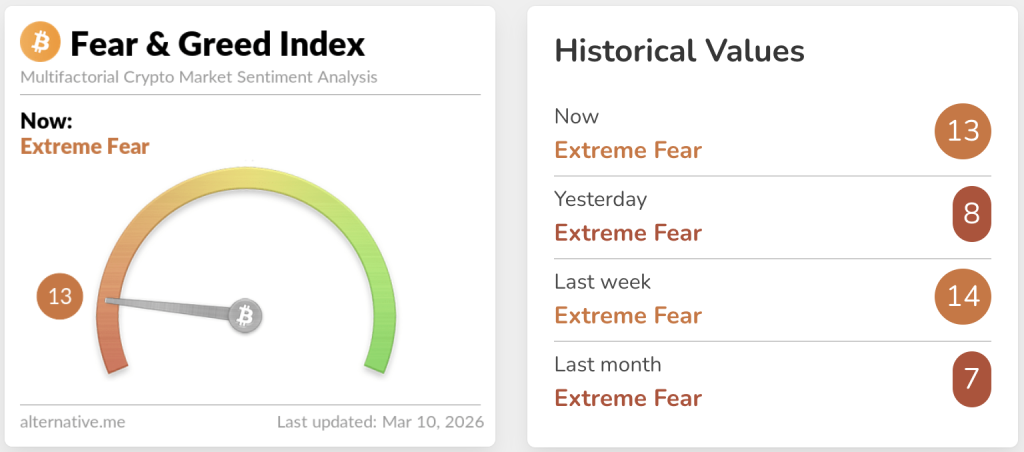
The structure is undeniably bearish in the immediate term, with lower highs pressing against static support. However, crypto technical analysis often favors contrarian plays when the market is spooked, and right now, the Fear & Greed Index is sitting at 13/100, marking ‘Extreme Fear’.
The setup mirrors strategies often used for oversold stocks, where deep pullbacks into liquidity zones offer asymmetric risk-reward ratios for patient traders. The current consolidation suggests bears are losing momentum, but they haven’t surrendered control.
If the $2,000 level holds, the immediate target is to reclaim the 20-day EMA near $2,120. A breakout above this moving average would signal strength and open the door to $2,350.
But if support at $1,930 fails, the floor drops out. Liquidity hunters will likely target the $1,760 zone, flushing out late longs before any meaningful recovery can occur.
This weakness contrasts with competitors. Recent Solana price prediction models highlight how alternative L1s have maintained stronger market structures during this correction, adding pressure on ETH to perform.
DISCOVER: Next Crypto to Explode in 2026
The Levels That Change Everything for ETH
Traders have defined clear Ethereum support levels that could dictate the trend for March, and the market is now waiting for a definitive close to confirm the next direction for ETH USD.
To the upside, $2,120 is the level to watch. A daily close above this resistance invalidates the immediate bearish thesis and could trigger a short squeeze toward $2,200.
This move would likely coincide with a shift in Bitcoin dominance as capital rotates back into Ethereum and the broader altcoin market.
To the downside, $1,930 is the line in the sand, and a breach here would expose the April 2025 lows of $1,470. While the ETH RSI suggests a bounce is due, the price structure remains king.
The definitive signal bulls are waiting for is a high-volume breakout above $2,120; until then, the trend and global macroeconomic tensions favor the bears.
EXPLORE: Best Crypto Presales to Buy in 2026
The post Ethereum Price Defends $2,000 Support as RSI Hits Near-Oversold Levels appeared first on Cryptonews.
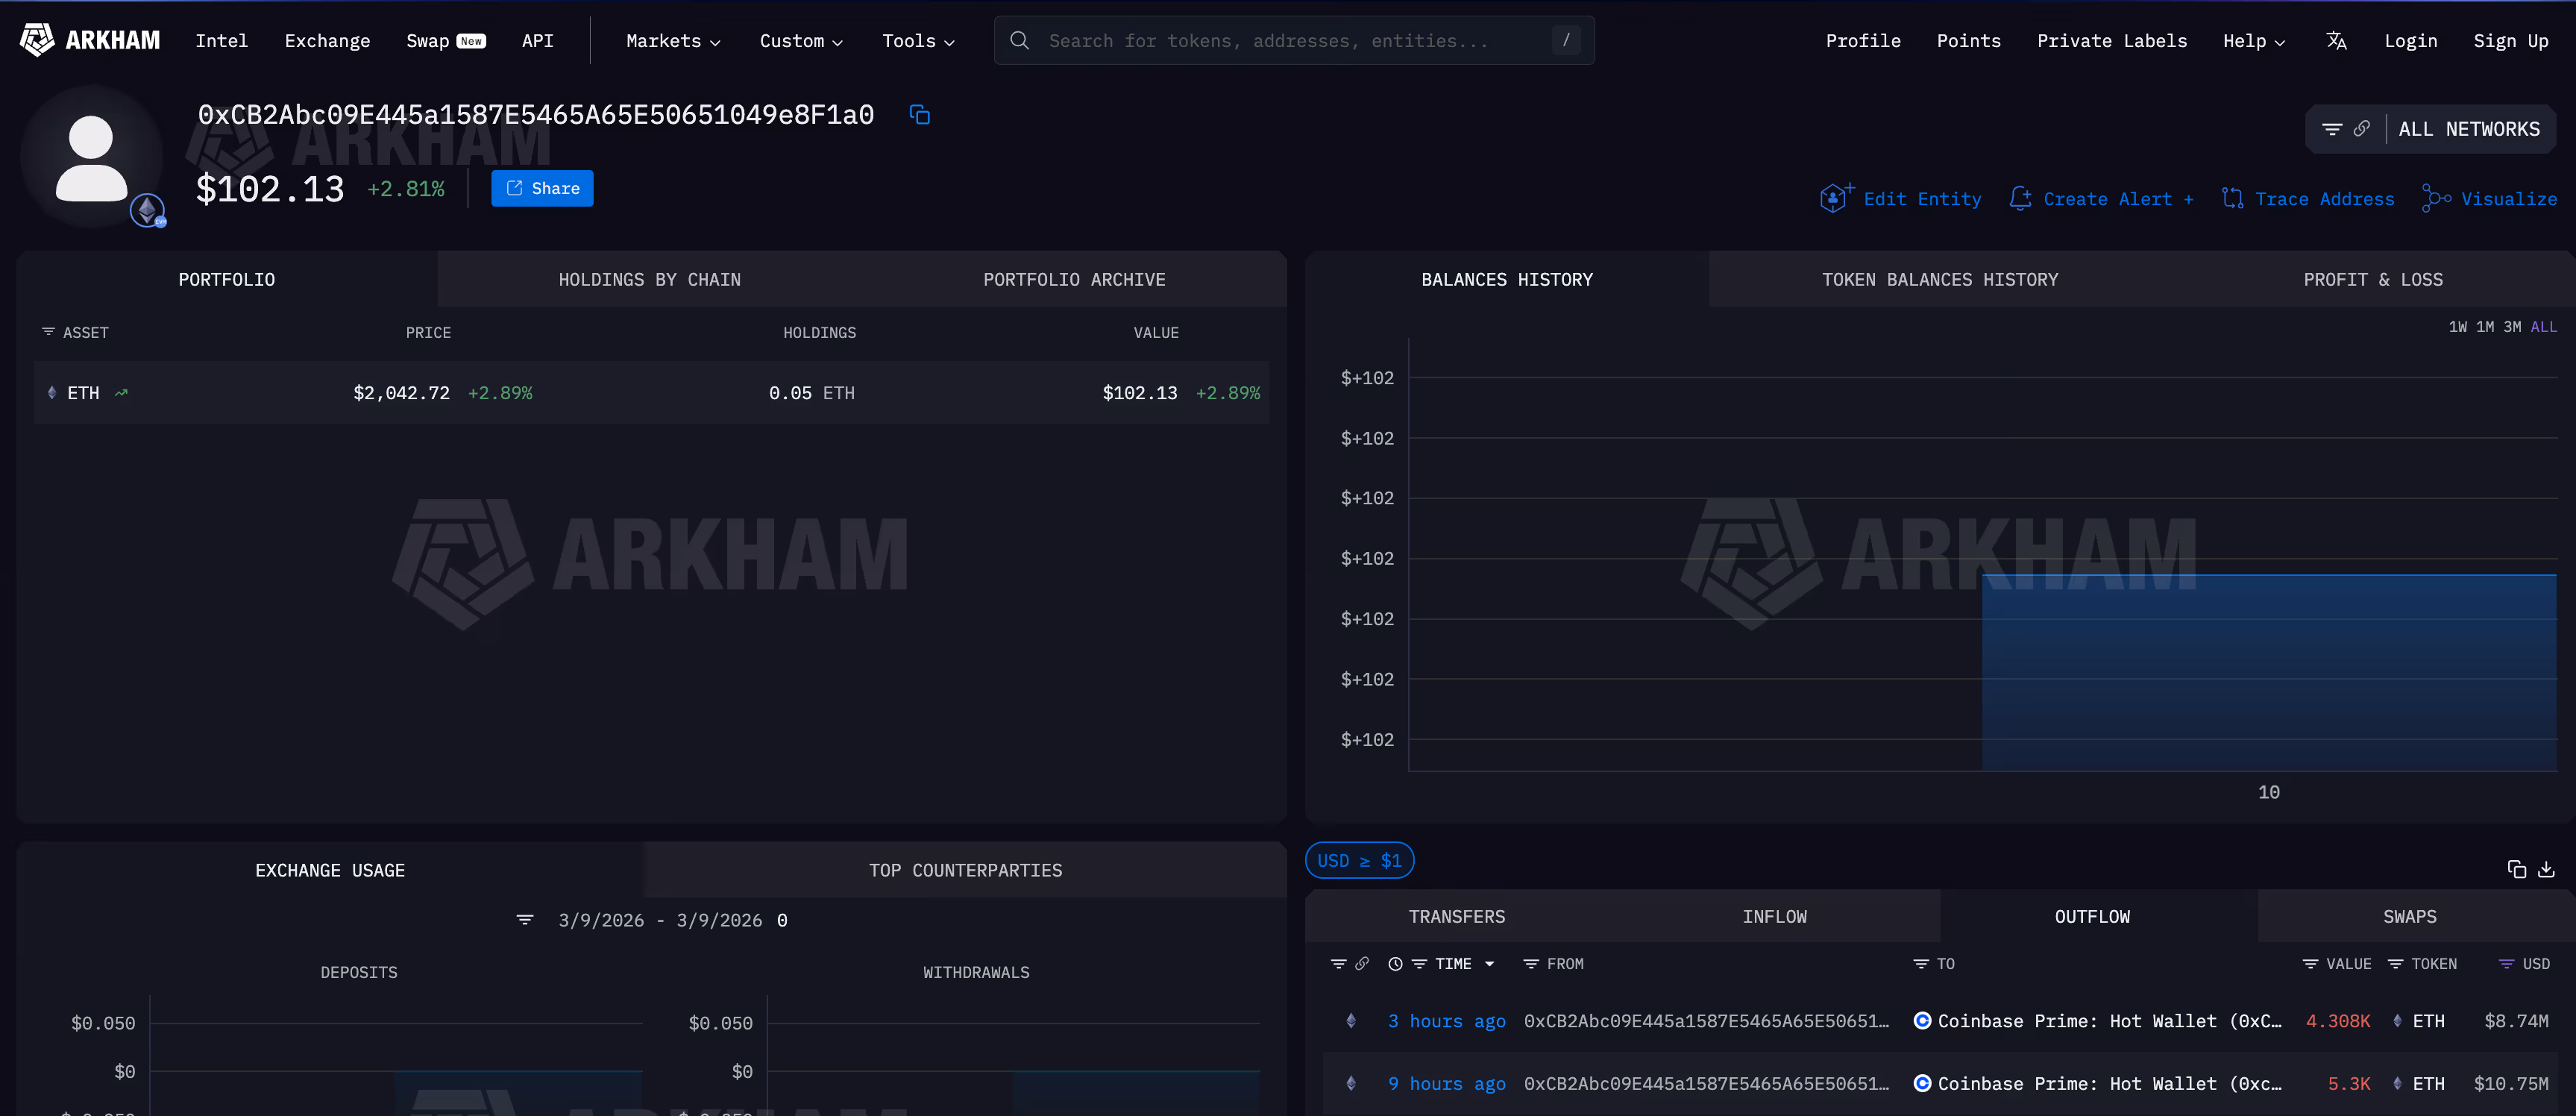
Bitmine Immersion Technologies moved approximately 9,600 ETH to Coinbase Prime hot wallets on Tuesday in two separate transfers, Arkham data shows.
The first transfer sent 5,300 ETH worth $10.75 million roughly nine hours ago, followed by a second batch of 4,308 ETH worth $8.74 million about three hours ago.
Both went through an intermediate wallet before landing at a Coinbase Prime hot wallet address, a routing pattern consistent with institutional custody operations.

The transfers come after Bitmine reported its largest weekly ether purchase of 2026, buying 60,976 ETH last week and bringing its total holdings above 4.5 million tokens. Chairman Thomas Lee said the firm was ramping up buying as it believes crypto is in the “late stages of a mini-crypto winter.”
Moving coins to Coinbase Prime doesn’t necessarily mean Bitmine is selling. Prime is Coinbase’s institutional custody and trading platform, and transfers there could reflect internal rebalancing, staking operations, collateral management, or preparation for OTC activity.
The balance history on Arkham shows Bitmine’s portfolio peaked near $16 billion around October 2024 and has declined to roughly $2.25 billion, reflecting ether’s price collapse rather than large-scale selling. The company is sitting on estimated losses of $7.8 billion on its position.
Ether was trading at $2,042, up 2.8% on the day.


Blockchain.com is expanding its presence in Africa with a launch in Ghana, as the crypto brokerage looks to build digital asset infrastructure across some of the region’s fastest-growing markets.
Summary
- Blockchain.com has launched operations in Ghana as part of a broader African expansion strategy.
- The move follows over 700% transaction growth in Nigeria, one of the firm’s fastest-growing markets.
- The company says rising crypto adoption in Africa is driven by remittances, currency volatility and mobile-first users.
The company announced the expansion on March 9, saying the move forms part of a broader strategy to scale operations across Africa and provide local users with a secure and compliant platform for accessing digital assets.
The Ghana launch follows strong growth in Nigeria, which has emerged as one of Blockchain.com’s fastest-growing global markets. Since officially launching retail operations in the country last year, the firm has recorded more than 700% growth in brokerage transaction volumes, according to the announcement.
Blockchain.com established operations in Lagos and hired local staff to support the expansion, with USDT, BTC and TRX emerging as the most actively traded assets among Nigerian users on the platform.
The company said demand for digital assets across Africa continues to rise, driven by factors such as currency volatility, remittance needs and a rapidly expanding mobile-first population. Nigeria has consistently ranked among the world’s top countries for crypto adoption, according to industry data.
Blockchain.com also reported growing traction in Ghana even before its formal launch. Over the past year, the firm recorded a 140% increase in active users in the country and an 80% rise in transaction volumes, suggesting strong local demand for regulated access to crypto services.
“Africa represents our mission to make financial services available to everyone globally,” said Owen Odia, the company’s general manager for Africa, adding that the firm is investing in local talent and developing products tailored to regional needs.
The company said stablecoins and digital assets could help improve cross-border settlements, reduce remittance costs and support digital commerce across West Africa.
Founded in 2011, Blockchain.com operates in more than 70 jurisdictions and has processed over $1.2 trillion in crypto transactions, with more than 90 million wallets created worldwide.
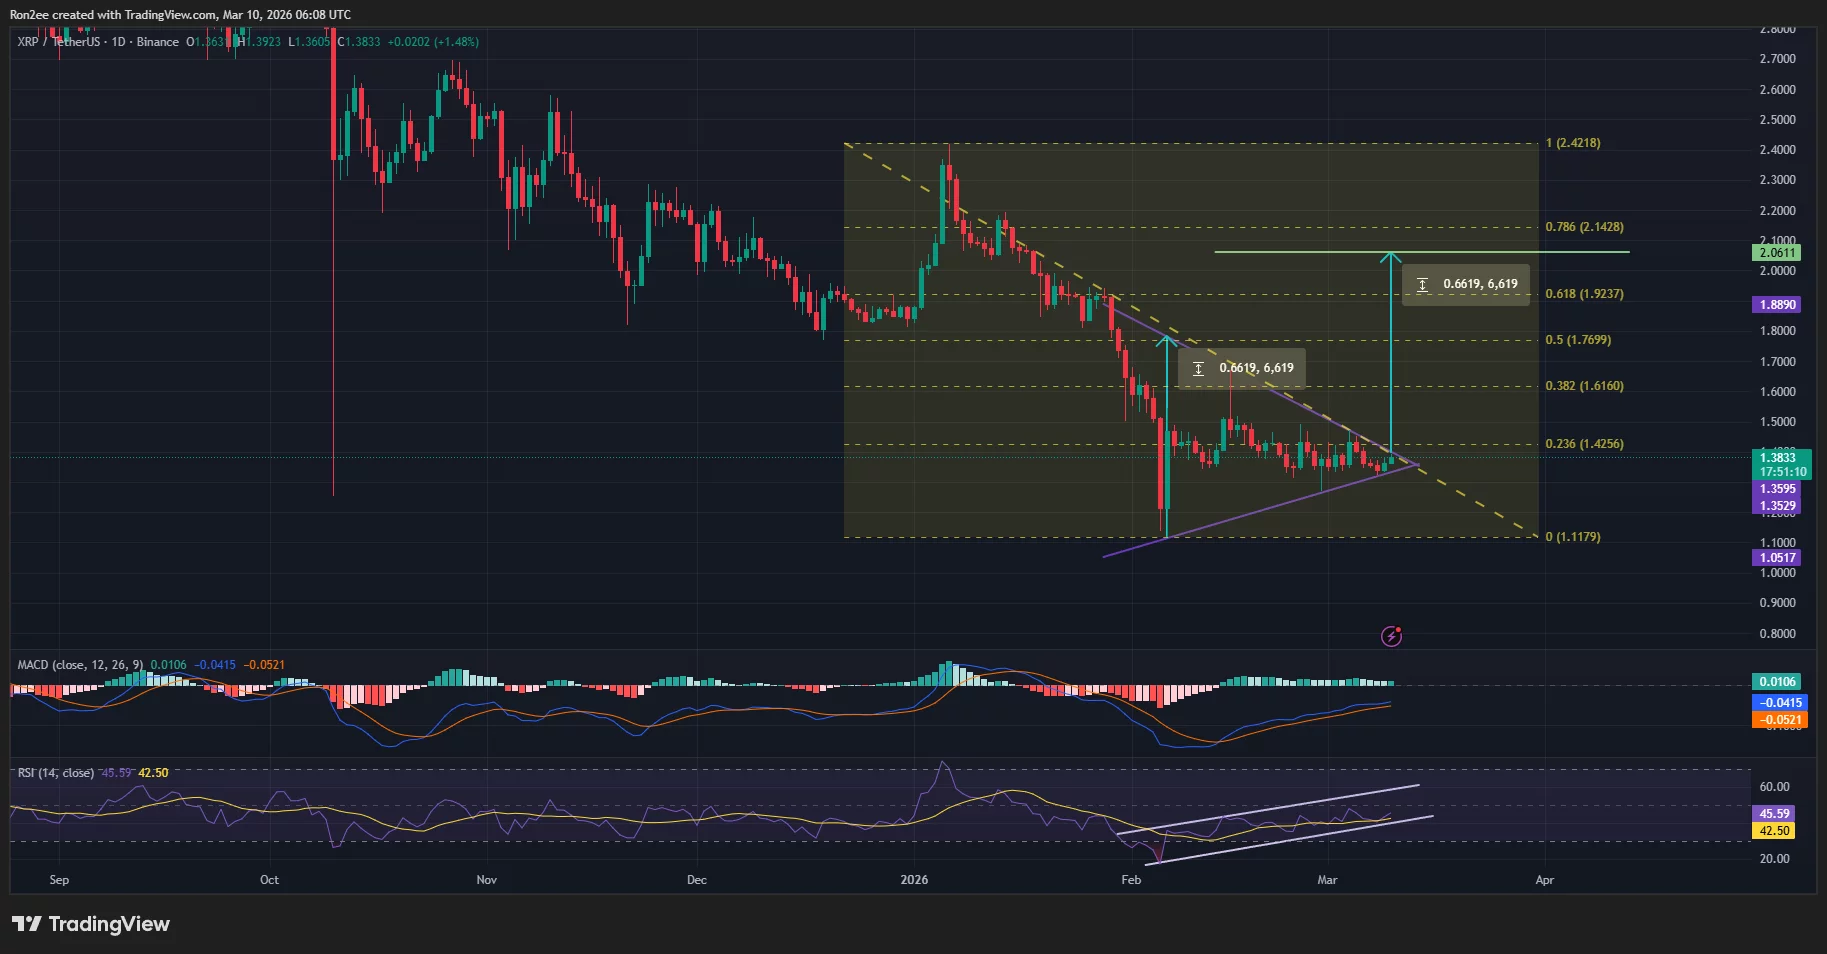
XRP price is on the cusp of a breakout from a symmetrical triangle pattern that could potentially lead to sustained gains.
Summary
- XRP price is close to confirming a bullish breakout from a symmetrical triangle pattern on the daily chart.
- Stablecoin supply on the network has surged over the past week.
According to data from crypto.news XRP (XRP) price rose nearly 4% to an intraday high of $1.39 on March 10, Asian time.
The rebound followed after the token fell nearly 8% to $1.34 from its weekly high of $1.46 led by a Bitcoin (BTC) correction amid rising inflation fears on surging oil prices and escalating geopolitical tensions in the Middle East.
Now, with XRP price recovering, it is drawing closer to a potential breakout from a multi-month symmetrical triangle pattern formed on the daily chart.

For context, a symmetrical triangle pattern is formed when an asset’s price moves between two converging trendlines that connect a series of sequential peaks and troughs. Typically, a breakout from the upper side of the pattern has been bullish for the asset, while a drop below the lower trendline indicates a bearish trend.
In XRP’s case, the breakout is occurring from the upper side and hence presents a bullish outlook for the token in the coming sessions.
At press time, momentum indicators like the MACD and RSI are also suggesting that a strong recovery is underway. The MACD line was pointed upwards, while the RSI had formed a bullish divergence with XRP’s recent price action, suggesting that selling pressure is cooling off.
For now, the 23.6% Fibonacci retracement level at $1.42 stands as the key resistance zone that traders would be keeping an eye on.
Breaking out from this level could potentially trigger a rally to $2.06, a target calculated by adding the height of the symmetrical triangle pattern formed to the price point at which the breakout would be confirmed. The target lies nearly 50% from the current price of $1.38.
A major catalyst that could support its gains is the growing stablecoin supply on the XRPL network. Data from DeFiLama show that the total stablecoin supply on the network has gone up 2.5% over the past 7 days to $426 million.
A greater supply means more liquidity and trading activity on the network, and investors often see such growth as a sign of increasing demand for the underlying ecosystem.
However, some caution is warranted as institutional demand for the altcoin has slowed. Notably, U.S. spot XRP ETFs recorded $22 million in net outflows over the past two weeks, breaking a four-week inflow streak.
Disclosure: This article does not represent investment advice. The content and materials featured on this page are for educational purposes only.

Justin Sun’s Tron network has joined the Agentic AI Foundation to prepare and support the widespread adoption of AI agents.
In an announcement on Monday, Tron’s decentralized autonomous organization (DAO) revealed that the Tron network has signed on as a member of the Agentic AI Foundation (AAIF) and will serve on its governing board.
Tron DAO said that there will be significant demand coming from agentic AI in the future, and as such, it requires collaboration and interoperability to establish systems that can handle “continuous, high-volume, low-value transactions efficiently at scale.”
“Interoperable frameworks are expected to play an important role in ensuring that AI agents can operate across platforms and services without creating fragmented ecosystems,” the DAO said.
Last month, Stripe CEO and co-founder Patrick Collison and co-founder John Collison said there is a significant infrastructure gap in blockchain and said significant scaling improvements would be required to meet this incoming demand.
“By supporting the development of open infrastructure through the Foundation, TRON DAO aims to contribute to collaborative standards that make AI agents easier to build, safer to operate, and more accessible,” it added.

The AAIF is run by the Linux Foundation and was designed to promote open-source agentic AI development, alongside helping establish industry standards for governance, safety, and interoperability. Tron joins the likes of Circle and JPMorgan in jumping on board the AAIF.
Tron’s 2026 focus is AI, says founder
Sun last month said that AI will “definitely” be a key focus for the network this year, arguing that Tron’s speed, scalability, and low fees are prime for hosting agentic AI transactions.
Related: Using AI at work is causing ‘brain fry,’ researchers say
Sun indicated that the network is working on building infrastructure and collaborating to support AI demand. One recent example is the Bank of AI, a financial layer built for AI agents by AINFT, which first launched on Tron and BNB Chain in mid-February.

DeFiLlama data indicates that Tron currently tops the charts in terms of revenue generated by all blockchains across the past 24 hours, seven days, and 30 days, at $1.01 million, $6.54 million and $25.58 million apiece.
Earlier this month, Sun indicated that some of the revenue is being driven by AI.
“AI is scaling fast. When agents transact, demand shows up in the network metrics. TRON keeps leading on real usage,” he said.
Magazine: AI won’t make you rich but crypto games might, Axie founder steps down: Web3 Gamer


Vitalik Buterin has outlined a plan to simplify distributed staking infrastructure on Ethereum, arguing that running validator nodes should not require specialized technical expertise.
Summary
- Vitalik Buterin outlined a “DVT-lite” approach designed to simplify distributed Ethereum staking infrastructure.
- He argued that complex validator setups are “anti-decentralization” and should be replaced with easier deployments.
- The goal is to enable simple, near “one-click” distributed staking, particularly for institutions holding large amounts of ETH.
In a recent social media post, Buterin discussed how the Ethereum Foundation is using a simplified “DVT-lite” setup to stake 72,000 ETH, describing the effort as part of a broader push to make distributed validator technology easier to deploy.
Distributed validator technology, or DVT, allows multiple machines or operators to collectively run a validator using a shared key, rather than relying on a single server or operator. The approach is widely viewed as a way to improve network resilience and reduce the risk of validator outages.
Buterin said his goal is to make deploying such infrastructure “maximally easy,” particularly for institutions that hold significant amounts of Ether but may lack the technical capacity to operate complex validator systems.
“My hope for this project is that in the process, we can make it maximally easy and one-click to do distributed staking for institutions,” he wrote.
Under the concept he described, node operators could run a validator through a simple containerized setup, such as a Docker container or a similar environment. Each participating node would use the same validator key and automatically discover the other nodes in the cluster.
Once the nodes connect, the networking setup and distributed key generation process would run automatically before staking begins.
Buterin also criticized the perception that operating blockchain infrastructure requires professional-level expertise.
“The idea that running infrastructure is this scary complicated thing where each person participating must be a ‘professional’ is awful and anti-decentralization,” he said.
According to Buterin, simplifying distributed validator deployment could help spread authority over Ethereum staking across a wider set of participants. He added that he personally plans to use the setup and hopes more large Ether holders will adopt similar distributed staking configurations.

Bhutan has transferred roughly $11 million worth of Bitcoin from wallets linked to its sovereign holdings, according to blockchain analytics firm Arkham Intelligence.
Summary
- Bhutan moved about $11 million in Bitcoin, according to Arkham Intelligence on-chain data.
- The transfer follows a $7 million BTC sale through QCP Capital roughly a month earlier.
- Bhutan typically sells $5M–$10M BTC clips, maintaining a structured treasury management strategy.
Arkham flagged the movement in a recent post on X, stating that Bhutan moved the funds out of its main holding addresses, continuing a pattern of periodic transfers tied to the country’s crypto treasury activity.
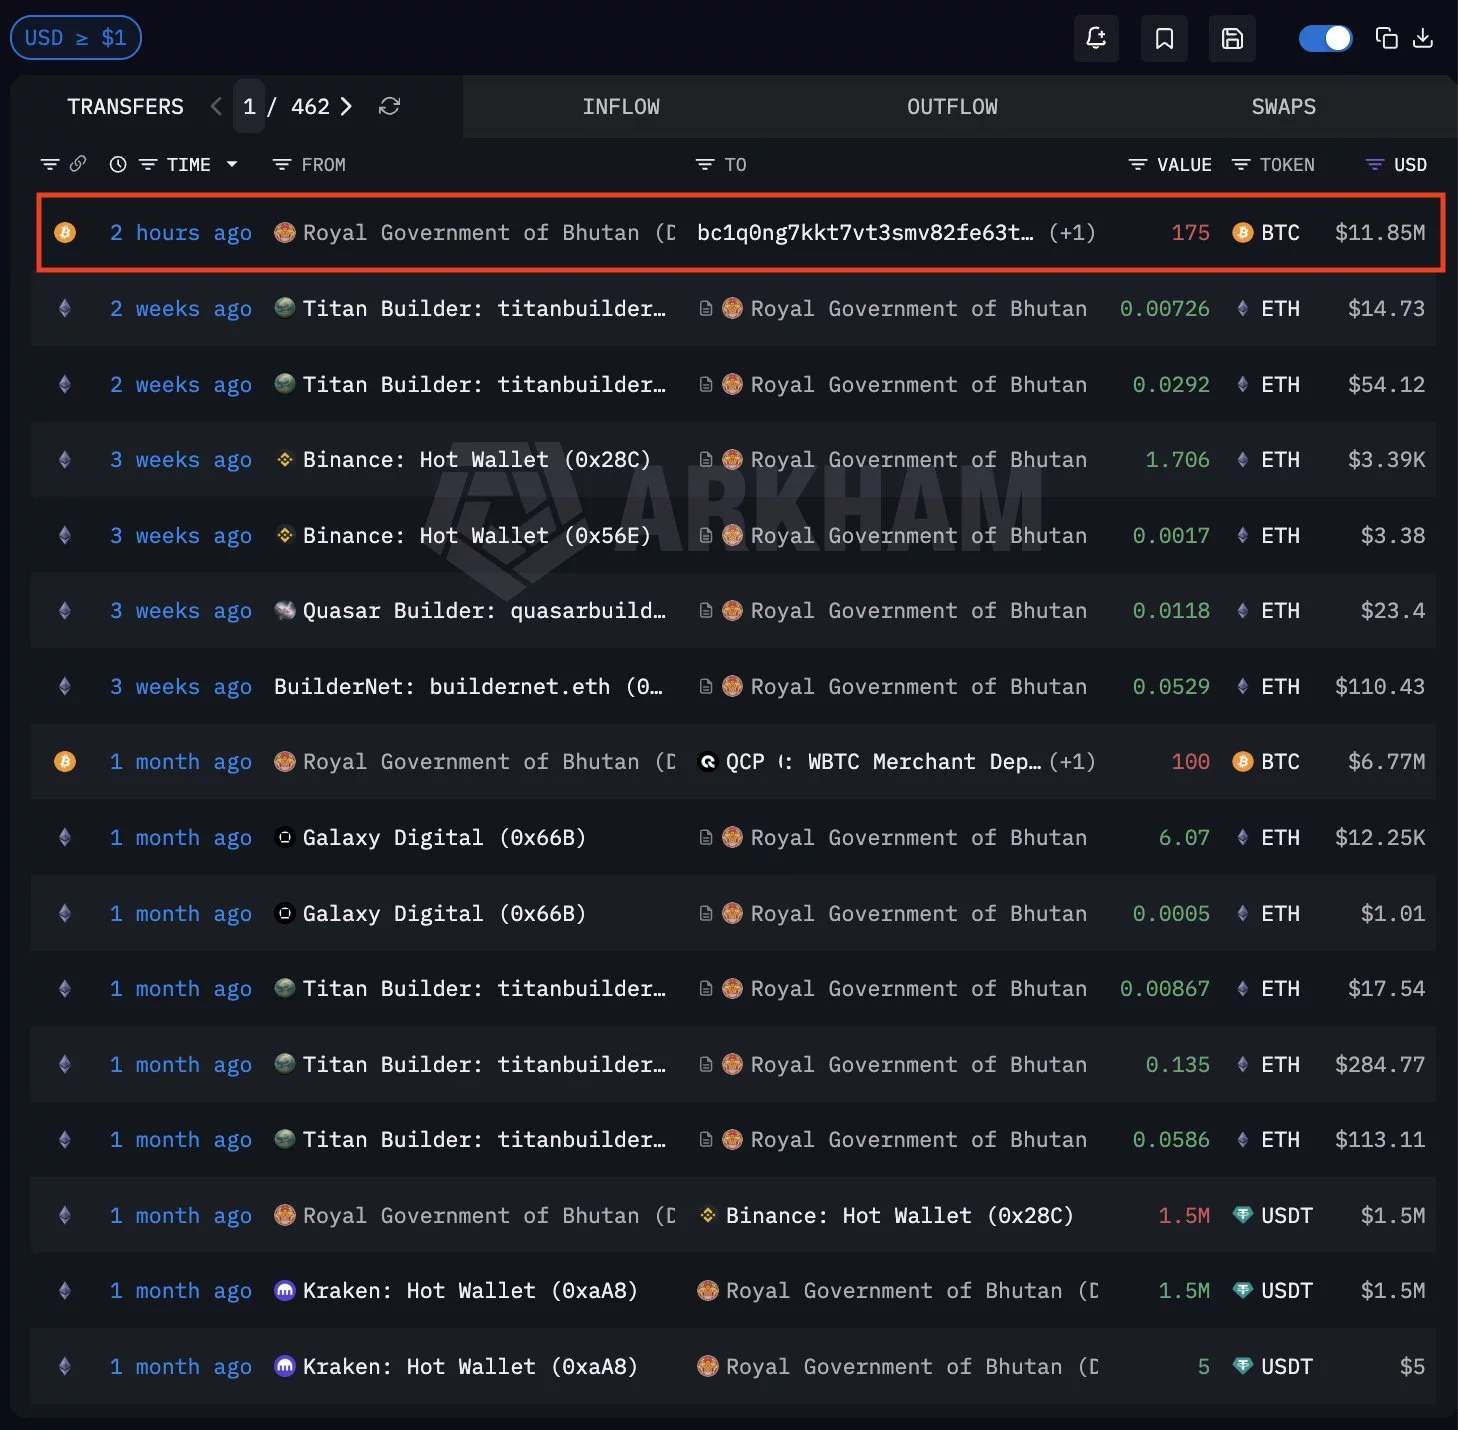
The analytics platform noted that the last similar transfer occurred about a month ago, when Bhutan sold approximately $7 million worth of Bitcoin (BTC) through QCP Capital, a digital asset trading firm often used by institutional market participants.
Arkham also observed that Bhutan typically sells portions of its Bitcoin holdings in smaller clips ranging from $5 million to $10 million, rather than executing large single liquidations. The firm previously identified a particularly heavy period of selling activity between mid and late September 2025.
The latest movement continues a broader pattern of on-chain activity from Bhutan-linked wallets that has drawn attention across crypto markets.
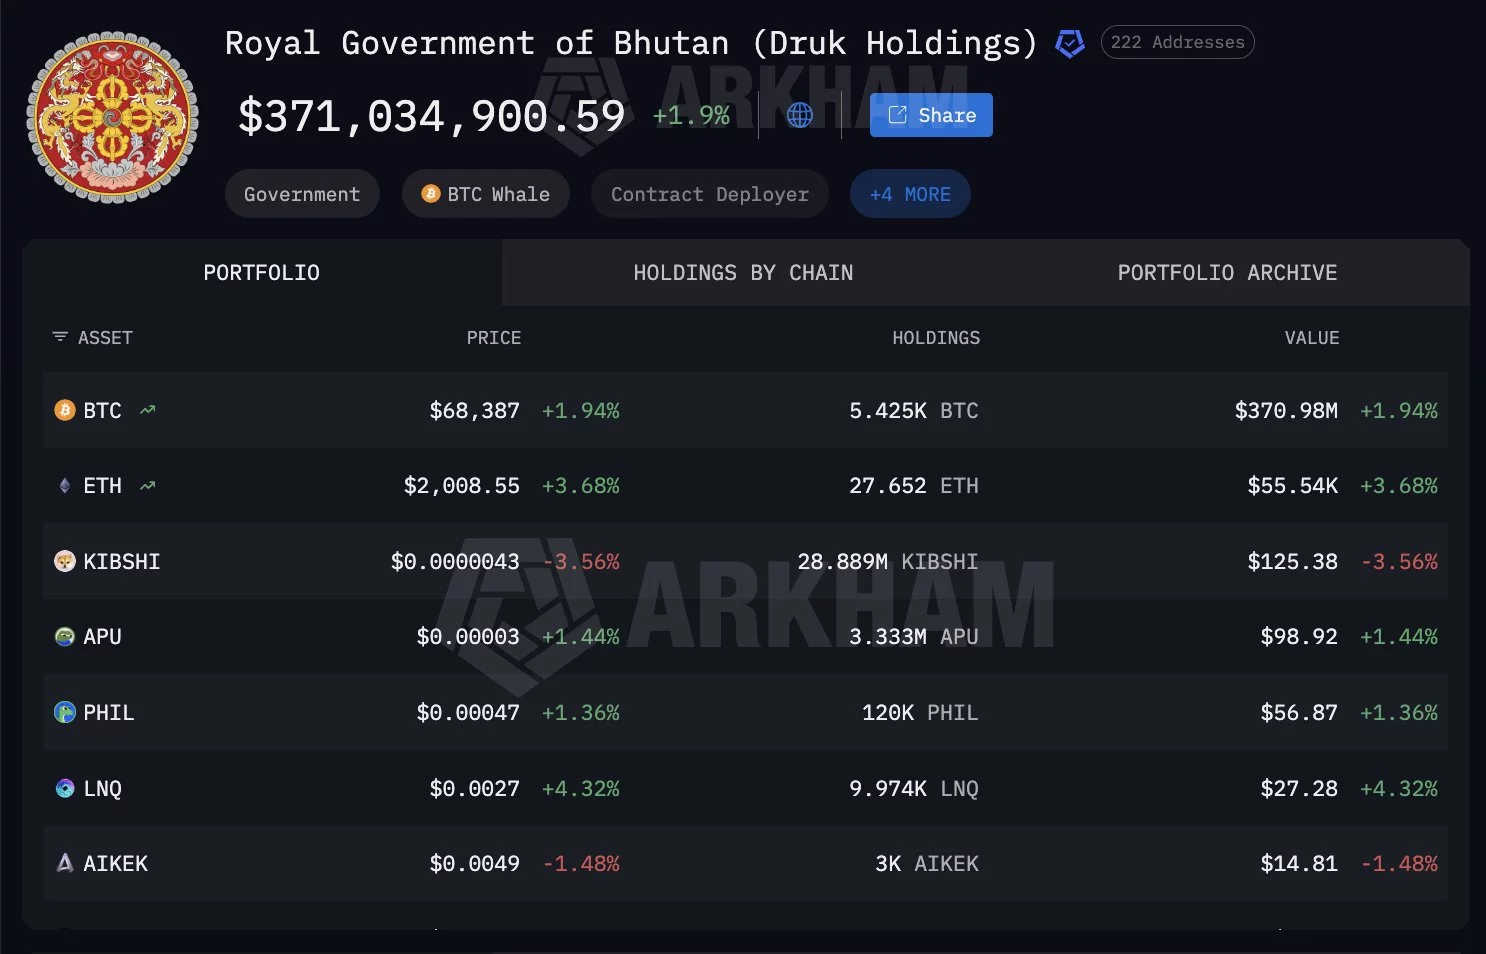
Despite these periodic sales, Bhutan remains one of the largest sovereign Bitcoin holders. Arkham-tracked wallets show the country still holding around 5,600 BTC, valued at hundreds of millions of dollars.
Bhutan’s Bitcoin reserves largely originate from state-backed mining operations powered by hydroelectric energy, which have allowed the Himalayan kingdom to accumulate a sizable digital asset treasury in recent years.

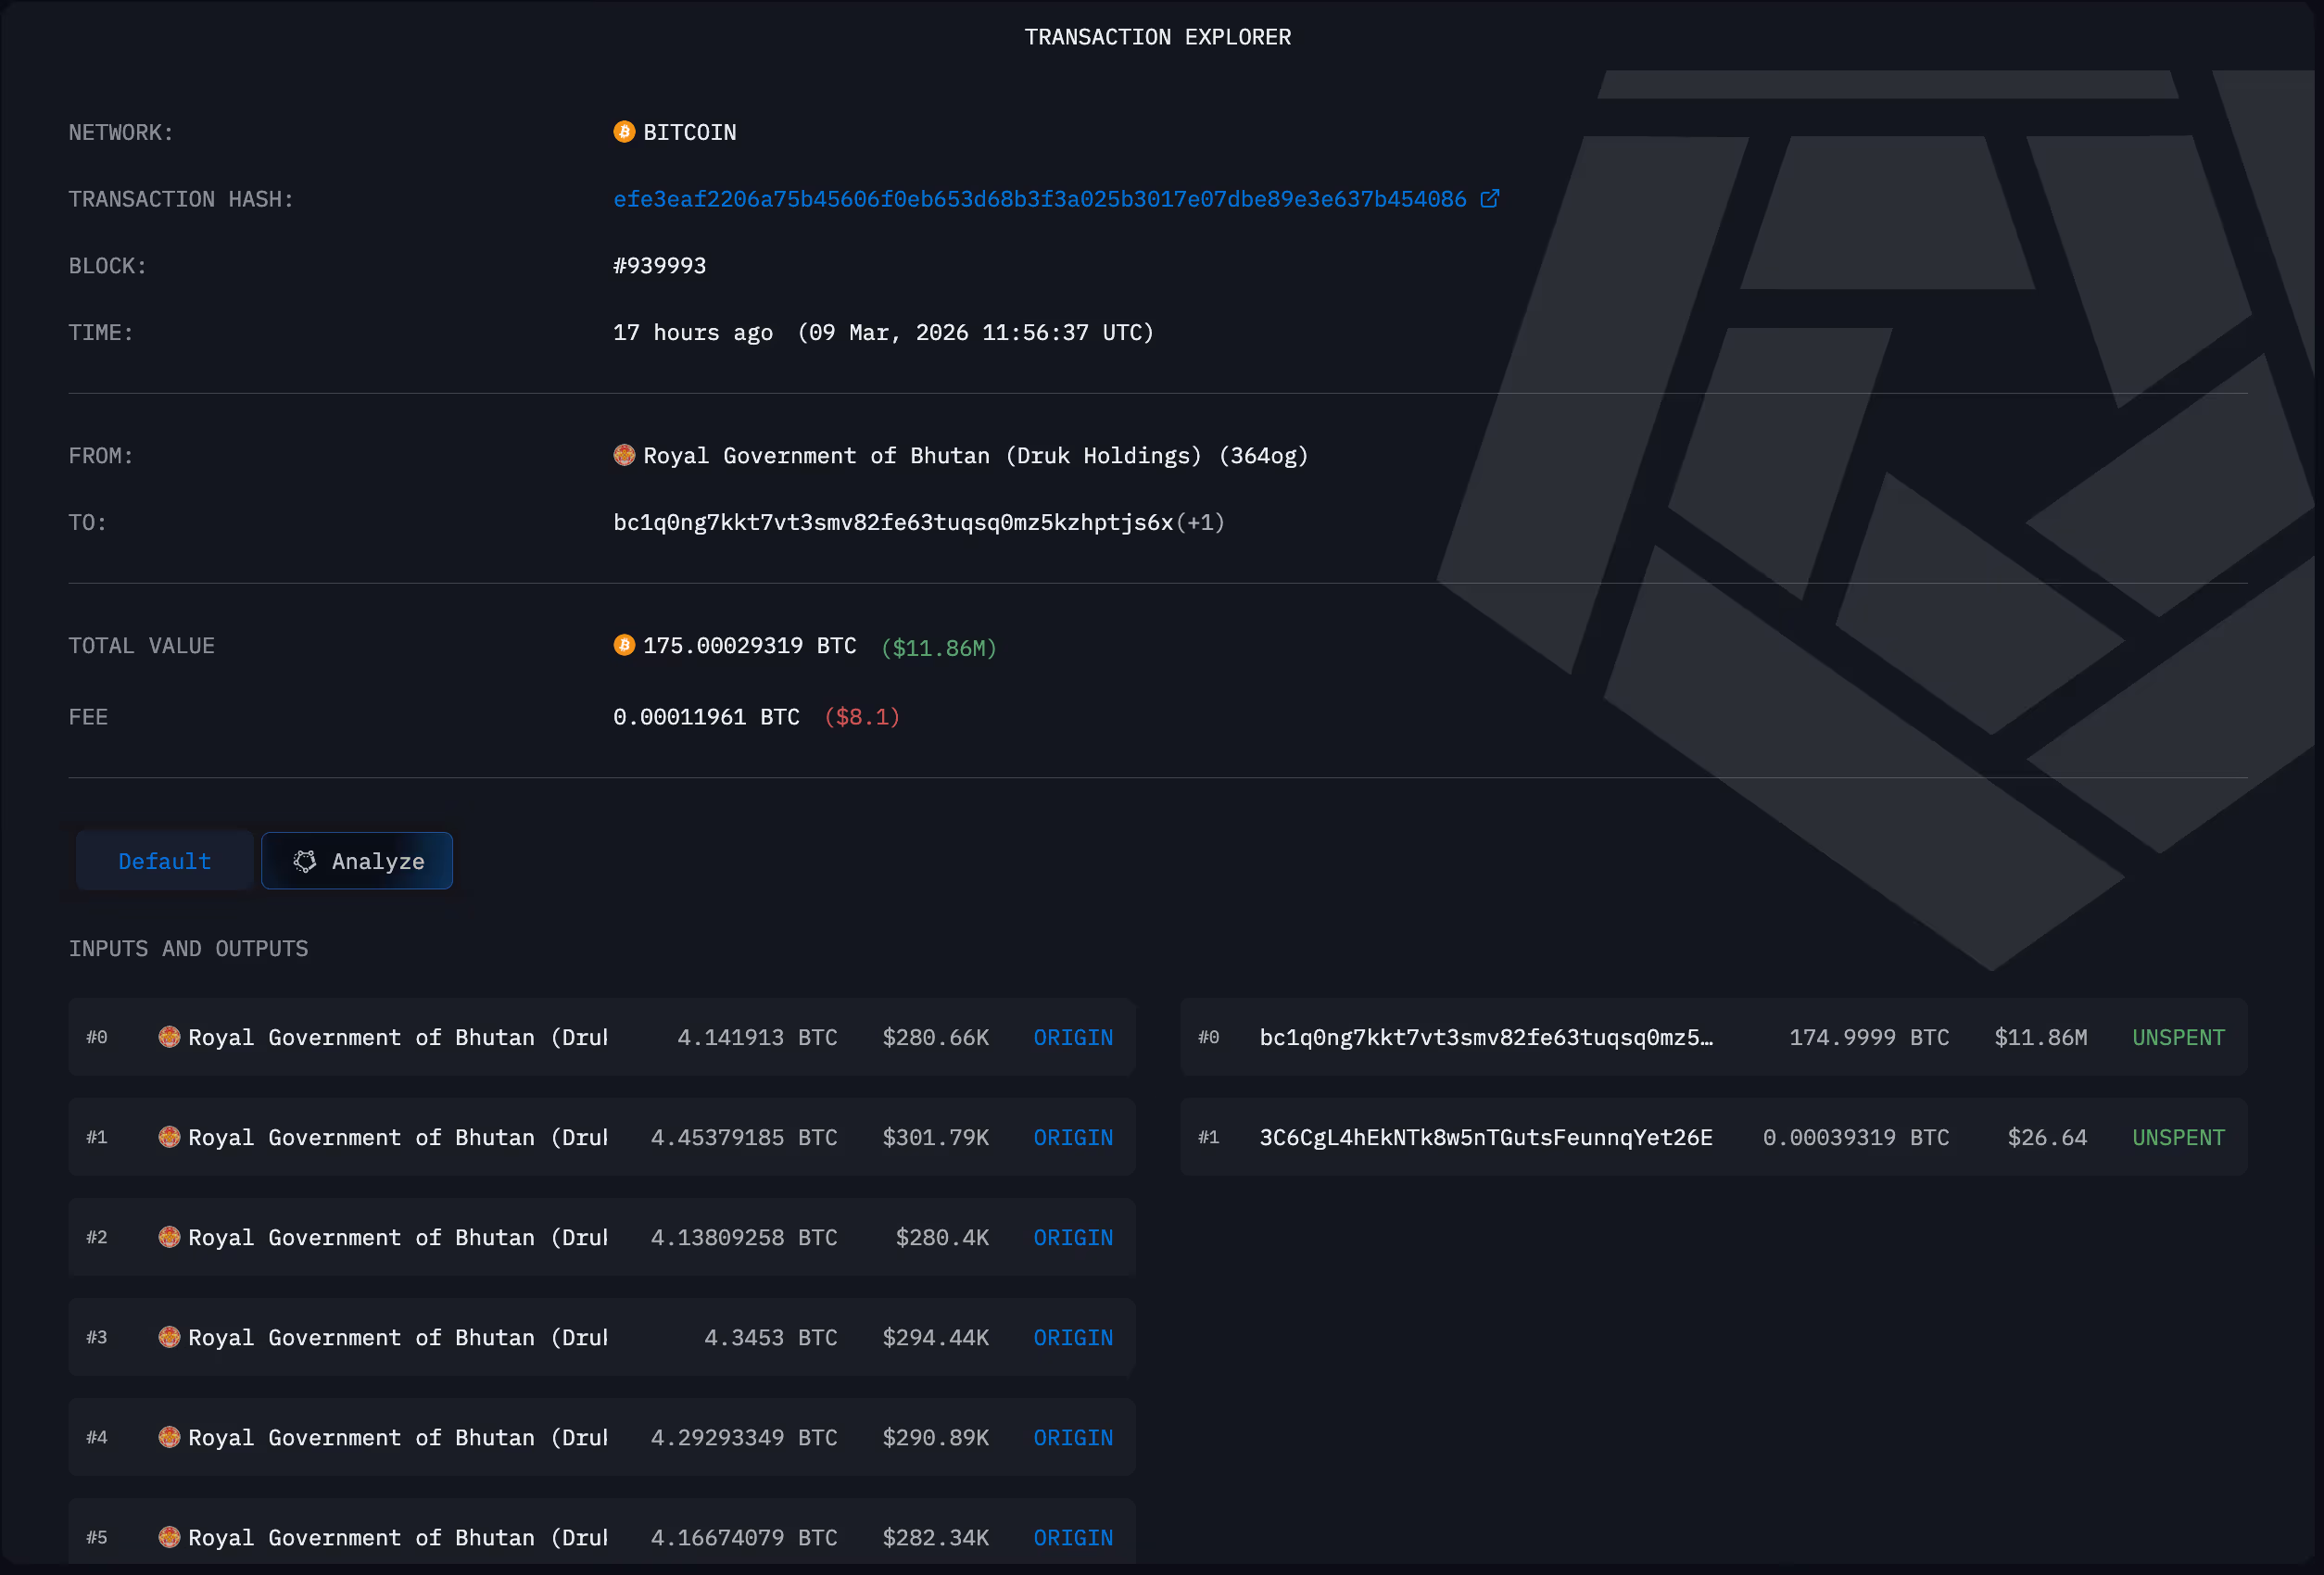
Bhutan’s sovereign investment arm quietly adjusted its Bitcoin reserve on Monday, moving a block of 175 BTC from the kingdom’s primary holding wallet to a newly created address. The transaction, valued at around $11.85 million at the time, arrived as cryptocurrency markets posted modest gains, suggesting tactical reallocation rather than a wholesale shift in policy. blockchain analytics firm Arkham tracked the transfer, noting the destination address had previously received 184 BTC from the same source within a month and has since begun to show a steady rhythm of activity. The earlier 184 BTC were sent to a third address that, in aggregate, has received about 1,910 BTC since 2024 and currently holds 126 BTC.
In a post on X, Arkham highlighted Bhutan’s handling pattern, pointing out that the last time the country moved a similar amount of Bitcoin — in February — it sold around $7 million of BTC in collaboration with QCP Capital. The kingdom has already conducted several sales this year, a pattern Arkham described as “clips of $5–10 million,” with a notably heavier selling period around mid-late September 2025. These colorations come as part of Bhutan’s ongoing effort to translate a sovereign crypto reserve into tangible services, a strategy that has drawn scrutiny and curiosity from market observers and policymakers alike. Read more.
Current estimates place Bhutan’s total crypto holdings at roughly 5,400 BTC, a figure that positions the country as the seventh-largest state-backed holder. By comparison, the United States remains the largest state holder with about 328,372 BTC. These rankings underscore the growing footprint of national-level crypto treasuries, even as market dynamics—such as the post-2024 halving environment—continue to exert influence on liquidity and strategy. In addition to Bitcoin, Bhutan’s sovereign fund, Druk Holding and Investments, holds a modest mix of other digital assets, including 28 ETH and 28 KiboShib, a memecoin linked to AI themes.
Druk Holding and Investments, Bhutan’s state-backed wealth manager, has long integrated energy economics into its crypto program. Bhutan’s hydropower surplus during the summer months has enabled the country to sustain mining activity, a practice the government began in 2019. Yet the 2024 halving, which trimmed block rewards to 3.125 BTC, pressed mining economics and pushed operators toward broader tech services, including artificial intelligence and high-performance computing, as miners sought alternative revenue streams. The country’s approach has been described as a balancing act—leveraging surplus energy to generate revenue while managing the risk profile of a volatile asset class.
Public commentary from Bhutan’s leadership has framed Bitcoin mining as a means to fund public services. In comments to international media, Bhutan’s Prime Minister noted that revenue from the reserve has supported healthcare, environmental initiatives, and public servant salaries. That framing aligns with a broader narrative of state actors trying to retain strategic leverage over volatile assets while maintaining social returns. Still, the movement of large BTC blocks underscores the ongoing challenge of governance in sovereign crypto programs: how to synchronize reserve management with the need for liquidity and transparency.
As miners and investable assets migrate toward more diversified implementations of compute power, Bhutan’s case sits at the intersection of energy policy, national finance, and crypto economics. A growing cohort of governments is watching how state-held BTC interacts with public budgets and national energy strategies, especially in jurisdictions with abundant renewable resources and robust hydropower capacity. The narrative surrounding Bhutan’s holdings—both the 175 BTC transfer and the broader 5,400 BTC stake—illustrates how state actors are choreographing exposures to a volatile asset class while attempting to translate holdings into measurable public benefits.
Beyond Bitcoin, the country’s asset mix reflects a cautious diversification approach. The 28 ETH holding indicates a level of exposure to Ethereum-based ecosystems, while the presence of KiboShib signals an interest in tokenized AI-themed narratives, albeit in relatively small quantities. These positions are managed under the umbrella of Druk Holding and Investments, which maintains an evolving, data-driven approach to how the reserves are deployed and reported. The transparency of transfers—documented through blockchain explorers and corroborated by analytics firms—adds a layer of accountability that is increasingly expected of state-backed crypto programs.
For observers, Bhutan’s latest move comes amid a broader market backdrop that includes ongoing scrutiny of national crypto reserves and a shifting mining landscape shaped by the halving dynamics and energy costs. As the world’s capital flows into digital assets evolve, sovereign activity offers a rare, high-level lens on how governments view Bitcoin and related tokens as strategic resources rather than mere commodities. The path forward will likely involve a combination of measured selling, careful allocation to select assets, and continued investment in energy-based mining capacity and AI-enabled services.
Source tracing remains critical: Arkham’s public notes on the transfer pattern, along with blockchain explorer data tracing addresses bc1q0ng7kkt7vt3smv82fe63tuqsq0mz5kzhptjs6x and bc1q73fm7mkd2ces69gchq7xp5td5yzwa085al9gku, offer precise visibility into how Bhutan is moving assets. The country’s public communications—through interviews and media coverage—also reinforce the idea that its crypto holdings are being managed with a view toward social outcomes, not merely financial returns. As this conversation unfolds, analysts will be watching for the next set of moves, especially any announcements around future sales windows and the evolution of the reserve’s asset mix.
Why it matters
The case of Bhutan’s Bitcoin reserve is a signal of growing state-level engagement with digital assets. It demonstrates that sovereign actors are not only accumulating Bitcoin but also managing the cadence of sales to fund public initiatives. The transparency afforded by on-chain data—paired with analytics from firms like Arkham—provides a rare lens into how a state-backed treasury navigates volatility, liquidity requirements, and public accountability.
Moreover, Bhutan’s energy-backed mining strategy highlights how countries with abundant renewable resources can align economic activity with national energy policy. The hydropower surplus used to fund mining and, by extension, public services, offers a model where environmental assets and digital assets intersect. As the 2024 halving reshaped mining economics, Bhutan’s pivot toward a broader compute economy—AI and high-performance computing services—illustrates a practical response to lower issuance rewards while maintaining capacity to monetize energy-derived flows.
For investors and researchers, the Bhutan narrative underscores the importance of data provenance in sovereign crypto markets. The combination of on-chain transfers, official statements, and third-party analyses creates a holistic picture of how a nation-state approaches holdings in a volatile asset class. It also raises questions about governance, governance disclosures, and how future policy could integrate crypto reserves with broader national finance strategies.
What to watch next
- Monitor any additional transfers from Bhutan’s main reserve to new addresses, including potential batching patterns in the coming quarters.
- Track whether Bhutan continues to divest, especially around anticipated selling windows in September 2025 and beyond.
- Observe movements in Bhutan’s non-BTC holdings (ETH and KiboShib) for signs of broader diversification or strategic shifts.
- Watch for public statements or budgetary disclosures that link reserve activity to specific social programs or healthcare initiatives.
Sources & verification
- Arkham’s public notes on Bhutan’s transfer pattern and the February sale with QCP Capital, available via the Arkham post and X thread (Arkham).
- Blockchain explorer data for the addresses involved in the transfers: bc1q0ng7kkt7vt3smv82fe63tuqsq0mz5kzhptjs6x and bc1q73fm7mkd2ces69gchq7xp5td5yzwa085al9gku (address details, address details).
- Al Jazeera interview and reporting on Bhutan’s use of Bitcoin proceeds for public services (Al Jazeera).
- Cointelegraph reporting on Bhutan’s reserve activity and prior sales (Cointelegraph).
- Bitcointreasuries government holdings page for comparison with the U.S. position (Bitcoin Treasuries).
- Druk Holding and Investments’ public data on Bhutan’s asset management and energy-linked mining strategy (Arkham Intel).
Key details
Tickers mentioned: $BTC, $ETH
The tiny country of Bhutan is quietly selling its bitcoin, and the stack is getting thinner each month.
The Royal Government of Bhutan moved 175 BTC worth $11.85 million late on Monday, according to Arkham Intelligence data, moving assets to the same bc1q wallet address that received 184 BTC worth $14.09 million in February. It suggests a consistent OTC or treasury management counterparty.
The activity is done by Bhutan’s state-owned investment arm, Druk Holding and Investments (DHI), which spearheads the country’s BTC mining operations.

The February activity was more extensive than a single transfer. Arkham’s outflow data shows four separate moves that month: the 184 BTC transfer, two sends to QCP Capital’s merchant deposit address totaling roughly 200 BTC worth $15 million combined, and a $1.5 million USDT transfer to a Binance hot wallet.
That’s about $30.7 million in February alone, followed by Monday’s $11.85 million, bringing 2026 outflows to roughly $42.5 million.

The QCP Capital transfers stand out as sending bitcoin to a trading firm’s deposit address twice in one month is more active than simple treasury drawdowns. It suggests OTC selling or structured liquidity management rather than just moving coins between cold wallets.
The balance history chart tells a bigger story, however.
Bhutan’s stack peaked around 13,000 BTC in late 2024, built up over several years through state-backed hydroelectric mining. The drawdown began in earnest after October 2024 and has been steep.
From 13,000 to roughly 5,400 is a 58% reduction in coins. The dollar value has been hit twice, by the selling and by bitcoin’s decline from around $119,000 at the peak to $69,000 today.
What was likely a position worth over $1.5 billion at its height is now $374 million.

In December, Bhutan unveiled a national Bitcoin Development Pledge committing up to 10,000 BTC to fund Gelephu Mindfulness City, a special economic zone designed to use digital assets for its financial reserves.
Bhutan mined its coins using surplus hydropower, which means the cost basis is effectively zero. Unlike Strategy or corporate treasuries that bought at market prices, there’s no break-even math pressuring these sales. Every transfer is profit.
The Arkham balance chart shows the full arc. A slow build from near zero in early 2021, steady accumulation through the bear market, a ramp to roughly 13,000 BTC by late 2024, and then a sharp decline that hasn’t let up.
The transfers have gone to the same counterparties in similar sizes without any obvious correlation to specific price moves, which looks more like a treasury running a planned drawdown than a holder getting shaken out.
Druk holdings did not immediately reply to CoinDesk’s request for comment in Asian morning hours.
Crypto World
Pudgy Penguins launches its Club Penguin moment, and the game doesn’t feel like crypto at all

Pudgy Penguins shipped its flagship game to the general public on Monday, and the most notable thing about it is that you wouldn’t know it had anything to do with crypto unless someone told you.
Pudgy World, the browser-based game first announced at Art Basel in late 2023, went live with 12 unique towns across a world called The Berg, narrative quests where players help a penguin named Pengu find someone named Polly, and a set of mini-games.
CoinDesk played a 10-minute session and came away with a simple takeaway. It’s smooth, responsive, intuitive, and clearly not built with a crypto-first user in mind.
The game could be pure Club Penguin nostalgia for some users. The game was Disney’s browser-based virtual world that ran from 2005 to 2017 and peaked at over 200 million registered users, mostly kids who customized penguin avatars and played mini-games.
It remains the template for what a mass-market penguin game looks like, and the comparison Pudgy World could be measured against in the broader audience.

The NFT gaming space has spent years producing products that feel like wallets with gameplay bolted on. Pudgy World goes the other direction, building something that works as a game first and connects to the token economy second.
Whether that translates to retention and revenue is a different question, but the UX approach is a deliberate break from the pattern.
The PENGU token responded, jumping 9% on the day. Pudgy Penguin NFT floor prices held flat in ETH terms, though ether itself was up 5%, meaning the dollar-denominated floor rose with it.

The broader context is that crypto gaming has mostly failed to produce anything people actually want to play. Projects that led with token incentives attracted mercenary farmers who left the moment monetary yields dried up.
Pudgy’s bet is that building an audience through toys, memes, and brand affinity first, then giving that audience a game, works better than the other way around.
One game launch doesn’t prove the thesis. But shipping a product that feels like a game rather than a DeFi dashboard is further than most NFT projects have gotten.

We are already getting a glimpse of what Miliband would be like in No. 11
Vikings’ First Free Agent Move Might Tip Their Draft Hand

Today’s NYT Mini Crossword Answers for March 10


-

 Politics7 days ago
Alan Cumming Brands Baftas Ceremony A ‘Triggering S**tshow’
-
Business4 days ago
Form 8K Entergy Mississippi LLC For: 6 March
-

 Fashion4 days ago
Weekend Open Thread: Ann Taylor
-

 News Videos20 hours ago
10th Algebra | Financial Planning | Question Bank Solution | Board Exam 2026
-

 Crypto World16 hours ago
Paradigm, a16z, Winklevoss Capital, Balaji Srinivasan among investors in ZODL
-

 Tech5 days ago
Bitwarden adds support for passkey login on Windows 11
-
 Sports5 days ago
499 runs and 34 sixes later, India beat England to enter T20 World Cup final | Cricket News
-

 Sports2 days ago
Three share 2-shot lead entering final round in Hong Kong
-

 Sports2 days ago
Braveheart Lakshya downs Lai in epic battle to enter All England Open final | Other Sports News
-

 Business6 days ago
Guthrie Disappearance Enters Fifth Week as Family Visits Memorial
-

 Politics4 days ago
Top Mamdani aide takes progressive project to the UK
-

 NewsBeat5 days ago
Piccadilly Circus just unveiled ‘London’s newest tourist attraction’ and it only costs 80p to enter
-

 Business2 days ago
Search for Nancy Guthrie Enters 37th Day as FBI Probes Wi-Fi Jammer Theory
-
 Sports7 days ago
Jack Grealish posts new injury update as Man City star enters crucial period
-

 Entertainment3 days ago
Hailey Bieber Poses For Sexy Selfies In New Luscious Lip Thirst Traps
-
 NewsBeat7 hours ago
Pagazzi Lighting enters administration as 70 jobs lost and 11 stores close across Scotland
-

 Tech17 hours ago
Despite challenges, Ireland sixth in EU for board gender diversity
-

 Crypto World5 days ago
New Crypto Mutuum Finance (MUTM) Reports V1 Protocol Progress as Roadmap Enters Phase 3
-

 Tech5 days ago
ACIP To Discuss COVID ‘Vaccine Injuries’ Next Month, Despite That Not Being In Its Purview
-
Entertainment5 days ago
Harry Styles Has ‘Struggled’ to Discuss Liam Payne’s Death