Today’s Bitcoin (BTC) sell-off coincides with a massive breakout in crude oil prices, which surged past $110 per barrel on escalating Middle East tensions.
The original cryptocurrency briefly dropped down to $66,010 on Monday, marking a 10% slide from its March 5 peak of $73,670.
That energy shock is rattling risk assets globally. As oil costs climb 30% on the day, traders fear renewed inflation will force the Federal Reserve to keep interest rates elevated, draining liquidity from speculative markets.
Bitcoin and Stocks: Oil Prices are Recoupling Them
The correlation between Bitcoin and equities has tightened significantly, leaving the asset vulnerable to broader market panic.
The oil spike triggered immediate losses in Asia, where Japan’s Nikkei plunged 7% and South Korea’s KOSPI dropped 6% Monday. This risk-off shift has already impacted institutional flows. Bitcoin ETFs saw $576.6 million in net outflows late last week, adding sell-side pressure to the spot price.
When you were right about geopolitical instability but bought Bitcoin instead of gold or oil pic.twitter.com/7v2RTglhSZ
That heavy selling aligns with broader cross-asset weakness. As Bitcoin price and stocks stabilize, the bond market continues to signal ongoing macro risk, suggesting the path of least resistance remains lower for now.
If risk assets continue to sell off, Bitcoin’s high correlation suggests it will struggle to find a floor independent of the stock market.
Technical Price Analysis: The Levels That Change Everything
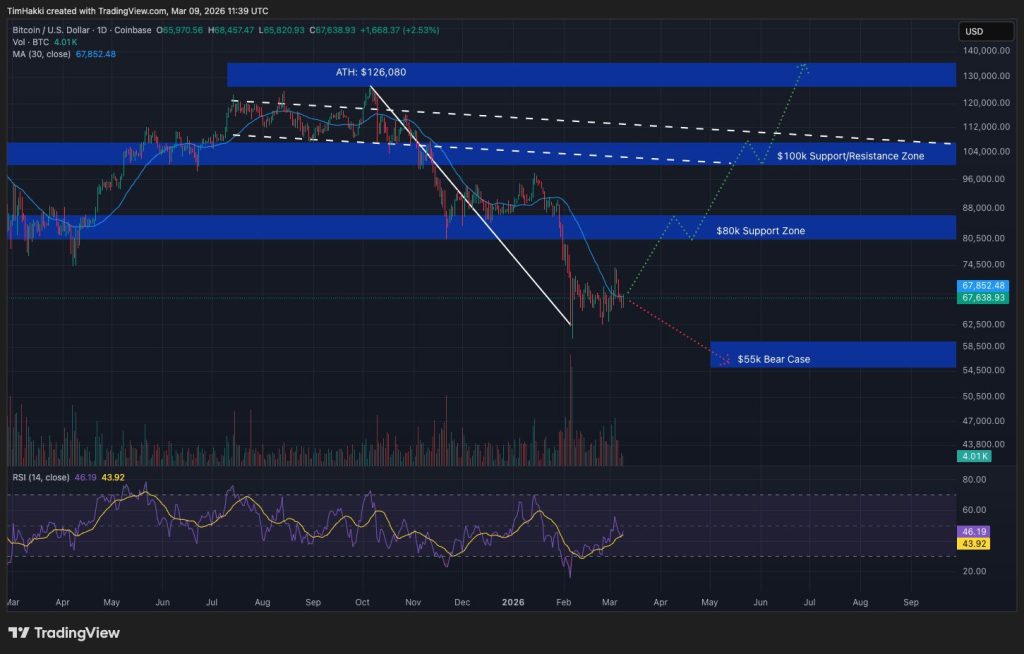
The technical picture shows Bitcoin testing critical support levels after losing the $70,000 handle. The price is currently hovering near $66,000.
Advertisement
The slide has brought Bitcoin back to levels seen before the recent surge.
If sellers push the price below $62,300, the chart structure risks a breakdown toward Fibonacci support levels at $56,800 or even $52,300.
Bearish momentum is supported by the 50-day SMA at $77,200, which is currently acting as overhead resistance.
However, on-chain data offers a counter-narrative. Bitcoin is vanishing from exchanges, suggesting a potential supply shock could cushion the downside if long-term holders refuse to sell at these levels.
To invalidate the bearish structure, buyers need to reclaim the $72,600 level. Anything below that keeps the bears in control.
Advertisement
Bitcoin Fears: Rising Oil Prices Drive a Hawkish Fed
The surge in oil is the primary headwind. Crude prices rose 72% in the past month, sparking fears that input costs will drive inflation higher across industries.
Former President Donald Trump commented that the spike is a “very small price to pay,” but for markets, the cost is liquidity. If energy prices bleed into CPI data, the Fed may be forced to hold rates higher for longer.
That policy risk puts a cap on upside volatility. Traders monitoring options expiry and max pain levels should expect continued chop as the market prices in a more hawkish Fed.
Editor’s note: Recent geopolitical developments involving Iran have heightened market sensitivity to oil prices, inflation and interest rate expectations. While the escalation adds new risk, the broader investment case for equities in 2026 remains intact, with the long‑term outlook now more dependent on macro factors and policy signals. The commentary below highlights how higher energy costs could keep inflation stickier for longer, shifting focus from headlines to how tighter financial conditions could affect valuations.
Key points
Iran-related tensions heighten sensitivity to oil prices, inflation and rate expectations.
The recent Iran escalation has not overturned the broader 2026 case for equities, but it has made that outlook much more dependent on oil, inflation and interest rates.
The shift emphasises macro-driven valuation dynamics over headlines.
The longer-term equity thesis remains positive, but markets are now more responsive to oil, rates and the dollar.
Why this matters
The interplay between higher energy costs and inflation can influence monetary policy expectations and equity valuations. While US markets have shown resilience, a firmer dollar and oil volatility create a more nuanced backdrop for global investors, with emerging markets potentially feeling the impact more than developed ones. In this context, timely macro signals matter for assessing risk and opportunity in 2026.
What to watch next
Oil price and inflation trends to gauge inflation persistence and policy stance.
US dollar movements and Fed policy signals that affect valuation multiples.
Emerging markets sensitivity to dollar strength and commodity volatility.
Disclosure: The content below is a press release provided by the company/PR representative. It is published for informational purposes.
Geopolitical Escalation Raises Oil and Inflation Risks but Equity Outlook for 2026 Remains Intact
Abu Dhabi, United Arab Emirates – March 09, 2026: Recent geopolitical developments involving Iran have heightened market sensitivity to oil prices, inflation, and interest rate expectations, according to Lale Akoner, Global Market Analyst. While the escalation has introduced new risks, the broader investment case for equities in 2026 remains intact—though the path forward has become more dependent on macroeconomic factors.
Commenting on the evolving market dynamics, Akoner noted that higher energy prices could keep inflation elevated for longer than previously expected, potentially reshaping expectations around monetary policy.
“The recent Iran escalation has not overturned the broader 2026 case for equities, but it has made that outlook much more dependent on oil, inflation and interest rates,” said Akoner. “If higher energy prices keep inflation stickier for longer, the main risk is likely to come through valuations rather than earnings, as markets scale back expectations for rate cuts and multiples come under pressure. That is why the focus has shifted from the geopolitical headlines themselves to whether they result in tighter financial conditions.”
Despite rising geopolitical tensions, US markets have demonstrated relative resilience—an outcome that aligns with typical investor behaviour during periods of uncertainty. In such environments, investors often gravitate toward markets with greater liquidity and depth.
Advertisement
“At the same time, US markets have shown relative resilience, which is consistent with how investors typically behave in periods of uncertainty,” Akoner added. “In more volatile conditions, capital often moves toward the depth and liquidity of US assets, and that is also supporting the dollar. For now, the dollar move still looks like a classic safety bid, but if investors continue to favour cash and Treasuries, it could become a more durable upswing rather than a short-term spike.”
A stronger US dollar combined with volatility in oil markets could also create a more challenging environment for emerging markets, particularly those that benefited from expectations of a softer dollar and looser monetary policy.
“That matters because a firmer dollar and higher oil volatility create a more difficult backdrop for the parts of the market that had been benefiting from softer-dollar and easier-policy assumptions, particularly emerging markets,” Akoner explained. “It also means the Fed may need to remain more cautious, even if the broader direction of policy still points to eventual easing.”
While the longer-term outlook for equities remains positive, Akoner emphasized that markets are now far more sensitive to movements in oil prices, interest rates, and the strength of the US dollar.
“So the long-equities thesis is still intact, but it is now far more sensitive to oil, rates and the dollar than it was just a few weeks ago,” she concluded.
eToro is the trading and investing platform that empowers you to invest, share and learn. We were founded in 2007 with the vision of a world where everyone can trade and invest in a simple and transparent way. Today we have 40 million registered users from 75 countries. We believe there is power in shared knowledge and that we can become more successful by investing together. So we’ve created a collaborative investment community designed to provide you with the tools you need to grow your knowledge and wealth. On eToro, you can hold a range of traditional and innovative assets and choose how you invest: trade directly, invest in a portfolio, or copy other investors. You can visit our media centre here for our latest news.
Advertisement
Risk & affiliate notice: Crypto assets are volatile and capital is at risk. This article may contain affiliate links. Read full disclosure
If the crypto industry manages its top priority to get its market structure legislation through the U.S. Senate and to the desk of President Donald Trump, he might not sign it if he holds true to threats he’s been making to withhold his signature from any other legislation before the elections bill.
Trump, in the midst of managing a U.S. war with Iran, has spent significant attention on the SAVE America Act, which he’s declared his top priority in Congress. The proposed legislation would be designed to impose new hurdles for U.S. voting, including identification requirements, proof-of-citizenship demands and strict limits on mail-in ballots that would be expected to thin the voter rolls.
He acknowledged that the effort — a new version of the previous Safeguard American Voter Eligibility (SAVE) Act that already passed the House of Representatives — will have a difficult time in the Senate, where he suggested there are four or five Republican lawmakers who aren’t on board. In addition to the voter requirements, the bill would additionally focus on banning transgender athletes in women’s sports and gender-affirming surgery for children.
Advertisement
Democrats criticize the voter-ID effort as voter suppression written to fix an election-fraud problem for which there’s no evidence, despite the presidents’ claims that he’s been cheated in elections.
Trump argued the act would secure Republican power in the U.S. for half a century.
“You’re going to win the midterms at levels you wouldn’t even believe,” Trump told the Republican audience. The GOP is widely expected to lose ground in November’s congressional midterms, including a potential loss of the House majority, which current betting on prediction market Polymarket puts at an 85% likelihood. “You’re going to win every election for a long time until somebody really screws things up, and hopefully that won’t happen.”
But the president has also been a major driver of the Digital Asset Market Clarity Act that’s been the top policy goal for the crypto industry. His new stance that he won’t approve other bills before his voter-ID effort throws a shadow on the digital assets push, which is working toward a long-awaited approval from the Senate Banking Committee.
Advertisement
The negotiation over the market structure bill has been difficult, but crypto insiders have maintained hope that the talks could find sufficient common ground as soon as this week to get a hearing scheduled to move it through committee. The legislation has already advanced through the Senate Agriculture Committee, so if it makes it through the banking panel, a final version would need to be meshed together for a vote of the overall Senate. Assuming the House would sign off, because it had already approved a similar bill last year, the legislation would then reach Trump’s desk.
Now the crypto sector has to wonder how serious the president was about refusing to sign anything, even a digital asset bill he has demanded be quickly sent to his desk. Establishing a pro-crypto regulatory system in the U.S. has been among the top issues for the Trump White House, so a Clarity Act passage will test whether Trump can force action on SAVE while still getting his crypto project accomplished.
The oil market has moved in tandem with geopolitical headlines, but Bitcoin’s response to these energy shocks remains imperfect and highly nuanced. Crude prices have surged to about $101 per barrel, delivering what observers describe as a record 55% jump in just ten days. In parallel, equities wavered, with the S&P 500 sliding to fresh multi-week lows as investors weighed inflation risks against strategic shifts in global energy supply. Amid this backdrop, Bitcoin has delivered a mixed signal: an initial uptick that faded as energy volatility persisted, underscoring a broader point for traders who once treated oil as a primary driver for crypto moves. Today, Bitcoin appears more closely aligned with tech equities than with crude itself, complicating the conventional “oil up, crypto up” narrative.
Key takeaways
Oil spikes have historically preceded Bitcoin rallies, averaging about a 20% gain over four weeks when WTI jumps 15% or more within 10 days, though the sample size is modest and outcomes vary.
Bitcoin’s current correlation with the Nasdaq 100 sits around 81%, indicating that tech-stock dynamics can dominate price action even amid energy-driven volatility.
When oil prices surged to around $101 per barrel, Bitcoin initially rose about 16% from late February to midweek, but those gains were largely erased within days as macro conditions shifted.
Geopolitical risk, including U.S.–Iraq–Iran regional tensions, remains a persistent backdrop that could reintroduce volatility into both energy and crypto markets, depending on de-escalation timelines and macro data.
If the historical pattern repeats, Bitcoin could target a move toward roughly $79,200 by the end of March, though this remains a probabilistic outcome rather than a forecast with high statistical certainty.
Market context: The interaction between energy prices and tech-driven risk sentiment suggests that volatility in energy markets may feed into broader liquidity conditions and risk appetite, yet the prevailing driver for Bitcoin may be the performance of high-growth tech equities rather than crude alone. As investors parse headlines around the Iran–Israel corridor and potential shifts in oil supply, Bitcoin’s path is being shaped by a mix of macro data, stock correlations, and energy updates rather than a single dominant factor.
Why it matters
For traders and portfolio managers, the recent data emphasize a layered reality: energy spikes can coincide with crypto strength, but the strength may not be durable if broader risk assets weaken. The 81% Nasdaq 100 correlation implies that Bitcoin’s cyclicality and adoption narratives are increasingly tethered to technology-oriented earnings and growth expectations, not just macro energy prices. This matters for hedging strategies, risk budgeting, and asset allocation, particularly in markets where liquidity is stretched and volatility remains elevated.
From a mining and infrastructure perspective, the energy backdrop also matters for costs, margins, and capital discipline. A sustained energy shock can pressure mining economics and influence the sector’s strategic decisions, even as Bitcoin continues to draw interest from institutional investors seeking uncorrelated exposure or diversification across macro regimes. The evolving relationship between oil moves and crypto prices should be evaluated alongside regulatory developments, ETF flows, and the broader macro narrative that governs risk sentiment across digital assets.
Advertisement
What to watch next
Follow near-term oil price trajectories and any supply news that could shift WTI’s direction in the next 2–4 weeks.
Monitor regional developments in the Iran–Israel corridor and any de-escalation signals that could influence risk appetite in equities and crypto alike.
Track macro data releases (inflation, employment, and consumer spending) that can modulate the tech-led risk-on environment and thereby affect Bitcoin’s correlation with the Nasdaq 100.
Watch Bitcoin price action within the four-week window following large oil moves to see whether the historical ~20% average gain materializes again or if the pattern breaks down in 2026’s market regime.
Sources & verification
Oil price data showing WTI near $101 per barrel and a ~55% rise over ten days, and the related S&P 500 performance.
Bitcoin price path during the period, including a ~16% uptick between late February and the following Wednesday, followed by a retrace by Sunday.
The 81% correlation figure between Bitcoin and the Nasdaq 100 index.
Historical episodes cited for oil spikes and Bitcoin responses (dates and outcomes spanning 2020–2025).
Oil shocks, Bitcoin, and the cross-asset puzzle
Bitcoin (CRYPTO: BTC) has long lived in a market where macro shocks travel through multiple channels before settling in price action. The latest sequence begins with a fresh spike in energy costs and geopolitical tensions that have the potential to ripple through inflation expectations, consumer spending, and risk appetite. In the short term, the price environment for risk assets appears complex: crude oil has surged toward the $101 per barrel mark, signaling tight energy markets and persistent inflationary pressures. Yet Bitcoin’s immediate response remains nuanced, with early gains often trimmed as traders reassess liquidity conditions, funding costs, and correlations to more risk-on segments of the market.
The data cited in the current discourse show a consistent, albeit imperfect, pattern: when WTI oil spikes by 15% or more within a 10-day window, Bitcoin has historically managed an average push higher—roughly 20% over the following four weeks. The caveat is clear: the observed sample is small, and real-world dynamics in 2026 may diverge from earlier cycles driven by different macro forces, liquidity regimes, and regulatory contours. In the most recent stretch, the oil leg captured attention with a rapid ascent, while Bitcoin’s first response was an upward spark of about 16% between late February and the subsequent midweek, a move that was subsequently retraced as concerns about inflation, growth, and funding costs reasserted themselves. For investors, this underscored a familiar truth: cross-asset signals can be transitory, and timing risk remains a core feature of crypto-market trades.
In parallel, the Nasdaq 100 continues to exert a strong pull on Bitcoin’s price action. An 81% correlation suggests that the technology sector’s temperament often sets the pace for Bitcoin’s risk-on or risk-off leanings, at times eclipsing crude’s influence. That linkage implies that a recovery in tech equities—should geopolitical tensions ease or macro data improve—could lift Bitcoin even if oil remains volatile. Conversely, a tech-led sell-off or a broad risk-off re-pricing could pressure Bitcoin even as oil markets stabilize, complicating the narrative that energy prices are the sole driver of crypto moves.
Beyond the numbers, the geopolitical landscape remains a critical variable. The Iran–Israel axis, potential escalations, and the prospect of energy-supply constraints all carry the potential to rekindle inflation fears and test the resilience of risk assets. While the near-term outcome is uncertain, the historical record offers a hedged lens: the most consequential moves tend to emerge when energy shocks align with broader macro stress or clarity about policy responses. In that sense, Bitcoin’s path forward may hinge not only on oil price levels but also on how quickly regional tensions move toward de-escalation and how macro data evolves in a world still navigating monetary tightening, fiscal support, and global diversification of energy supply.
For market participants, the key takeaway is balance: energy headlines matter, but the price dynamics of Bitcoin in 2026 likely reflect a composite of tech risk sentiment, macro outcomes, and the evolving regulatory environment. If the pattern observed across prior cycles holds, a renewed energy shock could ignite a larger rally in Bitcoin—but only if tech equities provide supportive momentum and liquidity conditions remain favorable. If not, the energy-driven impulse could be absorbed by broader market volatility, leaving Bitcoin to drift within a wider trading range. The ultimate trajectory will depend on how quickly the geopolitical uncertainty resolves, how energy markets adjust to any shifts in supply resilience, and how investors price the interplay between inflation, growth, and cross-asset correlations.
Advertisement
For readers seeking verifiable anchors, the related note on energy market dynamics remains a useful context: Oil retreats from 25% surge as G7 weighs emergency reserve release offers a contemporaneous lens into how policy actions can modulate the pace and persistence of energy moves when geopolitical risk spikes.
In sum, while crude oil remains a meaningful backdrop for global markets, Bitcoin’s sensitivity appears increasingly tethered to the tech-centric risk environment. The path forward will be shaped by how quickly energy tensions evolve, how tech equities perform, and how macro narrative evolves as liquidity conditions shift in response to central-bank signals and regulatory developments. The coming weeks will be telling as these forces interact, testing the reliability of oil-derived signals in a crypto market that has matured into a broader, more cross-linked risk ecosystem.
Risk & affiliate notice: Crypto assets are volatile and capital is at risk. This article may contain affiliate links. Read full disclosure
ТАО is today’s top gainer, while Pi Network’s PI token continues its crazy ride.
Bitcoin’s price faced some enhanced volatility in the past 24 hours again, dropping toward $65,500 before it jumped to $68,500, only to be rejected after the latest developments on the Middle East war front and the fluctuating oil prices.
Ethereum is challenging its nemesis at $2,000 once more, while HASH and STABLE have plunged hard from the mid-cap alts.
Advertisement
BTC’s Ride
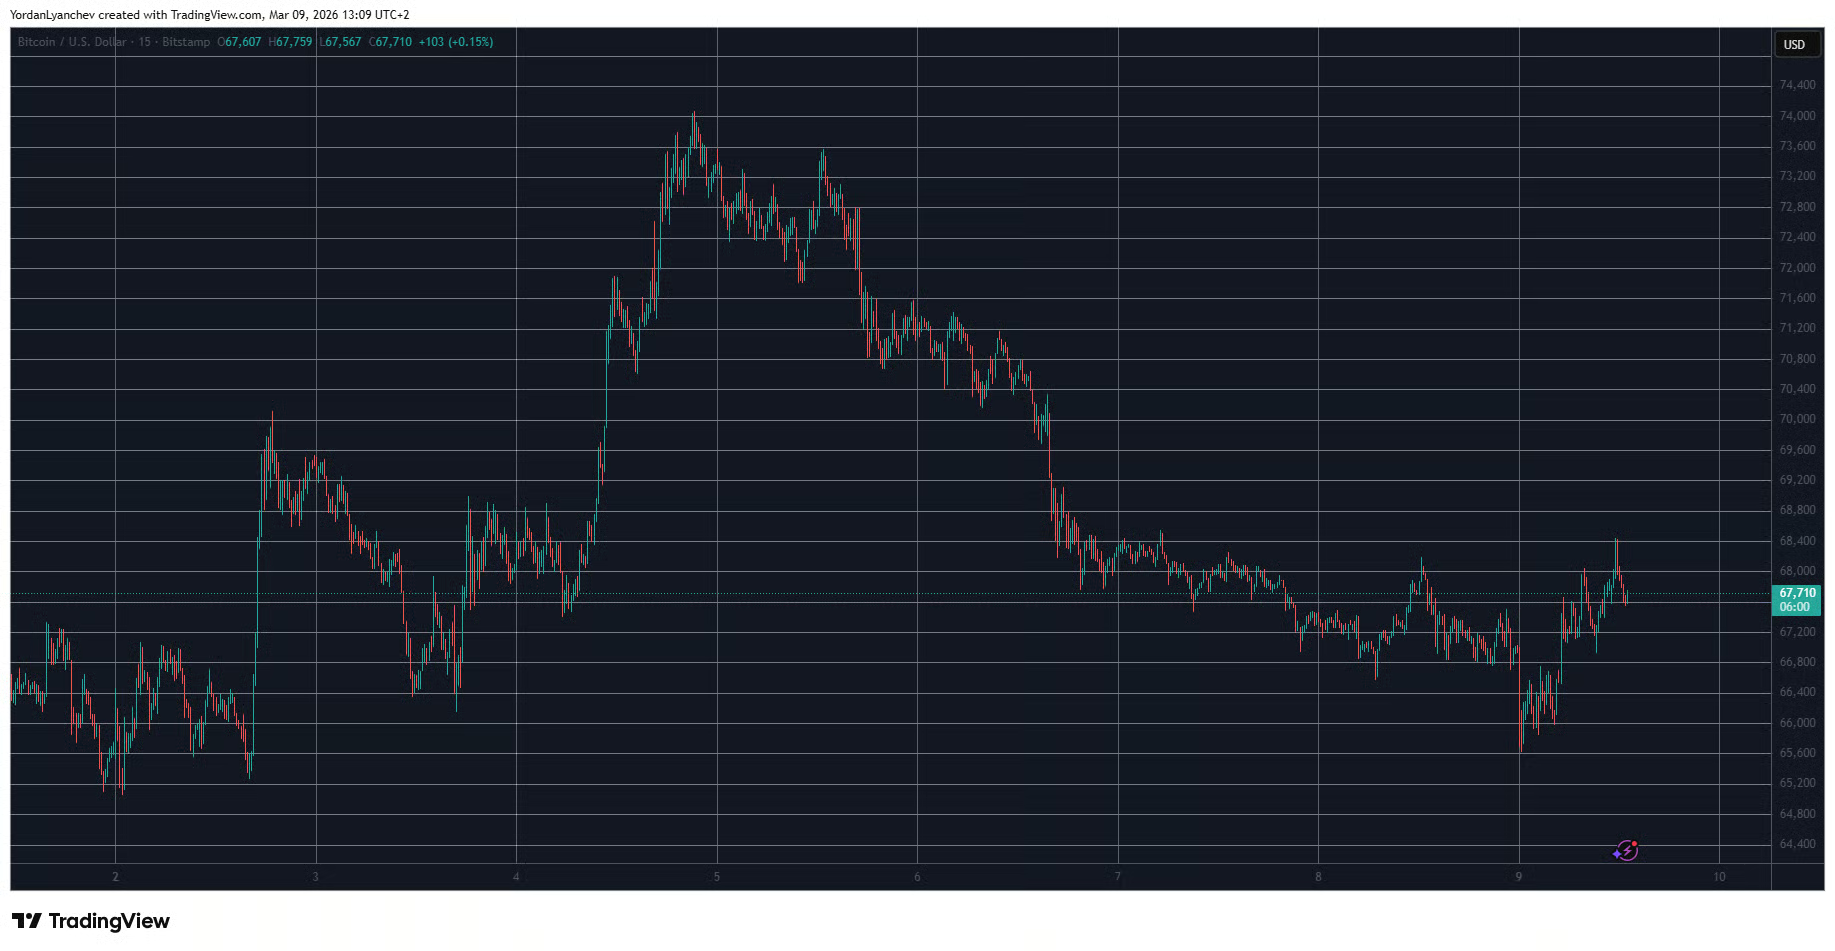
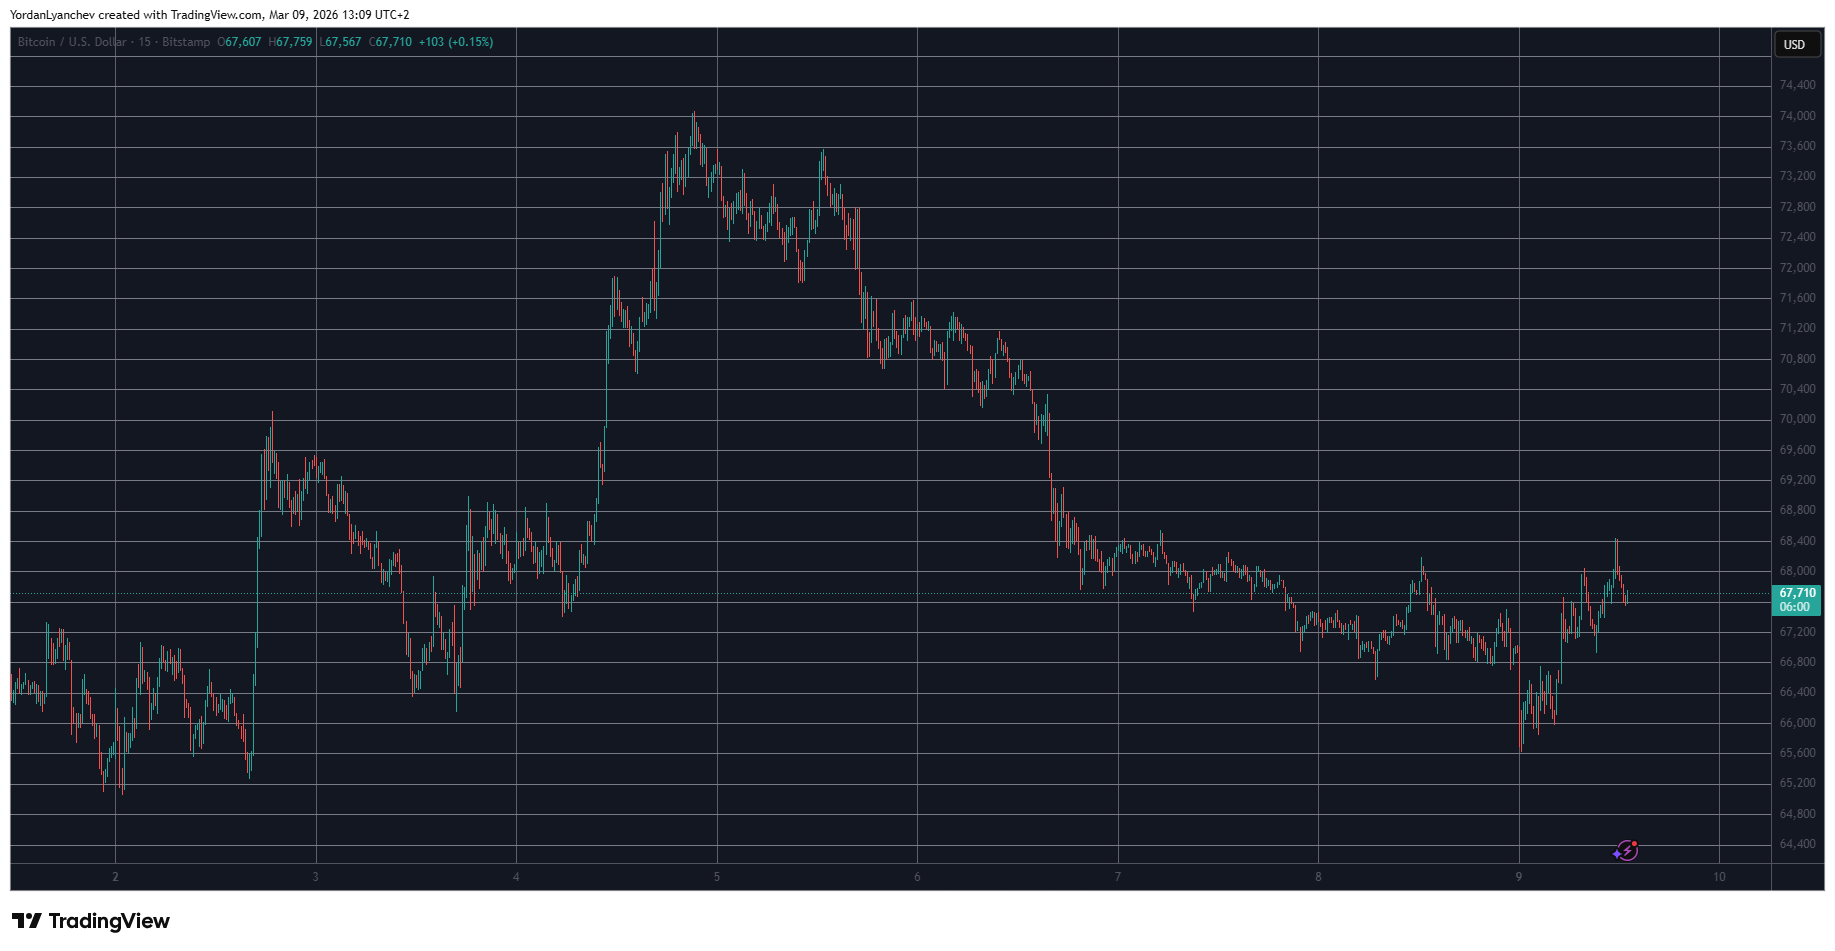
After dumping from $67,000 to $63,000 on February 28 when the strikes in the Middle East began, bitcoin’s price rebounded hard and skyrocketed to $74,000 on Wednesday. This meant that the asset had added $11,000 in days, which, given the current uncertain landscape, was almost expected to be followed by a sharp decline.
The bears indeed took control of the market in the following days and pushed BTC south to $68,000 on Friday and Saturday. Although it was a significantly less volatile weekend compared to the previous one, BTC still felt some fluctuations on Sunday evening when most legacy futures markets opened.
As Israel struck a few Iranian oil bases, the price of the so-called liquid gold skyrocketed this morning to a fresh multi-year peak of $120 per barrel. Reports emerged that the G7 countries plan to release 400 million barrels, which drove USOIL south to under $96,000 before it rebounded to $102 as of press time.
Bitcoin dipped to $65,500, jumped to $68,500, and returned to $67,500 all within hours. Its market cap is back to $1.350 trillion, while its dominance over the alts stands at 56.5% on CG.
Advertisement
BTCUSD Mar 9. Source: TradingView
ETH Battles $2K
The largest altcoin jumped to $2,200 last Wednesday, but it was rejected hard and dumped to just over $1,900 days later. It rebounded and now fights for $2,000 once again, but its attempt is still looking weak.
BNB, SOL, HYPE, XMR, and LINK have charted insignificant gains daily, while XRP, TRX, DOGE, ADA, and BCH are in the red. CC has dropped the most from the larger cap alts, while TAO has soared by almost 10% to $195.
Pi Network’s PI token continues to be quite volatile, jumping 5% daily to over $0.21 after its crash to $0.20 yesterday.
The total crypto market cap has remained relatively the same, at just under $2.4 trillion on CG.
Cryptocurrency Market Overview Mar 9. Source: QuantifyCrypto
SPECIAL OFFER (Exclusive)
Binance Free $600 (CryptoPotato Exclusive): Use this link to register a new account and receive $600 exclusive welcome offer on Binance (full details).
LIMITED OFFER for CryptoPotato readers at Bybit: Use this link to register and open a $500 FREE position on any coin!
Advertisement
Disclaimer: Information found on CryptoPotato is those of writers quoted. It does not represent the opinions of CryptoPotato on whether to buy, sell, or hold any investments. You are advised to conduct your own research before making any investment decisions. Use provided information at your own risk. See Disclaimer for more information.
Sonic Labs debuts USSD, a stablecoin backed by U.S. Treasury products for DeFi liquidity.
The digital asset maintains 1:1 backing through tokenized Treasury holdings from leading institutions.
Minting occurs via non-custodial smart contracts without additional charges.
Cross-chain functionality across 10+ blockchains powered by LayerZero technology.
Native USDC compatibility enhances liquidity flow and DeFi accessibility.
Sonic Labs has introduced USSD, a dollar-pegged digital currency backed by tokenized U.S. Treasury instruments. The new stablecoin is designed to deliver reliable liquidity throughout the Sonic blockchain environment. USSD will facilitate various financial activities including trading, payments, lending operations, and transaction settlement within decentralized finance platforms.
The digital asset maintains complete one-to-one backing through regulated Treasury instruments. These underlying assets originate from prominent financial entities such as BlackRock, WisdomTree, and Superstate. This backing mechanism provides stability and clear transparency for everyone utilizing the Sonic platform.
USSD enables direct minting through decentralized smart contract technology. Compatible assets can be deposited at equal value with zero extra charges. This framework creates accessibility for builders, liquidity contributors, and DeFi ecosystem members.
USSD reserves consist of premium Treasury instruments maintained with regulated custody providers. The architecture resembles the system employed by Frax for its FRAX digital dollar. This methodology guarantees transparent redemption processes and trustworthy asset collateralization.
Tokenized Treasury instruments connect traditional financial systems with blockchain technology. They preserve stable value while ensuring on-chain visibility. The backing allows Sonic to incorporate institutional returns at its foundation.
Advertisement
USSD’s Treasury-based structure facilitates sustainable ecosystem expansion. Income generated from underlying assets may finance platform development and user rewards. The framework enhances Sonic’s capacity to deliver dependable liquidity for decentralized applications.
Multi-Chain Functionality and USDC Compatibility
USSD enables minting across more than ten blockchain ecosystems through LayerZero protocols. Participants can deposit supported tokens on external networks and obtain USSD on Sonic instantly. This feature minimizes complexity and streamlines cross-chain asset transfers.
The stablecoin works harmoniously with Circle’s USDC, enabling effortless conversions between platforms. Participants can exchange USSD for USDC utilizing Chainlink’s Cross-Chain Transfer Protocol. This configuration delivers familiar entry and exit pathways for dollar-denominated digital assets.
Incorporation of Frax’s GENIUS infrastructure delivers enterprise-level functionality. It guarantees that minting, conversion, and multi-chain operations remain protected and dependable. USSD therefore becomes a core stable instrument for Sonic’s expanding DeFi landscape.
Advertisement
Sonic’s Platform Expansion and Strategic Integration
USSD represents a critical component in Sonic’s comprehensive integration approach. It facilitates value accumulation to the native S token through stable asset liquidity. This provides applications with a dependable dollar benchmark on the blockchain.
The stablecoin allows Sonic to access institutional returns while supporting platform advancement. Managing liquidity and transaction volumes becomes more efficient with a native, collateralized instrument. This development reinforces the ecosystem while preserving openness and dependability.
Sonic operates as an EVM-compatible Layer 1 network focused on maximum throughput and rapid transaction finality. USSD strengthens its monetary infrastructure by delivering a trustworthy, platform-native dollar instrument. This introduction establishes Sonic as a formidable competitor among high-performance blockchain platforms.
Sharplink reported a full-year net loss of $734 million after a decline in Ethereum prices reduced the value of its holdings.
The company recorded a $616 million decrease in the value of its Ethereum treasury during the year.
Sharplink booked a $140 million impairment charge related to tokens representing staked Ethereum.
The firm generated a $55 million net gain from conversions between Ethereum and staking tokens.
Quarterly staking revenue increased 50% to $15.3 million dollars from $10.3 million dollars.
Sharplink reported a $734 million full-year loss after a sharp decline in the Ethereum price reduced the value of its holdings. The Miami-based company disclosed that falling token prices drove most of the loss, even as staking revenue increased. Management said the firm maintained its strategy while expanding its Ethereum treasury position.
Sharplink Reports Full-Year Loss After Ethereum Price Drop
Sharplink recorded a $734 million net loss for the year, reversing a $10.1 million profit in 2024. The company attributed the loss to a $616 million decline in the value of its Ethereum holdings. It also booked a $140 million impairment charge tied to tokens representing staked Ethereum.
However, the firm posted a $55 million net gain from conversions between Ethereum and related staking tokens. The company confirmed it currently holds 867,000 Ethereum tokens. CoinGecko data showed Ethereum traded near $2,000 on Monday, valuing those holdings around $1.75 billion.
Sharplink’s holdings rank second among corporate Ethereum treasuries. BitMine Immersion Technologies holds about $9 billion in Ethereum under the oversight of Tom Lee. The company ended the year with $30.4 million in cash and stablecoins.
Shares of Sharplink traded at $7.41 on Monday, according to Yahoo Finance. Over the past six months, the stock declined 55%. During the same period, Ethereum fell 53%.
Advertisement
Ethereum Staking Revenue Climbs as Treasury Strategy Expands
Sharplink increased its staking revenue by 50% quarter over quarter. The company generated $15.3 million from staking, compared with $10.3 million in the previous quarter. It has earned 14,500 Ethereum from staking activities, valued at about $9.4 million.
Sharplink participates in Ethereum’s transaction validation process through staking operations. The company also deploys capital into decentralized finance protocols to pursue higher yields. Management stated that boosting Ethereum per share remains a core objective.
Sharplink currently holds about 4 Ethereum per share. The company has raised approximately $3.2 billion to support its transition toward an Ethereum-focused treasury model. CEO Joseph Chalom described the year as transformative for the firm.
“2025 was a defining year for Sharplink,” Chalom said in a shareholder letter. He stated that short-term market volatility can affect results. He added, “Our strategy is consistent and designed to endure.”
Advertisement
Joe Lubin, CEO of Consensys and Sharplink’s chairman, addressed institutional adoption trends. He said, “The institutional adoption supercycle accelerated in 2025.” Lubin stated that Sharplink aims to bridge traditional public markets with the Ethereum ecosystem.
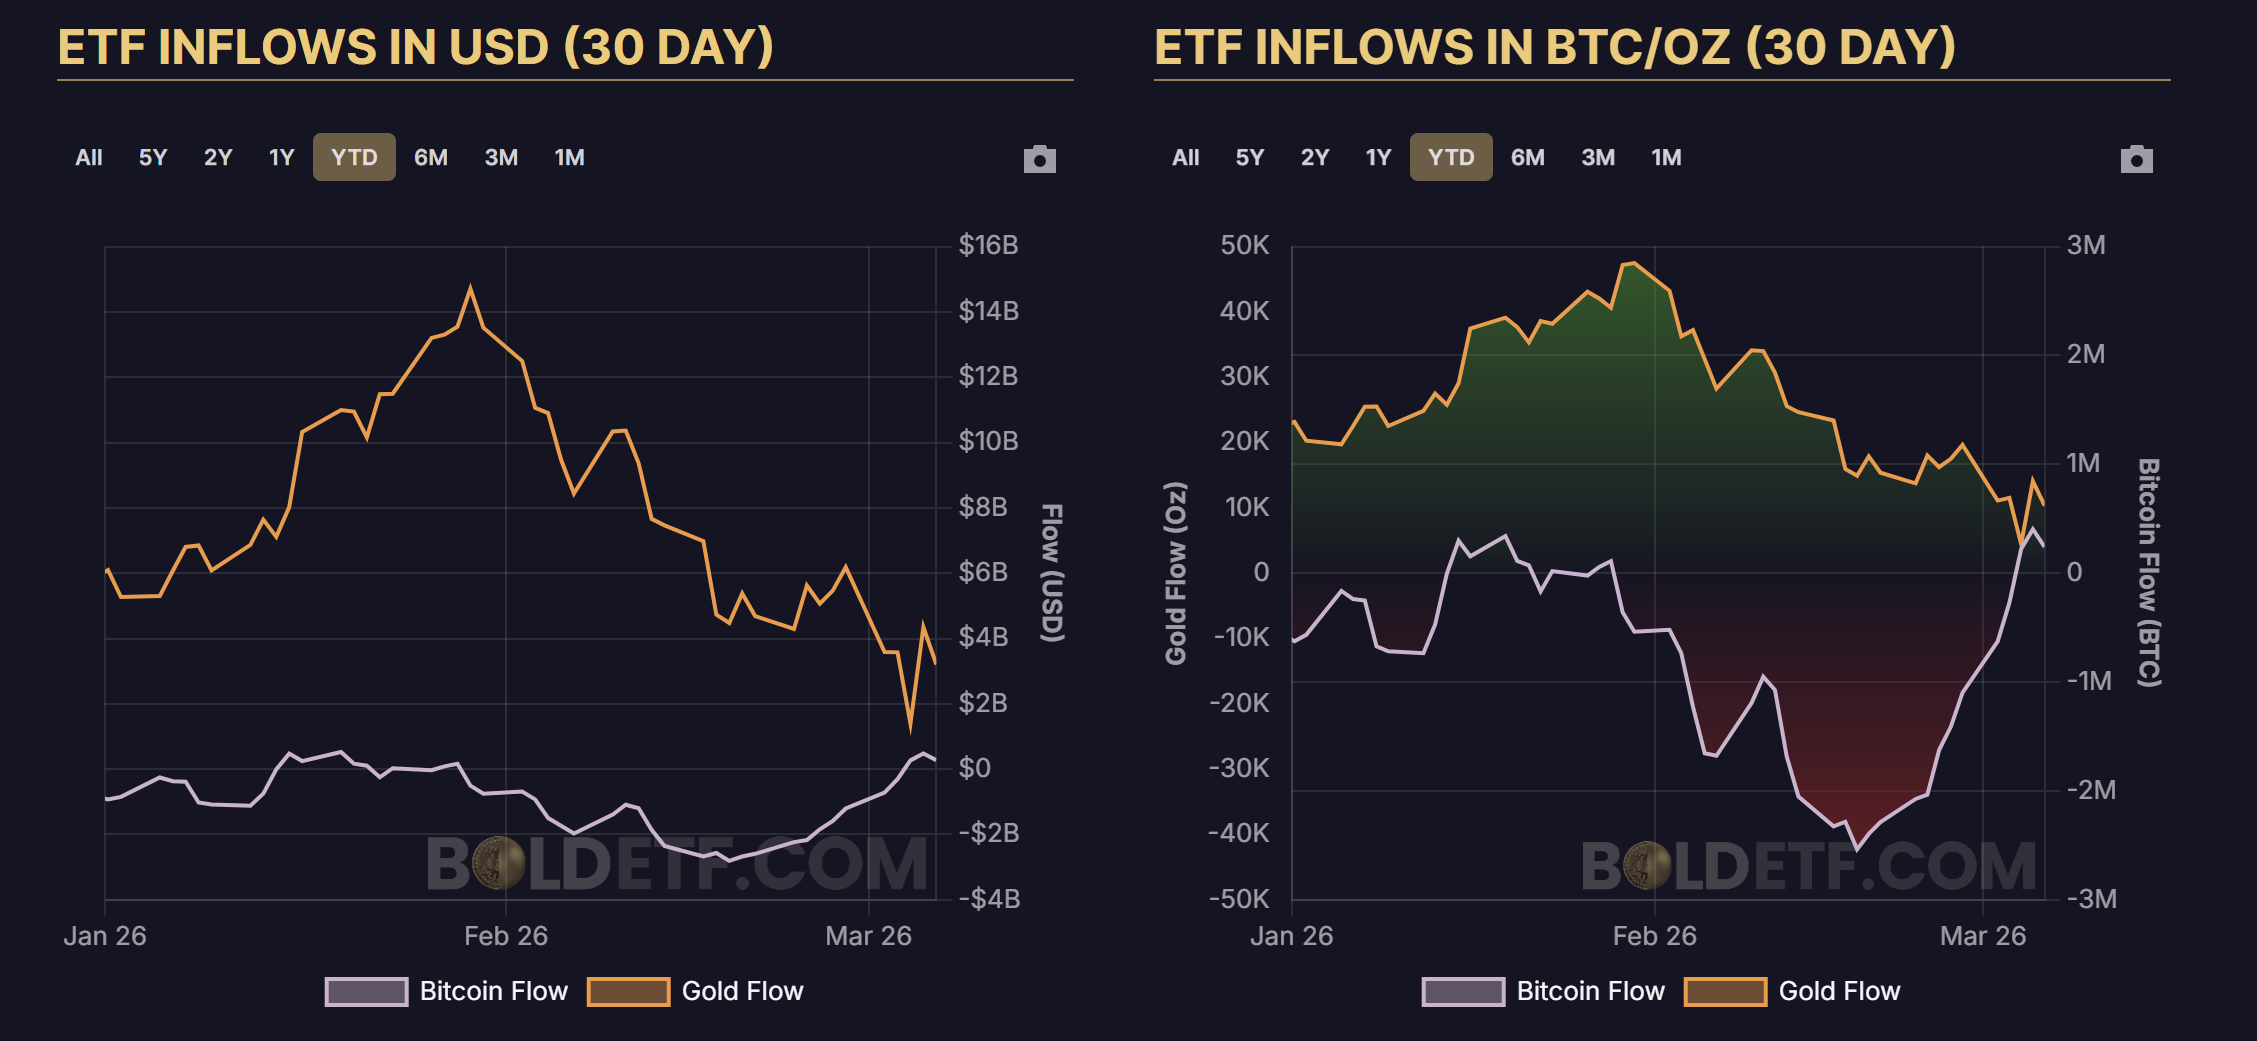
Bitcoin (BTC) exchange-traded fund (ETF) flows have turned net positive over the past 30 days, while gold ETF demand has started to slow down after nine straight months of inflows. The shift comes even as gold prices remain elevated and sentiment around Bitcoin continues to cool.
With these contrasting trends in ETF flows and the historical pattern of Bitcoin-to-gold performance cycles, analysts are now examining data that may signal a gradual shift in investor demand between the two assets.
Are ETF flows beginning to rotate?
According to the Kobeissi Letter, the largest US gold-backed ETF, GLD, recorded a $3 billion outflow on Wednesday, the largest daily withdrawal in more than two years. The move followed a 4.4% decline in gold prices, the sharpest drop since the Jan. 30 sell-off.
Gold ETFs had attracted $18.7 billion in January and another $5.3 billion in February, marking the strongest two-month start to a year on record and extending a nine-month inflow streak. The latest outflow points to investors taking profits after gold’s massive rally in 2025.
Advertisement
Bitcoin ETF flows moved in the opposite direction over the past month. The 30-day net flow shifted to a $273 million inflow on March 6 from a $1.9 billion outflow on Feb. 6
Bitcoin and gold net ETF inflows over the past 30-days. Source: bold.report
The holdings data measured in native units show the divergence more clearly. Bitcoin ETF balances moved to a net increase of 4,021 BTC on March 6 from −42,275 BTC on Feb. 6. Gold ETF holdings declined from 1.4 million ounces to 621,100 ounces during the same period.
The native units represent the actual underlying asset held by funds rather than the dollar value of those holdings. Tracking BTC or ounces isolates real accumulation or distribution without the distortion created by the price movements.
Head of growth at Horizon, Joe Consorti, summarized the current trend and said,
“Gold is stalling out while bitcoin is soaring. BTC is set to overtake gold’s % growth over the last month as the U.S. economy accelerates and risk sentiment improves. The anticipated risk-off → risk-on rotation could be underway.”
In a “2026 Look Ahead” report released at the end of December 2025, Fidelity Digital Assets analyst Chris Kuiper noted that gold’s 65% return in 2025 was the fourth-largest annual gain since the end of the gold standard. With respect to past rallies, Kuiper noted that gold is potentially near the late stages of its leadership cycle between the two assets. Kuiper said,
“Historically, gold and bitcoin have taken turns outperforming. With gold shining in 2025, it would not be surprising if bitcoin takes the lead next.”
However, the rotation may take some time to unfold in the market.
As illustrated in the chart, BTC needed roughly 147 days or 21 weeks to establish a sustained trend outperforming gold after Bitcoin’s 2022 bottom. The period marked a consolidation phase before the ratio began trending higher.
The BTC-to-gold ratio currently trades near the same consolidation zone seen during the earlier rotation phases in 2022-2023.
Kuiper also added that both assets can benefit from the persistent fiscal deficits, trade tensions, and geopolitical uncertainty as investors seek neutral stores of value outside traditional monetary systems.
Advertisement
The ongoing US-Israel and Iran war has reinforced demand for traditional safe-haven assets, which previously supported gold rallies during periods of geopolitical stress.
Meanwhile, macroeconomic strategist Lyn Alden expects Bitcoin to outperform gold over the next two to three years following gold’s recent rally in the past few months.
This article does not contain investment advice or recommendations. Every investment and trading move involves risk, and readers should conduct their own research when making a decision. While we strive to provide accurate and timely information, Cointelegraph does not guarantee the accuracy, completeness, or reliability of any information in this article. This article may contain forward-looking statements that are subject to risks and uncertainties. Cointelegraph will not be liable for any loss or damage arising from your reliance on this information.
XRP price is holding the $1.30 support level, but order flow data shows sellers are still dominating market activity, keeping short-term upside limited.
Summary
XRP trades around $1.36 after rising 1.3% in the past 24 hours, though the token remains about 62% below its 2025 peak.
Order flow data shows aggressive sell orders outweighing buys, indicating continued selling pressure.
If $1.30 support holds, XRP could attempt a move toward $1.40 psychological level, while a breakdown may open the path to $1.20.
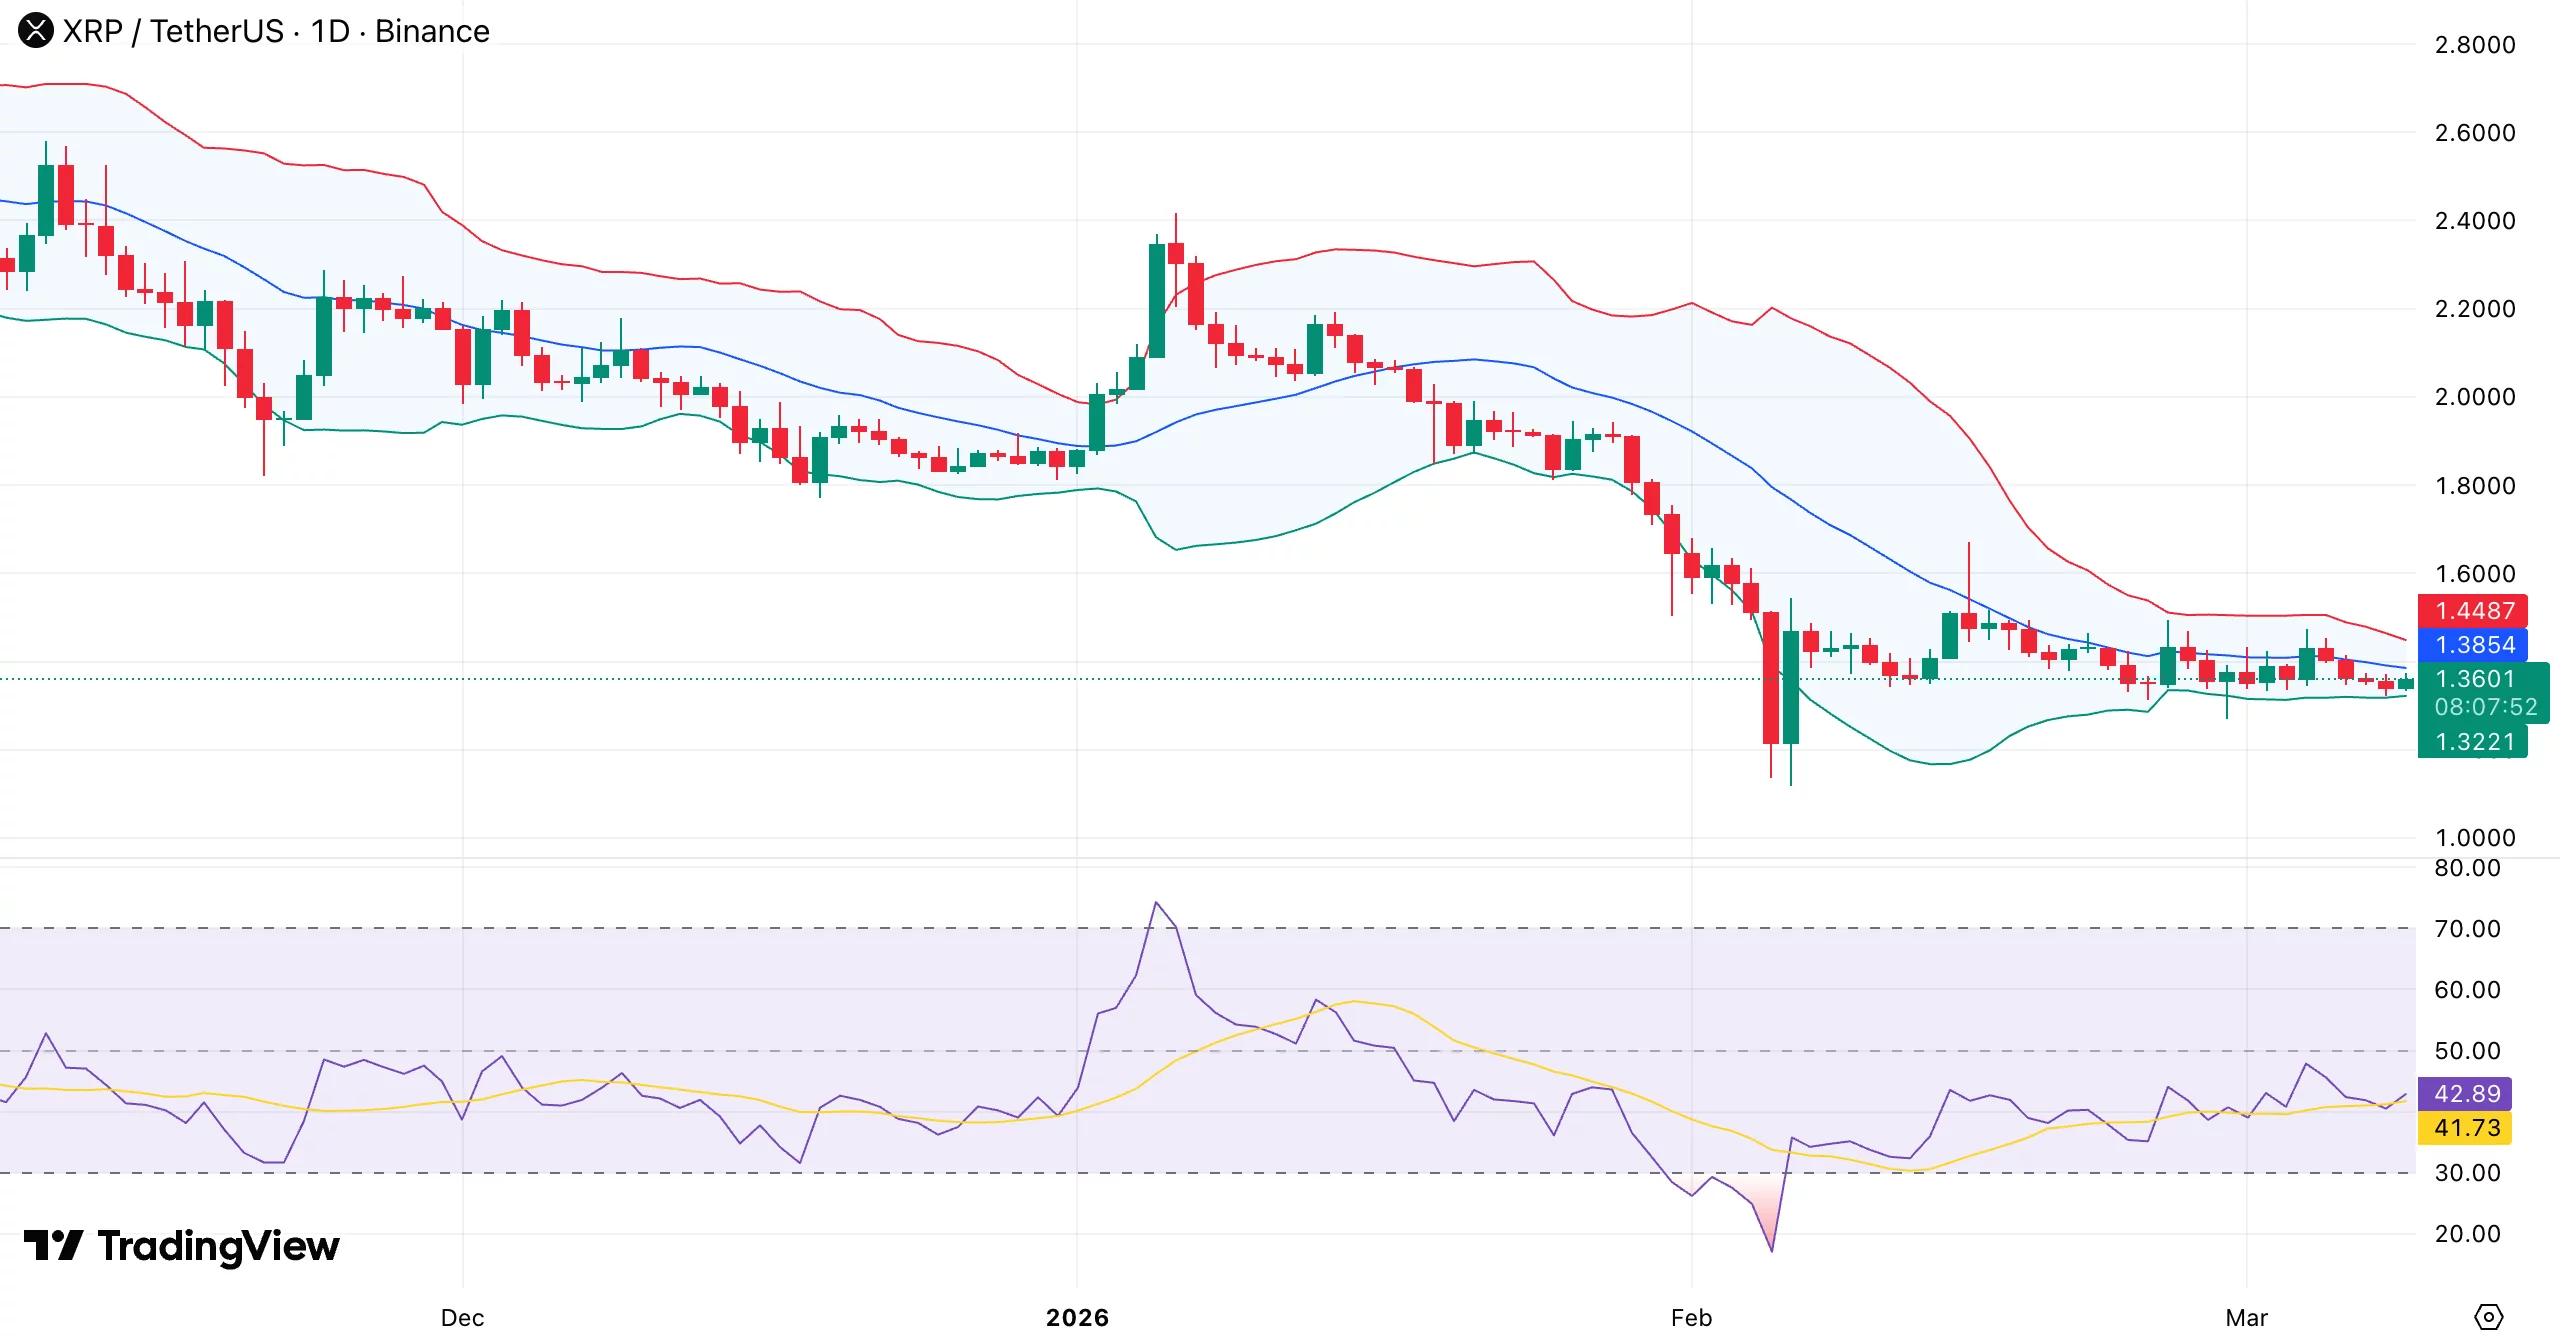
XRP (XRP) was trading at $1.36 at press time, gaining 1.3% in the past 24 hours as the token attempted to stabilize after weeks of selling pressure.
Over the last seven days, XRP moved between $1.34 and $1.46. Even with the recent consolidation, the token remains far below previous highs and is currently about 62% below its July 2025 all-time high of $3.65.
Advertisement
Market activity has picked up. 24-hour trading volume reached $2.55 billion, marking a 67.5% increase from the previous day.
Derivatives activity has also grown. Data from CoinGlass shows trading volume rising 63% to $3.54 billion, while open interest climbed 2.5% to $2.33 billion. The increase suggests traders are opening new positions as the market searches for direction.
Sellers dominate market orders
A March 9 report from CryptoQuant contributor PelinayPA shows that sellers currently control the aggressive side of the order flow.
The buy-to-sell liquidity ratio stands near 0.912, meaning market sell orders are exceeding market buy orders. In simple terms, traders are using market orders to sell more often than to buy.
Advertisement
XRP has been trading close to $1.34 during this time, with little upward momentum. When the ratio dips below 1, market orders are not pushing the price higher.
Although there are still buyers in the market, the majority seem to be making limit orders instead of aggressive market buys. As a result, buyers supply liquidity and sellers remove it through market orders.
As long as this imbalance continues, selling pressure may persist. The data suggests that the current market structure is still leaning toward the sell side.
Advertisement
XRP price technical analysis
A short-term support area has formed between $1.30 and $1.33 on the daily chart. Price has stabilized around this zone several times, and recent candles show sideways movement just above it, which suggests buyers are defending the level.
XRP daily chart. Credit: crypto.news
At the same time, XRP is trading below the Bollinger Bands mid-line, which is in line with the 20-day moving average. When price trades under this level, the short-term trend is usually considered bearish.
Earlier in February, XRP touched the lower Bollinger Band before bouncing higher. Since that drop, volatility has slowly decreased and price has moved sideways.
Momentum is still weak. The relative strength index sits around 42–43, which is still below the neutral 50 level. The indicator has recovered from near-oversold levels seen earlier in February, but buying momentum is still limited.
The larger structure also shows pressure. Since early January, the chart has produced a series of lower highs, meaning the wider downtrend has not yet changed. The current sideways movement appears to be a pause within that trend.
Advertisement
Meanwhile, Bollinger Bands are tightening, which often comes before a stronger price move. If XRP continues to hold above $1.30, buyers may try to push the price toward the $1.38–$1.40 area, where the Bollinger mid-line sits.
A move above that zone, together with RSI approaching 50, would improve the short-term outlook. However, if $1.30 support breaks, XRP could slide toward $1.20. Continued weakness in RSI below the neutral level would keep the bearish structure in place for now.
US investors drove most crypto fund activity, and added $646 million last week.
Investment products tied to digital assets posted net inflows of $619 million last week, which, according to CoinShares, indicates that the initial response to the Iran crisis was favorable for the sector. Inflows of $1.44 billion were registered during the first three days of the week, reflecting early optimism among investors.
Sentiment weakened later as $829 million left the market on Thursday and Friday. The withdrawals came even as payroll figures were much weaker than anticipated, a development that might normally support risk assets.
Advertisement
Geopolitical Tensions Shape Weekly Gain
However, higher oil prices countered any potential decline in inflation that could have resulted from the weak labor data. Despite the late-week outflows, the overall weekly flows suggest investor sentiment toward digital asset investment products remained broadly positive during ongoing geopolitical uncertainty.
According to the latest edition of CoinShares’ Digital Asset Fund Flows Weekly Report, Bitcoin attracted the largest share of investor allocations last week, as $521 million was directed into related investment products. However, sentiment toward the asset remained divided, as short-Bitcoin products also recorded $11.4 million in new capital. Among altcoins, Ethereum led activity with $88.5 million, followed by Solana with $14.6 million.
Smaller additions were recorded for Uniswap and Chainlink, each receiving $1.4 million. Multi-asset products raked in $5.4 million during the same period. On the other hand, XRP moved in the opposite direction and saw withdrawals of $30.3 million from investment products tied to the token.
Most of the positive investor activity came from the United States, where digital asset products amassed $646 million. Other regions showed weaker sentiment. For instance, Europe recorded $23.8 million leaving the market, while Asia and Canada saw outflows of $2.2 million and $3.6 million, respectively.
Advertisement
Traders Brace for Volatility
Bitcoin remained relatively resilient even as rising tensions involving Iran pushed oil prices above $115 and triggered broader market stress. Fears of significant supply disruptions through the Strait of Hormuz and wider instability in the Middle East pressured global equities and pushed the VIX above 29.
You may also like:
Despite this environment, QCP Capital said Bitcoin has held up better than many other risk assets, a pattern the crypto market has not seen for some time. Options market positioning also revealed that traders are less concerned about another sharp decline than during the initial shock last week.
While downside protection is still in place, particularly through short-dated options with strikes between $61,000 and $64,000, flows indicate expectations of continued volatility rather than a one-way decline.
SPECIAL OFFER (Exclusive)
Binance Free $600 (CryptoPotato Exclusive): Use this link to register a new account and receive $600 exclusive welcome offer on Binance (full details).
Advertisement
LIMITED OFFER for CryptoPotato readers at Bybit: Use this link to register and open a $500 FREE position on any coin!
Coinbase collaborates with Aon on blockchain-based insurance premium pilot using stablecoins.
Transactions settle nearly instantaneously across global networks using digital tokens.
Blockchain technology eliminates multiple intermediaries in payment processing.
Immutable ledger records enhance audit trails and financial reconciliation.
Growing corporate interest follows improved regulatory framework for digital assets.
Corporate finance continues embracing innovative payment technologies as leading institutions experiment with distributed ledger solutions. Coinbase Global, Inc. stock closed at $194.71, declining 1.26%, as the cryptocurrency exchange engaged in a blockchain insurance payment trial. Insurance brokerage giant Aon partnered with Paxos to facilitate premium settlements through dollar-backed digital tokens.
This experiment showcased the potential for stablecoins to accelerate corporate payment workflows while minimizing delays inherent in conventional banking infrastructure. The trial leveraged blockchain technology that creates transparent transaction records and completes fund transfers in minutes rather than multiple business days. This development illustrates how tokenized currency could progressively merge with mainstream financial frameworks and insurance workflows.
Conventional insurance premium processing typically involves multiple banking intermediaries before final settlement, particularly for international transactions among enterprise clients. Distributed ledger payments streamline this workflow by enabling peer-to-peer value transfer without protracted clearing procedures. The experiment offered valuable operational data on modernizing premium payment infrastructure through digital assets.
USD Coin on Ethereum Network Processes Corporate Insurance Payment
The trial employed USD Coin to execute an insurance premium transaction via the Ethereum blockchain. Coinbase facilitated the payment on behalf of an Aon customer while Paxos contributed to the overall testing framework. This transaction examined how distributed ledger technology manages corporate insurance financial obligations.
Stablecoins preserve value through fiat currency backing, providing stable pricing for substantial institutional transactions. Furthermore, blockchain settlement generates permanent payment records, streamlining audit and reconciliation workflows for corporate finance teams. Organizations can therefore determine whether distributed ledger settlement minimizes operational overhead in insurance payment processing.
Advertisement
The trial also mirrored increasing regulatory definition around stablecoins within American financial markets. Enactment of the GENIUS Act established federal supervision requirements for token issuers and reserve disclosure standards. Major corporations now explore stablecoins within compliant regulatory parameters.
PayPal USD on Solana Network Demonstrates Alternative Blockchain Payment Path
An additional premium transaction utilized PayPal USD via the Solana blockchain as part of the identical pilot program. Paxos facilitated this payment while Aon executed the transfer within its insurance distribution infrastructure. This approach enabled performance comparison across different stablecoin ecosystems.
Stablecoin transactions deliver near-real-time settlement versus conventional banking networks that frequently require multiple days for international fund clearing. Distributed ledger systems provide transaction transparency, enabling organizations to monitor payments and verify settlement promptly. Enterprises can evaluate operational performance gains from tokenized payment systems.
Aon administers risk management and insurance solutions spanning over 120 nations while consulting on trillions in worldwide assets. The brokerage firm’s blockchain experiment therefore indicates expanding institutional appetite for distributed ledger payment infrastructure in corporate treasury functions. This pilot generates practical implementation insights that may influence future deployment strategies throughout insurance sectors and major financial organizations.


 Politics7 days ago
 Fashion3 days ago
 News Videos12 hours ago
 Crypto World9 hours ago
 Tech5 days ago

 Sports2 days ago
 Sports2 days ago
 Business6 days ago
 NewsBeat4 days ago
 Politics4 days ago
 Business1 day ago
 Entertainment3 days ago

 Tech10 hours ago
 Crypto World5 days ago
 Tech5 days ago
 Business4 hours ago