

Crypto World
Bitcoin Sub-$50K Spurs Five Key Takeaways Amid Gold Bear Market

Bitcoin began the week facing renewed macro headwinds as risk sentiment wavered and traders weighed the possibility of further downside in a pattern that resembles January’s bear flag. BTC traded around the mid-$60,000s after a weekend of outsized liquidations and a weekly close that fell short of reclaiming a crucial trend line, with the price hovering near $67,400 into the close and slipping below the 200-week exponential moving average (EMA) around $68,300. The setup comes as gold slips into bear-market territory and oil maintains a firm footing above $100 per barrel, underscoring a macro environment that remains conducive to volatility in risk assets.
Markets are integrating a mix of geopolitical risks, shifting Fed expectations, and on-chain signals. Several traders and analysts highlighted that Bitcoin’s current action echoes a bear-flag scenario seen earlier this year, with potential consequences if selling pressure resumes. In practical terms, a breakdown from the flag could open the door to new multiyear lows, while a short-lived upside would need to clear a sequence of resistance levels to change the narrative. Estimated targets remain contentious, but some observers point to a test of sub-$50,000 if the pattern plays out in earnest, while participants will look for a sustained push above the high-$70,000s to reframe the setup.
Key takeaways
- Bitcoin closed the week below the 200-week EMA (about $68,300), with price near $67,400, renewing bear-market risks for bulls.
- The current price action resembles January’s bear-flag breakdown, suggesting the next move could push BTC toward sub-$50k if momentum accelerates on a breakdown.
- Market dynamics were amplified by elevated liquidations—over $400 million in the last 24 hours—indicating persistent selling pressure and liquidity-linked risk appetite.
- Gold dropped into bear-market territory, trading around $4,100 per ounce, while oil sustained gains above $100, underscoring inflation and energy-security concerns in the macro backdrop.
- On-chain data show long-term holders capitulating, with the Bitcoin Long-Term Holder SOPR dipping to 0.64 in early March, suggesting widespread losses among patient investors even as some supply moved off exchanges.
Bitcoin’s technical crossroads: bear flags, ranges, and a potential squeeze
Trading activity over the weekend underscored a fragile setup as traders awaited fresh cues from traditional markets. Data from TradingView show BTC’s price dipping to near $67,400 into the weekly close, failing to sustain a move back above the 200-week EMA, which currently sits around $68,300. Previously, a weekly close above that line had been viewed as a bulls’ lifeline; the latest close shifts the balance toward the bears’ camp for now.
Analysts have repeatedly warned that the market could circle within a defined range for a period as macro tensions persist. In particular, a number of voices on social media pointed to the January bear-flag precedent, where a breakdown from a consolidation pattern led to a renewed downtrend. The prevailing read is that a break below the lower boundary of the range could accelerate declines, while a lackluster upside would keep the door open to further weakness until macro catalysts shift decisively.
Strategists highlighted a nuanced near-term path. One analyst noted the potential rotation to around $65,000 should the week begin with renewed selling pressure, but a brief push toward $70,000 could lure bulls if price action gains a foothold. A breakthrough above $71,000 would likely require a clean close into the $73,000–$74,000 zone to reassert a bullish tilt; otherwise, risk-reward remains skewed to the downside in the near term.
Liquidity dynamics also shaped expectations. As weekend liquidity thinned, traders observed that small orders could have outsized price effects in the thin books, amplifying moves and triggering stop-loss clusters or liquidations. A few market voices warned against interpreting weekend volatility as a trend signal, reminding participants that thinner markets tend to exaggerate short-term moves.
Across the community, a mix of sentiment and risk due to macro headlines kept traders vigilant. Some suggested the risk of a short-term squeeze exists if liquidity-driven pressure eases and offers a window for longs to step in, but a sustained shift above key levels would be necessary to flip the narrative.
Macro backdrop tightens: gold, oil, and the Iran risk premium
The broader macro environment added a heavyweight note to the Bitcoin picture. Gold, which had been trading at elevated levels, slid into bear-market territory, with XAU/USD dipping more than 20% from its all-time high and testing around $4,100 per ounce. The slide fed into the broader risk-off impulse in early sessions as market participants weighed the implications of higher real yields and inflation dynamics. In commentary cited by traders, some observers argued that a significant liquidity event among large participants could be at play, as price action in the gold market suggested stress beyond routine fluctuations.
The energy complex also played a central role. Oil prices remained resilient above the $100 barrier, reflecting ongoing concerns about supply security, particularly in light of tensions in the Middle East. European and Asian energy markets showed heightened sensitivity to headlines about flows through strategic corridors, with observers noting that energy-inflation linkages tend to feed into broader macro expectations. A veteran market briefing noted that even moderate changes in oil prices can meaningfully influence headline inflation readings, potentially affecting the tempo of monetary policy decisions in the quarters ahead.
Against this backdrop, market research outfits highlighted potential inflationary implications. The Market Mosaic, a regular briefing from Mosaic Asset Company, stressed that oil price moves can directly affect inflation metrics, with a $10 per barrel swing historically contributing meaningfully to shifts in inflation readings. While the notes did not predict a specific outcome, they underscored the sensitivity of risk assets to energy-price shocks amid a policy backdrop that remains cautious about rate-cut horizons.
Fed stance, volatility, and the options backdrop
On the policy front, the commitment to inflation progress remained central. In the aftermath of the most recent Federal Reserve gathering, Wall Street’s takeaway was that any policy loosening would hinge on demonstrable progress toward inflation targets. The accompanying narrative from market observers suggested that rate-cut expectations were being pushed further out, with some analysts pointing to the potential for rate hikes to reemerge in 2026 should inflation prove stickier than anticipated. The evolving odds were being tracked by the CME FedWatch tool, which reflected shifting probability curves as new data filtered in.
Beyond the Fed, traders also eyed the options market in a bid to gauge near-term liquidity flows. The Kobeissi Letter noted that last week’s expiration event—described as a substantial triple-witching session for U.S. stocks and ETFs—unleashed a significant amount of capital as large options positions expired. The implication, as described by The Kobeissi Letter, is that this could unleash fresh volatility into equities and by extension into correlated risk assets, including bitcoin, in the days that followed.
In this environment, the weekend volatility gave on-chain observers a useful reminder of how market structure interacts with price moves. CryptoQuant contributors observed that weekend sessions tend to see diminished institutional participation and ETF-driven demand, elevating the role of derivatives positioning and short-term liquidity. The takeaway from CryptoQuant’s QuickTake was clear: thinner order books amplify price sensitivity, and weekend action should not be misconstrued as a trend signal.
On-chain signals: capitulation among long-term holders
On-chain analytics painted a nuanced portrait of investor behavior. CryptoQuant’s analysis focused on the SOPR metric, which compares the price at which coins are moved on-chain to their previous cost basis. Investigators highlighted that Long-Term Holder (LTH) SOPR dropped to 0.64 in early March, a read indicating that LTHs were selling at a substantial loss relative to their cost basis. As one contributor described it, readings this far below 1.0 signal meaningful capitulation among patient holders, underscoring a period of fear in the market.
Despite the near-term pain for many LTHs, the broader signal remains ambiguous. The 30-day moving average of LTH-SOPR remained below 1, suggesting that while a portion of supply was exiting exchanges, other cohorts could be quietly absorbing supply and moving coins off-chain. Analysts characterized this as a possible distribution-accumulation dynamic at play, a classic hallmark of a market transitioning through a phase of capitulation while still containing pockets of absorption that could set the stage for a future regime shift.
Closing perspective: what to watch next
As Bitcoin navigates a week shadowed by macro risks, traders will be watching the confluence of technical levels, liquidity conditions, and on-chain signals. The immediate focal point remains a sustained move beyond the 200-week EMA and a clear exit from the prevailing range, which could determine whether the path of least resistance remains lower or if a credible bounce materializes. In parallel, the trajectories of gold and oil, influenced by geopolitical developments and inflation dynamics, will help frame risk sentiment across crypto markets. Finally, the evolving policy stance from the Federal Reserve and the behavior of large derivatives positions—along with on-chain capitulation versus accumulation signals—could shape volatility in the days ahead as markets price a longer horizon for rate moves and macro resilience.

Crypto World
Ripple CEO Has “Someting Special” for Holders: “We think that’s good for the community”

Ripple CEO Brad Garlinghouse just made an interesting statement. Speaking on the Crypto In America podcast with journalist Eleanor Terrett, Garlinghouse hinted that XRP holders could receive “something special” tied to a potential Ripple IPO.
Brad just casually mentioned doing "something special" for xrp holders if ripple goes public — Xaif Crypto (@Xaif_Crypto) May 7, 2026

bro said it himself. hold accordingly. ripple:native pic.twitter.com/E1vSUBROdM
However, Garlinghouse was direct about Ripple’s IPO timeline, calling it “not a priority”. He cited underperformance from crypto-related public listings, pointing to BitGo, Gemini, and Kraken’s delayed IPO plans as evidence that the public market environment isn’t favorable.
Staying private, he joked, also lets him speak without lawyers breathing down his neck. But when Terrett pressed on whether XRP holders specifically benefit from a future IPO, Garlinghouse didn’t deflect; he leaned in, suggesting additional benefits beyond ecosystem growth are possible. “We think that’s good for the community,” he said.
Discover: The best pre-launch token sales
Ripple Special and XRP Price
XRP just broke the $1.40 support level after failing to breach the $1.45 resistance. The same zone that it couldn’t sustain since February. The current compression pattern follows a high-volume breakout from a multi-month downtrend, with support anchored around the $1.35 range.
Resistance layers stack at $1.40 first, then $1.45 as the zone it has been fighting to break. Standard Chartered’s 2026 model sits at $2.80, while traders are watching whale accumulation. It has been known that whale wallets have added 1.2 billion XRP in Q1 2026, the highest quarterly total since 2023.
Institutional interest is clearly building, but the CLARITY Act deadline is the swing factor. Garlinghouse called the next two weeks critical at Consensus Miami.
Discover: The best crypto to diversify your portfolio with
Bitcoin Hyper Targets Early-Mover Upside as XRP Tests Key Resistance
XRP’s bull case is compelling, but at a $1.39 entry, the upside multiple is capped by an already substantial market cap. Traders chasing 10x-plus returns are increasingly scanning earlier-stage infrastructure plays, which is where Bitcoin Hyper enters the picture.
Bitcoin’s ecosystem narrative is accelerating, and Bitcoin Hyper is positioning directly inside it. The project is the first Bitcoin Layer 2 with Solana Virtual Machine (SVM) integration. The protocol would have a faster performance than Solana itself, combined with Bitcoin’s security layer.
The presale is approaching $33 million at a current token price of just $0.0136, with 35% APY staking rewards available as “something special” for early holders. Features include a decentralized canonical bridge for BTC transfers, sub-second finality, and low-cost smart contract execution that Bitcoin’s base layer simply cannot offer.
The post Ripple CEO Has “Someting Special” for Holders: “We think that’s good for the community” appeared first on Cryptonews.
Institutional capital is flowing back into digital assets, but this cycle looks very different from the last one.
Prediction markets are beginning to attract serious attention from Wall Street, Bitcoin exchange-traded funds (ETFs) are once again seeing large inflows and venture giant a16z is loading up another multibillion-dollar crypto war chest. Meanwhile, traditional banks are quietly accelerating their push into tokenized finance infrastructure.
Taken together, this week’s Crypto Biz points to a broader shift underway across the industry. Crypto companies are no longer just chasing retail traders — they’re increasingly building products for asset managers, banks, hedge funds and institutional investors looking for regulated ways to access digital assets.
Prediction markets court institutional capital
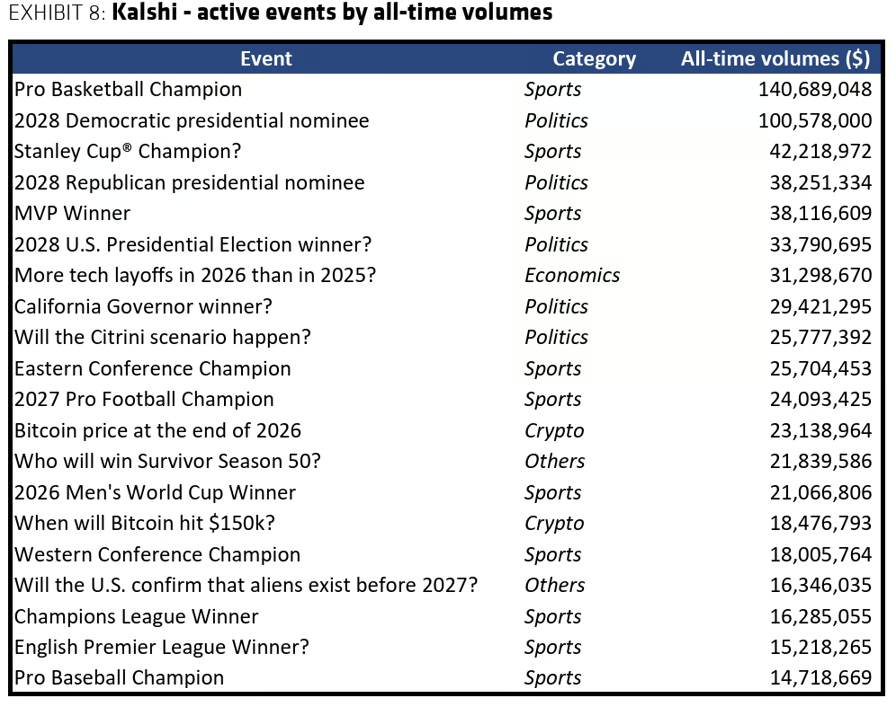
Prediction markets are beginning to attract institutional interest after Kalshi executed what analysts at Bernstein described as the sector’s first bespoke institutional block trade. The transaction involved a custom contract tied to California carbon allowance auctions and was facilitated with liquidity support from Jump Trading.
In a recent note to clients, Bernstein analysts said the trade marks an important step in the evolution of prediction markets from primarily retail-driven speculation into a more mature financial product category. Institutional investors are increasingly exploring event contracts tied to macroeconomic policy, elections and geopolitical developments as hedging tools.
The report also highlighted how regulated infrastructure is becoming a bigger focus for the sector. Kalshi operates under regulatory oversight in the United States, while decentralized rivals have largely grown through crypto-native platforms outside traditional financial rails. Bernstein believes broader institutional participation could eventually push prediction market volumes into the trillions of dollars.

Kalshi’s largest active event contracts. Source: Bernstein
Bitcoin ETFs see $1 billion in inflows as BTC retakes $80,000
US spot Bitcoin ETFs recorded nearly $1 billion in inflows as BTC climbed back above the $80,000 mark, highlighting renewed institutional demand for crypto exposure.
The inflows marked one of the strongest single-day performances for the ETF sector in recent months and coincided with broader strength across digital asset markets, according to SoSoValue data.
Analysts believe the ETF demand reflects improving investor sentiment and continued accumulation from institutional buyers using regulated investment products to gain Bitcoin exposure. The latest inflows build on an impressive April, when Bitcoin ETFs pulled in $1.97 billion.

Bitcoin ETF inflows accelerated after BTC reached $80,000. Source: SoSoValue
A16z crypto raises $2 billion for next wave of crypto funding
Andreessen Horowitz’s crypto venture arm, a16z crypto, has raised $2 billion for a new crypto-focused investment fund, marking one of the largest venture capital commitments to the sector in years.
The fund will target crypto startups spanning blockchain infrastructure, Web3 applications and decentralized finance. It comes as venture activity begins showing signs of recovery after a prolonged slowdown across digital asset markets. While crypto funding remains well below 2021 levels, venture capital continues to invest in early-stage companies building core industry infrastructure.
A16z has remained one of crypto’s most influential venture investors through the market downturn, backing projects across gaming, stablecoins, developer tooling and decentralized networks.

Source: a16z crypto
Tennessee bankers select Stablecore for digital asset services
The Tennessee Bankers Association has selected Stablecore as its preferred digital asset infrastructure provider, opening the door for roughly 175 member banks to access crypto-related banking services.
The partnership is focused on helping financial institutions integrate stablecoins, tokenized deposits and other blockchain-based payment tools into their operations.
Stablecore provides backend infrastructure that allows banks to offer digital asset services without building their own crypto technology stack. The company said its platform supports tokenized assets, stablecoin functionality and compliance integrations for regulated financial institutions.
The agreement reflects growing interest among regional and community banks in digital asset infrastructure as traditional finance moves deeper into blockchain payments and tokenization.
Crypto Biz is your weekly pulse on the business behind blockchain and crypto, delivered directly to your inbox every Thursday.

TLDR:
- SEC Chair Paul Atkins said crypto markets may need updated securities rules built for blockchain systems.
- The SEC is reviewing exchange definitions to determine how on-chain trading platforms should be regulated.
- Broker and dealer rules may be revised to address wallets, software interfaces, and DeFi platforms.
- Crypto vaults generating yield are under review for possible securities and adviser law oversight.
SEC crypto regulation is moving toward structural reform after Chair Paul Atkins outlined plans to review outdated securities rules.
The proposal focuses on adapting financial regulations to fit blockchain-based trading systems, settlement models, and crypto yield products.
SEC Reviews Exchange and Broker Rules for On-chain Markets
SEC Chair Paul Atkins signaled a major policy review for crypto markets during remarks at an industry event. He said the agency is considering whether long-standing securities rules still fit blockchain infrastructure.
The review centers on how the SEC classifies exchanges, brokers, dealers, and clearing agencies in decentralized finance. Atkins noted that on-chain systems operate differently from traditional financial institutions built around multiple intermediaries.
In legacy markets, brokers handle orders while exchanges match trades. Clearing agencies then manage settlement risks before assets move between parties. Blockchain systems compress these functions into automated protocols.
A decentralized exchange can execute swaps, route liquidity, manage collateral, and settle trades within seconds. Because of this architecture, regulators face increasing pressure to modernize rulebooks created for older financial models.
Eleanor Terrett took on X, where she noted that the SEC may launch notice-and-comment rulemaking around exchange definitions. This process allows developers, investors, and market operators to submit formal feedback before rules are finalized.
The move is notable because crypto firms have repeatedly criticized enforcement-driven oversight. Instead of learning compliance expectations through lawsuits, the market may now receive a clearer regulatory framework.
Atkins also addressed broker and dealer definitions as crypto interfaces become more software-driven. Wallet applications and front-end platforms often facilitate transactions without taking custody of assets.
This creates uncertainty about whether software operators should be subject to broker-dealer requirements. The SEC is now studying whether exemptive rulemaking could offer practical flexibility.
Blockchain Settlement and Crypto Vault Oversight Gain Focus
Atkins dedicated attention to clearing systems, which remain central to securities markets. Traditional clearinghouses exist because stock trades do not settle instantly.
Between trade execution and settlement, counterparties face the risk of non-delivery. Clearing agencies absorb this risk and maintain market stability.
Blockchain networks reduce this friction through near-instant settlement. Smart contracts can verify collateral, automate liquidations, and complete transfers programmatically.
Atkins questioned whether traditional clearing frameworks remain necessary for systems with atomic settlement. This review could influence the future design of tokenized securities platforms in the United States.
A separate part of the speech focused on crypto vaults that generate on-chain yield. These products often combine lending, staking, and treasury strategies into a single structure.
The SEC is assessing how such products fit under the Securities Act and Investment Advisers Act. Regulators appear focused on determining where investor protections are required.
Crypto yield platforms have expanded rapidly, yet legal classifications remain unclear. Atkins’ remarks suggest the SEC wants more tailored rules for these products.
Overall, SEC crypto regulation appears to be shifting from enforcement-first tactics toward infrastructure-specific policymaking. While no final rules were announced, the agency is now openly examining whether blockchain markets require updated legal architecture.

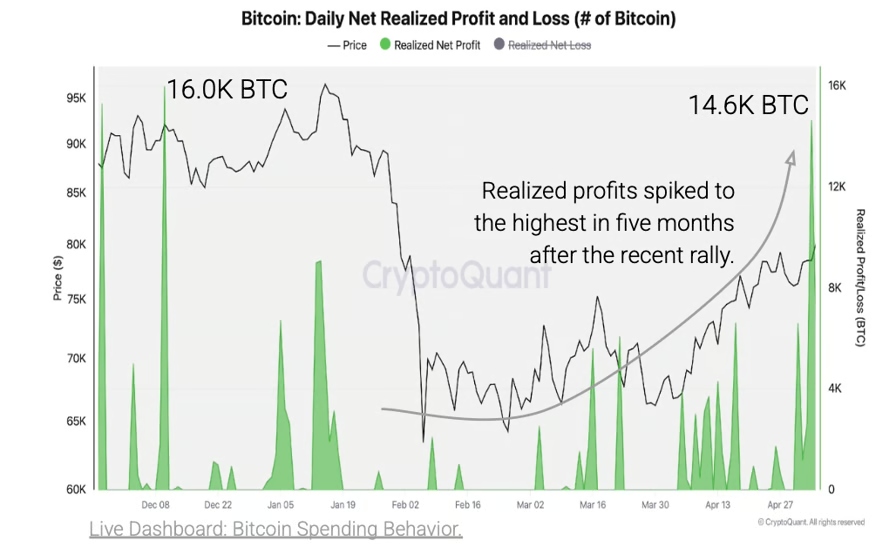
Bitcoin profit-taking could accelerate as BTC prices climb to three-month highs and investors begin locking in gains, according to Julio Moreno, head of research at onchain analytics platform CryptoQuant.
Holders realized 14,600 BTC in profits on Monday, or $1.1 billion, following Bitcoin’s April rally, Moreno said, adding that this is the “highest” single day of profit-taking since Dec. 10, when BTC was trading above $90,000.

Bitcoin holders’ realized profits spike after the April rally. Source: CryptoQuant
The Short-Term Holder Spent Output Profit Ratio (STH-SOPR), an onchain metric that gauges profit-taking by wallets that have held BTC for less than 155 days, also rose above 1, a level that indicates “clear profit-taking territory,” he added. He said:
“Bitcoin holders are realizing more than 20,000 BTC in net profits on a 30-day rolling basis, the first positive reading since December 22, 2025, following a period of heavy net losses in February and March that reached as deep as 398,000 BTC.”
Spikes in realized profit levels during crypto bear markets typically signal local price tops or sideways price action, Moreno said, adding that despite the rise in realized profits, demand has not caught up, and BTC remains in a bear market.

The Bitcoin Short-Term Holder Spent Output Profit Ratio signals that short-term holders are realizing profits. Source: CryptoQuant
Related: Bitcoin ‘supercycle’ or bear-market rally? BTC breaking $81K has traders at odds
Bitcoin ETF inflows remain strong, while analysts are divided on market health
Inflows into Bitcoin exchange-traded funds (ETFs) remain strong, with four days of positive inflows this week, according to Farside data.
ETF inflows for the week surged past $1 billion, before an outflow of $268.5 million on Friday, Farside’s data shows.
Analysts remain divided about whether BTC has bottomed out or whether the ongoing bear market will deepen.
Michael Terpin, an early Bitcoin investor, told Cointelegraph that BTC could bottom out at $57,000 in October 2026. The forecast is based on “historic” price patterns in which BTC hits its cycle low about one year after the cycle top, Terpin said.
There is a “chance” that Bitcoin might reclaim the $100,000 price level in 2026, but the odds are “unlikely,” Terpin told Cointelegraph.
Magazine: Bitcoin will not hit $1M by 2030, says veteran trader Peter Brandt
Bitcoin traded near $79,000 on Friday, as buyers stepped in on pullbacks toward the round figure and nudged prices back toward the $80,000 zone. The immediate question for traders is whether BTC can clear the overhead at around $84,000 and extend the current upmove, or if renewed selling pressure will cap the rally once more. The day’s readings come as a mosaic of signals from price momentum, on-chain flows, and notable market commentators, leaving traders weighing multiple interpretations of the short-term trajectory.
CryptoQuant analyst IT Tech weighed in on the chart dynamics, arguing that a bottom would only be confirmed if BTC rallies and sustains above $88,880. Until that level proves itself, the $85,000 to $88,000 area could remain a zone where buyers take profits and sellers step back in. Meanwhile, John Bollinger, creator of the Bollinger Bands, signaled a bullish turn in BTC’s trend in a recent post on X, suggesting the model’s readings point toward upside momentum and that positions have shifted in favor of the bulls.
Adding a different lens, Bitcoin exchange-traded funds (ETFs) registered $277.5 million in net outflows on Thursday, the first such move in May according to SoSoValue data. The retreat of funds from BTC-linked products hints that, even as fundamentals and some charts look constructive, a portion of investors are choosing to lock in profits near resistance rather than chase higher prices into the next leg.
Key takeaways
- Bitcoin remains near $79k with a critical test above $84k needed to sustain a broader uptrend toward $92k and beyond.
- A hold above $88,880 is seen by some analysts as a prerequisite to confirming a market bottom for BTC.
- On-chain ETF outflows in May suggest selective profit-taking even as the price action hints at potential upside in the near term.
- Ether and several major altcoins show mixed momentum, with several key levels flashing as potential breakout or breakdown points.
Bitcoin price outlook
From a technical vantage, BTC’s near-term direction hinges on the defense of the 20-day exponential moving average (EMA) around $77,929. A sturdy rebound from this level would imply renewed buying interest on every dip and could set the stage for a breakout above the $84,000 ceiling. If that breakout occurs and holds, the chart suggests the potential for a move toward $92,000, followed by a possible rise to around $97,924 as the next milestone on the upside.
Conversely, bears are likely to defend the $84,000 area. A break below $74,937 could open the door to the 50-day simple moving average near $73,448 and then the broader support line, potentially inviting a deeper pullback. In that scenario, traders would expect a period of consolidation before the market decides its next major directional move.
Ether price outlook
Ether (ETH) crossed into a softer phase after closing below the 20-day EMA near $2,304, a sign that profit-taking among traders may have cooled the immediate upside. The next meaningful support sits near the 50-day SMA around $2,225, with a bullish signal emerging if ETH can rebound off that level and maintain momentum.
The first hurdle for bulls is a break above $2,465, which would mark the initial step toward a resistance zone that could limit gains in the near term. Clearing that barrier could open the path to higher targets, potentially toward $3,050 if demand strengthens and price action stays constructive. Until such a breakout materializes, ETH could remain confined within its current range as bulls and bears duel near the midline.
Other marquee movers and their levels
BNB, XRP, SOL, DOGE, HYPE, ADA, ZEC, and BCH all present a mosaic of setups as traders assess whether they can sustain a trend shift or remain oscillating within established ranges.
BNB: The Binance Coin chart shows a retreat toward moving averages, suggesting that buyers are waiting for a clearer setup. A rebound off these averages could push BNB toward the $687 target, with overhead resistance expected between $570 and $687. A decisive close above $687 would inject bullish momentum toward $730 and potentially $790, though sellers are likely to challenge the higher hurdle around $790.
XRP: XRP continues to hover near its moving averages, indicating an equilibrium between buyers and sellers. A break below $1.27 could push the pair back into a descending channel, while a sustained push above the downtrend line and roughly $1.61 could clear the way to $2.
Solana: SOL is facing selling pressure near $90.73, though bulls have not conceded much ground. A push above $90.73 could drive SOL toward $98, with a potential extension to $117 if momentum accumulates. If prices fail to sustain above the moving averages, the pair could stay in a tighter range; a break below $82.65 could open a path toward $76.
Dogecoin: DOGE pulled back from the $0.12 resistance as traders took profits. The immediate line in the sand is the 20-day EMA near $0.10. A bounce from this level could see DOGE test $0.12 again and then target $0.14–$0.16. A break below the EMA could keep the currency in the lower $0.09–$0.12 range for a spell.
Hyperliquid (HYPE): The HYPE chart shaved off gains after failing to sustain a rally in the $43.76–$45.77 zone, with the price retreating to the 20-day EMA around $41.69. A rebound could re-energize bulls toward $50, while a drop below the 50-day SMA at about $40.29 could pull the price toward $34.45.
Cardano (ADA): ADA remains range-bound in a broad $0.22–$0.31 corridor. The 20-day EMA around $0.25 has started to tilt higher, and the RSI sits modestly in positive territory, suggesting a slight edge for bulls. A move above the moving averages could push ADA toward $0.30 and, eventually, to the $0.31 resistance. A break below the averages would tilt the balance toward the $0.22 support.
Zcash (ZEC): ZEC breached above $560 but stalled at $607. A shallow pullback is a constructive sign, indicating bulls aren’t in a rush to exit. A move above $607 could target $750, while supports sit at $496 (38.2% retracement) and $462 (50%), with a close below $428 (61.8% retracement) risking a deeper pullback.
Bitcoin Cash (BCH): BCH reversed from $486, keeping the pair largely within a range. With the 20-day EMA near $450 and the immediate band roughly $419–$486, a close above $486 could spark a move to $520, whereas a close below $419 might open the door to a slide toward $375.
What could shift the next leg?
Market participants are watching how BTC behaves around the $84,000 threshold and whether altcoins can sustain breakouts beyond their critical levels. The balance of on-chain flows, ETF behavior, and macro risk appetite will likely shape the near-term trajectory. If BTC can convincingly clear $84,000 and hold above key moving averages, the broader market could see a renewed cycle of risk-on positioning. If not, the current range-bound conditions may persist into the next phase of the market cycle.
Readers should stay attentive to potential catalysts beyond chart patterns—the evolving regulatory landscape, institutional interest, and flows into or out of crypto-linked funds—each of which can tilt sentiment and liquidity in the days ahead. In the near term, the market’s next move may hinge on whether BTC sustains momentum above key resistance and whether altcoins can muster the breadth to follow suit beyond their own technical thresholds.
As the week unfolds, the question remains: will the market manage to extend the nascent upside, or will profit-taking reassert itself, keeping prices tethered as traders await clearer signals?
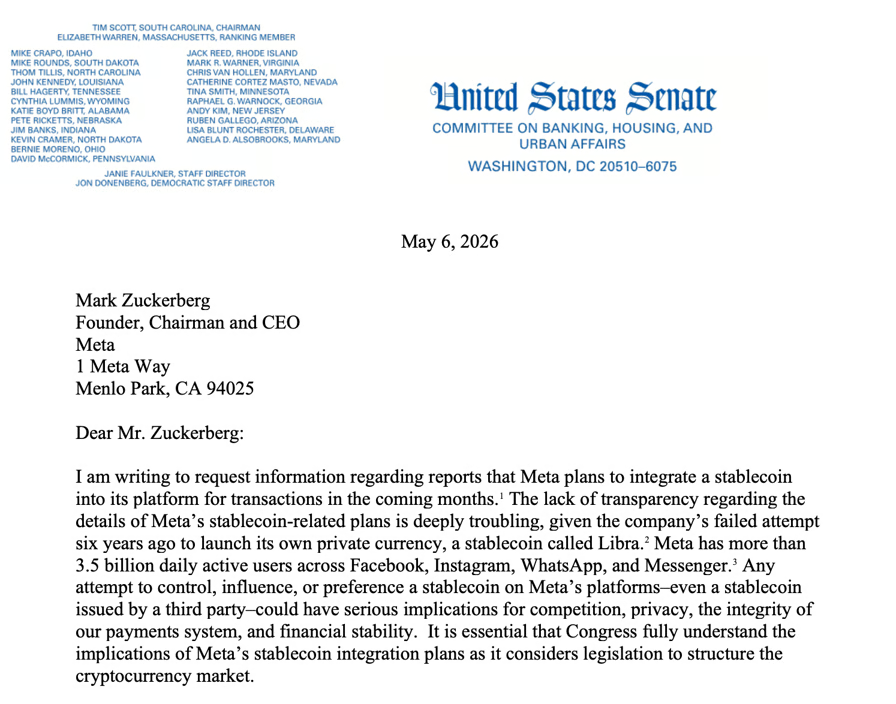
Massachusetts Senator Elizabeth Warren called on Meta CEO Mark Zuckerberg to answer questions about the company’s stablecoin integration in 2026, signaling concerns about guardrails.
In a Wednesday letter to Zuckerberg, Warren said Meta’s lack of transparency regarding its stablecoin was “deeply troubling,” given the company’s previous plans to roll out Libra, a global stablecoin proposed in 2019 that was later rebranded to Diem.
The senator said Meta’s plans were necessary for Congress to understand, given the US government’s efforts to pass a digital asset market structure bill with implications for stablecoin issuers.
“It is critical that Meta be transparent with Congress and the public regarding its stablecoin-related plans,” said Warren. “Beyond the failure of its previous attempt to issue its own global private currency, the company has struggled to safely offer its existing products and services […] Any new products, especially related to payments and financial services, should be treated with skepticism.”

Source: US Senate Banking Committee
The senator asked the Meta CEO to provide details by May 20 on its “small and focused trial” for a stablecoin integration to the platform, including any planned launch date, third-party stablecoins that may be a part of the program and privacy guardrails it may have in place. Meta already rolled out stablecoin payouts in USDC (USDC) for select creators in the Philippines and Colombia in April.
Related: Mark Zuckerberg is building an AI agent to help run Meta
Warren sits on the Senate Banking Committee as ranking member, where she helps oversee financial agencies like the US Securities and Exchange Commission (SEC). The body is currently considering legislation to establish a comprehensive framework for digital assets in the US called the CLARITY Act, which has been stalled in the chamber for months.
Stablecoin yield compromise to advance market structure bill?
Last week, lawmakers in the Senate announced a deal between crypto and banking industry representatives that could allow the CLARITY Act to advance to a markup in the banking committee, and potentially a floor vote in the full chamber.
Although the compromise on stablecoin yield represented progress in advancing the legislation, some crypto advocates urged caution as lawmakers continue to debate other issues in the bill, including ethics and potential conflicts of interest.
Magazine: XRP ‘probably going to $12,’ Bitcoin ETFs add $1B: Market Moves

Traders work on the floor of the New York Stock Exchange during morning trading on May 4, 2026 in New York City.
Michael M. Santiago | Getty Images
The S&P 500 brushed off Thursday headlines about the U.S. and Iran trading blows in the Strait of Hormuz and continued marching higher in Friday trading, crossing 7,400 for the first time. Prediction market traders think there’s more fuel left in the tank.
While the benchmark is already up more than 16% from its March 30 lows, traders on Kalshi think the broad index has a 59% chance of breaching 8,000 this year. That’s an 8% gain from current trading levels, and the index only crossed 7,000 for the first time in January.
It’s not just traders on prediction markets getting more bullish. RBC hiked its 12-month-forward price target for the index to 7,900 in a Friday note. Head of U.S. equity strategy Lori Calvasina wrote that the average and median of the five models used by the bank to calculate its estimate is 8,100 — implying there may be even upside to her forecast.
Stocks have shrugged off what appears to be a prolonged closure of the Strait of Hormuz — a critical passageway for the global supply of crude oil — and a potential re-escalation of the U.S.-Iran war.
Investors instead have embraced an artificial intelligence buildout that appears to be firing on all cylinders. It’s boosting stocks of the companies involved, driving much of the earnings growth the market has been celebrating and pushing GDP higher through increased private investment.
“The AI tech trade has just become so powerful that it’s superseded anything else,” said Peter Boockvar, chief investment officer at OnePoint BFG Wealth Partners. He added that no one wants to miss out on a potential rally if the U.S. and Iran do finalize a peace agreement — even though stocks have rallied so much since the ceasefire announcement. “Momentum has a life of its own.”
Truist Wealth chief investment officer Keith Lerner said that the market’s sharp move higher needs to be put in the context of what happened before the war, when major U.S. indexes traded in a narrow range from late October until March. Current levels in comparison to levels the S&P first hit in October are closer to around 7% higher.

S&P 500 since Oct. 1, 2025.
Boockvar added that Iran remains a risk, despite the indexes not showing it. He said weakness in some consumer-facing names display that there is some isolated pain in the economy that could be a risk to the broader market.
Lerner agreed that Iran isn’t gone as a worry for the market, but the bar is high now for it to ruin the rally, and likely would have to mean oil prices breaching their highs from back in late March.
“It has to come back in a way that’s meaningful, otherwise people are just going to buy the market pretty quickly,” he said.
Disclosure: CNBC and Kalshi have a commercial relationship that includes customer acquisition and a minority investment.
Markets shift and headlines fade, but the core principles of building long-term wealth remain constant. Join us for our third CNBC Pro LIVE, where investors of all backgrounds – from financial professionals to everyday individuals – come together to cut through the noise and gain actionable strategies for smarter, more disciplined investing. No matter where you’re starting from, you’ll leave with clearer thinking, stronger strategies. Enter your email here to get a discount code


The US banking regulator has already approved similar charter applications for Coinbase, Ripple Labs, BitGo, Circle, Fidelity Digital Assets and Paxos.
Payward, the parent company of cryptocurrency exchange Kraken, announced that it had filed an application with the US Office of the Comptroller of the Currency (OCC) for a national trust company charter, following other digital asset companies.
In a Friday notice, Payward said that the OCC application, if approved, would result in the establishment of Payward National Trust Company, allowing it to “provide fiduciary custody and other services primarily for digital assets.” The application would make the Kraken parent one of a handful of crypto companies moving closer toward banking, following OCC approvals for Coinbase and others.
“A national trust company provides the certainty institutions require and establishes the infrastructure to build the next generation of custody,” said Kraken co-CEO Arjun Sethi. “This is not about being first; it is about getting the framework right so markets can scale with clarity, interoperability, and long-term vision for what clients will demand as these systems mature.”
The OCC, headed by US President Donald Trump’s nominee Jonathan Gould, approved similar charter applications for Ripple Labs, BitGo, Circle, Fidelity Digital Assets and Paxos in December. The agency has come under scrutiny for such approvals as it considers an application from World Liberty Financial, the crypto company co-founded by Trump and his sons.
Related: Kraken parent Payward closes Bitnomial deal to expand US crypto derivatives
According to Payward, the OCC application would build on its Special Purpose Depository Institution established in Wyoming through Kraken Financial. The company also holds a Federal Reserve master account, giving it access to the US payment services system.
Kraken still eyeing public offering after confidential filing
While the crypto exchange’s parent company has closed acquisition deals with Bitnominal and announced an agreement to buy Reap, Kraken could still be planning an initial public offering (IPO) in the US. Sethi said in May that the company was “about 80% ready” to go public by 2027 as the exchange announced a partnership with MoneyGram.
Magazine: XRP ‘probably going to $12,’ Bitcoin ETFs add $1B: Market Moves
Crypto wallet provider Exodus has launched XO Cash, a Solana-based stablecoin and software toolkit designed to let AI agents make payments and access services without directly controlling private keys.
According to Friday’s announcement, the system, developed with MoonPay, allows developers to create agent-linked wallets, assign spending limits and issue virtual debit cards tied to Visa payment rails.
XO Cash integrates with Exodus Pay and includes a software development kit that allows users to fund AI agent wallets using their Exodus Pay balances while maintaining custody of their private keys. Users can set transaction caps, merchant restrictions and daily spending limits for each agent wallet.
Exodus said AI agents using XO Cash can transact with Visa merchants through infrastructure provided by Monavate and MoonPay, with payments automatically converted into stablecoins such as USD Coin (USDC) and Tether (USDT) at checkout.
The company added that XO Cash transactions are fee-free and designed for high-frequency automated payments. The stablecoin and developer documentation went live through XOCash.com on Thursday.
Related: How AI became crypto’s favorite reason to cut staff
Crypto and payment companies prepare for AI-driven commerce
Infrastructure for autonomous AI agents to transact with stablecoins has become one of crypto’s biggest narratives in recent months.
In March, Anchorage Bank launched an “agentic banking” service designed to give AI agents access to traditional financial and crypto payment rails under preset spending and compliance controls.
Visa’s crypto division also introduced Visa CLI, a command-line tool designed to let AI agents make same-day payments without exposing API keys, while Stripe-backed Tempo launched a blockchain-based payments protocol for automated onchain transactions.
On Thursday, Amazon Web Services integrated Coinbase’s x402 payments protocol into Amazon Bedrock AgentCore, enabling AI agents to settle USDC payments on Base and Solana without directly handling private keys.
The shift toward AI-driven operations has coincided with layoffs and restructuring across parts of the crypto and payments sectors.
Coinbase announced it would cut about 14% of its workforce this week as it reorganizes around smaller AI-focused teams and increased automation, while payments company Block said in February it would reduce staff by roughly 40% as the company expanded its use of AI tools.

Source: Brian Armstrong
Magazine: AI-driven hacks could kill DeFi — unless projects act now

- GoBTC Pay is a protocol that lets consumers make native and instant payments on Bitcoin’s base layer.
- GoMining launches its own mining pool to prioritize GoBTC Pay transaction confirmation, targeting a 12-hour final on-chain settlement by the end of 2026.
- The launch marks a strategic expansion for GoMining, a platform with 5 million users. GoBTC Pay extends this ecosystem into everyday payments.
GoMining launches GoBTC Pay a Bitcoin payment protocol that delivers on what the 2008 whitepaper promised: peer-to-peer electronic payments. GoBTC Pay enables free and instant Bitcoin payments on the core Bitcoin layer. This makes it practical to use Bitcoin at the point of sale for everyday purchases. Payments are free for end-users and merchants pay a small acquiring fee that undercuts traditional card processing.
GoBTC Pay is designed as an open infrastructure. GoMining operates the reference implementation, but any wallet provider — from Ledger to Trust Wallet to MetaMask — can integrate the protocol to offer instant Bitcoin payments to their users.
Why this matters
Bitcoin is the dominant cryptocurrency with a market cap above $1.5 trillion. Over 150 public companies hold BTC on their balance sheets. Spot Bitcoin ETFs, which didn’t exist two years ago, now manage roughly $100 billion in assets across a dozen funds. The U.S. government holds approximately 328,000 BTC. But Bitcoin still can’t process a retail transaction quickly and reliably.
The Lightning Network, introduced in 2018 to solve this problem, took seven years to reach $1 billion in monthly volume and its average transaction of $223 mostly reflects exchange-to-exchange flows, not someone paying for groceries. In the US, about 22% of adults own Bitcoin, yet there are only 2,300 U.S. businesses that accept Bitcoin directly, and the gap between how many people own Bitcoin and how many places accept it is widening.
“The first line of the Bitcoin whitepaper describes a peer-to-peer electronic cash system. Bitcoin was designed to be money, not just an asset. That promise is still unfulfilled, and we intend to deliver on it,” said Mark Zalan, CEO of GoMining. “We already serve millions of users, and run data centers on three continents. All of this provides us a unique position to enable native Bitcoin payments with GoBTC Pay.”
Mining-powered confirmation
GoBTC Pay enables free and instant payments in Bitcoin, using GoMining’s own mining infrastructure to confirm the transactions. It uses a 2-of-3 multi-signature architecture shared between the user, GoMining, and a regulated third-party custodian.
GoMining serves 5 million users globally. The company has created a dedicated mining pool for processing GoBTC Pay transactions, aiming for a 12-hour on-chain settlement by the end of 2026. Where most payment companies depend on third-party pools for confirmation, GoMining mines the blocks itself.
The pool also serves GoMining’s “digital miners” — users who own tokenized hashrate through GoMining’s app. A portion of GoBTC Pay transaction fees flows back to these miners as additional BTC yield: consumers pay with BTC, merchants earn BTC, miners earn a share of payment fees, and GoMining’s pool processes the transactions.
Any wallet provider, whether hardware, software, or custodial, can connect to the GoBTC Pay network and enable instant Bitcoin payments for their users.
Bitcoin payments for Merchants
For merchants, GoBTC Pay is a Bitcoin-native acquiring network that undercuts every major card processor on cost. Its acquiring fee of 0.2% is substantially lower than traditional card processing, which range from 1.5% to 3.5% in the US. On a $100 sale, the merchant keeps $99.80.
GoMining distributes the entire fee back into the ecosystem: half goes to the miners who confirm transactions, and half goes to the wallet provider that initiated the payment. GoMining retains nothing on third-party transactions to incentivize wallet integrations and accelerate adoption.
Merchants can receive BTC directly to their own wallet, or use GoMining’s custodial merchant solution, which offers yield on their BTC balance — including during the settlement window — and an off-ramp to fiat. GoBTC Pay will ship with a dedicated PoS terminal, a web merchant dashboard, a developer SDK, and plugins for Shopify and WooCommerce in the coming months.
The launch coincides with GoMining’s major expansion in the United States. The company is building combined data centers for Bitcoin mining and AI workloads, with a target of securing 1 GW of compute capacity in 2026.
GoMining presented a live demo of GoBTC Pay at Consensus Miami 2026 (May 5–7, Miami Beach Convention Center).
About GoMining
GoMining is an all-in-one Bitcoin ecosystem that makes it simple and secure to mine, earn, and use Bitcoin every day. GoMining serves 5 million users and ranks among the top-10 Bitcoin miners by hashrate globally, with data centers in the U.S. and internationally. The company makes Bitcoin accessible through tokenized hashrate, daily BTC rewards, and an expanding suite of payment and earning products. For more information, please visit https://gomining.com/
The post GoMining Launches GoBTC Pay to Bring Native Instant Payments to Bitcoin appeared first on BeInCrypto.
Best tips and tricks to win in Gamble With Your Friends
ChatGPT now lets you nominate a Trusted Contact who gets alerted if your interaction with AI ‘indicates a serious safety concern’

Sir David Attenborough celebrated for ‘lifetime of extraordinary service’
Manchester United reach agreement with Casemiro over contract clause amid transfer speculation

US brings back mandatory military draft registration

Steven Gerrard disagrees with Gary Neville over ‘shock’ Chelsea and Arsenal claim | Football


-

 NewsBeat5 days ago
Channel 5 – All Creatures Great and Small series 7 new post
-
 Crypto World13 hours ago
HarrisX Poll Found 52% of Registered Voters Support the CLARITY Act
-

 Crypto World2 days ago
Upbit adds B3 Korean won pair as Base token gains Korea access
-

 Tech4 days ago
Image AI models now drive app growth, beating chatbot upgrades
-
 NewsBeat2 days ago
NCP car park operator enters administration putting 340 UK sites at risk of closure
-

 Entertainment7 days ago
Kylie Jenner Hit With Second Lawsuit From Ex-Housekeeper
-

 Sports7 days ago
Cavaliers vs. Raptors Game 6 live score, updates, highlights from 2026 NBA playoffs first-round series
-

 Entertainment7 days ago
Young and the Restless Next Week: Cane Arrested & Matt’s Deadly New Scheme!
-
Entertainment6 days ago
New Netflix Movies in May 2026 — My Top 3 Picks to Stream
-

 Entertainment6 days ago
Melissa Joan Hart and More Stars Attend 2026 Kentucky Derby
-
 Sports7 days ago
David Benavidez responds to team Canelo saying the fight will never happen
-
 Sports7 days ago
IPL 2026: ‘Love you darling’- Hardik Pandya’s reaction to MS Dhoni steals the show |Watch | Cricket News
-

 Sports6 days ago
Five killed in Texas plane crash identified as Amarillo pickleball players
-
Entertainment6 days ago
Anna Nicole Smith’s Daughter Attends 2026 Kentucky Derby
-
Crypto World6 days ago
Pi Network Mandates Protocol 23 Upgrade for All Mainnet Nodes Before May 15 Deadline
-

 Crypto World6 days ago
Bitcoin mining equities rise in 2026 as BTC lags behind
-

 Business6 days ago
Luka Doncic Injury Update: Doncic’s Hamstring Recovery Slows Lakers’ Hopes Against Thunder: Can He Run Yet?
-

 Business7 days ago
Can Victor Wembanyama Bring the NBA Ring to Spurs in 2026? Historic Playoff Run Fuels Title Dreams
-

 Sports7 days ago
Plane crash in Wimberley, Texas kills 5 pickleball players at tournament
-
Entertainment6 days ago
Venus Williams’ Best Met Gala Looks Over the Years
You must be logged in to post a comment Login