

Crypto World
Bitcoin up, Dubai real estate down since Iran war began
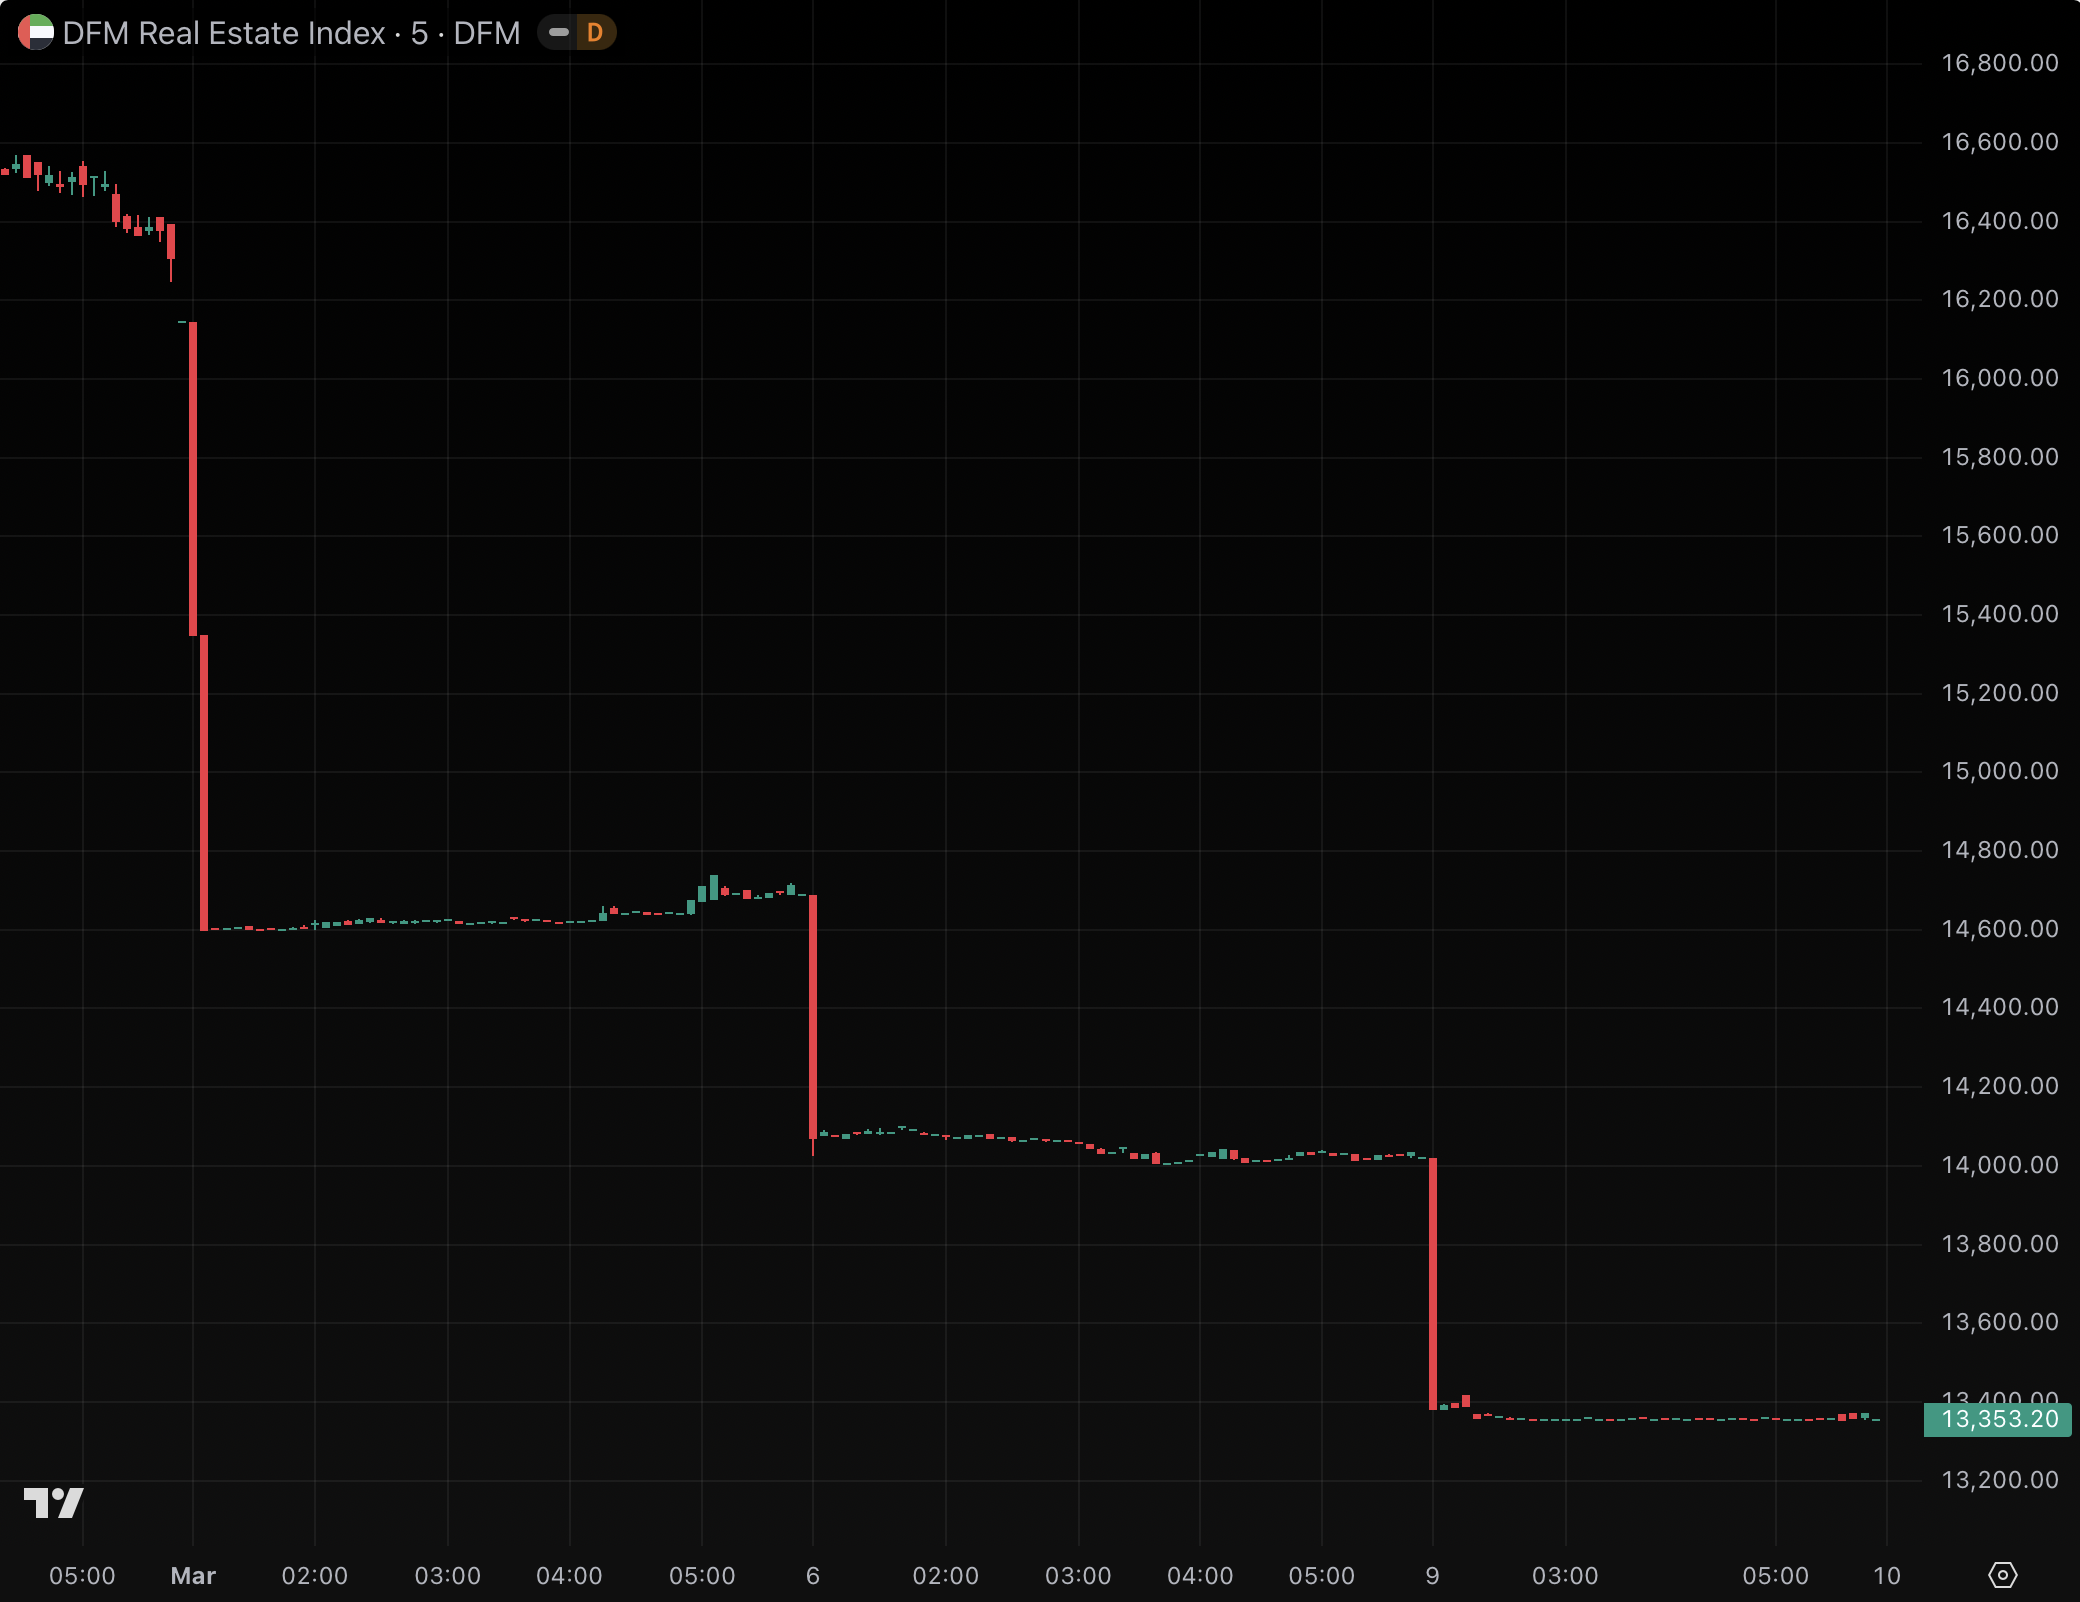
Since the onset of the Iran war, Dubai real estate has crashed worse than bitcoin (BTC).
The Dubai Financial Market (DFM) Real Estate Index closed trading at 13,353 on Monday, down 18.1% from 16,306 on February 27, the most recent trading session before Operation Epic Fury’s opening airstrikes at 1:15am New York time on February 28.
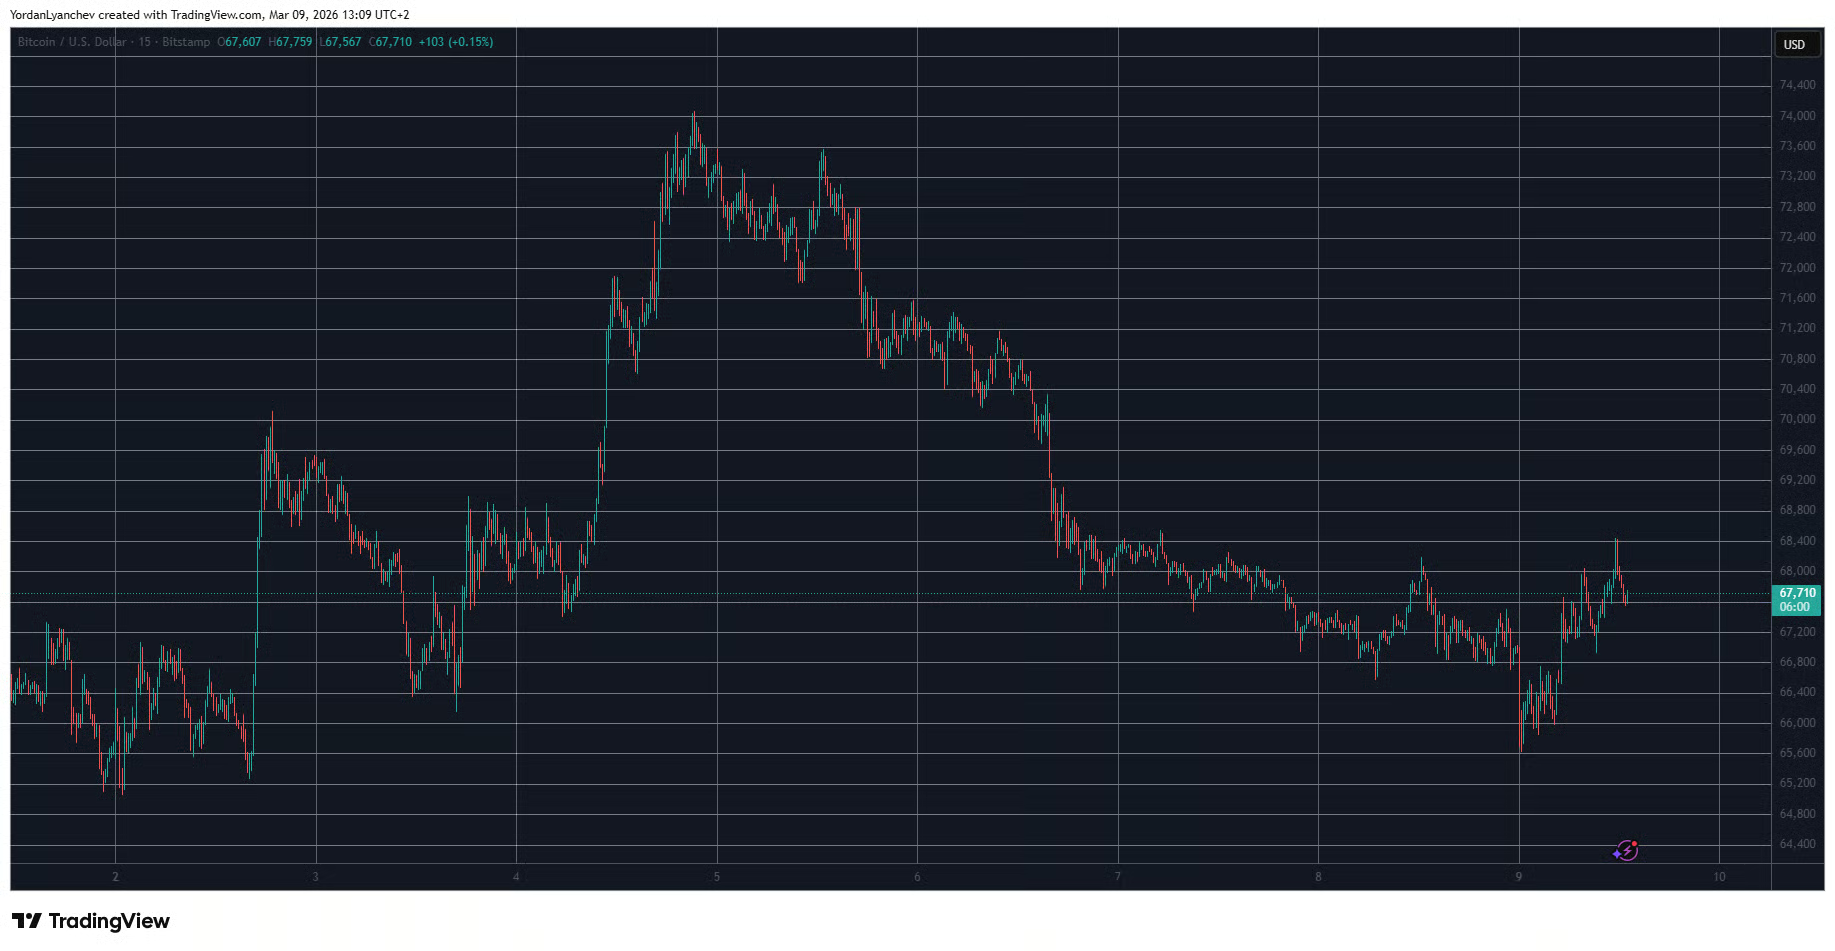
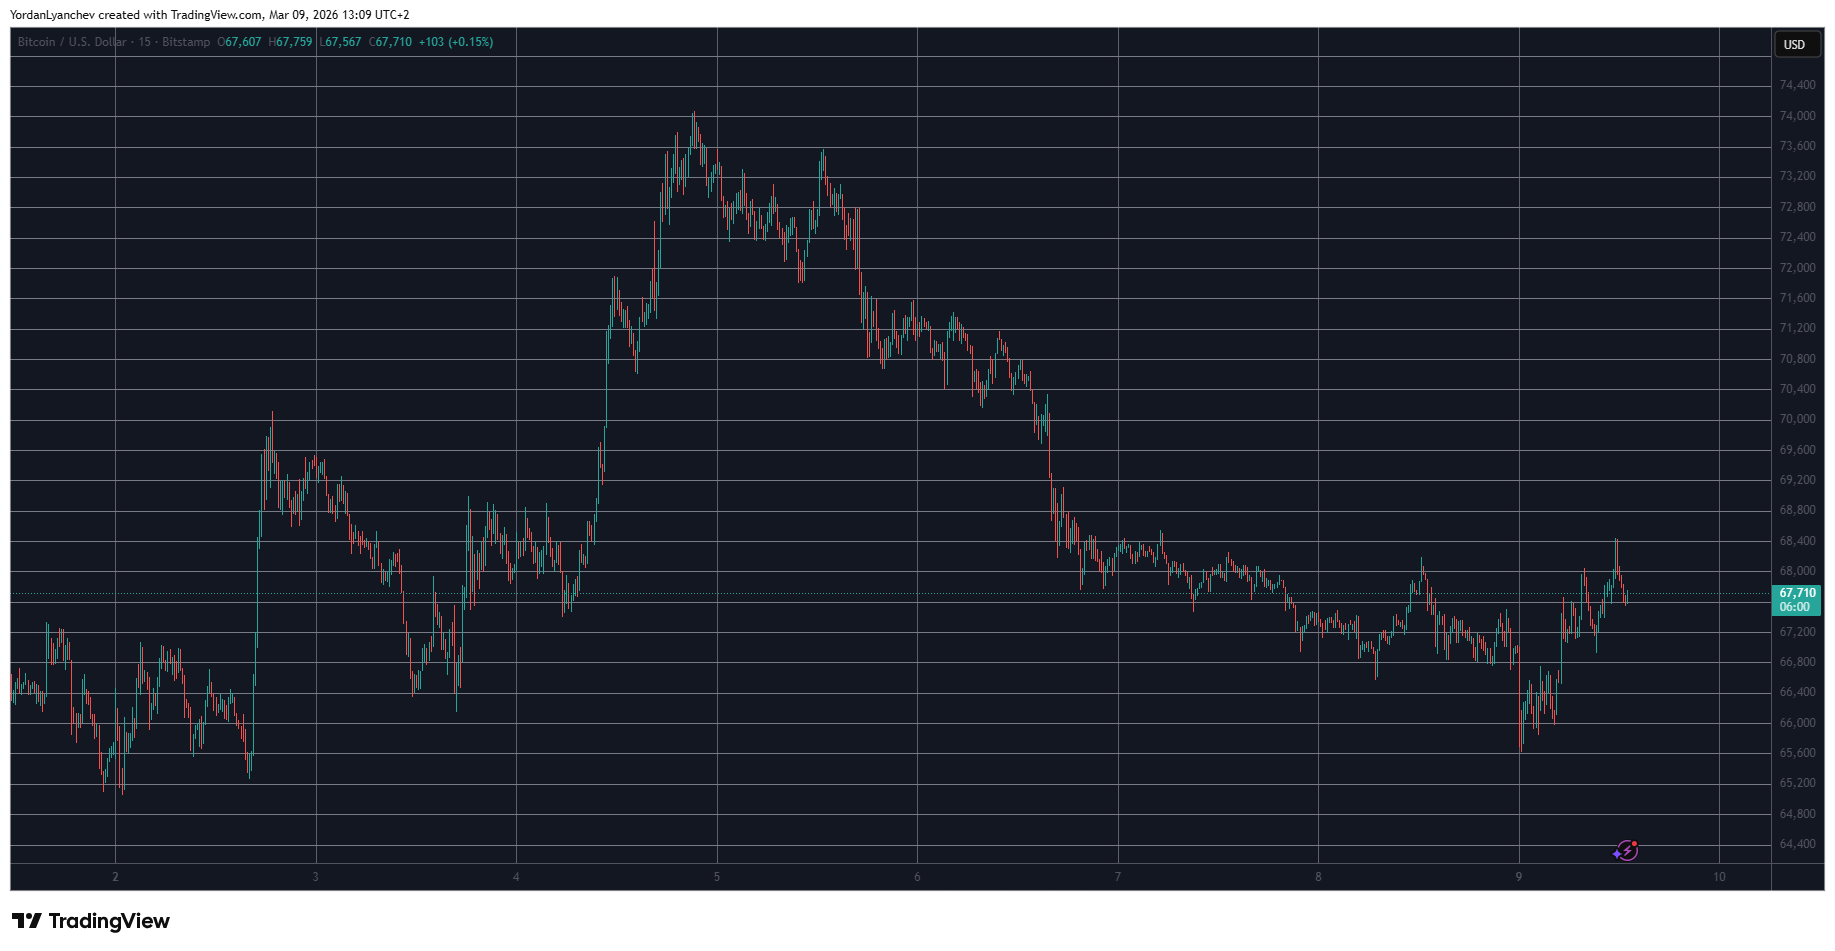
In contrast, BTC was trading at $65,492 when the first bombs fell on Iran. It briefly dipped to $63,000, but had rallied to $69,000 by 12:30pm Monday in New York — a 5.4% jump since the war began.
Dubai real estate lost nearly a fifth of its value over the same 10 days.
The city’s real estate market wipeout has erased all year-to-date gains and is threatening to reverse its 2025 gains which provide a mere 15% additional downside cushion before prices would revert to 2024 levels.

A chart of the DFM Real Estate Index shows step-like changes on each trading day along with a hard floor. For example, across four hours today, the index of real estate companies traded no lower than precisely 13,353.20.
Certain exchanges artificially limit price moves, including DFM at 5% daily.
Nearby exchange Boursa Kuwait has entirely suspended trading since March 1.
Private aircraft demand to leave Dubai is up at least 300% amid airport closures, and people are paying thousands or even six figures to flee.
Dubai bombings, drone strikes, airport closures
Dubai spent years marketing itself as a stable, tax-advantaged home for crypto influencers and it duly attracted plenty of crypto companies and influencers.
Bybit, Telegram’s TON Foundation, and Deribit have headquarters in Dubai, and many other crypto companies have offices in the city, including Binance, OKX, and Crypto.com.
Overall, 9,800 millionaires relocated to the United Arab Emirates (UAE) in 2025 alone, bringing $63 billion with them.
Then, Iran fired missiles at Dubai’s airport, luxury hotels, and civilian areas. UAE regulators closed its own stock exchanges for two full days to prevent a panic selloff.
Emaar Properties, the developer behind the Burj Khalifa, fell from 17AED on February 27 to 13.30AED today, a 22% haircut. Aldar Properties, Abu Dhabi’s largest listed developer, dropped 5% the day markets reopened. The bond market for UAE developers is only trading intermittently, with spreads blowing out across the region.
Read more: Odds swing wildly as Polymarket bets on Iran’s successor collapse
Dubai’s crypto-friendly property boom depended on foreign capital, and that capital is now heading for the exits.
In the secondary market, an aggregator tracking distressed property deals shows an average price reduction of 4.9% — for property owners who’ve had enough time to update their asking price, including several properties over 10% lower than their price days ago.
Even before the war, Fitch had warned of declines up to 15% on supply concerns alone. Analysts had already cautioned that new condo supply was set to surge in the second half of 2026, right as demand is cratering.
BTC, for all its reputation as a notoriously volatile asset, is positive since the bombs started falling. Dubai real estate, the supposedly safe store of value backed by marble lobbies and palm-shaped islands, just delivered a massive drawdown.
Got a tip? Send us an email securely via Protos Leaks. For more informed news, follow us on X, Bluesky, and Google News, or subscribe to our YouTube channel.


The oil market has moved in tandem with geopolitical headlines, but Bitcoin’s response to these energy shocks remains imperfect and highly nuanced. Crude prices have surged to about $101 per barrel, delivering what observers describe as a record 55% jump in just ten days. In parallel, equities wavered, with the S&P 500 sliding to fresh multi-week lows as investors weighed inflation risks against strategic shifts in global energy supply. Amid this backdrop, Bitcoin has delivered a mixed signal: an initial uptick that faded as energy volatility persisted, underscoring a broader point for traders who once treated oil as a primary driver for crypto moves. Today, Bitcoin appears more closely aligned with tech equities than with crude itself, complicating the conventional “oil up, crypto up” narrative.
Key takeaways
- Oil spikes have historically preceded Bitcoin rallies, averaging about a 20% gain over four weeks when WTI jumps 15% or more within 10 days, though the sample size is modest and outcomes vary.
- Bitcoin’s current correlation with the Nasdaq 100 sits around 81%, indicating that tech-stock dynamics can dominate price action even amid energy-driven volatility.
- When oil prices surged to around $101 per barrel, Bitcoin initially rose about 16% from late February to midweek, but those gains were largely erased within days as macro conditions shifted.
- Geopolitical risk, including U.S.–Iraq–Iran regional tensions, remains a persistent backdrop that could reintroduce volatility into both energy and crypto markets, depending on de-escalation timelines and macro data.
- If the historical pattern repeats, Bitcoin could target a move toward roughly $79,200 by the end of March, though this remains a probabilistic outcome rather than a forecast with high statistical certainty.
Tickers mentioned: $BTC
Market context: The interaction between energy prices and tech-driven risk sentiment suggests that volatility in energy markets may feed into broader liquidity conditions and risk appetite, yet the prevailing driver for Bitcoin may be the performance of high-growth tech equities rather than crude alone. As investors parse headlines around the Iran–Israel corridor and potential shifts in oil supply, Bitcoin’s path is being shaped by a mix of macro data, stock correlations, and energy updates rather than a single dominant factor.
Why it matters
For traders and portfolio managers, the recent data emphasize a layered reality: energy spikes can coincide with crypto strength, but the strength may not be durable if broader risk assets weaken. The 81% Nasdaq 100 correlation implies that Bitcoin’s cyclicality and adoption narratives are increasingly tethered to technology-oriented earnings and growth expectations, not just macro energy prices. This matters for hedging strategies, risk budgeting, and asset allocation, particularly in markets where liquidity is stretched and volatility remains elevated.
From a mining and infrastructure perspective, the energy backdrop also matters for costs, margins, and capital discipline. A sustained energy shock can pressure mining economics and influence the sector’s strategic decisions, even as Bitcoin continues to draw interest from institutional investors seeking uncorrelated exposure or diversification across macro regimes. The evolving relationship between oil moves and crypto prices should be evaluated alongside regulatory developments, ETF flows, and the broader macro narrative that governs risk sentiment across digital assets.
What to watch next
- Follow near-term oil price trajectories and any supply news that could shift WTI’s direction in the next 2–4 weeks.
- Monitor regional developments in the Iran–Israel corridor and any de-escalation signals that could influence risk appetite in equities and crypto alike.
- Track macro data releases (inflation, employment, and consumer spending) that can modulate the tech-led risk-on environment and thereby affect Bitcoin’s correlation with the Nasdaq 100.
- Watch Bitcoin price action within the four-week window following large oil moves to see whether the historical ~20% average gain materializes again or if the pattern breaks down in 2026’s market regime.
Sources & verification
- Oil price data showing WTI near $101 per barrel and a ~55% rise over ten days, and the related S&P 500 performance.
- Bitcoin price path during the period, including a ~16% uptick between late February and the following Wednesday, followed by a retrace by Sunday.
- The 81% correlation figure between Bitcoin and the Nasdaq 100 index.
- Historical episodes cited for oil spikes and Bitcoin responses (dates and outcomes spanning 2020–2025).
Oil shocks, Bitcoin, and the cross-asset puzzle
Bitcoin (CRYPTO: BTC) has long lived in a market where macro shocks travel through multiple channels before settling in price action. The latest sequence begins with a fresh spike in energy costs and geopolitical tensions that have the potential to ripple through inflation expectations, consumer spending, and risk appetite. In the short term, the price environment for risk assets appears complex: crude oil has surged toward the $101 per barrel mark, signaling tight energy markets and persistent inflationary pressures. Yet Bitcoin’s immediate response remains nuanced, with early gains often trimmed as traders reassess liquidity conditions, funding costs, and correlations to more risk-on segments of the market.
The data cited in the current discourse show a consistent, albeit imperfect, pattern: when WTI oil spikes by 15% or more within a 10-day window, Bitcoin has historically managed an average push higher—roughly 20% over the following four weeks. The caveat is clear: the observed sample is small, and real-world dynamics in 2026 may diverge from earlier cycles driven by different macro forces, liquidity regimes, and regulatory contours. In the most recent stretch, the oil leg captured attention with a rapid ascent, while Bitcoin’s first response was an upward spark of about 16% between late February and the subsequent midweek, a move that was subsequently retraced as concerns about inflation, growth, and funding costs reasserted themselves. For investors, this underscored a familiar truth: cross-asset signals can be transitory, and timing risk remains a core feature of crypto-market trades.
In parallel, the Nasdaq 100 continues to exert a strong pull on Bitcoin’s price action. An 81% correlation suggests that the technology sector’s temperament often sets the pace for Bitcoin’s risk-on or risk-off leanings, at times eclipsing crude’s influence. That linkage implies that a recovery in tech equities—should geopolitical tensions ease or macro data improve—could lift Bitcoin even if oil remains volatile. Conversely, a tech-led sell-off or a broad risk-off re-pricing could pressure Bitcoin even as oil markets stabilize, complicating the narrative that energy prices are the sole driver of crypto moves.
Beyond the numbers, the geopolitical landscape remains a critical variable. The Iran–Israel axis, potential escalations, and the prospect of energy-supply constraints all carry the potential to rekindle inflation fears and test the resilience of risk assets. While the near-term outcome is uncertain, the historical record offers a hedged lens: the most consequential moves tend to emerge when energy shocks align with broader macro stress or clarity about policy responses. In that sense, Bitcoin’s path forward may hinge not only on oil price levels but also on how quickly regional tensions move toward de-escalation and how macro data evolves in a world still navigating monetary tightening, fiscal support, and global diversification of energy supply.
For market participants, the key takeaway is balance: energy headlines matter, but the price dynamics of Bitcoin in 2026 likely reflect a composite of tech risk sentiment, macro outcomes, and the evolving regulatory environment. If the pattern observed across prior cycles holds, a renewed energy shock could ignite a larger rally in Bitcoin—but only if tech equities provide supportive momentum and liquidity conditions remain favorable. If not, the energy-driven impulse could be absorbed by broader market volatility, leaving Bitcoin to drift within a wider trading range. The ultimate trajectory will depend on how quickly the geopolitical uncertainty resolves, how energy markets adjust to any shifts in supply resilience, and how investors price the interplay between inflation, growth, and cross-asset correlations.
For readers seeking verifiable anchors, the related note on energy market dynamics remains a useful context: Oil retreats from 25% surge as G7 weighs emergency reserve release offers a contemporaneous lens into how policy actions can modulate the pace and persistence of energy moves when geopolitical risk spikes.
In sum, while crude oil remains a meaningful backdrop for global markets, Bitcoin’s sensitivity appears increasingly tethered to the tech-centric risk environment. The path forward will be shaped by how quickly energy tensions evolve, how tech equities perform, and how macro narrative evolves as liquidity conditions shift in response to central-bank signals and regulatory developments. The coming weeks will be telling as these forces interact, testing the reliability of oil-derived signals in a crypto market that has matured into a broader, more cross-linked risk ecosystem.
Crypto World
Bitcoin Volatility Returns as Oil Prices Go Wild, Ethereum Fights for $2K: Market Watch
ТАО is today’s top gainer, while Pi Network’s PI token continues its crazy ride.
Bitcoin’s price faced some enhanced volatility in the past 24 hours again, dropping toward $65,500 before it jumped to $68,500, only to be rejected after the latest developments on the Middle East war front and the fluctuating oil prices.
Ethereum is challenging its nemesis at $2,000 once more, while HASH and STABLE have plunged hard from the mid-cap alts.
BTC’s Ride
After dumping from $67,000 to $63,000 on February 28 when the strikes in the Middle East began, bitcoin’s price rebounded hard and skyrocketed to $74,000 on Wednesday. This meant that the asset had added $11,000 in days, which, given the current uncertain landscape, was almost expected to be followed by a sharp decline.
The bears indeed took control of the market in the following days and pushed BTC south to $68,000 on Friday and Saturday. Although it was a significantly less volatile weekend compared to the previous one, BTC still felt some fluctuations on Sunday evening when most legacy futures markets opened.
As Israel struck a few Iranian oil bases, the price of the so-called liquid gold skyrocketed this morning to a fresh multi-year peak of $120 per barrel. Reports emerged that the G7 countries plan to release 400 million barrels, which drove USOIL south to under $96,000 before it rebounded to $102 as of press time.
Bitcoin dipped to $65,500, jumped to $68,500, and returned to $67,500 all within hours. Its market cap is back to $1.350 trillion, while its dominance over the alts stands at 56.5% on CG.
ETH Battles $2K
The largest altcoin jumped to $2,200 last Wednesday, but it was rejected hard and dumped to just over $1,900 days later. It rebounded and now fights for $2,000 once again, but its attempt is still looking weak.
BNB, SOL, HYPE, XMR, and LINK have charted insignificant gains daily, while XRP, TRX, DOGE, ADA, and BCH are in the red. CC has dropped the most from the larger cap alts, while TAO has soared by almost 10% to $195.
Pi Network’s PI token continues to be quite volatile, jumping 5% daily to over $0.21 after its crash to $0.20 yesterday.
The total crypto market cap has remained relatively the same, at just under $2.4 trillion on CG.

Binance Free $600 (CryptoPotato Exclusive): Use this link to register a new account and receive $600 exclusive welcome offer on Binance (full details).
LIMITED OFFER for CryptoPotato readers at Bybit: Use this link to register and open a $500 FREE position on any coin!
Disclaimer: Information found on CryptoPotato is those of writers quoted. It does not represent the opinions of CryptoPotato on whether to buy, sell, or hold any investments. You are advised to conduct your own research before making any investment decisions. Use provided information at your own risk. See Disclaimer for more information.

Key Highlights
- Sonic Labs debuts USSD, a stablecoin backed by U.S. Treasury products for DeFi liquidity.
- The digital asset maintains 1:1 backing through tokenized Treasury holdings from leading institutions.
- Minting occurs via non-custodial smart contracts without additional charges.
- Cross-chain functionality across 10+ blockchains powered by LayerZero technology.
- Native USDC compatibility enhances liquidity flow and DeFi accessibility.
Sonic Labs has introduced USSD, a dollar-pegged digital currency backed by tokenized U.S. Treasury instruments. The new stablecoin is designed to deliver reliable liquidity throughout the Sonic blockchain environment. USSD will facilitate various financial activities including trading, payments, lending operations, and transaction settlement within decentralized finance platforms.
The digital asset maintains complete one-to-one backing through regulated Treasury instruments. These underlying assets originate from prominent financial entities such as BlackRock, WisdomTree, and Superstate. This backing mechanism provides stability and clear transparency for everyone utilizing the Sonic platform.
USSD enables direct minting through decentralized smart contract technology. Compatible assets can be deposited at equal value with zero extra charges. This framework creates accessibility for builders, liquidity contributors, and DeFi ecosystem members.
Treasury Asset Backing Bolsters Sonic’s Decentralized Finance Infrastructure
USSD reserves consist of premium Treasury instruments maintained with regulated custody providers. The architecture resembles the system employed by Frax for its FRAX digital dollar. This methodology guarantees transparent redemption processes and trustworthy asset collateralization.
Tokenized Treasury instruments connect traditional financial systems with blockchain technology. They preserve stable value while ensuring on-chain visibility. The backing allows Sonic to incorporate institutional returns at its foundation.
USSD’s Treasury-based structure facilitates sustainable ecosystem expansion. Income generated from underlying assets may finance platform development and user rewards. The framework enhances Sonic’s capacity to deliver dependable liquidity for decentralized applications.
Multi-Chain Functionality and USDC Compatibility
USSD enables minting across more than ten blockchain ecosystems through LayerZero protocols. Participants can deposit supported tokens on external networks and obtain USSD on Sonic instantly. This feature minimizes complexity and streamlines cross-chain asset transfers.
The stablecoin works harmoniously with Circle’s USDC, enabling effortless conversions between platforms. Participants can exchange USSD for USDC utilizing Chainlink’s Cross-Chain Transfer Protocol. This configuration delivers familiar entry and exit pathways for dollar-denominated digital assets.
Incorporation of Frax’s GENIUS infrastructure delivers enterprise-level functionality. It guarantees that minting, conversion, and multi-chain operations remain protected and dependable. USSD therefore becomes a core stable instrument for Sonic’s expanding DeFi landscape.
Sonic’s Platform Expansion and Strategic Integration
USSD represents a critical component in Sonic’s comprehensive integration approach. It facilitates value accumulation to the native S token through stable asset liquidity. This provides applications with a dependable dollar benchmark on the blockchain.
The stablecoin allows Sonic to access institutional returns while supporting platform advancement. Managing liquidity and transaction volumes becomes more efficient with a native, collateralized instrument. This development reinforces the ecosystem while preserving openness and dependability.
Sonic operates as an EVM-compatible Layer 1 network focused on maximum throughput and rapid transaction finality. USSD strengthens its monetary infrastructure by delivering a trustworthy, platform-native dollar instrument. This introduction establishes Sonic as a formidable competitor among high-performance blockchain platforms.

TLDR
- Sharplink reported a full-year net loss of $734 million after a decline in Ethereum prices reduced the value of its holdings.
- The company recorded a $616 million decrease in the value of its Ethereum treasury during the year.
- Sharplink booked a $140 million impairment charge related to tokens representing staked Ethereum.
- The firm generated a $55 million net gain from conversions between Ethereum and staking tokens.
- Quarterly staking revenue increased 50% to $15.3 million dollars from $10.3 million dollars.
Sharplink reported a $734 million full-year loss after a sharp decline in the Ethereum price reduced the value of its holdings. The Miami-based company disclosed that falling token prices drove most of the loss, even as staking revenue increased. Management said the firm maintained its strategy while expanding its Ethereum treasury position.
Sharplink Reports Full-Year Loss After Ethereum Price Drop
Sharplink recorded a $734 million net loss for the year, reversing a $10.1 million profit in 2024. The company attributed the loss to a $616 million decline in the value of its Ethereum holdings. It also booked a $140 million impairment charge tied to tokens representing staked Ethereum.
However, the firm posted a $55 million net gain from conversions between Ethereum and related staking tokens. The company confirmed it currently holds 867,000 Ethereum tokens. CoinGecko data showed Ethereum traded near $2,000 on Monday, valuing those holdings around $1.75 billion.
Sharplink’s holdings rank second among corporate Ethereum treasuries. BitMine Immersion Technologies holds about $9 billion in Ethereum under the oversight of Tom Lee. The company ended the year with $30.4 million in cash and stablecoins.
Shares of Sharplink traded at $7.41 on Monday, according to Yahoo Finance. Over the past six months, the stock declined 55%. During the same period, Ethereum fell 53%.
Ethereum Staking Revenue Climbs as Treasury Strategy Expands
Sharplink increased its staking revenue by 50% quarter over quarter. The company generated $15.3 million from staking, compared with $10.3 million in the previous quarter. It has earned 14,500 Ethereum from staking activities, valued at about $9.4 million.
Sharplink participates in Ethereum’s transaction validation process through staking operations. The company also deploys capital into decentralized finance protocols to pursue higher yields. Management stated that boosting Ethereum per share remains a core objective.
Sharplink currently holds about 4 Ethereum per share. The company has raised approximately $3.2 billion to support its transition toward an Ethereum-focused treasury model. CEO Joseph Chalom described the year as transformative for the firm.
“2025 was a defining year for Sharplink,” Chalom said in a shareholder letter. He stated that short-term market volatility can affect results. He added, “Our strategy is consistent and designed to endure.”
Joe Lubin, CEO of Consensys and Sharplink’s chairman, addressed institutional adoption trends. He said, “The institutional adoption supercycle accelerated in 2025.” Lubin stated that Sharplink aims to bridge traditional public markets with the Ethereum ecosystem.
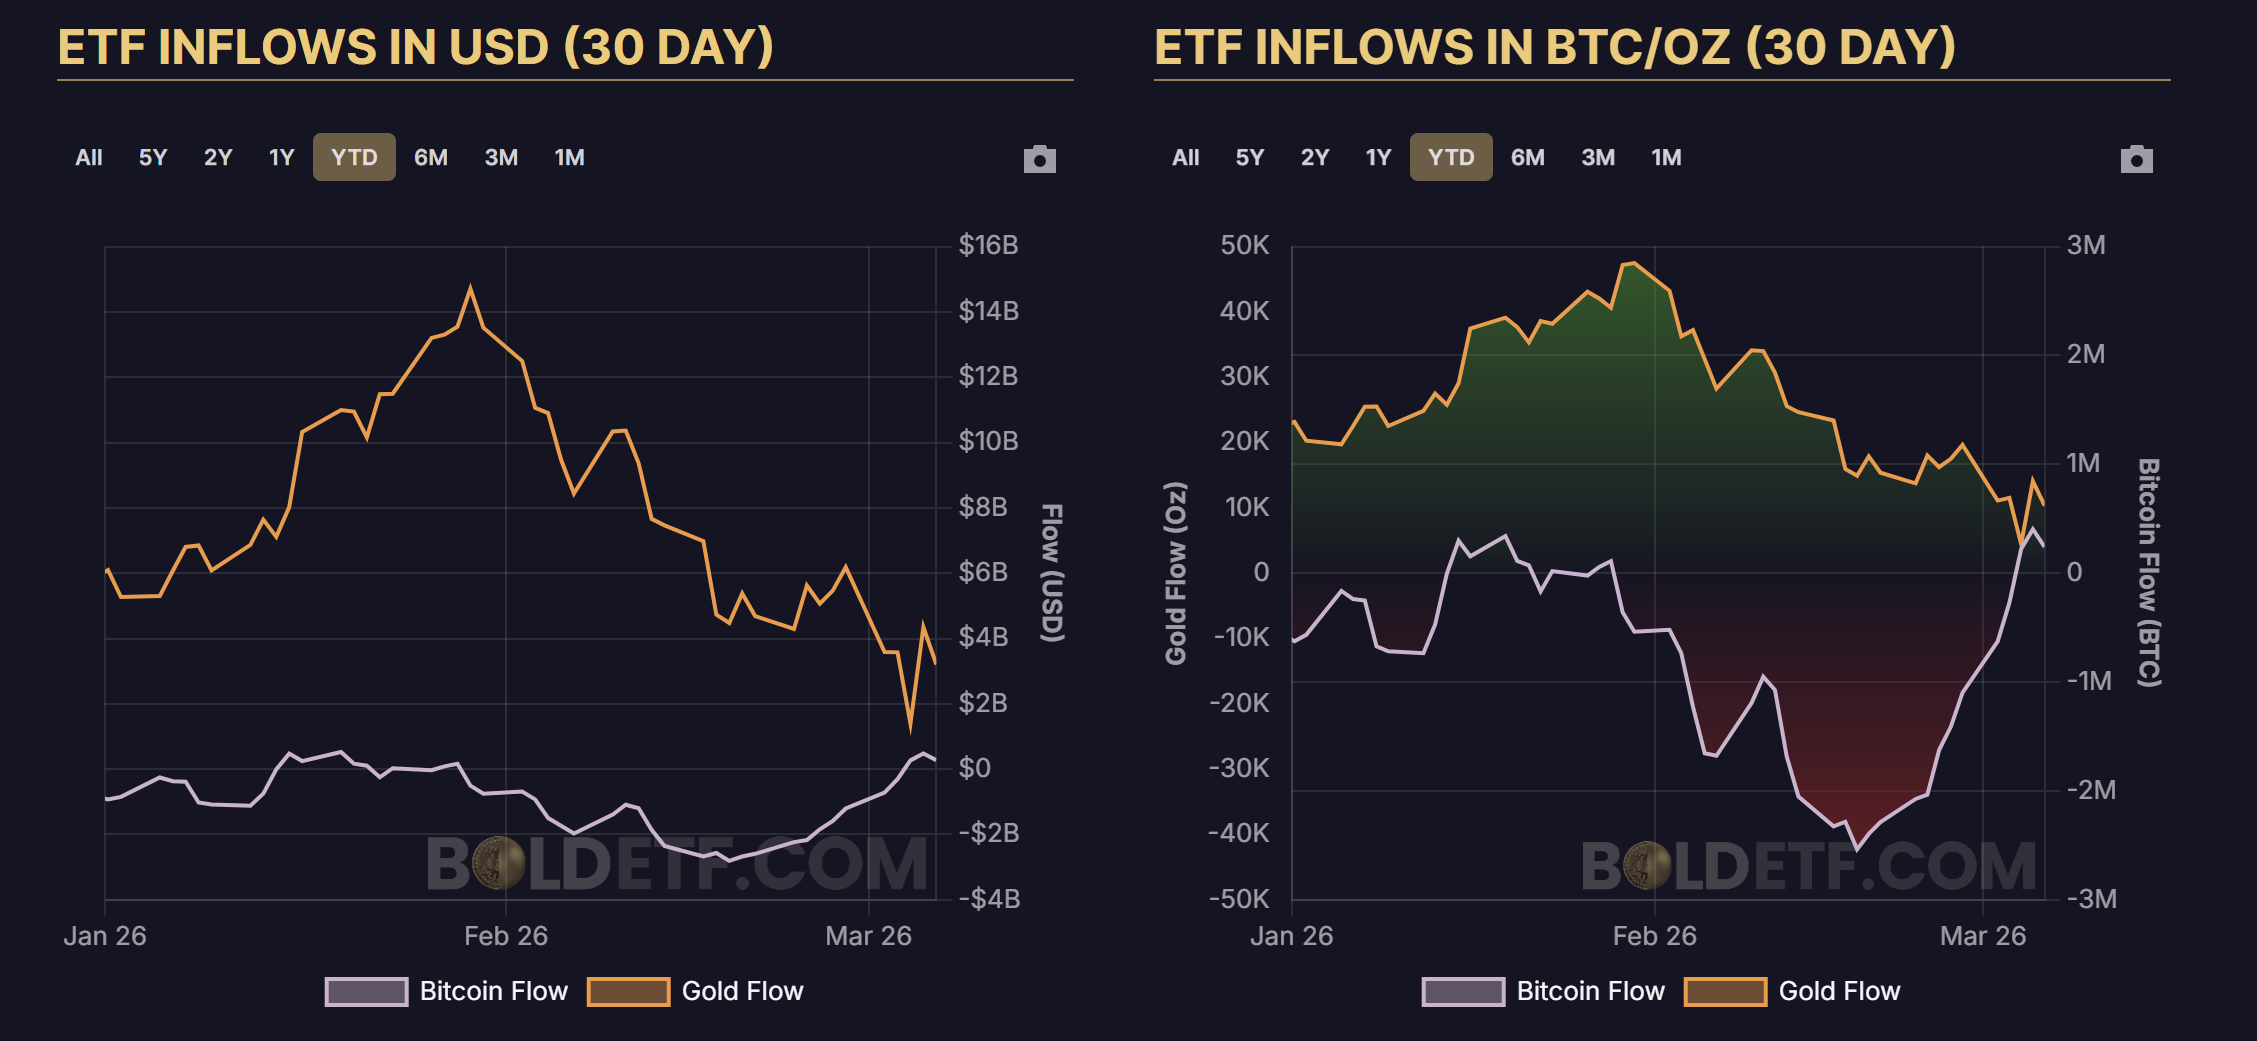
Bitcoin (BTC) exchange-traded fund (ETF) flows have turned net positive over the past 30 days, while gold ETF demand has started to slow down after nine straight months of inflows. The shift comes even as gold prices remain elevated and sentiment around Bitcoin continues to cool.
With these contrasting trends in ETF flows and the historical pattern of Bitcoin-to-gold performance cycles, analysts are now examining data that may signal a gradual shift in investor demand between the two assets.
Are ETF flows beginning to rotate?
According to the Kobeissi Letter, the largest US gold-backed ETF, GLD, recorded a $3 billion outflow on Wednesday, the largest daily withdrawal in more than two years. The move followed a 4.4% decline in gold prices, the sharpest drop since the Jan. 30 sell-off.
Gold ETFs had attracted $18.7 billion in January and another $5.3 billion in February, marking the strongest two-month start to a year on record and extending a nine-month inflow streak. The latest outflow points to investors taking profits after gold’s massive rally in 2025.
Bitcoin ETF flows moved in the opposite direction over the past month. The 30-day net flow shifted to a $273 million inflow on March 6 from a $1.9 billion outflow on Feb. 6

The holdings data measured in native units show the divergence more clearly. Bitcoin ETF balances moved to a net increase of 4,021 BTC on March 6 from −42,275 BTC on Feb. 6. Gold ETF holdings declined from 1.4 million ounces to 621,100 ounces during the same period.
The native units represent the actual underlying asset held by funds rather than the dollar value of those holdings. Tracking BTC or ounces isolates real accumulation or distribution without the distortion created by the price movements.
Head of growth at Horizon, Joe Consorti, summarized the current trend and said,
“Gold is stalling out while bitcoin is soaring. BTC is set to overtake gold’s % growth over the last month as the U.S. economy accelerates and risk sentiment improves. The anticipated risk-off → risk-on rotation could be underway.”
Related: Bitcoin dip may not be over as retail ramps up buying below $70K: Santiment
Gold rallies precede Bitcoin recoveries
In a “2026 Look Ahead” report released at the end of December 2025, Fidelity Digital Assets analyst Chris Kuiper noted that gold’s 65% return in 2025 was the fourth-largest annual gain since the end of the gold standard. With respect to past rallies, Kuiper noted that gold is potentially near the late stages of its leadership cycle between the two assets. Kuiper said,
“Historically, gold and bitcoin have taken turns outperforming. With gold shining in 2025, it would not be surprising if bitcoin takes the lead next.”
However, the rotation may take some time to unfold in the market.

As illustrated in the chart, BTC needed roughly 147 days or 21 weeks to establish a sustained trend outperforming gold after Bitcoin’s 2022 bottom. The period marked a consolidation phase before the ratio began trending higher.
The BTC-to-gold ratio currently trades near the same consolidation zone seen during the earlier rotation phases in 2022-2023.
Kuiper also added that both assets can benefit from the persistent fiscal deficits, trade tensions, and geopolitical uncertainty as investors seek neutral stores of value outside traditional monetary systems.
The ongoing US-Israel and Iran war has reinforced demand for traditional safe-haven assets, which previously supported gold rallies during periods of geopolitical stress.
Meanwhile, macroeconomic strategist Lyn Alden expects Bitcoin to outperform gold over the next two to three years following gold’s recent rally in the past few months.
Related: When buying Bitcoin, don’t expect profit for at least 3 years: Data
This article does not contain investment advice or recommendations. Every investment and trading move involves risk, and readers should conduct their own research when making a decision. While we strive to provide accurate and timely information, Cointelegraph does not guarantee the accuracy, completeness, or reliability of any information in this article. This article may contain forward-looking statements that are subject to risks and uncertainties. Cointelegraph will not be liable for any loss or damage arising from your reliance on this information.

XRP price is holding the $1.30 support level, but order flow data shows sellers are still dominating market activity, keeping short-term upside limited.
Summary
- XRP trades around $1.36 after rising 1.3% in the past 24 hours, though the token remains about 62% below its 2025 peak.
- Order flow data shows aggressive sell orders outweighing buys, indicating continued selling pressure.
- If $1.30 support holds, XRP could attempt a move toward $1.40 psychological level, while a breakdown may open the path to $1.20.
XRP (XRP) was trading at $1.36 at press time, gaining 1.3% in the past 24 hours as the token attempted to stabilize after weeks of selling pressure.
Over the last seven days, XRP moved between $1.34 and $1.46. Even with the recent consolidation, the token remains far below previous highs and is currently about 62% below its July 2025 all-time high of $3.65.
Market activity has picked up. 24-hour trading volume reached $2.55 billion, marking a 67.5% increase from the previous day.
Derivatives activity has also grown. Data from CoinGlass shows trading volume rising 63% to $3.54 billion, while open interest climbed 2.5% to $2.33 billion. The increase suggests traders are opening new positions as the market searches for direction.
Sellers dominate market orders
A March 9 report from CryptoQuant contributor PelinayPA shows that sellers currently control the aggressive side of the order flow.
The buy-to-sell liquidity ratio stands near 0.912, meaning market sell orders are exceeding market buy orders. In simple terms, traders are using market orders to sell more often than to buy.
XRP has been trading close to $1.34 during this time, with little upward momentum. When the ratio dips below 1, market orders are not pushing the price higher.
Although there are still buyers in the market, the majority seem to be making limit orders instead of aggressive market buys. As a result, buyers supply liquidity and sellers remove it through market orders.
As long as this imbalance continues, selling pressure may persist. The data suggests that the current market structure is still leaning toward the sell side.
XRP price technical analysis
A short-term support area has formed between $1.30 and $1.33 on the daily chart. Price has stabilized around this zone several times, and recent candles show sideways movement just above it, which suggests buyers are defending the level.
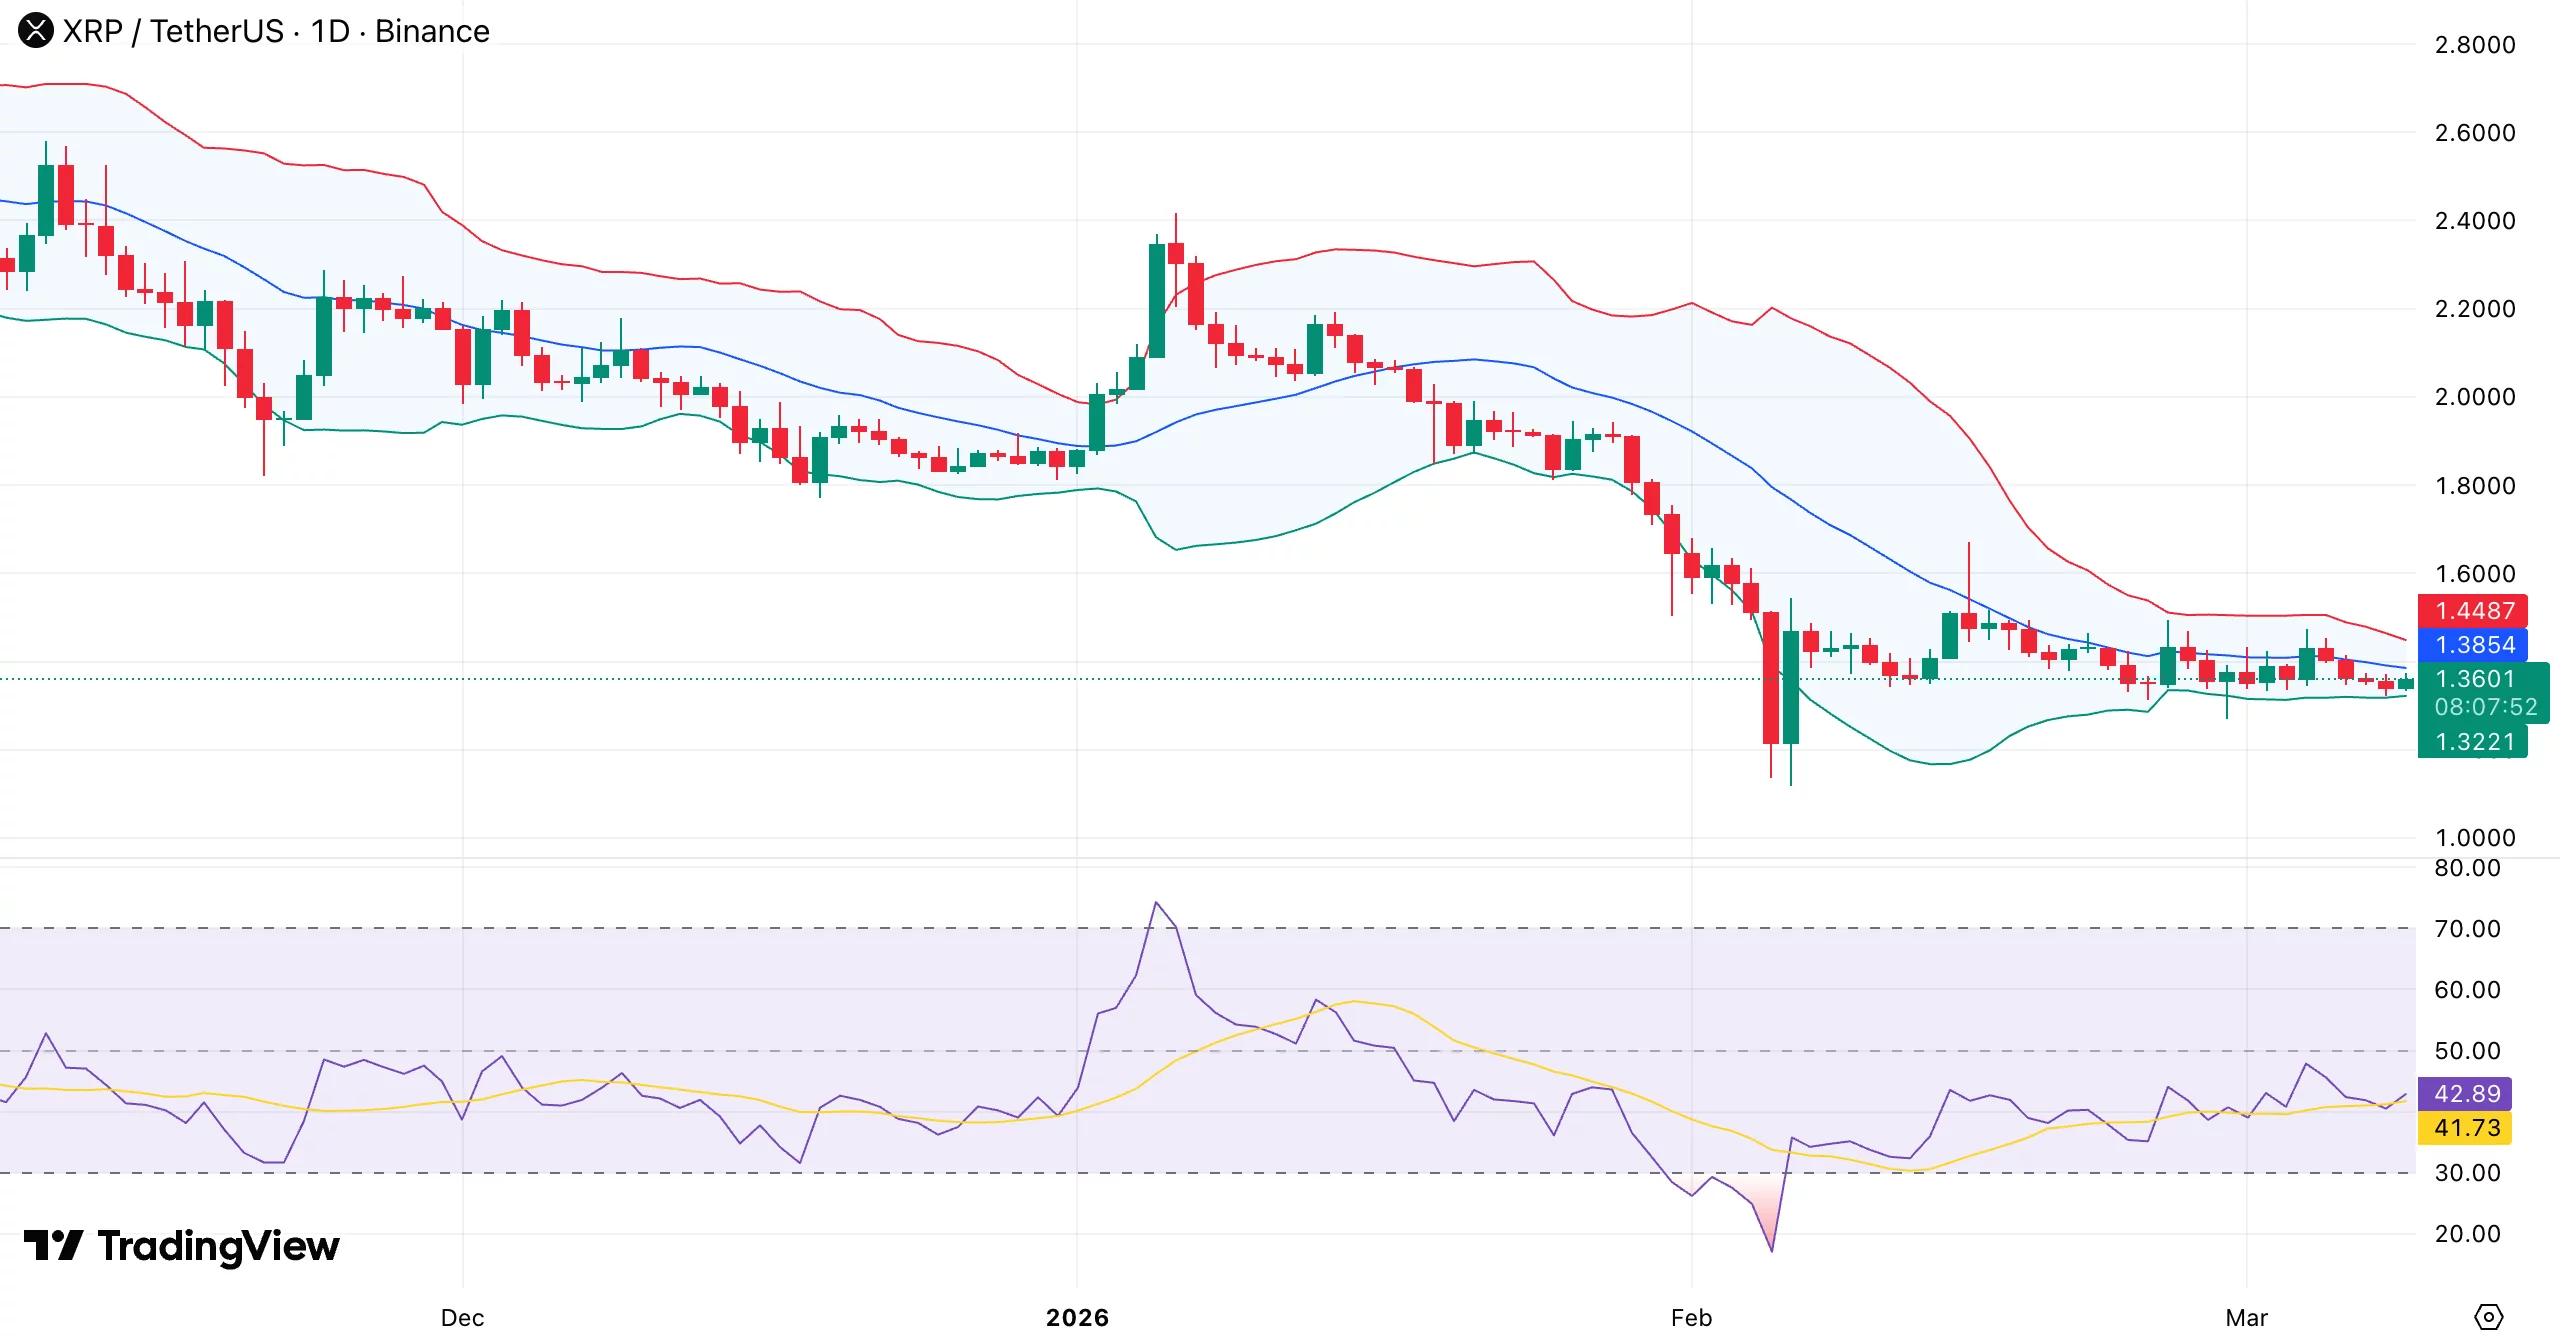
At the same time, XRP is trading below the Bollinger Bands mid-line, which is in line with the 20-day moving average. When price trades under this level, the short-term trend is usually considered bearish.
Earlier in February, XRP touched the lower Bollinger Band before bouncing higher. Since that drop, volatility has slowly decreased and price has moved sideways.
Momentum is still weak. The relative strength index sits around 42–43, which is still below the neutral 50 level. The indicator has recovered from near-oversold levels seen earlier in February, but buying momentum is still limited.
The larger structure also shows pressure. Since early January, the chart has produced a series of lower highs, meaning the wider downtrend has not yet changed. The current sideways movement appears to be a pause within that trend.
Meanwhile, Bollinger Bands are tightening, which often comes before a stronger price move. If XRP continues to hold above $1.30, buyers may try to push the price toward the $1.38–$1.40 area, where the Bollinger mid-line sits.
A move above that zone, together with RSI approaching 50, would improve the short-term outlook. However, if $1.30 support breaks, XRP could slide toward $1.20. Continued weakness in RSI below the neutral level would keep the bearish structure in place for now.


US investors drove most crypto fund activity, and added $646 million last week.
Investment products tied to digital assets posted net inflows of $619 million last week, which, according to CoinShares, indicates that the initial response to the Iran crisis was favorable for the sector. Inflows of $1.44 billion were registered during the first three days of the week, reflecting early optimism among investors.
Sentiment weakened later as $829 million left the market on Thursday and Friday. The withdrawals came even as payroll figures were much weaker than anticipated, a development that might normally support risk assets.
Geopolitical Tensions Shape Weekly Gain
However, higher oil prices countered any potential decline in inflation that could have resulted from the weak labor data. Despite the late-week outflows, the overall weekly flows suggest investor sentiment toward digital asset investment products remained broadly positive during ongoing geopolitical uncertainty.
According to the latest edition of CoinShares’ Digital Asset Fund Flows Weekly Report, Bitcoin attracted the largest share of investor allocations last week, as $521 million was directed into related investment products. However, sentiment toward the asset remained divided, as short-Bitcoin products also recorded $11.4 million in new capital. Among altcoins, Ethereum led activity with $88.5 million, followed by Solana with $14.6 million.
Smaller additions were recorded for Uniswap and Chainlink, each receiving $1.4 million. Multi-asset products raked in $5.4 million during the same period. On the other hand, XRP moved in the opposite direction and saw withdrawals of $30.3 million from investment products tied to the token.
Most of the positive investor activity came from the United States, where digital asset products amassed $646 million. Other regions showed weaker sentiment. For instance, Europe recorded $23.8 million leaving the market, while Asia and Canada saw outflows of $2.2 million and $3.6 million, respectively.
Traders Brace for Volatility
Bitcoin remained relatively resilient even as rising tensions involving Iran pushed oil prices above $115 and triggered broader market stress. Fears of significant supply disruptions through the Strait of Hormuz and wider instability in the Middle East pressured global equities and pushed the VIX above 29.
You may also like:
Despite this environment, QCP Capital said Bitcoin has held up better than many other risk assets, a pattern the crypto market has not seen for some time. Options market positioning also revealed that traders are less concerned about another sharp decline than during the initial shock last week.
While downside protection is still in place, particularly through short-dated options with strikes between $61,000 and $64,000, flows indicate expectations of continued volatility rather than a one-way decline.
Binance Free $600 (CryptoPotato Exclusive): Use this link to register a new account and receive $600 exclusive welcome offer on Binance (full details).
LIMITED OFFER for CryptoPotato readers at Bybit: Use this link to register and open a $500 FREE position on any coin!
Crypto World
Coinbase (COIN) Stock: Collaborates With Aon and Paxos on Stablecoin Insurance Payment Pilot

TLDR
- Coinbase collaborates with Aon on blockchain-based insurance premium pilot using stablecoins.
- Transactions settle nearly instantaneously across global networks using digital tokens.
- Blockchain technology eliminates multiple intermediaries in payment processing.
- Immutable ledger records enhance audit trails and financial reconciliation.
- Growing corporate interest follows improved regulatory framework for digital assets.
Corporate finance continues embracing innovative payment technologies as leading institutions experiment with distributed ledger solutions. Coinbase Global, Inc. stock closed at $194.71, declining 1.26%, as the cryptocurrency exchange engaged in a blockchain insurance payment trial. Insurance brokerage giant Aon partnered with Paxos to facilitate premium settlements through dollar-backed digital tokens.
Coinbase Global, Inc., COIN
This experiment showcased the potential for stablecoins to accelerate corporate payment workflows while minimizing delays inherent in conventional banking infrastructure. The trial leveraged blockchain technology that creates transparent transaction records and completes fund transfers in minutes rather than multiple business days. This development illustrates how tokenized currency could progressively merge with mainstream financial frameworks and insurance workflows.
Conventional insurance premium processing typically involves multiple banking intermediaries before final settlement, particularly for international transactions among enterprise clients. Distributed ledger payments streamline this workflow by enabling peer-to-peer value transfer without protracted clearing procedures. The experiment offered valuable operational data on modernizing premium payment infrastructure through digital assets.
USD Coin on Ethereum Network Processes Corporate Insurance Payment
The trial employed USD Coin to execute an insurance premium transaction via the Ethereum blockchain. Coinbase facilitated the payment on behalf of an Aon customer while Paxos contributed to the overall testing framework. This transaction examined how distributed ledger technology manages corporate insurance financial obligations.
Stablecoins preserve value through fiat currency backing, providing stable pricing for substantial institutional transactions. Furthermore, blockchain settlement generates permanent payment records, streamlining audit and reconciliation workflows for corporate finance teams. Organizations can therefore determine whether distributed ledger settlement minimizes operational overhead in insurance payment processing.
The trial also mirrored increasing regulatory definition around stablecoins within American financial markets. Enactment of the GENIUS Act established federal supervision requirements for token issuers and reserve disclosure standards. Major corporations now explore stablecoins within compliant regulatory parameters.
PayPal USD on Solana Network Demonstrates Alternative Blockchain Payment Path
An additional premium transaction utilized PayPal USD via the Solana blockchain as part of the identical pilot program. Paxos facilitated this payment while Aon executed the transfer within its insurance distribution infrastructure. This approach enabled performance comparison across different stablecoin ecosystems.
Stablecoin transactions deliver near-real-time settlement versus conventional banking networks that frequently require multiple days for international fund clearing. Distributed ledger systems provide transaction transparency, enabling organizations to monitor payments and verify settlement promptly. Enterprises can evaluate operational performance gains from tokenized payment systems.
Aon administers risk management and insurance solutions spanning over 120 nations while consulting on trillions in worldwide assets. The brokerage firm’s blockchain experiment therefore indicates expanding institutional appetite for distributed ledger payment infrastructure in corporate treasury functions. This pilot generates practical implementation insights that may influence future deployment strategies throughout insurance sectors and major financial organizations.
Toobit, the popular and award-winning international cryptocurrency exchange, announced a 200,000 USDT campaign, which will be focused on its integrated TradFi markets.
The move follows a recent expansion of the firm’s TradFi offerings, which enabled the direct trading of assets such as gold and global indices within a unified interface.
The 200,000 USDT Initiative
To further facilitate this campaign, Toobit has implemented a reduced fee tier which works for all eligible TradFi futures pairs. The maker fees are set at 0.01%, while the taker fees are set at 0.03%. This is supported by a protection fund for first trades worth 50,000 USDT, which covers between 2% and 100% of the losses (capped at 100 USDT).
The fund is designed to help traders buffer while navigating the global asset classes for the very first time.
The 200,000 USDT prize pool is distributed across four activity tiers:
- New trader milestones: 50,000 USDT for the first 5,000 traders who meet minimum volume requirements (3,000 USDT for Futures or 500 USDT for Spot).
- Downside protection: 50,000 USDT dedicated to the first-trade loss reimbursement program.
- Futures trading challenge: A 50,000 pool USDT for top-ranked futures traders, with participation rewards starting at a 10,000 USDT volume threshold.
- Spot trading challenge: A 50,000 USDT pool for spot traders, featuring a leaderboard and volume-based rewards for participants reaching 3,000 USDT in volume.
Commenting on the matter was the Chief Communication Officer at Toobit, Mile Williams, who said:
“As the TradFi sector matures, providing accessible entry points into traditional markets is a priority. […] These fee incentives and the 50,000 USDT protection fund provide a lower barrier for traders looking to explore multi-asset diversification directly from their existing Toobit accounts.”
The campaign will conclude on March 30, 2026. To be eligible for rewards, traders must register on the campaign page. For a comprehensive breakdown of terms and conditions, please refer to the details available on the Toobit announcement page.
The Rise of TradFi in Crypto
The first few months of this year saw a considerable shift in the integration of digital and traditional finance. At the time of this writing, the total volume of on-chain real-world assets (RWAs) has already surpassed $25 billion, and tokenized commodities have reached a market cap of more than $7.32 billion.
This represents an increase of more than 300% in the past 12 months.
This particular expansion has mainly been driven by a rotation toward transparent, asset-backed structures. Tokenized gold now ranks as the world’s second-largest gold investment product by trading volume, trailing only the GLD ETF.
For more information about Toobit, visit: Website | X | Telegram | LinkedIn | Discord | Instagram
Binance Free $600 (CryptoPotato Exclusive): Use this link to register a new account and receive $600 exclusive welcome offer on Binance (full details).
LIMITED OFFER for CryptoPotato readers at Bybit: Use this link to register and open a $500 FREE position on any coin!
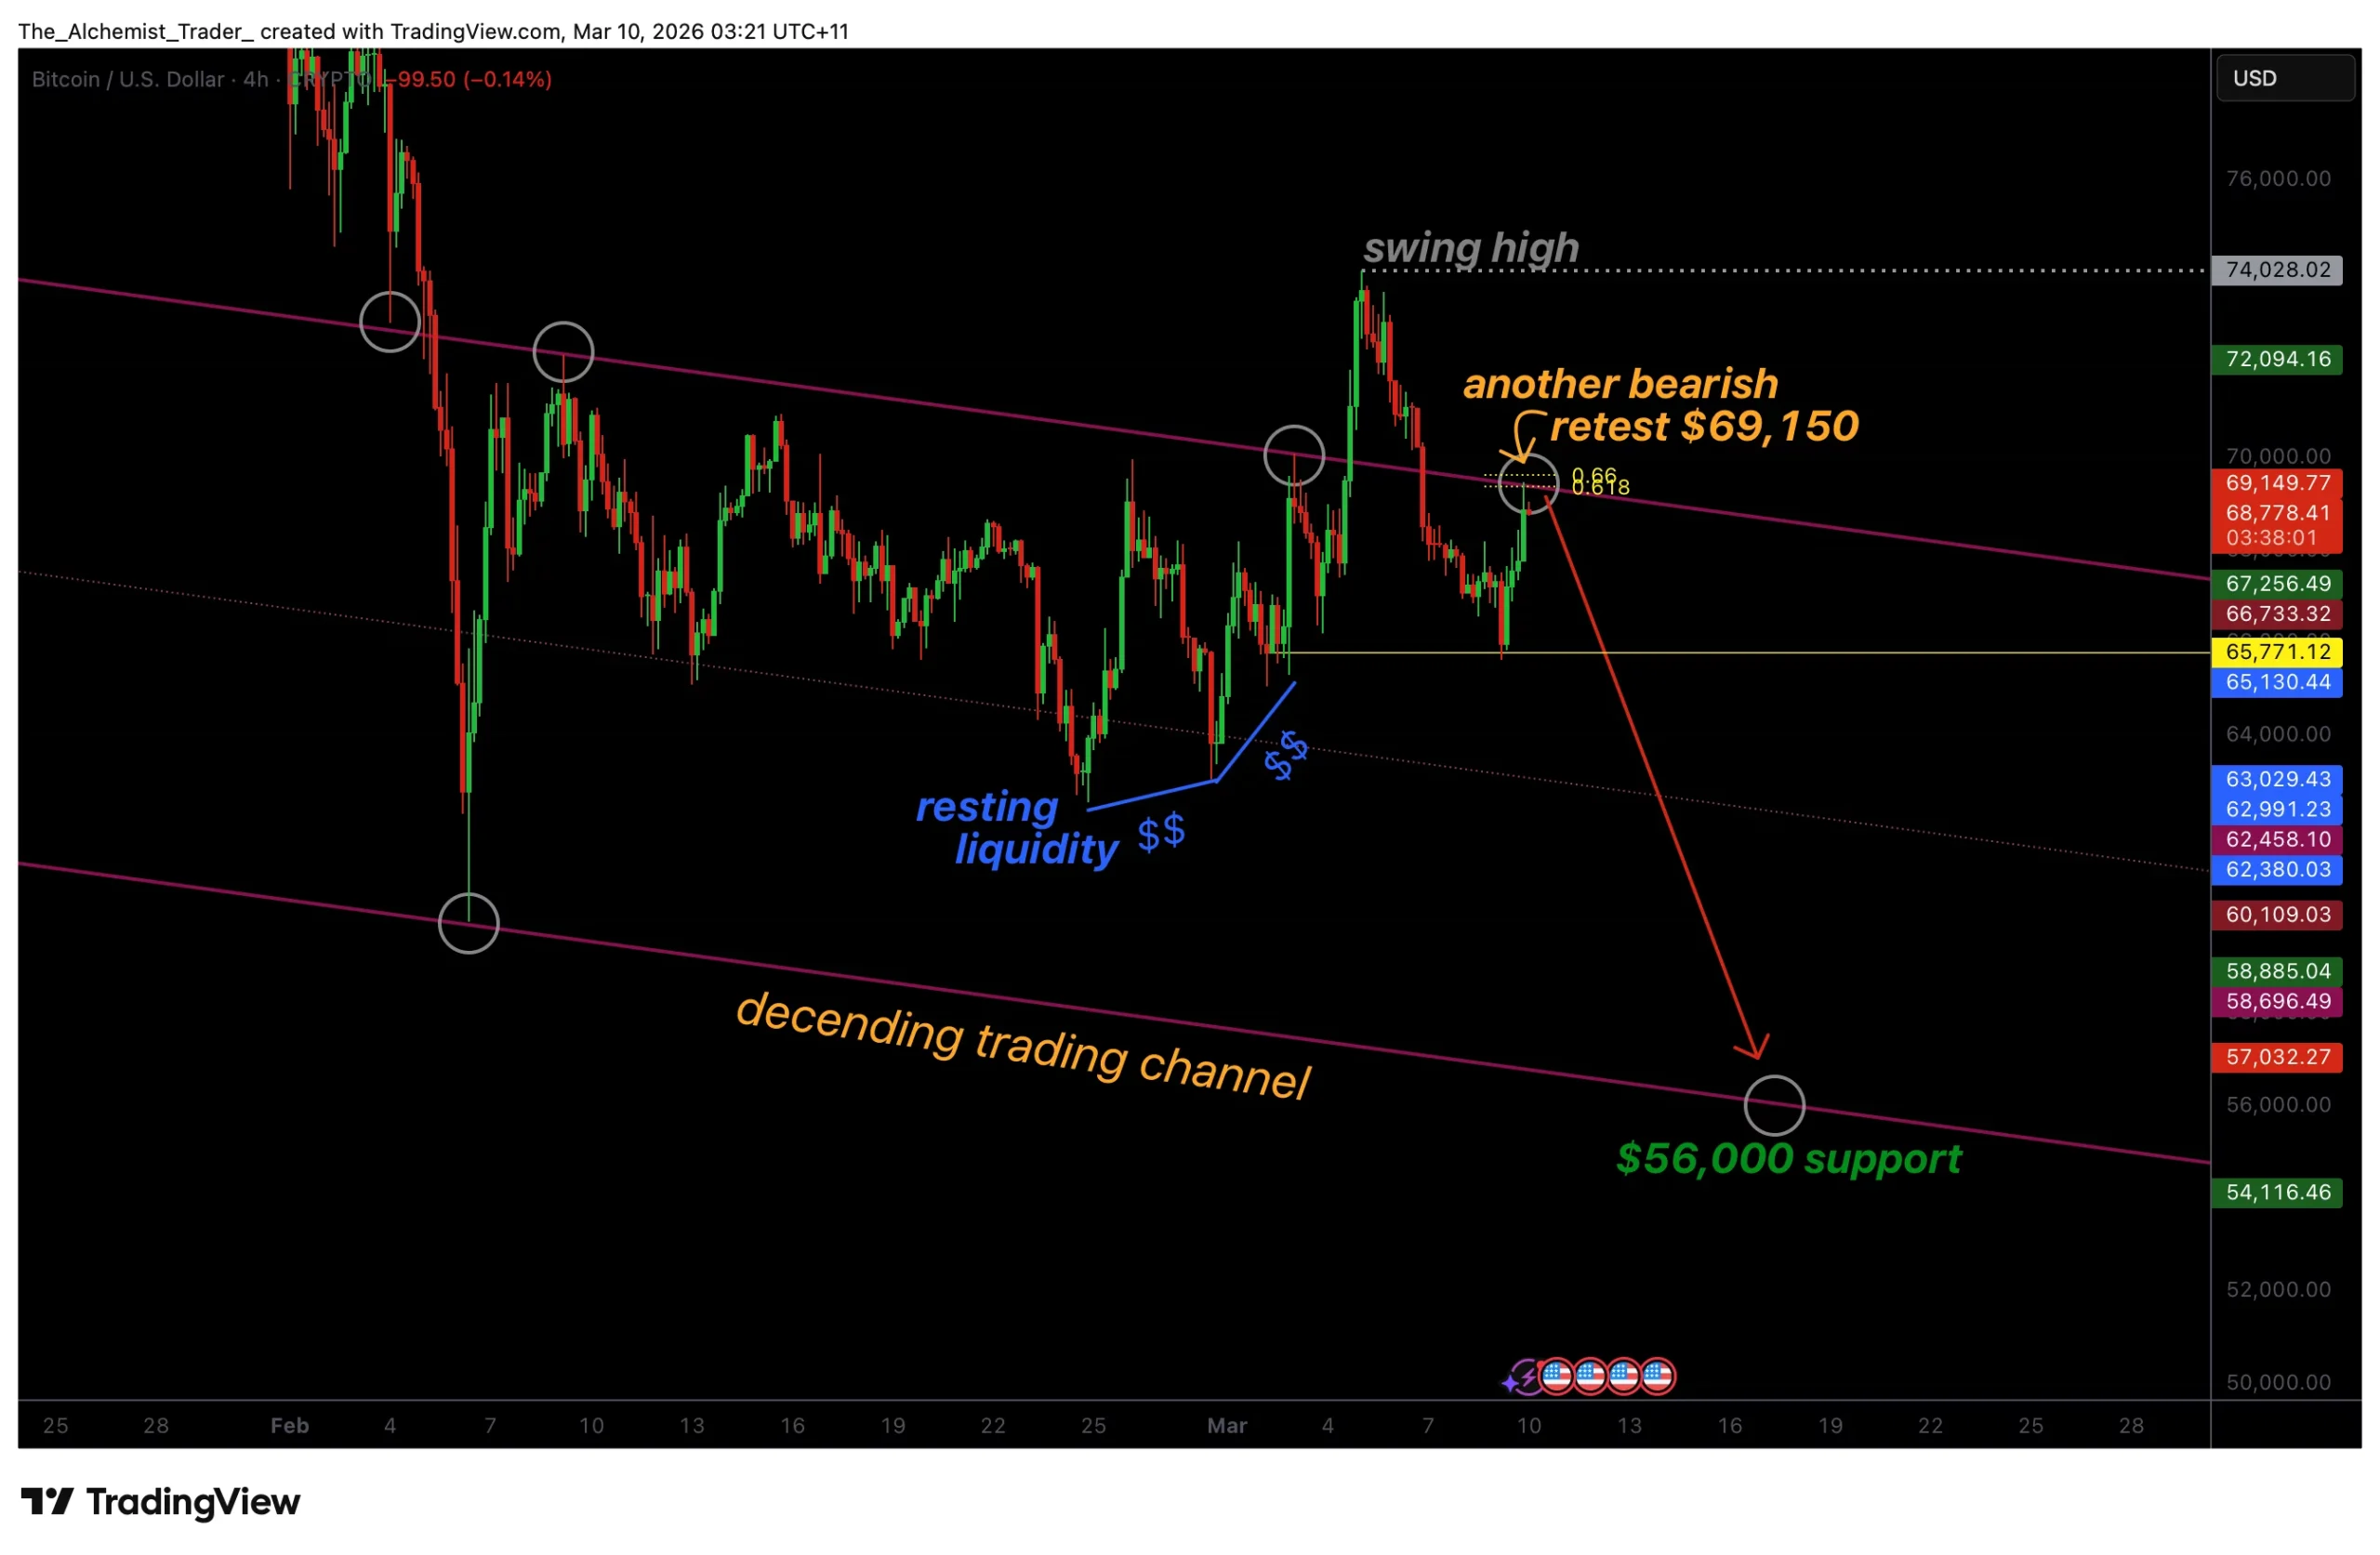
Bitcoin price rallies into channel resistance near $69,150. A rejection here could signal a bull trap and open the door for a rotation toward lower support near $56,000.
Summary
- Key Resistance: Bitcoin testing descending channel resistance near $69,150.
- Bull Trap Risk: Failure to break higher could confirm a bearish retest.
- Downside Target: Potential rotation toward $56,000–$58,000 support if rejection occurs.
Bitcoin (BTC) price action is currently approaching a critical resistance level that may determine the next major move in the market. After a recent recovery rally, BTC is now testing the upper boundary of a descending trading channel, a level that has historically rejected price on multiple previous attempts.
While the short-term rally may appear bullish, the broader technical structure suggests that the move could be setting up a potential bull trap if resistance continues to hold.
Bitcoin price key technical points
- Channel Resistance: Bitcoin is testing the descending channel resistance near $69,150.
- Deviation Confirmed: The recent swing high above the range was invalidated after price re-entered the trading range.
- Downside Target: A confirmed rejection could lead to a rotation toward $56,000–$58,000 support.
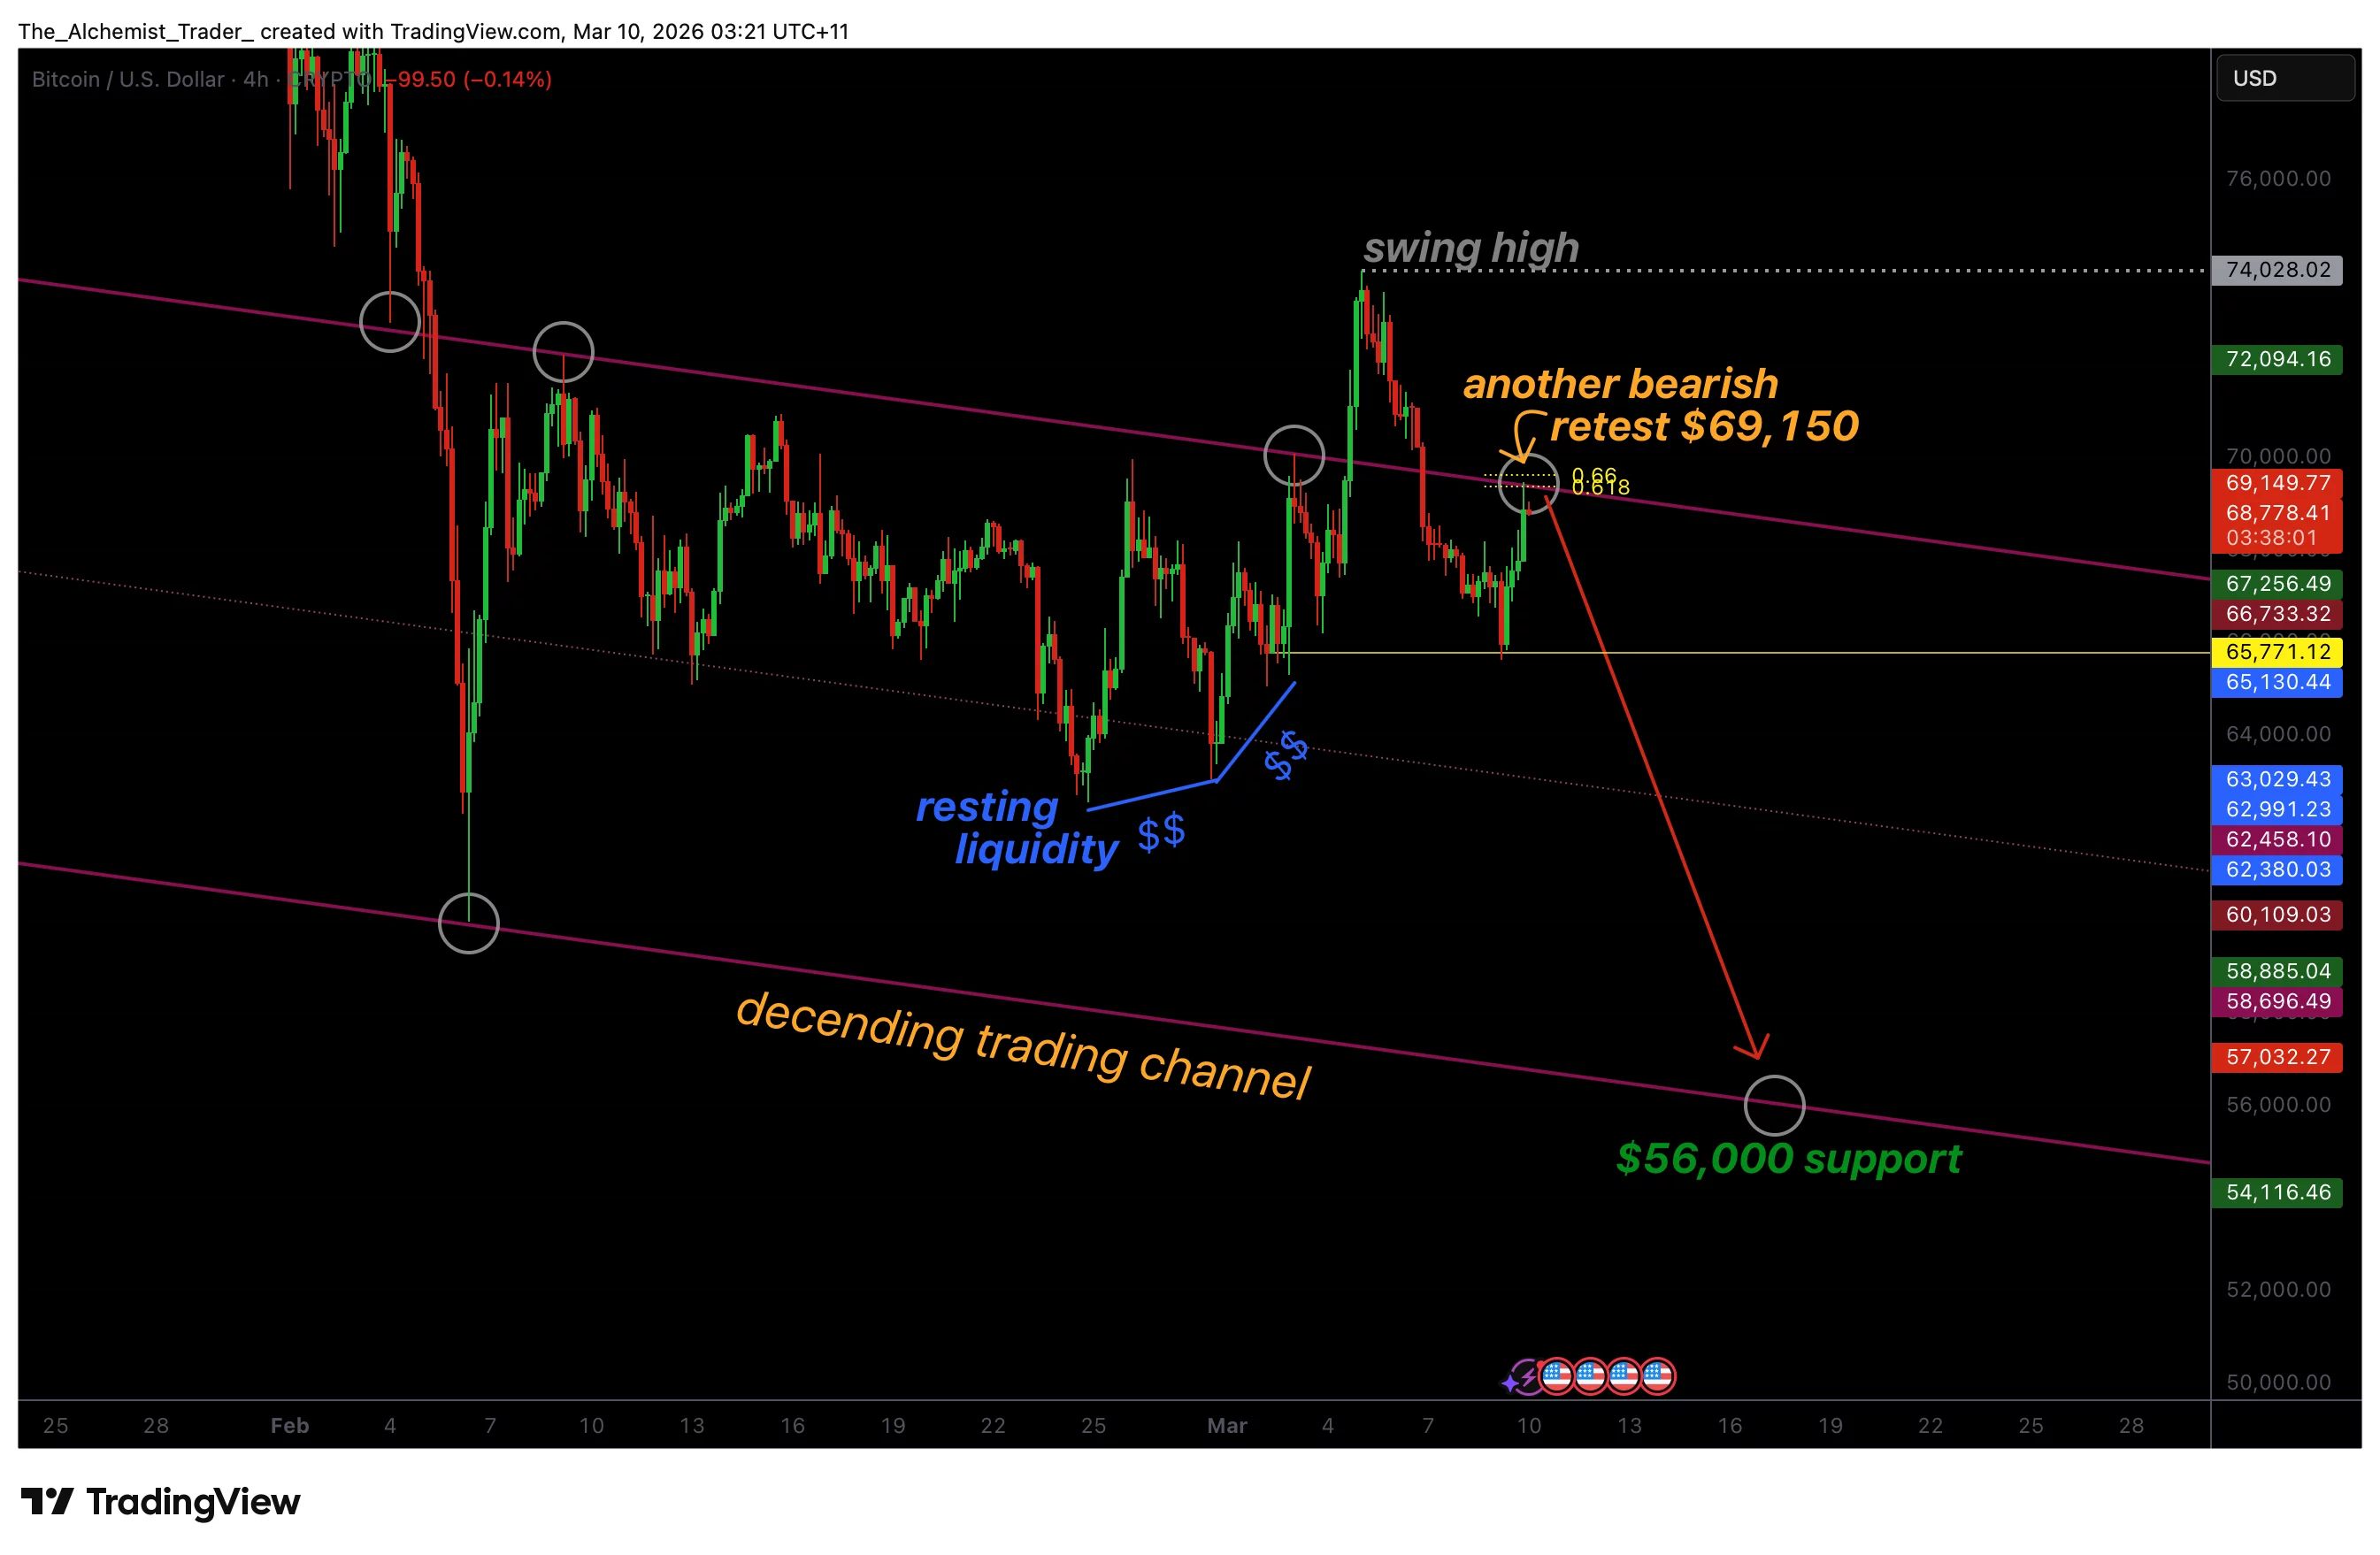
Bitcoin’s current rally has brought price back toward a key technical resistance within the descending channel structure. This channel has guided price action for several weeks, with the upper boundary acting as a consistent rejection zone. Each time Bitcoin approaches this region, sellers tend to step in, preventing price from establishing a sustained breakout.
The most recent swing high is particularly important in understanding the current market structure. That move initially appeared to signal bullish continuation, but the subsequent return back into the range revealed that the breakout lacked strength. In technical terms, this type of move is often referred to as a range deviation, where price temporarily breaks a key level before quickly reversing back into the prior trading environment.
With price now returning to test resistance near $69,150, the market may be forming a bearish retest of the same level that previously rejected price. Bearish retests occur when price rallies back into a resistance zone after failing to hold above it. If sellers defend this level again, it would reinforce the descending channel structure and increase the likelihood of another move lower.
This comes as Bitcoin has also surpassed 20 million mined coins, reinforcing its scarcity as macro volatility, lost BTC, and the network’s shift toward fee-driven security continue shaping its long-term future.
From a liquidity perspective, the market tends to move toward areas where stop orders and resting liquidity are concentrated. Currently, a large portion of this liquidity sits below the current price action. This includes liquidity pools that formed during previous consolidation phases, particularly around the lower boundary of the trading range.
Because of this liquidity imbalance, the probability of a downside rotation increases if resistance continues to hold. Markets frequently move toward these liquidity zones as they provide the necessary volume for larger participants to execute trades.
In Bitcoin’s case, this means the path of least resistance could potentially remain lower if buyers fail to push price above the channel resistance. This also comes as oil prices surging more than 60% this year amid rising tensions around the Strait of Hormuz, adding macro pressure to risk assets.
Another factor reinforcing the bearish scenario is the broader market structure within the descending channel. As long as price remains contained within this structure, rallies toward the upper boundary are typically considered corrective moves rather than trend reversals.
Without a decisive breakout above the channel resistance, the dominant trend remains neutral to bearish in the short term.
What to expect in the coming price action
Bitcoin is currently at a decisive technical level as price tests channel resistance near $69,150. If sellers reject this level once again, the probability increases for a rotation toward the lower support region between $56,000 and $58,000.
However, a sustained breakout above channel resistance would invalidate the bearish scenario and could shift momentum back in favor of the bulls.

A689 and Spring Lane in Sedgefield closed due to incidents

Odfjell SE (ODJBF) Presents at DNB Carnegie Energy & Shipping Conference – Slideshow
UK snow: Met Office details locations wintry weather to batter Brits amid -7C freeze

Smart energy pays enters the US market, targeting scalable financial infrastructure

Why Israel is blocking foreign journalists from entering

Bitcoin: We’re Entering The Most Dangerous Phase

TRUMP AND REPUBLICANS LIED ABOUT CRYPTO CBDC! EPIC XRP VS ADA DRAMA #xrp #ada #crypto #trump

Early Retirement Expert: A House Vs Stocks… (Here Is The Truth)

Paid Off My Debt and Immediately Made This Mistake #debtfree #finance #relatable
-

 Politics7 days ago
Alan Cumming Brands Baftas Ceremony A ‘Triggering S**tshow’
-
Business3 days ago
Form 8K Entergy Mississippi LLC For: 6 March
-

 Fashion3 days ago
Weekend Open Thread: Ann Taylor
-

 News Videos12 hours ago
10th Algebra | Financial Planning | Question Bank Solution | Board Exam 2026
-

 Crypto World8 hours ago
Paradigm, a16z, Winklevoss Capital, Balaji Srinivasan among investors in ZODL
-

 Tech5 days ago
Bitwarden adds support for passkey login on Windows 11
-
 Sports4 days ago
499 runs and 34 sixes later, India beat England to enter T20 World Cup final | Cricket News
-

 Sports2 days ago
Three share 2-shot lead entering final round in Hong Kong
-

 Sports2 days ago
Braveheart Lakshya downs Lai in epic battle to enter All England Open final | Other Sports News
-

 Business6 days ago
Guthrie Disappearance Enters Fifth Week as Family Visits Memorial
-

 NewsBeat4 days ago
Piccadilly Circus just unveiled ‘London’s newest tourist attraction’ and it only costs 80p to enter
-

 Politics4 days ago
Top Mamdani aide takes progressive project to the UK
-

 Business1 day ago
Search for Nancy Guthrie Enters 37th Day as FBI Probes Wi-Fi Jammer Theory
-

 Entertainment3 days ago
Hailey Bieber Poses For Sexy Selfies In New Luscious Lip Thirst Traps
-
 Sports7 days ago
Jack Grealish posts new injury update as Man City star enters crucial period
-

 Tech10 hours ago
Despite challenges, Ireland sixth in EU for board gender diversity
-

 Crypto World5 days ago
New Crypto Mutuum Finance (MUTM) Reports V1 Protocol Progress as Roadmap Enters Phase 3
-

 Tech5 days ago
ACIP To Discuss COVID ‘Vaccine Injuries’ Next Month, Despite That Not Being In Its Purview
-
Entertainment5 days ago
Harry Styles Has ‘Struggled’ to Discuss Liam Payne’s Death
-

 Business4 hours ago
Search Enters 39th Day with FBI Tip Line Developments and No Major Breakthroughs