

Crypto World
Bitcoin’s early crash to $60,000 now looks like a warning for stocks
Many see bitcoin as a safe-haven and store-of-value asset, like gold. But some currency traders treat it as a lead indicator for broader market mood, and they’ve been proven right again: Before finding stability near $70,000 recently, bitcoin plunged sharply, presaging the ongoing global stock market swoon.
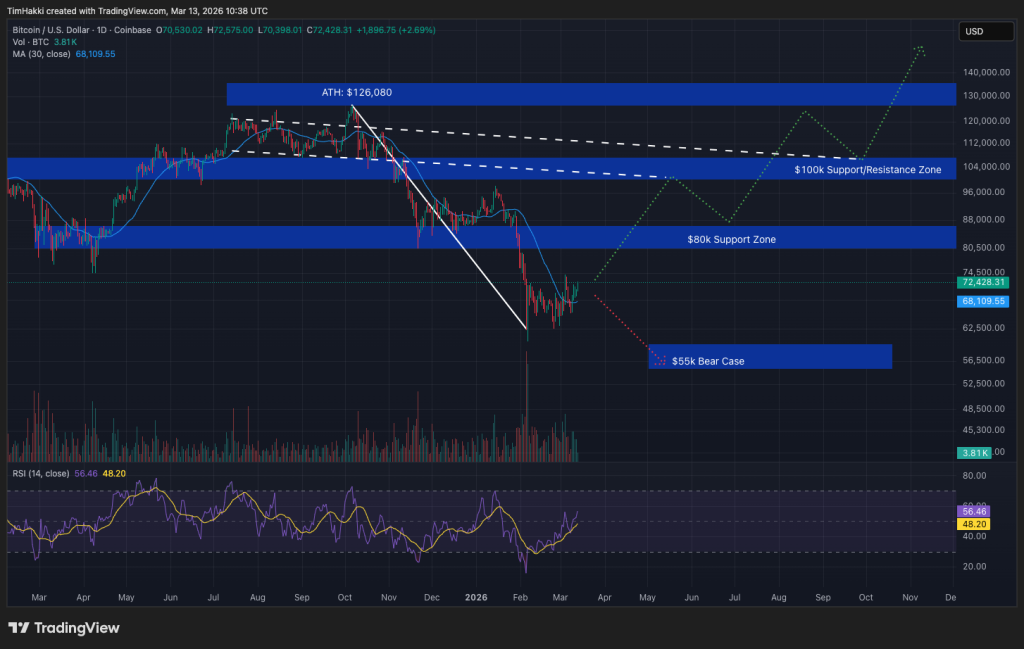
Bitcoin’s price peaked above $126,000 in early October and started falling, eventually hitting lows near $60,000 early last month. The sell-off featured rapid outflows from U.S.-listed spot ETFs. CoinDesk flagged this in January, questioning whether these flows – absent any clear crypto trigger – signaled an incoming macro economic blowup and stock market sell-off.
Fast forward to today: Global market sentiment has worsened, with the Iran war and oil price spike weighing heavily on Asian and European indices. The S&P 500 and Nasdaq have also come under pressure while the dollar index gains. Meanwhile, bitcoin has been rock steady around $70,000.
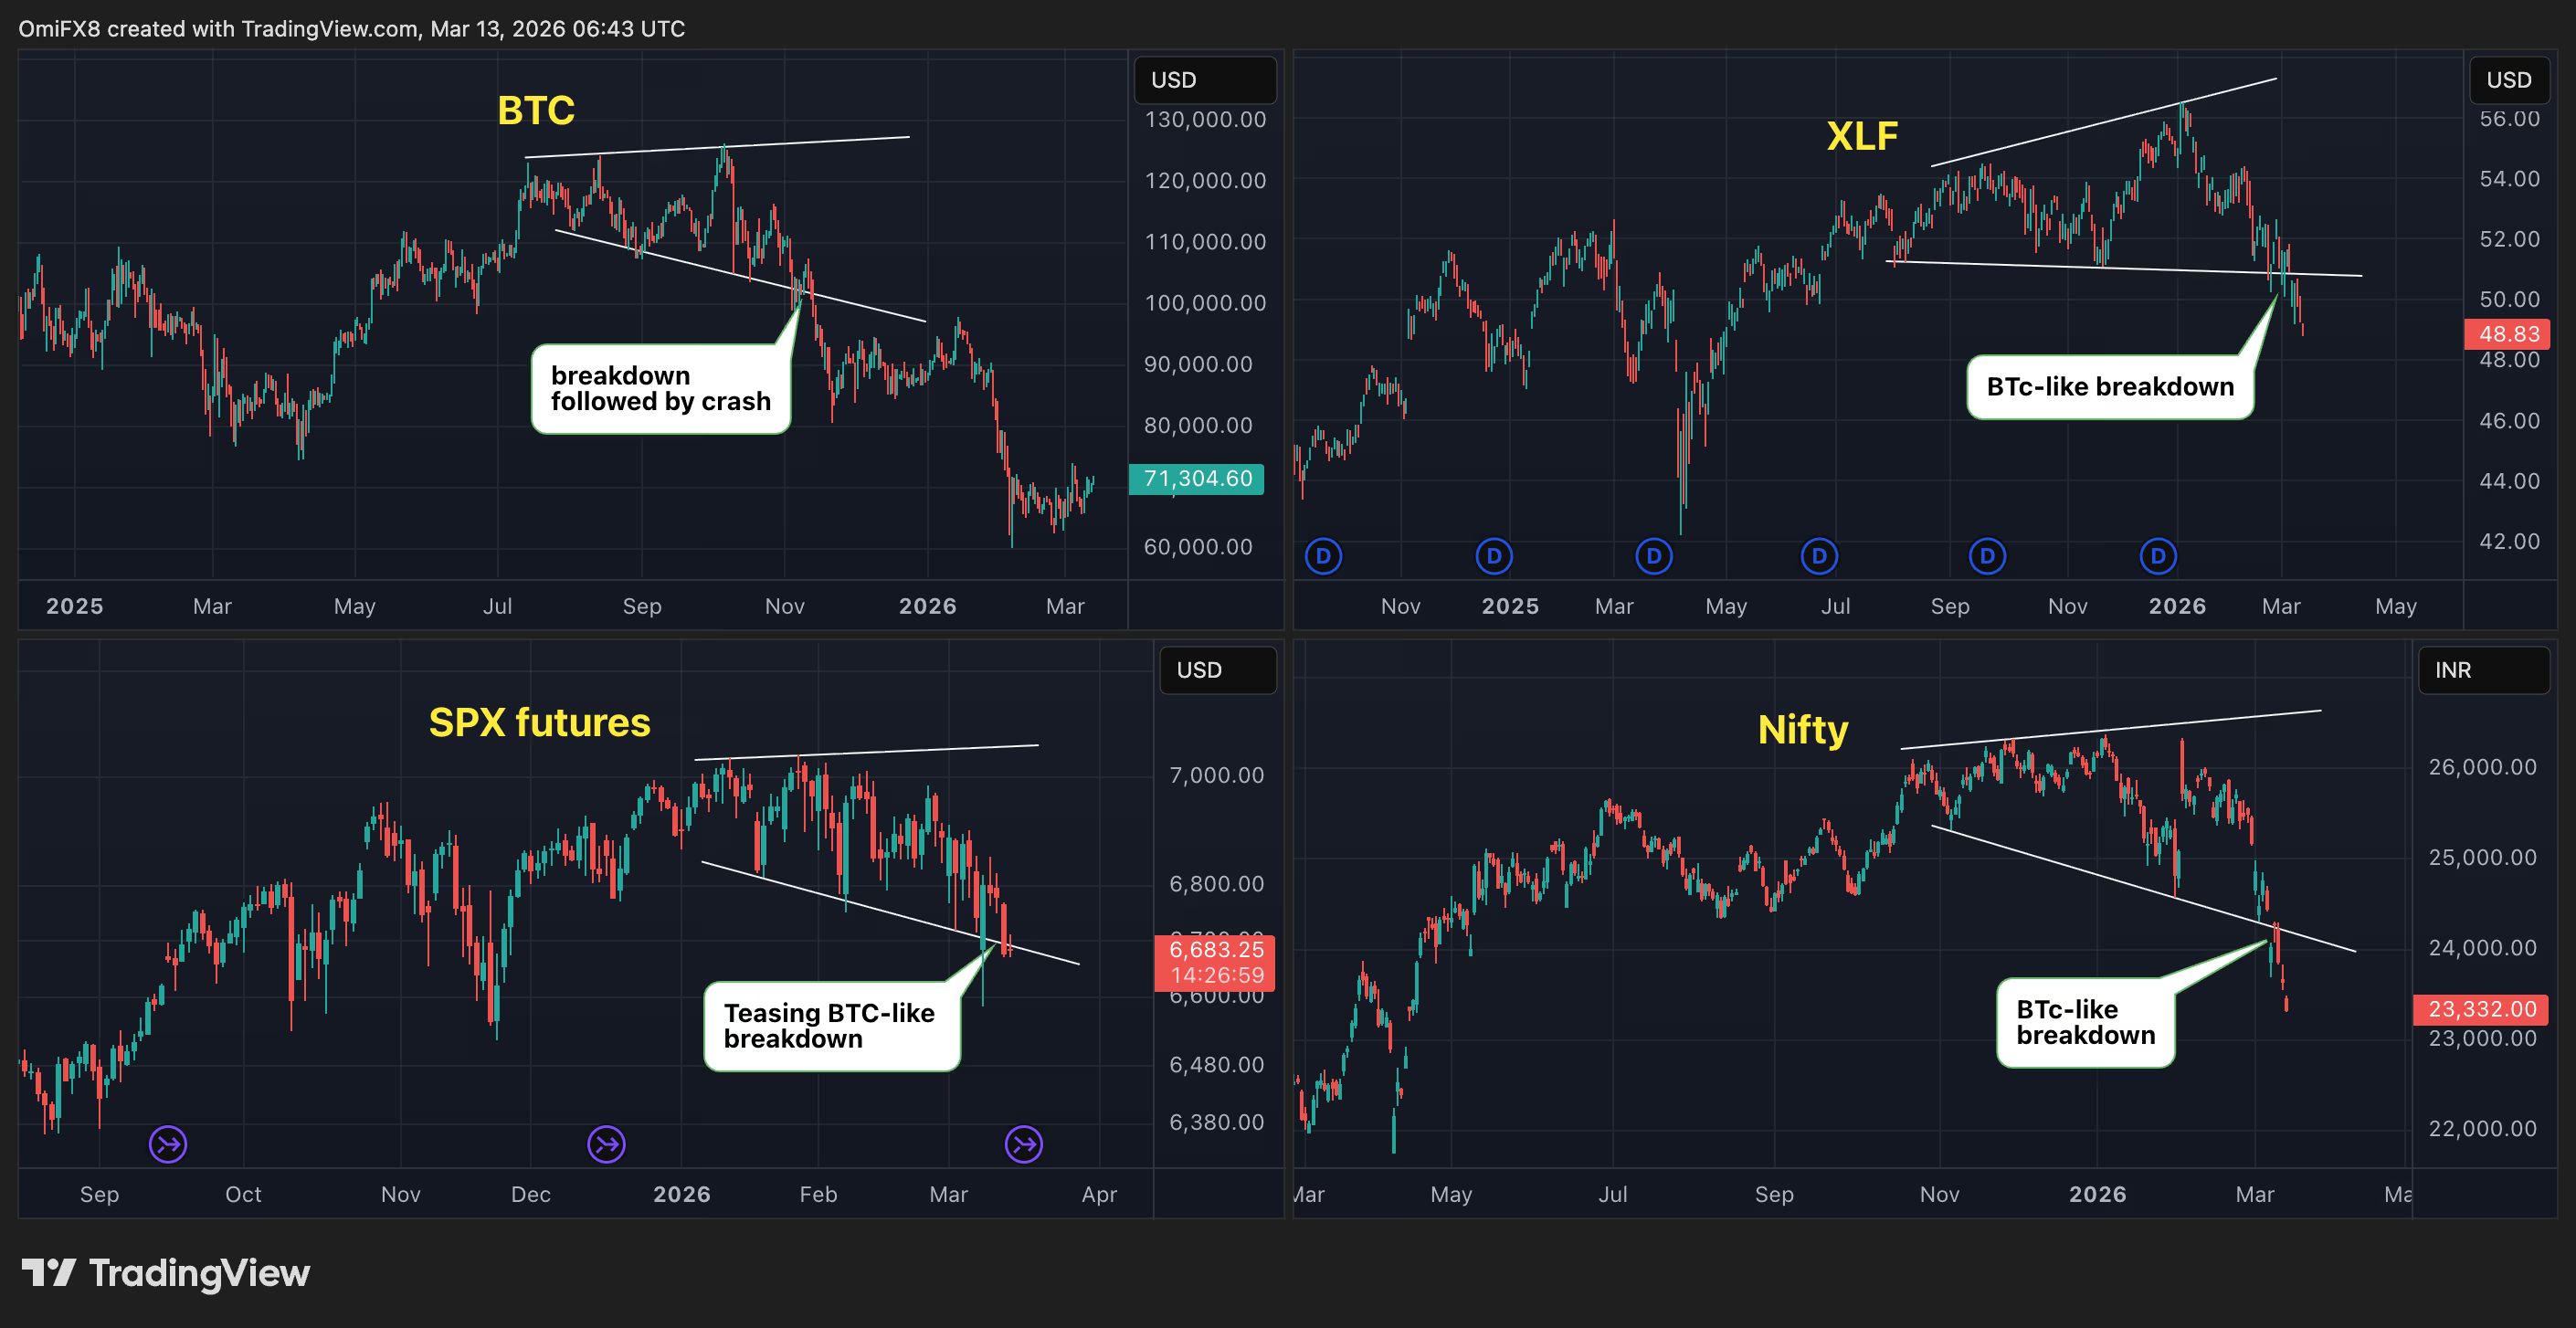
Here’s where it gets even more interesting: Key stock indices like the S&P 500 mirrored Bitcoin’s pre-crash back-and-forth trading in a broad range.

Bitcoin held above $100,000 for months in this volatile, expanding channel before plunging into bear territory. An identical setup has unfolded in the SPDR Financial Select Sector ETF (XLF), India’s Nifty (among the hardest hit), and S&P 500 futures.
Repeat of 2021-22
This isn’t the first time bitcoin has led price action in traditional risk assets. Over the years, the cryptocurrency has often foreshadowed equity trends, most clearly in late 2021-2022.

BTC peaked near $60,000 in November 2021 and quickly tanked to under $50,000 in a month. The bear market deepened in 2022. The Nasdaq and S&P 500 topped out two months later in January 2022, then followed suit with their own prolonged declines as the Federal Reserve raised borrowing costs rapidly.
Todd Stankiewicz, president and chief investment officer of SYKON Capital, in a blog post on the Chartered Market Technicial (CMT) Association website, noted bitcoin’s tendency to peak before the S&P 500 in three key instances: late 2017, weeks before the COVID crash, and late 2021.
“Bitcoin either rolled over or failed to make new highs while the S&P 500 pushed ahead. In each case, the equity rally eventually stalled and reversed,” Stankiewicz said.
All things considered, the takeaway is clear: Stock traders should start watching bitcoin trends closely from here.


The correlation between Bitcoin (BTC) and gold has snapped under the pressure of the Iran conflict, according to a note to investors by JPMorgan.
While geopolitical instability usually drives a unified bid for safe havens, the two assets are currently moving in opposite directions.
This decoupling reveals a significant shift in how capital is treating “digital gold” versus the real thing.
Instead of moving in tandem as crisis hedges, investors are aggressively rotating capital, creating a clear winner in the ETF market since late February.
Discover: The best crypto to buy now
What the JPMorgan ETF Flow Data Actually Shows About Bitcoin
Since the conflict escalated on Feb. 27, JPMorgan analysts report a stark divergence in capital flows. The largest gold ETF, SPDR Gold Shares (GLD), has bled outflows totaling roughly 2.7% of its assets under management.
Bitcoin vs gold ETF flows diverge — Yogita Khatri (@Yogita_Khatri5) March 12, 2026
 @jpmorgan analysts say since the Iran war:
• Largest gold ETF GLD saw 2.7% of AUM outflows
• Largest bitcoin ETF IBIT saw 1.5% of AUM inflows
The analysts also noted signs of bitcoin volatility compressing as institutional ownership… pic.twitter.com/oLvxrT83PK
In contrast, BlackRock’s iShares Bitcoin Trust (IBIT) absorbed inflows equaling roughly 1.5% of its assets during the same window.
JPMorgan analysts, led by Managing Director Nikolaos Panigirtzoglou, highlighted in their recent note to investors that this reverses the trend seen earlier in the year when gold funds held the advantage.
The data is unambiguous. While gold has traditionally been the default safety trade during Middle East tensions, capital is currently voting for Bitcoin exposure.
Institutional positioning generally reflects a shift away from bullion in favor of the spot Bitcoin ETFs, despite the higher volatility inherent in crypto assets.
Interestingly, IBIT inflows since the start of 2024 are now roughly double the total accumulation seen by GLD, further cementing the shift in dominance among exchange-traded products.
Is Bitcoin Replacing Gold as the Crisis Hedge?
The divergence goes deeper than headline flows. JPMorgan notes that while spot Bitcoin ETFs are seeing inflows, institutional derivatives markets paint a more cautious picture. Hedge funds appear to be reducing direct Bitcoin exposure even as ETF buyers step up.
Short interest in IBIT has actually increased since the conflict began, while GLD short interest declined. This narrows the gap between the two, suggesting that hedge funds are hedging their crypto bets while favoring gold for pure defensive positioning.
BlackRock's spot Bitcoin ETF, IBIT, is now being accepted as collateral for loans at JPMorgan.
Here we gohttps://t.co/Xif0FRby1B pic.twitter.com/aEgyZujN4T
— Joe Consorti (@JoeConsorti) June 4, 2025
This creates a complex market structure. Retail and registered investment advisors (RIAs) are likely driving the ETF bid, treating Bitcoin as a risk-off asset alongside the dollar. Meanwhile, sophisticated desks are hedging downside risk as oil surges past $100, a macro factor that typically pressures risk assets.
Options activity supports this cautious institutional stance. The demand for downside protection in Bitcoin has risen, contrasting with the relentless buying pressure in the spot ETF market. However, the sheer magnitude of the rotation, selling gold to buy Bitcoin, suggests the “digital gold” narrative is holding up under fire better than skeptics anticipated.
Bitcoin Price Prediction: Can BTC Hold the $70,000 Level?
Price action remains resilient despite the mixed signals from derivatives markets. Even with war-driven inflation fears dominating the headlines, Bitcoin is trading above $70,000, showing strength where legacy assets have faltered.
Bull Scenario: If ETF inflows persist at this 1.5% pace, Bitcoin targets the $80,000 resistance band. Clearing that level opens the path to retest all-time highs. JPMorgan’s own valuation models have previously flagged Bitcoin as undervalued relative to gold regarding volatility-adjusted capital, suggesting room for an upside squeeze.
Bear Scenario: Should macro liquidity tighten further, support sits firm at $64,000. A break below this level would validate the rising short interest and likely force a flush of the recent leverage. Traders must watch the $70,000 midpoint closely; losing it would signal that the safe-haven bid has exhausted itself.
The next major catalyst isn’t just on the chart; it’s at the Federal Reserve. If oil prices stay high, inflationary pressure could force central banks to keep rates elevated longer, testing the resilience of both gold and Bitcoin.
Discover: The next crypto to explode
The post JPMorgan Flags Sharp Divergence Between Bitcoin and Gold ETF Flows Since Iran War appeared first on Cryptonews.
HSBC Holdings and a joint venture led by Standard Chartered are reportedly set to become the first authorized stablecoin issuers in Hong Kong.
The Hong Kong Monetary Authority (HKMA) is expected to issue stablecoin licenses to HSBC and Standard Chartered, the South China Morning Post reported Thursday, citing people familiar with the matter. HSBC and Standard Chartered are set to be in the first batch as authorities reportedly prioritize institutions already authorized to issue banknotes in the city.
The Hong Kong government, through the HKMA, authorizes banknote issuance to three commercial banks, including local branches of HSBC, Standard Chartered and the Bank of China.
The Hong Kong Monetary Authority has not confirmed the names of any successful applicants. Standard Chartered declined to comment, and HSBC did not immediately respond to a request for comment.
The approvals would mark a major step toward Hong Kong’s ambition to become a global digital asset hub despite neighboring mainland China reportedly making it harder to launch stablecoins in the region.
HKMA targets the first stablecoin licenses in March
According to the SCMP, the number of licenses and timetable had yet to be finalized and remained subject to change, but the sources indicated a possible date on March 24.
Though unconfirmed, potential stablecoin issuer licenses for HSBC and Standard Chartered would align with earlier reports that the HKMA planned to grant the first licenses in March 2026.

HKMA Chief Executive Eddie Yue said in February that the regulator expects the first batch of stablecoin issuer licenses to include a “very small number” of issuers.
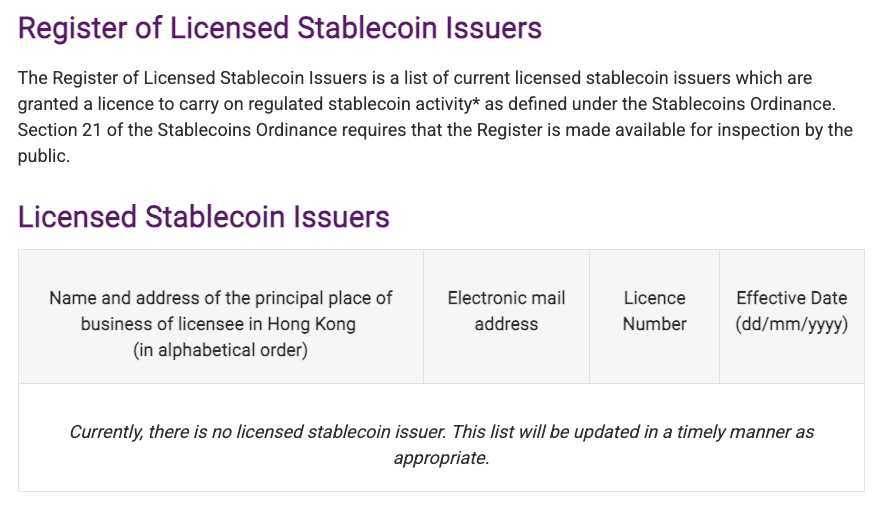
The Hong Kong government enforced the Stablecoin Ordinance, a statutory framework for regulating stablecoins, in August 2025, making it illegal to offer or promote unlicensed fiat-referenced stablecoins to retail investors.
Related: China’s Alibaba joins stablecoin platform MetaComp’s $35M fundraise
In September, the HKMA said it received applications from 36 institutions for a license to issue stablecoins. HSBC and Standard Chartered were among the institutions that were reported to be planning to apply, alongside the Industrial and Commercial Bank of China.
Magazine: China’s ‘50x’ blockchain boost, Alibaba-linked AI mines Bitcoin: Asia Express

The price of Pi Network surged more than 30% on March 13 after a fresh exchange listing and growing anticipation around the project’s upcoming Pi Day event.
Summary
- Pi Network’s token surged more than 30% after being listed on Kraken.
- A mainnet protocol upgrade and Pi Day hype are adding to bullish sentiment.
- Technically, $0.30 is the next resistance, while $0.25 acts as key support.
According to data, the token climbed roughly 31% in a single day, driven primarily by the listing of PI on Kraken, one of the largest global crypto exchanges.
The listing significantly expanded trading access to the asset and sparked renewed interest among traders.
In addition to the exchange listing, the Pi Network ecosystem is currently undergoing a mainnet protocol upgrade tied to Step 3 node migration, which could further strengthen network infrastructure as the project progresses through its development roadmap.
Market enthusiasm is also building ahead of Pi Day, an annual event celebrated by the Pi community that often coincides with ecosystem announcements and product updates.
The combination of a major exchange listing, technical upgrades and community momentum has helped fuel the token’s latest rally.
Pi Network coin price analysis
The attached price chart shows PI breaking out of a multi-week consolidation phase. The token recently traded around $0.29, climbing sharply from roughly $0.21 earlier this month, reflecting a strong bullish move.
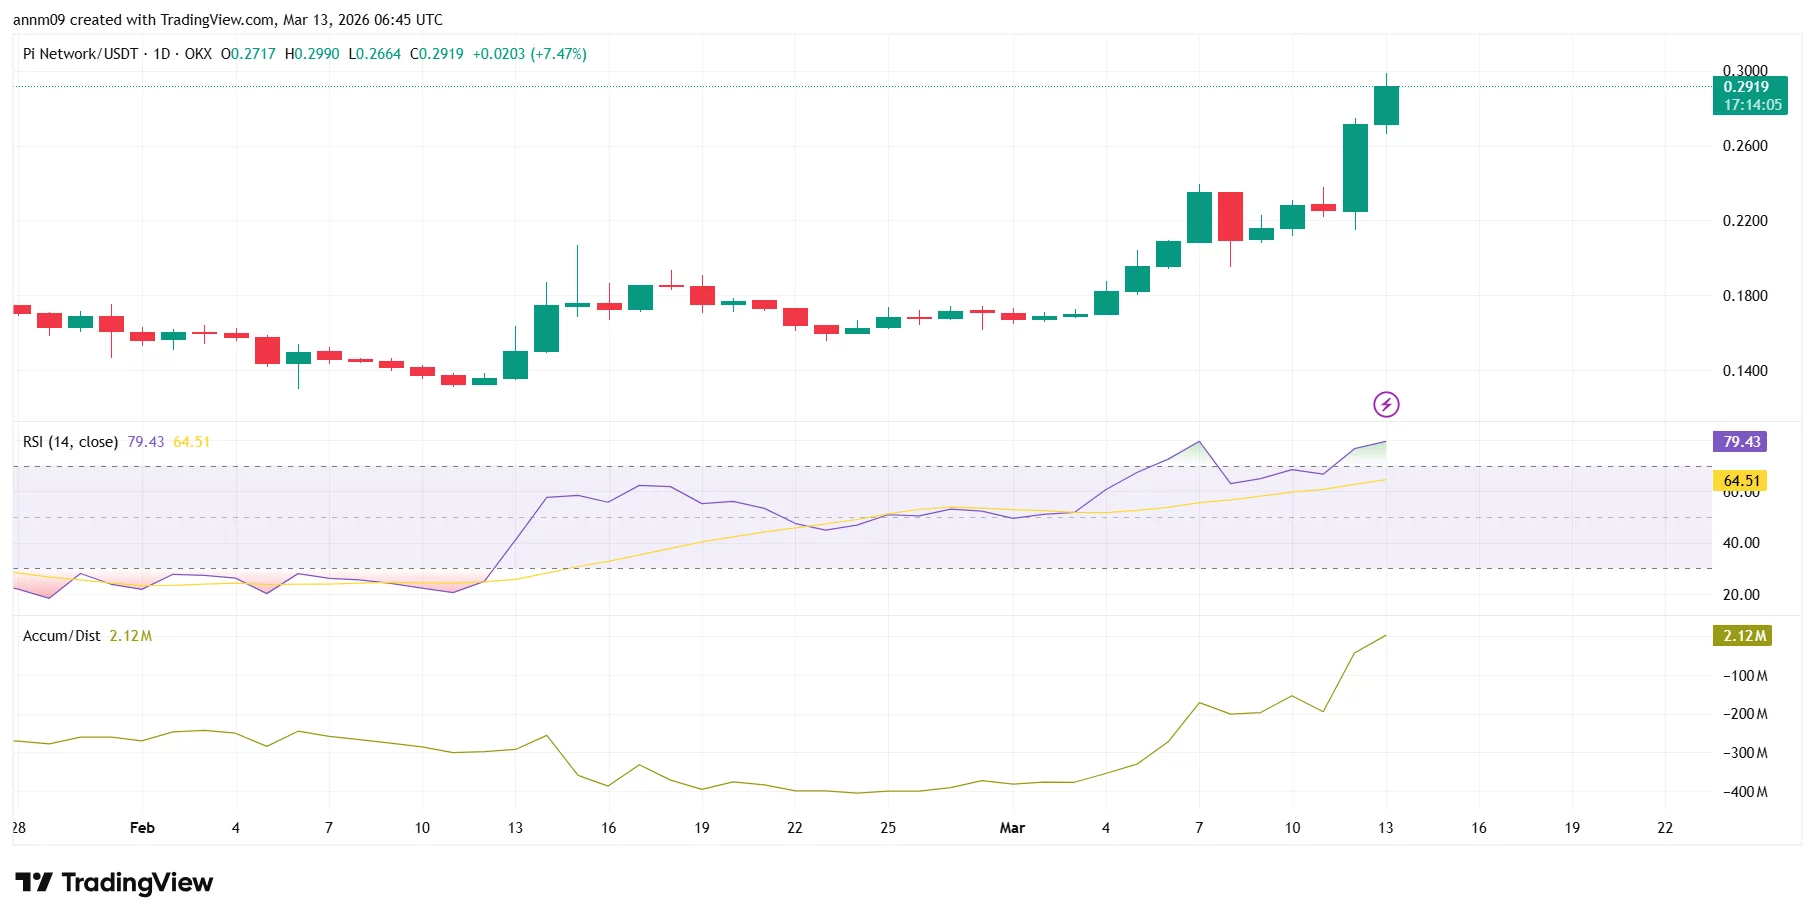
Momentum indicators also point to increasing buying pressure. The relative strength index (RSI) sits near 70, indicating strong upward momentum but also approaching overbought territory.
This suggests the rally could continue in the short term, though some traders may watch for potential profit-taking.
From a technical perspective, $0.30 represents the next key resistance level, a psychological barrier that could determine whether the rally extends further. On the downside, support appears near the $0.25 region, which previously acted as a breakout zone during the latest price surge.
If buying pressure continues into Pi Day, analysts say the token could see additional volatility as traders react to potential announcements from the Pi Network team.


Bitcoin rose through $72,000 during European hours on Friday, rising by 2% since midnight UTC and outpacing gains in U.S. equity indexes.
Futures on the Nasdaq 100 and S&P 500 index dropped during Asian trading hours before recovering. Both are now in the green. The U.S. Dollar Index (DXY), meanwhile, broke above 100, a move that typically puts pressure on risk assets like cryptocurrencies and stocks.
Today, however, the crypto market seems relatively immune to that pressure, with notable gains across the board. The CoinDesk 20 Index (CD20) is 1.1% higher since midnight.
If bitcoin can break above $74,000, a level it has failed to penetrate recently, on convincing volume, it might trigger a breakout back to the $80,000 region. Otherwise, it is likely to revert to a trading range that dates back to Feb. 5.
The war in Iran continued to rage Friday morning, with fresh strikes being detected in Tehran and Dubai, keeping oil around $100 per barrel.
Derivatives positioning
- Cumulative industry-wide futures open interest (OI) increased 5% to $107.6 billion over the past 24 hours, signaling continued capital inflows as bitcoin and other tokens remain rock steady amid turmoil in global equity markets.
- Bitcoin’s (OI) rose to 687,200 BTC, the most since Feb. 25. Ether’s (ETH) grew to 13.72 million, the highest since Jan. 30. Annualized perpetual funding rates and cumulative volume deltas for both remain positive, a combination indicating investor bias toward bullish plays.
- In XRP, OI surged nearly 10% to $1.86 billion, the most since Feb. 6. Coupled with positive funding rates, this suggests renewed investor capital deployment for bullish bets. Open interest in SOL, ADA and SUI futures also saw notable increases.
- Bitcoin’s annualized 30-day implied volatility index (BVIV) dropped to a two-week low of 55%, supporting the case for continued spot price rallies. Ether’s volatility is falling as well. This stability contrasts with heightened volatility in the U.S. Treasury market.
- On Deribit, bitcoin puts remain pricier than calls, a sign of lingering demand for downside protection. For ETH, the put premium at the long end has nearly evaporated, hinting at a bullish reset.
- Block flows featured demand for bitcoin put spreads and ether call spreads.
Token talk
- The altcoin market also showed strength on Friday. U.S.- president-themed memecoin TRUMP surged by more than 30% in 24 hours after the announcement of a “gala luncheon” with Donald Trump for the top 297 token holders.
- Artificial intelligence (AI) tokens bittensor (TAO) and artificial super intelligence alliance (FET) both climbed by 14% as investors continue to speculate on a wider market breakout.
- CoinMarketCap’s “Altcoin Season” index is now at 40/100, its highest point since Jan. 9.
- CoinDesk’s Computing Select Index (CPUS) is the leading benchmark over the past 24 hours, having increased by 6.5%. It is followed by the CoinDesk Memecoin Index (CDMEME) and the DeFi Select Index (DFX), which are up by 4% and 3.7%, respectively.
- One laggard over the past 24 hours has been canton (CC). The token of the institutional-focused layer-1 network is down by 4%, taking its loss over the past month to 11%.

TLDR:
- Ripple secures Australia AFSL license, enabling regulated payment services and expanding XRP settlement infrastructure across APAC markets.
- XRP exchange outflows dominate recent data, signaling reduced sell-side liquidity despite broader crypto market pressure.
- XRP trades near $1.38 with declining weekly performance as market flows and infrastructure developments shape investor sentiment.
- XRP price outlook draws attention as regulatory progress and market flows shape current sentiment. Ripple recently secured an Australian Financial Services Licence in Australia.
XRP price outlook draws attention as regulatory progress and market flows shape current sentiment. Ripple recently secured an Australian Financial Services Licence in Australia. Meanwhile, XRP trades near $1.38 amid ongoing exchange outflows and cautious market conditions.
Ripple Expands Regulatory Footprint in Australia
A tweet from X Finance Bull reported that Ripple secured an Australian Financial Services Licence in Australia. The development enables regulated payment services across the country and the wider Asia-Pacific region.
The license allows Ripple to offer compliant payment operations through its enterprise payment network. Financial institutions may now access cross-border settlement solutions within the regulated Australian framework.
Industry observers view regulatory licensing as essential for institutional integration. Payment providers typically require legal clarity before adopting blockchain-based settlement systems.
Ripple’s regulatory entry positions the company within established financial infrastructure. The development expands Ripple’s presence in APAC financial markets and institutional payment corridors.
Institutional Settlement Pathways for XRP and RLUSD
An analyst noted institutions may access compliant settlement using XRP and RLUSD. The structure supports cross-border payments through a regulated digital asset infrastructure.
Stablecoins and bridge assets often serve different roles within settlement frameworks. RLUSD may provide price stability, while XRP supports rapid liquidity conversion between currencies.
Australia holds strong financial ties with regional economies across Southeast Asia and the Pacific. Payment corridors linking these markets may benefit from faster blockchain settlement systems.
Institutional participation often depends on licensing, banking partnerships, and regulatory clarity. Ripple’s expansion within Australia, therefore, strengthens the operational framework for enterprise payments.
Exchange Flows Show Persistent XRP Outflows
Data from CoinGlass tracks XRP spot inflow and outflow activity across cryptocurrency exchanges. The chart shows frequent exchange withdrawals through extended periods.
Exchange outflows typically indicate assets leaving trading platforms for private custody. Market participants often interpret sustained withdrawals as reduced immediate sell-side supply.
Several large netflow events appear between July and November. One spike approaches roughly $180 million in negative netflow during that period.
Despite these withdrawals, the XRP price trended lower through much of the observed timeline. Market demand appears weaker while broader crypto market conditions remain cautious.
Short inflow spikes appear across several trading sessions. Deposits often coincide with temporary price recoveries or volatility events.
Exchange inflows generally suggest traders may prepare to sell or rebalance positions. Such patterns frequently occur during short-term rallies.
The yellow price line on the chart shows a gradual decline from above $3.00. The asset later stabilized near the $1.40-$1.60 range.
At the time of writing, XRP trades near $1.38. The asset recorded about $2.35 billion in daily trading volume.
Market performance shows a slight 24-hour gain near 0.04%. Weekly performance remains negative with roughly a 2.86% decline.
Exchange flows and regulatory progress continue shaping the XRP price outlook. Market participants watch whether reduced supply eventually supports price stabilization.


Can XRP indeed skyrocket by over 3,000%?
Ripple’s cross-border token has showcased some mind-blowing price moves during its existence, and even in more recent years, when it became a household altcoin worth tens and even hundreds of billions of dollars.
Now, though, popular analyst Ali Martinez has made a bold claim that it could surge to $48 during the next bull run. He based these rather far-fetched (at the moment) findings on XRP’s multi-year triangle chart.
A multi-year triangle on $XRP points to $48 as a potential target for the next bull run. pic.twitter.com/QSZpGrIXn3
— Ali Charts (@alicharts) March 13, 2026
Can It Really, Though?
Even after today’s 4% surge, Ripple’s token trades at just over $1.40. This means that it would have to stage a hard-to-believe run of approximately 3,300% to reach Martinez’s target. We are not saying that this is impossible, but let’s put some perspective on what such a price tag would mean.
If XRP indeed taps $48 per token, this would mean that its market cap would skyrocket to a whopping $3 trillion level. And, this is based on XRP’s current supply, which, as we know, expands every month. Again, not that this is impossible, but it would break even bitcoin’s record, as the market leader’s peak in October 2025 was well below the $3 trillion mark.
In fact, XRP’s market cap would match Microsoft’s and surpass giants like Saudi Aramco, Meta, Tesla, and Amazon.
Obviously, such a rally would require time. Perhaps a few years until the peak of the next bull rally. And, XRP has shown in the past that it could post some incredible gains. But even during its post-US-election rally, when it skyrocketed from $0.50 to $3.60 in less than a year, its gains were a lot more modest – 620%. If it is to materialize the $48 target, it would need to be 5-6x that, which, again, is not impossible but highly, highly unlikely.
You may also like:
Let’s Be More Realistic
Let’s leave the aforementioned big target away and focus more on the current XRP moves. Analyst CW noted earlier today that the token has begun to break out of its first sell wall, which is located around the $1.43 resistance. If it falls, the subsequent one is at around $1.50, meaning that there are quite a few obstacles before the breakout succeeds.
Nevertheless, the analyst doubled down that net buying of long XRP positions on the world’s largest crypto exchange has increased “significantly” lately, which could be the necessary push for that aforementioned breakout.
Net buying of long positions for $XRP on Binance is increasing significantly. pic.twitter.com/8vwOTASFvp
— CW (@CW8900) March 13, 2026
The Bollinger Bands on XRP’s trading chart are also squeezing, suggesting a major move ahead after a long period of sideways trading. However, the indicator doesn’t provide any hints in which direction the move would go.
Binance Free $600 (CryptoPotato Exclusive): Use this link to register a new account and receive $600 exclusive welcome offer on Binance (full details).
LIMITED OFFER for CryptoPotato readers at Bybit: Use this link to register and open a $500 FREE position on any coin!
The price of Bitcoin climbed to a weekly high on March 13, defying geopolitical concerns tied to rising tensions between the United States and Iran.
Summary
- Bitcoin price reached a weekly high near $72,000, holding above the $70K level.
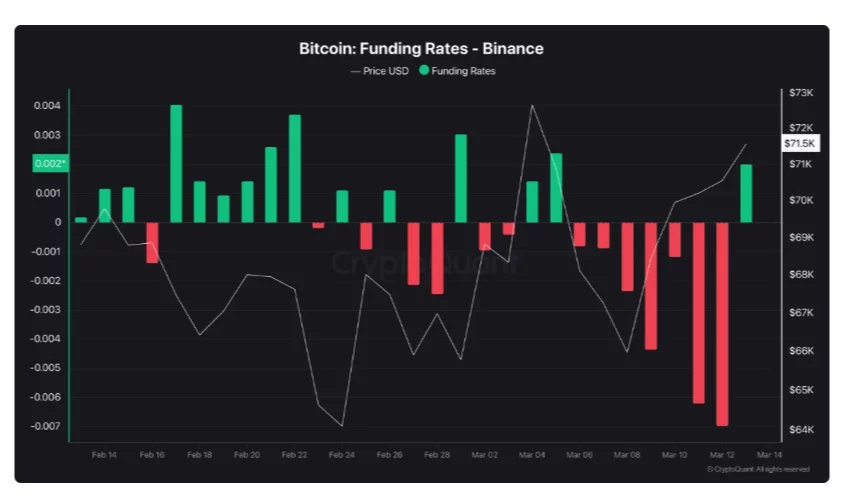
- Negative funding rates on Binance suggest many traders are still shorting the rally.
- A potential short squeeze could push BTC toward $75K if the rebound continues.
Bitcoin (BTC) was trading around $71,400, up about 1.2% on the day, according to the chart data, after briefly touching an intraday high near $72,000. The move pushed the world’s largest cryptocurrency back above the key $70,000 psychological level.
The rebound comes despite a fragile macro environment. Ongoing geopolitical tensions and concerns surrounding global oil markets have weighed on broader risk sentiment, conditions that typically make it difficult for speculative assets like Bitcoin to outperform.
However, on-chain data suggests that many traders remain skeptical about the rally.
According to market insights from CryptoQuant, derivatives market positioning shows a growing bearish bias among investors. Funding rates on Binance have remained negative for roughly a week, indicating that a majority of leveraged traders are betting against further price gains.

On March 10 and March 11, funding rates on Binance reportedly dropped below −0.006, an unusually negative level that signals strong short positioning in the market.
This dynamic could paradoxically support further upside for Bitcoin.
Historically, when funding rates reach extreme levels and a strong consensus forms around a bearish outlook, markets sometimes move in the opposite direction. If Bitcoin continues to push higher, short sellers may be forced to close positions, triggering a short squeeze that could accelerate the rally.
Bitcoin price analysis
The attached chart shows BTC gradually recovering from its February lows near $63,000, forming a sequence of higher lows in recent weeks.
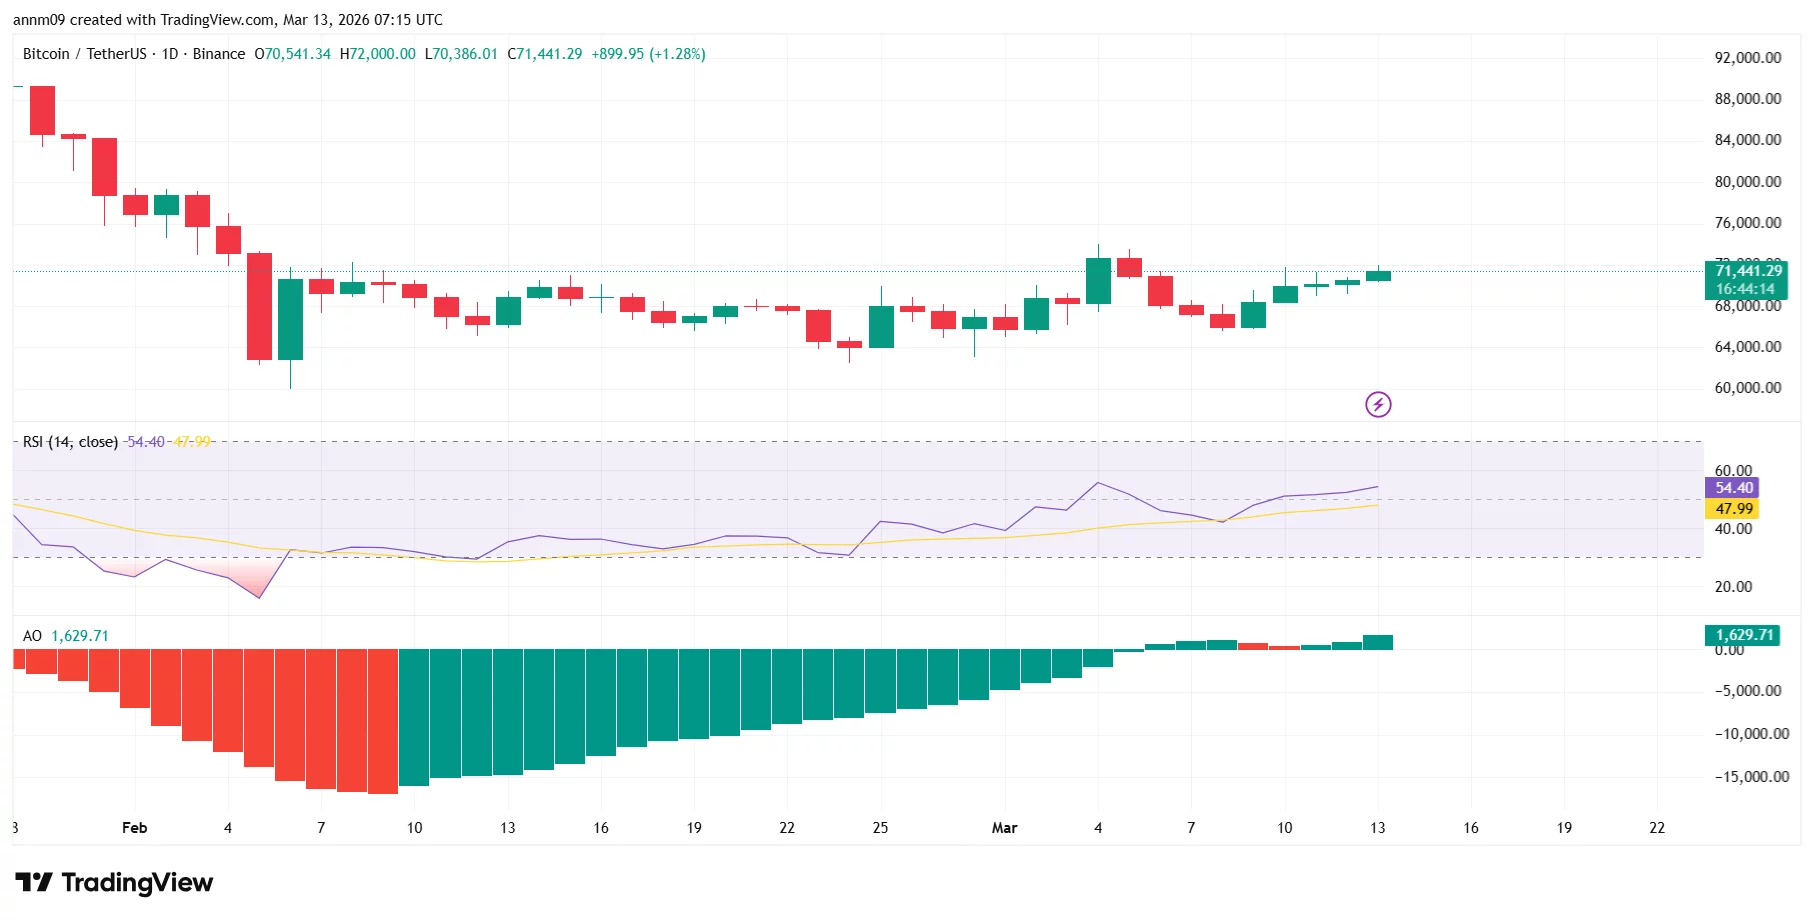
Momentum indicators are also improving. The relative strength index (RSI) is around 54, suggesting bullish momentum is building while still remaining far from overbought territory.
Meanwhile, the Awesome Oscillator (AO) has shifted from deep negative territory in February to positive green bars above the zero line. The steady transition from red to green histogram bars indicates that bearish momentum has faded and bullish momentum is strengthening.
Importantly, the AO shows increasing positive bars in recent sessions, which typically signals growing upside momentum as short-term market strength begins to outpace the longer-term trend.
From a technical perspective, $72,000 represents the immediate resistance level. A confirmed breakout above that area could open the door for a move toward $75,000.
On the downside, $68,000–$69,000 acts as key support, while the $70,000 level remains a critical psychological threshold for maintaining bullish momentum.
Crypto World
Vitalik Buterin explains $500M SHIB donation, distances himself from AI safety lobbying


Ethereum co-founder Vitalik Buterin has clarified the circumstances surrounding his massive 2021 crypto donation to the Future of Life Institute, while distancing himself from some of the group’s more recent policy approaches toward artificial intelligence.
Summary
- Vitalik Buterin clarified that his massive donation to the Future of Life Institute came from SHIB tokens sent to him during the 2021 memecoin boom.
- The institute reportedly converted roughly $500 million worth of SHIB despite Buterin expecting only a small portion could be sold.
- Buterin warned that centralized AI safety policies and large-scale lobbying efforts could create geopolitical tensions and unintended consequences.
Vitalik Buterin: AI safety risks losing trust if it becomes geopolitical power play
In a detailed post on X, Buterin explained that the funds originated from large quantities of dog-themed tokens, including Shiba Inu, which had been sent to his wallet by developers hoping to use his holdings as a marketing tactic.
According to Buterin, the tokens surged in value during the 2021 memecoin boom, with their peak “book value” exceeding $1 billion. Believing the rally was likely a bubble, he moved quickly to access the funds from cold storage, sold part of the holdings for Ether, and donated to several causes.
Buterin said he contributed roughly half of the remaining SHIB to India’s COVID-19 relief effort through CryptoRelief, while the other half went to the Future of Life Institute, an organization focused on existential risks such as artificial intelligence, nuclear threats and biotechnology.
He initially assumed the institute would only be able to liquidate between $10 million and $25 million worth of the tokens due to limited market liquidity. Instead, both CryptoRelief and the institute managed to convert around $500 million worth of SHIB.
However, Buterin said the organization later shifted its strategy toward cultural and political advocacy aimed at accelerating AI regulation in response to the perceived rapid arrival of artificial general intelligence.
While acknowledging their concerns, Buterin warned that large-scale coordinated political campaigns backed by substantial funding could produce unintended consequences and backlash.
“My worry is that large-scale coordinated political action with big money pools can easily lead to unintended outcomes,” he said.
Instead, Buterin said his preferred approach focuses on developing open-source technologies that improve resilience to high-risk scenarios, including stronger cybersecurity systems, secure hardware and pandemic detection tools.
He also cautioned that AI safety efforts could lose credibility globally if they become associated with attempts by specific companies or countries to dominate the technology.
The US dollar continues to strengthen against major counterparts as markets await important macroeconomic data scheduled for release in the coming hours. Investors are focusing on US GDP figures, the Personal Consumption Expenditures (PCE) price index, and Canada’s labour market statistics. These releases could significantly influence expectations regarding the future policy path of the Federal Reserve and set the tone for currency market movements.
The strengthening of the US currency has also been supported by rising geopolitical tensions in the Middle East. Over the past 24 hours, the conflict involving Iran, the US, and Israel has intensified, leading to a sharp rise in oil prices and increased demand for safe-haven assets. Reports indicate strikes on tankers in the region, along with conflicting information about the potential closure of the Strait of Hormuz. Rising energy prices and heightened geopolitical risks are supporting the dollar as demand for liquid defensive assets increases. At the same time, market participants remain cautious ahead of key data releases that could alter expectations for interest rates.
USD/JPY
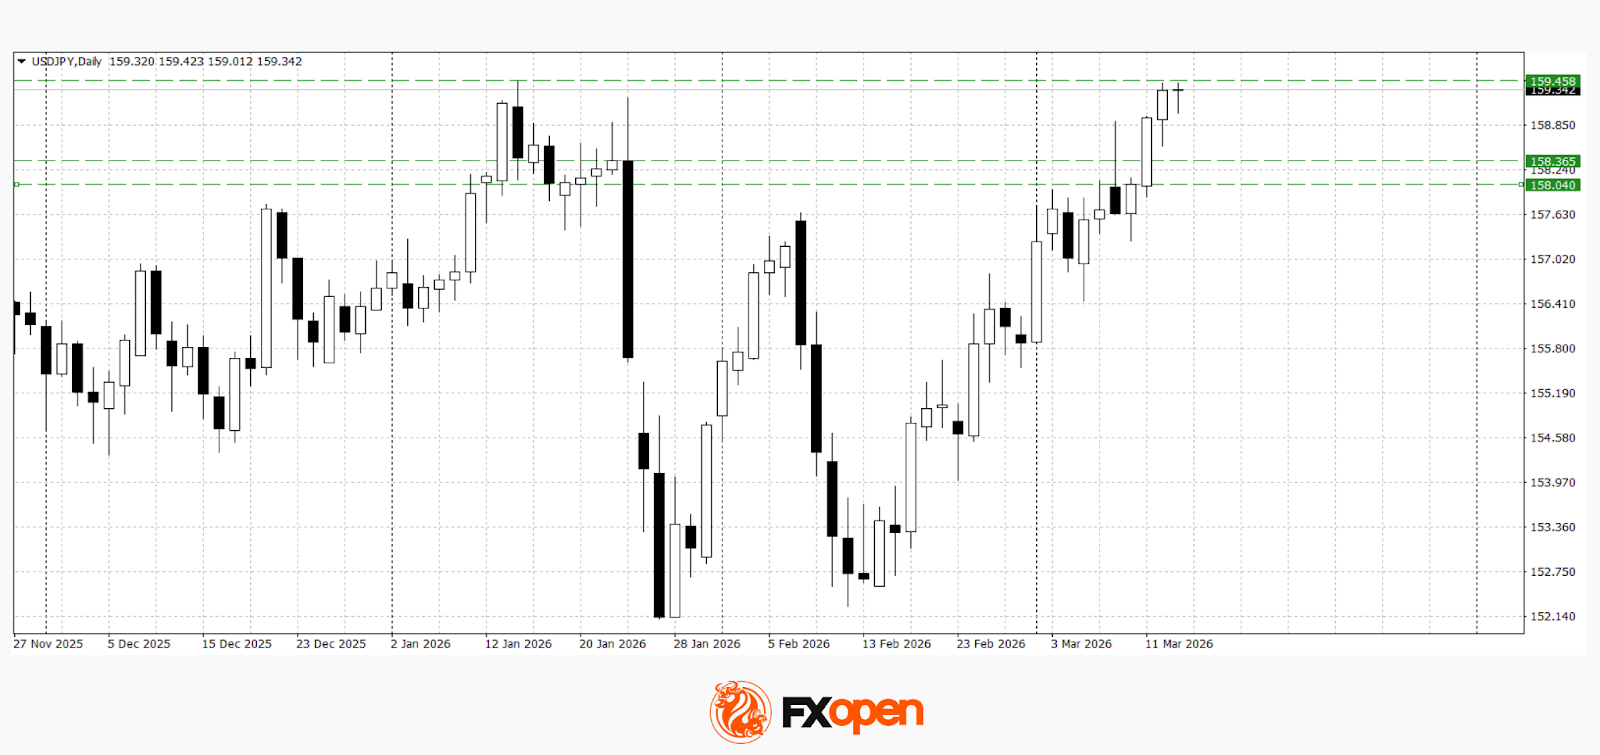
The USD/JPY pair continues to move higher and is trading near its annual highs. Technical analysis suggests the possibility of a downward pullback if the 159.45 level holds as resistance. However, if buyers manage to establish a firm break above this level, the pair could advance towards the 160.20–161.00 range.
Key events for USD/JPY:
- today at 14:30 (GMT+2): US GDP
- today at 14:30 (GMT+2): US Core PCE Price Index
- today at 16:00 (GMT+2): US Job Openings (JOLTS)

USD/CAD
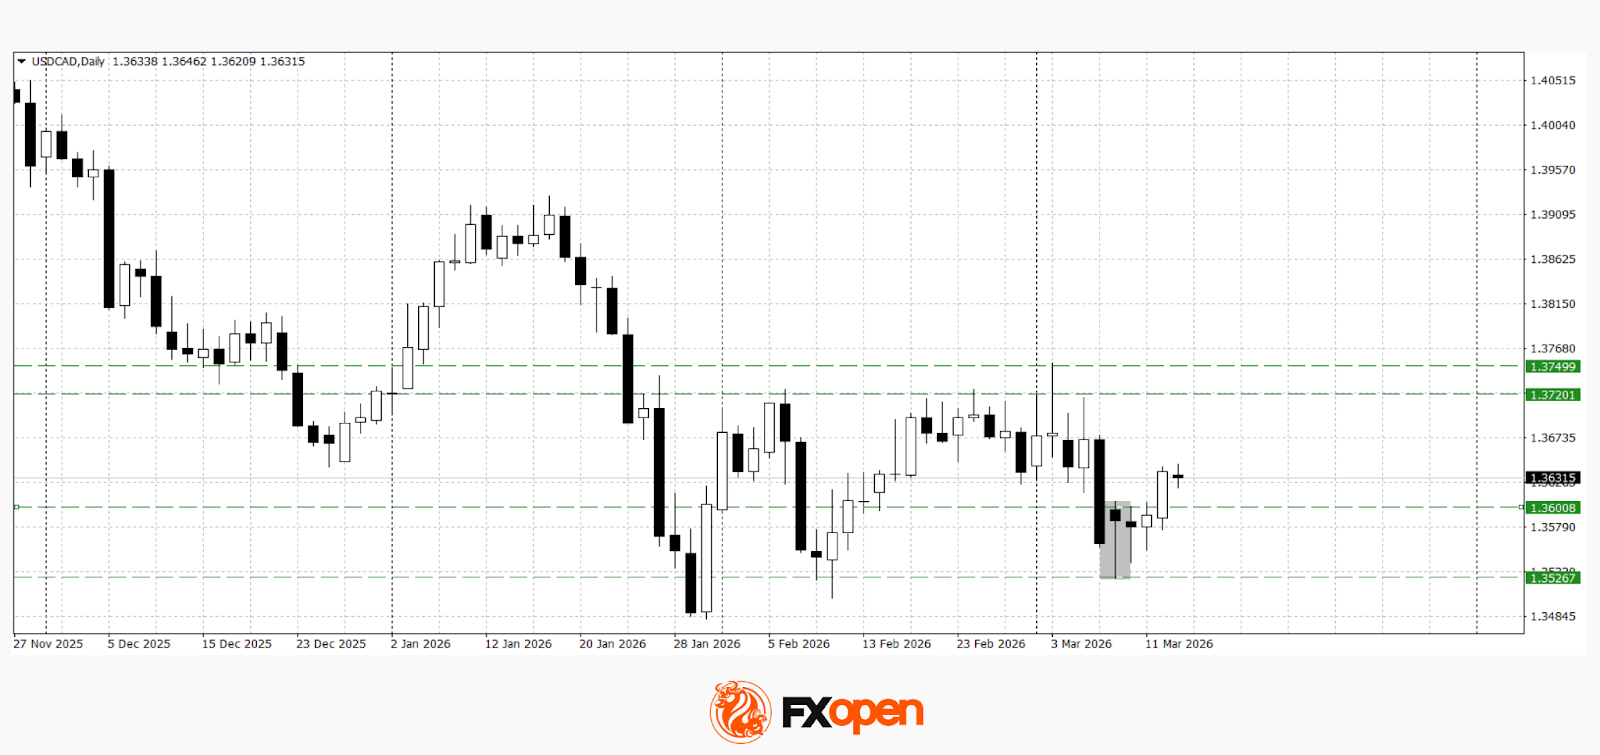
The USD/CAD pair is also moving higher, although it remains significantly below its yearly highs compared with USD/JPY. Last week, the price found support near 1.3520, where a doji candlestick pattern formed, signalling a potential reversal. The pair is currently consolidating above 1.3600, and if the upward momentum continues, a test of recent highs in the 1.3720–1.3750 range may follow.
Key events for USD/CAD:
- today at 14:30 (GMT+2): Canada Employment Change
- today at 14:30 (GMT+2): Canada Unemployment Rate
- today at 14:30 (GMT+2): Canada Labour Force Participation Rate
Trade over 50 forex markets 24 hours a day with FXOpen. Take advantage of low commissions, deep liquidity, and spreads from 0.0 pips (additional fees may apply). Open your FXOpen account now or learn more about trading forex with FXOpen.
This article represents the opinion of the Companies operating under the FXOpen brand only. It is not to be construed as an offer, solicitation, or recommendation with respect to products and services provided by the Companies operating under the FXOpen brand, nor is it to be considered financial advice.
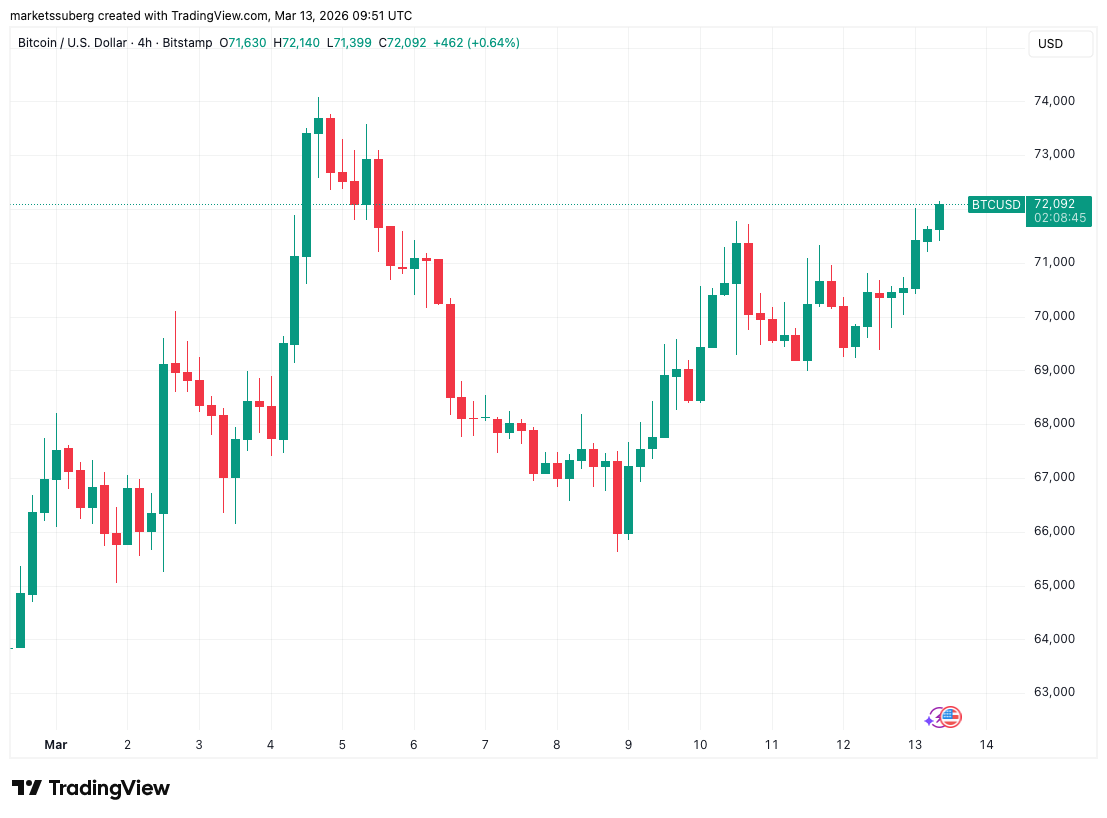
Bitcoin (BTC) hit eight-day highs into Friday’s Wall Street open as markets awaited key US inflation cues.
Key points:
-
Bitcoin shows resilience despite macro market uncertainty with another push beyond $72,000.
-
Key US inflation data increased the chances of risk-asset volatility to come.
-
BTC price gains outperform macro assets since the start of the Iran conflict.
Trump demands Fed rate cut ahead of PCE print
Data from TradingView showed BTC/USD climbing past $72,000 on Bitstamp for the first time since March 5.

Bitcoin avoided a sell-off despite global uncertainty over the Middle East conflict and its impact on oil supplies. The week’s macro data prints from the US further conformed to expectations, decreasing the risk of excess market volatility.
Friday was due to see the Personal Consumption Expenditures (PCE) Index release for January — an important gauge known as the Federal Reserve’s “preferred” inflation measure.
The previous PCE print beat anticipated levels to hit its highest since late 2023.

Despite the oil crisis threatening a surge in inflationary forces, US President Donald Trump renewed demands for Fed Chair Jerome Powell to loosen policy.
“Where is the Federal Reserve Chairman, Jerome ‘Too Late’ Powell, today? He should be dropping Interest Rates, IMMEDIATELY, not waiting for the next meeting,” he wrote in a post on Truth Social.
As Cointelegraph reported, odds of a rate cut at the Fed’s March 18 meeting fell below 1% this week.

”Conviction is building” for Bitcoin bullish breakout
Among Bitcoin market participants, the focus was on price strength amid the macro chaos.
Related: Bitcoin’s ‘extremely precise’ macro signal puts $100K target back in play
“Bitcoin has remained surprisingly resilient following the recent geopolitical shock,” onchain analytics platform Glassnode summarized in the latest edition of its regular newsletter, “The Week Onchain.”
Glassnode flagged options-market activity showing that traders were less concerned about short-term risk.
“An accumulation cluster is forming in the $62k–$72k range. However, its intensity is modest relative to prior phases that preceded sustained expansions,” it continued in an X post on Thursday while analyzing the cost basis of investors hodling BTC for six months or less.
“Conviction is building, but the foundation for a mid-term breakout remains thin so far.”

Others noted that BTC/USD had outperformed other macro assets since the start of the events in Iran.
“Passing the geopolitical stress test,” Joe Consorti, head of growth at Bitcoin equity company Horizon, commented.
Bitcoin is the best-performing major asset since last month’s strikes on Iran.
BTC is up 7.3%, the S&P 500 and Nasdaq are down 1-2%, gold is down 3.7%, and silver is down over 10%.
Passing the geopolitical stress test. pic.twitter.com/vg2RvEh9OM
— Joe Consorti (@JoeConsorti) March 12, 2026
This article does not contain investment advice or recommendations. Every investment and trading move involves risk, and readers should conduct their own research when making a decision. While we strive to provide accurate and timely information, Cointelegraph does not guarantee the accuracy, completeness, or reliability of any information in this article. This article may contain forward-looking statements that are subject to risks and uncertainties. Cointelegraph will not be liable for any loss or damage arising from your reliance on this information.
Everything we know as major fire breaks out at Bolton industrial estate
Buckle earnings beat by $0.07, revenue topped estimates
JPMorgan Flags Sharp Divergence Between Bitcoin and Gold ETF Flows Since Iran War


-
Business7 days ago
Form 8K Entergy Mississippi LLC For: 6 March
-

 News Videos4 days ago
10th Algebra | Financial Planning | Question Bank Solution | Board Exam 2026
-

 Fashion7 days ago
Weekend Open Thread: Ann Taylor
-
 Tech2 days ago
A 1,300-Pound NASA Spacecraft To Re-Enter Earth’s Atmosphere
-

 Crypto World4 days ago
Paradigm, a16z, Winklevoss Capital, Balaji Srinivasan among investors in ZODL
-

 Tech3 days ago
ChatGPT will now generate interactive visuals to help you with math and science concepts
-

 Business3 days ago
ExxonMobil seeks to move corporate registration from New Jersey to Texas
-

 Sports6 days ago
Three share 2-shot lead entering final round in Hong Kong
-

 Sports5 days ago
Braveheart Lakshya downs Lai in epic battle to enter All England Open final | Other Sports News
-

 NewsBeat2 days ago
Residents reaction as Shildon murder probe enters second day
-

 Entertainment6 days ago
Hailey Bieber Poses For Sexy Selfies In New Luscious Lip Thirst Traps
-

 Business5 days ago
Search for Nancy Guthrie Enters 37th Day as FBI Probes Wi-Fi Jammer Theory
-

 Business2 days ago
Search Enters Sixth Week With New Leads in Tucson Abduction Case
-
 NewsBeat3 days ago
Pagazzi Lighting enters administration as 70 jobs lost and 11 stores close across Scotland
-

 Tech4 days ago
Despite challenges, Ireland sixth in EU for board gender diversity
-

 Business4 days ago
Search Enters 39th Day with FBI Tip Line Developments and No Major Breakthroughs
-

 NewsBeat2 days ago
I Entered The Manosphere. Nothing Could Prepare Me For What I Found.
-

 Business6 days ago
Iran war enters second week as Trump demands ’unconditional surrender’
-

 Sports4 days ago
Skateboarding World Championships: Britain’s Sky Brown wins park gold
-

 Crypto World3 days ago
Will Chainlink price reclaim $10 amid volatility squeeze?