

Crypto World
Bitcoin’s record monthly losses; history says a brewing turnaround

Bitcoin is sculpting what could become a five-month red stretch, a pattern that would mark the longest losing run for the largest crypto asset since the 2018 bear market. With BTC down about 15% this month after four consecutive negative closes, traders are weighing whether March might bring a contrarian turn. Data from CoinGlass underscores the current malaise, while some analysts point to historical precedents suggesting a relief rally could follow a protracted drawdown. Yet others caution that the narrative this time could be structurally different, complicating parity between history and the present price action.
Key takeaways
- Bitcoin is on its fifth straight red monthly candle, placing it on the longest losing streak since 2018 if the pattern persists into March.
- Historical analogs show that multi-month declines have sometimes been followed by substantial rallies, with Milk Road suggesting as much as a 316% gain over the next five months if history repeats.
- A potential reversal could begin as early as April 1, according to an analyst-led interpretation of prior cycles.
- In 2022, BTC endured four consecutive red quarters, culminating in a 64% annual drawdown and a year-end close near $16,500 after opening near $46,230.
- Some market voices argue the current bear market is fundamentally different, pointing to RSI behavior and other indicators that diverge from prior cycles, complicating traditional bottoming expectations.
Tickers mentioned: $BTC
Sentiment: Neutral
Price impact: Neutral. While patterns hint at a possible rebound, no definitive price move is confirmed yet.
Market context: The Bitcoin narrative sits amid a broader backdrop of historic drawdowns, with weekly and quarterly signals suggesting a mixed path ahead. Analysts note that the current bear period may not mirror past cycles, even as the same asset class contends with macro and liquidity dynamics that shape risk appetite across crypto markets.
Why it matters
The persistence of downbeat monthly candles keeps a number of questions at the forefront for investors and builders alike. If Bitcoin’s streak ends in the near term, it could validate a patience-driven approach in a market where volatility remains a defining feature. The potential for a sizable rebound — should the cycle mirror past recoveries — would have implications for institutional engagement, risk management, and the development of on-chain infrastructure that often aligns with price cycles.
From a risk-management perspective, the divergence between monthly patterns and weekly or quarterly signals matters. While a five-month red run would align with the memory of 2018’s late-stage bear, the more nuanced pattern observed in 2022 — four red quarters culminating in a brutal annual drawdown — suggests that the bottoming process can be uneven and drawn out. This nuance is essential for traders who rely on calendar-based expectations, as opposed to a purely price-driven narrative. The discussion around whether the bear is structurally different adds another layer to how market participants interpret leverage, liquidity provisioning, and hedging strategies within the crypto ecosystem.
Analysts emphasize that a bottom is not a singular event but a process that unfolds across multiple timeframes. The contrast between longer, slower-moving monthly candles and shorter, more volatile weekly candles can produce whipsaws or false signals, challenging even seasoned traders. The current discourse also highlights how historical reference points can both illuminate potential paths and mislead when the fundamentals have shifted — for example, the RSI, a widely watched momentum indicator, is said to be at levels that resemble prior bear-market lows, which some observers interpret as either a cap on upside or a prelude to a reversal depending on the broader setup.
In practical terms, this means market participants should remain vigilant for changes in liquidity conditions, risk sentiment, and macro drivers that influence appetite for risk across crypto assets. The evolving narrative around whether this bear is “different” matters not just for price trajectories but for how developers, investors, and miners approach long-horizon planning, supply dynamics, and the deployment of new financial products tied to BTC exposure.
What to watch next
- Monitor April 1 as a potential pivot point if the historical pattern repeats, with attention to whether the fifth red month translates into a sustained rebound.
- Track weekly candle formations and RSI behavior for signs of a bottom or renewed downside pressure.
- Follow commentary around the notion that the current bear cycle is fundamentally different, to assess whether this changes risk management and capital allocation approaches.
- Observe any shifts in macro sentiment and liquidity that could influence BTC’s risk-on/risk-off dynamics in the near term.
Sources & verification
- CoinGlass data on Bitcoin’s fifth consecutive red month and the 15% monthly decline.
- Milk Road analysis and X post citing the potential 316% upside over the next five months if history repeats, with an April 1 timeframe mentioned.
- Historical quarterly performance in 2022 showing four red quarters and a 64% annual drawdown, as contextualized by on-chain and price-history analysis.
- Analyst commentary noting a potentially different bear market structure in 2026 relative to prior cycles, as discussed by market observers.
- Solana Sensei’s chart discussion focusing on Bitcoin’s weekly performance and the persistence of a five-candle streak.
Bitcoin’s latest drawdown and what it changes
Bitcoin (CRYPTO: BTC) finds itself at a crossroads as a fifth consecutive monthly red candle looms, a scenario that would mark the longest such streak since the 2018 downturn. CoinGlass’s data frames the cue: BTC has declined around 15% this month after finishing the four preceding months in the red. The most notable parallel in recent history is the 2018 bear, a period that preceded a protracted decline before a multi-times rally years later. This context frames the current debate: are we approaching a traditional bear-market bottom, or is this cycle signaling a new regime with different dynamics?
Within this debate sits a striking counterpoint from Milk Road, which highlighted that prior episodes of extended debits often culminated in powerful rallies. The analysis notes a potential 316% gain in the subsequent five months if the pattern repeats, with an initial pivot anticipated around early April. While such projections draw on historical analogs, they do not guarantee future outcomes, and market participants remain mindful of the speed and scale of moves that can occur in crypto markets. The possibility of a rapid reversal exists, but it is contingent on a confluence of favorable conditions that historically have proven elusive to time with precision.
The 2022 bear period adds another layer of caution. That year, BTC endured four consecutive red quarters, culminating in a total drawdown of roughly 64% as the price collapsed from a starting point near $46,230 to around $16,500 by year-end. The stark difference between that season and the present has led some to question whether history offers a reliable playbook for all cycles. In a broader sense, the bear narrative for 2026 has permeated analysis, with voices warning that a similar stretch could push prices toward new lows if macro and liquidity conditions deteriorate further. One linked discussion even imagines a scenario where the decline might extend below the 15-month support band near $60,000, underscoring the potential for further downside if selling pressure intensifies.
Within the microstructure, weekly performance has drawn the attention of traders as well. A well-known analyst in the space highlighted that Bitcoin printed its fifth consecutive weekly down candle, marking the longest such streak since 2022 and positioning it as the second-longest losing run on record. The 2022 period saw nine red weeks and a descent to around $20,500, illustrating how abrupt and protracted declines can be, even after substantial drawdowns. The interplay of monthly, weekly, and quarterly signals underscores the challenge of diagnosing a bottom with a single timeframe in mind and highlights the risk of misreading the onset of a durable recovery.
Beyond the numbers, a divergence in narrative is shaping market sentiment. Veteran analyst Sykodelic argues that the current bear phase is fundamentally different from earlier cycles, pointing to the monthly RSI having already touched levels associated with prior bear-market lows in 2015 and 2018. The assertion is that the absence of a classic overbought expansion in the bull phase can complicate expectations of symmetric contractions. In other words, traders may be dealing with a regime where the typical playbook fails to capture the full complexity of price action, making caution and disciplined risk management all the more important as the market tests key psychological and technical thresholds.
All of this occurs as broader market narratives evolve around risk tolerance and the appetite for crypto exposure. The tension between potential upside and the risk of renewed downside remains a core feature of the current price environment. For market participants, the central question is whether the repeated red candles are signaling a deeper pattern or simply a fraught interim phase that could resolve in a relatively swift re-pricing if buyers step back in with confidence. The answer will likely hinge on a mix of on-chain signals, liquidity conditions, and macro developments that influence whether BTC can sustain any rally beyond a few weeks or months.
What to watch next
- April 1 as a potential inflection point if the historical pattern repeats, with close attention to price action in the days that follow.
- Confirmation signals from weekly candles and RSI stabilization, which could indicate a bottoming process even amid ongoing volatility.
- Shifts in risk sentiment and liquidity that may tilt BTC toward a risk-on or risk-off regime in the near term.


New data from blockchain analytics firm TRM Labs shows illicit actors moved roughly $141 billion through stablecoins in 2025—the highest annual tally in five years. The report, issued this week, cautions that the uptick does not signal a broad acceleration in crypto-enabled crime, but rather a deeper reliance on stablecoins for activity where speed, liquidity, and cross-border movement offer clear operational advantages. The analysis highlights sanctions-linked networks and large-money-movement services as the dominant channels for these flows, underscoring how stablecoins have become a preferred rails for moving value outside traditional financial controls.
According to the TRM study, sanctions-related activity accounted for a staggering 86% of all illicit crypto flows in 2025. Of the $141 billion in stablecoin activity, roughly half—about $72 billion—was tied specifically to a ruble-pegged token known as A7A5, whose operations are almost entirely concentrated within sanctioned ecosystems. The institutional emphasis on these tokens points to a striking trend: stablecoins are not merely a tool for everyday commerce but a specialized infrastructure supporting state-linked evasion and enforcement-evading finance.
Beyond the A7A5 concentration, the report notes that Russian-linked networks intersect with other state-backed ecosystems, including actors connected to China, Iran, North Korea, and Venezuela. In TRM’s words, these findings illuminate how stablecoins have evolved into connective infrastructure for sanctioned actors seeking to move value outside conventional financial controls. This interlocking web raises questions for regulators and financial institutions about how to monitor cross-border flows that ride the rails of stablecoins—even when the majority of legitimate activity remains robust and mainstream.
On the demand side, the report draws attention to the way illicit marketplaces deploy stablecoins in perimeter markets. While scams, ransomware, and hacking still occur, those activities tend to stage their crypto use in multiple steps, often beginning with Bitcoin (CRYPTO: BTC) or other crypto assets, before shifting to stablecoins later in the laundering sequence. The research also identifies categories such as illicit goods and services and human trafficking as showing “near-total stablecoin usage,” suggesting operators prioritize payment certainty and liquidity over potential price appreciation. In practical terms, this means stablecoins provide predictable settlement rails that are less sensitive to price volatility, a feature that illicit networks value highly when moving funds across jurisdictions.
Volume in guarantee marketplaces—digital platforms that facilitate risk-sharing or settlement for illicit services—surged to more than $17 billion by late 2025, with most activity denominated in stablecoins. TRM argues that because roughly 99% of this volume is settled in stablecoins, these platforms function more as laundering infrastructure than speculative venues. The implication is that stablecoins have become a preferred vehicle for moving large sums with speed and liquidity, even if much of the activity occurs outside legitimate markets. The report also notes that the role of stablecoins in such ecosystems is not a sign of crypto’s inherent criminality, but rather a signal about the ways illicit actors adapt to enforcement regimes and capital controls.
Corroborating the broader picture, Chainalysis has previously highlighted a rise in crypto flows to suspected human trafficking networks, reporting an 85% year-over-year increase in 2025. In that analysis, international escort services and prostitution networks were noted to operate almost entirely on stablecoins, reflecting demand for payment certainty in illicit networks as well as a preference for cross-border liquidity. These findings reinforce the TRM Labs assessment that stablecoins serve as the backbone of value transfer for several high-risk activities, even as the sector as a whole remains far larger and more diverse than illicit use patterns would suggest.
From the perspective of scale, TRM Labs observed that total stablecoin activity exceeded $1 trillion in monthly transaction volume on multiple occasions in 2025. By extrapolating from these monthly bursts, the study estimates approximately $12 trillion in annual stablecoin activity, implying illicit use accounts for around 1% of the total. That proportion stands alongside global estimates from the United Nations Office on Drugs and Crime, which place money laundering at roughly 2% to 5% of global GDP—an amount roughly in the $800 billion to $2 trillion range. The juxtaposition of these figures underscores a persistent tension: stablecoins are pervasive in legitimate finance while simultaneously enabling sophisticated illicit networks that regulators continue to scrutinize. The findings come amid ongoing policy discussions about how best to balance innovation with robust compliance and risk controls, particularly as sanctions regimes evolve and enforcement benchmarks tighten.
In context, the TRM report adds momentum to a broader industry debate about how to enforce sanctions and combat illicit finance without stifling legitimate use. The intertwining of sanctioned actors with state-linked and non-state networks, as described by TRM, points to the need for enhanced on-chain analytics, cross-border collaboration, and more granular controls on stablecoin issuance and settlement. While the vast majority of stablecoin activity remains legitimate, the visibility of the illicit segment—especially in high-value sanctions-related flows—signals that both policymakers and market participants should pay closer attention to the liquidity and settlement rails that crypto ecosystems have become. The report’s findings are a reminder that, for good or bad, stablecoins occupy a central role in modern finance, shaping how value moves across borders even as regulators adapt to a rapidly evolving digital landscape.
Why it matters
The TRM Labs findings illuminate a nuanced reality for crypto markets and policymakers. Stablecoins have matured into a core settlement layer that supports everyday commerce but also serves as a critical infrastructure for illicit finance during sanctions crises. For cryptocurrency exchanges, wallet providers, and fintechs, the report underscores the importance of implementing robust sanctions screening and address-level risk assessments, especially for counterparties with ties to sanctioned economies or gray-market corridors. The concentration of illicit activity in a handful of stablecoins also highlights the need for precise tagging, traceability, and real-time monitoring to deter misuse while preserving legitimate liquidity and cross-border payments.
For regulators, the data underscore the limits of traditional financial controls when confronted with borderless digital rails. The stability and speed of stablecoins offer undeniable advantages for legitimate commerce, remittances, and cross-border trade, but they also create friction for enforcement. The TRM analysis reinforces calls for clearer stablecoin‑related disclosure, standardized compliance frameworks, and international cooperation to address sanctions evasion without inadvertently curbing innovation. Investors and builders can glean that the risk landscape remains dynamic: reputational and regulatory risk around stablecoins can shift rapidly as enforcement priorities evolve and new tools emerge to monitor on-chain behavior.
For users and the broader market, the message is twofold. First, illicit use represents a relatively small share of overall stablecoin activity, but its visibility matters because it intersects with sanctions policy and macroeconomic stability. Second, the events of 2025 demonstrate how quickly stablecoin liquidity can be redirected toward restricted channels when governance gaps or enforcement actions fail to keep pace with innovation. The ongoing dialogue between analytics firms, policymakers, and industry participants will shape how stablecoins evolve—from mere payment rails to potential risk vectors requiring more rigorous risk management and governance standards.
What to watch next
- Further methodology updates and breakdowns from TRM Labs detailing which stablecoins and sanction-related corridors dominate illicit flows.
- Regulatory responses and enforcement actions tied to sanctioned networks identified in the report, including cross-border cooperation and sanctions-compliance initiatives.
- Monitoring of stablecoin issuance and circulation patterns as policymakers consider stricter controls or new compliance requirements for issuers and custodians.
- Ongoing research from Chainalysis and other firms on the role of stablecoins in human trafficking networks to assess whether new tracking tools reduce illicit activity over time.
- Regulatory developments related to sanctions packages and related crypto-exposure rules in jurisdictions highlighted by the report.
Sources & verification
- TRM Labs, Stablecoins at Scale: Broad Adoption and Highly Concentrated Illicit Networks (official blog)
- Sanctions-related activity accounted for 86% of illicit crypto flows in 2025 (Cointelegraph article)
- Russia-linked networks and the EU sanctions package context (Cointelegraph article)
- Tether challenges report on illicit activity involving USDT (Cointelegraph article)
- Chainalysis report on crypto use in human trafficking networks
- UNODC money laundering overview
Illicit stablecoins: sanctions networks and laundering rails
Illicit actors moved an estimated $141 billion through stablecoins in 2025, reflecting a shift in how sanctioned operations leverage digital rails to bypass traditional financial controls. In the study’s framing, sanctions-related activity dominates the illicit crypto landscape, signaling that enforcement regimes are shaping the channels through which criminal actors move funds. The data show a pronounced concentration around a ruble-pegged stablecoin known as A7A5, with about $72 billion of the total tied to this single asset. This clustering hints at a specialized ecosystem where asset choice aligns with the operational requirements of sanctioned networks, rather than with speculative profit-seeking behavior.
Within this ecosystem, the report highlights networks that blur geographic boundaries—Russia-linked actors intersecting with spheres connected to China, Iran, North Korea, and Venezuela. The analysis underscores how stablecoins have become connective fabric for sanctioned actors seeking to move value beyond conventional controls, reinforcing stability in cross-border transfers while complicating enforcement. In parallel, the data point to a broader pattern: illicit activity in the realm of sanctions and large-scale money movement dominates the illicit use of stablecoins, even as other categories rely increasingly on these digital rails for liquidity and certainty of settlement.
On legitimate terms, stablecoins continue to support a wide range of uses, including remittance and cross-border payments, with total stablecoin activity surpassing $1 trillion in monthly volume on multiple occasions in 2025. If one projects the annual scale, the figure nears $12 trillion, of which the illicit portion—ranging around 1%—belongs to highly regulated, high-risk activity tied to sanctions and related networks. The United Nations Office on Drugs and Crime’s own estimates place global money laundering at 2%–5% of GDP, which aligns with the broader recognition that illicit finance persists at scale despite improvements in detection and policing. These numbers collectively illustrate a crypto environment that is large, interconnected, and continually adjusting to enforcement pressures and policy shifts.
The picture is nuanced: the same rails that power legitimate payments and global commerce also offer resilience and speed that illicit actors have learned to exploit. As policymakers and market participants absorb these insights, the path forward involves targeted improvements in monitoring, reporting, and cross-border information sharing to mitigate risk without stifling the legitimate benefits of stablecoins. The ongoing dialogue among analytics firms, regulators, and the crypto industry will shape the contours of stablecoin adoption in the years ahead, balancing innovation with the imperative of robust AML/CFT controls.


Robinhood’s blockchain initiative has hit an early development milestone, with its Robinhood Chain testnet processing more than four million transactions within its first week of launch, Robinhood CEO Vlad Tenev announced on X.
Summary
- Robinhood Chain processed over 4 million transactions in its first week, with CEO Vlad Tenev highlighting growing developer activity on the Ethereum Layer-2 network focused on tokenized real-world assets (RWAs) and on-chain finance.
- While some X users called the milestone “seriously impressive,” others cautioned that testnet figures can be vanity metrics and questioned whether activity reflects real external development or internal stress testing.
- The blockchain push comes as Robinhood reported $1.28 billion in Q4 2025 revenue (up 27% YoY), though crypto revenue fell 38% year-over-year amid softer digital asset markets.
4M in a week: Robinhood’s L2 testnet sparks buzz
Tenev highlighted that developers are already building on the protocol’s Ethereum Layer-2 ecosystem, designed for tokenized real-world assets and on-chain financial services, calling it “the next chapter of finance.”
Robinhood Chain is a bespoke Ethereum Layer-2 network built on Arbitrum technology that aims to reduce costs and increase scalability for decentralized applications tied to financial-grade use cases. The public testnet, live since early February, lets developers experiment with tools, network entry points and testnet-only assets such as “stock tokens.”
Reactions on X to the CEO’s tweet were mixed. One user cautioned that “testnet numbers are usually vanity metrics,” but acknowledged that four million transactions in a week suggests “actual curiosity.”
The user questioned whether the activity reflects external developers shipping products or primarily internal stress testing, adding that the real challenge will be moving meaningful RWA volume without complex user experience hurdles.
Others were more optimistic. One commenter described the figure as “seriously impressive,” suggesting that if the mainnet performs similarly under load, it could become a significant retail crypto on-ramp.
Skepticism also surfaced around the proliferation of new blockchains. Another user argued there is “no need to reinvent the wheel,” pointing to Ethereum’s established developer base and long track record, and questioning whether launching additional chains fragments liquidity and adoption.
The announcement comes amid broader shifts in Robinhood’s business performance. In its fourth quarter of 2025, Robinhood reported revenue of $1.28 billion, up 27 % year-over-year, though slightly below Wall Street expectations, as weaker crypto trading revenues weighed on results.
Crypto-related revenue dropped about 38 % compared to the prior year, reflecting broader downturns in digital asset markets, even as equities, options and subscription income supported overall growth.

TLDR
- Mike McGlone adjusted his Bitcoin price forecast from $10,000 to $28,000 following significant backlash on social media.
- McGlone had originally warned that Bitcoin could drop to $10,000 if U.S. equities peaked and a recession followed.
- The revised forecast of $28,000 is based on historical price distribution and fewer negative factors needed to reach that level.
- Analysts like Jason Fernandes criticized McGlone’s initial prediction, calling it alarmist and unrealistic.
- Mati Greenspan acknowledged the possibility of a $28,000 Bitcoin price but remained skeptical of its likelihood in the current market.
Bloomberg Intelligence’s Mike McGlone recently adjusted his bitcoin price forecast, raising his downside target to $28,000. This shift followed criticism after his initial prediction of a potential $10,000 Bitcoin price was widely questioned on social media. McGlone’s revised stance comes after market experts accused him of issuing alarmist forecasts that could negatively impact investor decisions.
McGlone Faces Backlash for $10,000 Bitcoin Call
Earlier this week, McGlone warned that bitcoin could drop to $10,000 if U.S. equities reach their peak and a recession follows. He stated that bitcoin, being a high-beta asset, would suffer in a market breakdown, especially after the collapse of the “buy the dip” mentality. This prediction attracted significant criticism, with market analyst Jason Fernandes challenging the forecast on social media platforms like X and LinkedIn.
The backlash grew when Fernandes called McGlone’s $10,000 forecast unrealistic. He argued that such a dramatic drop would require several negative factors to align. Fernandes, in his critique, noted that the bitcoin price could face risks but stated that $28,000 was a more plausible level, particularly with fewer factors needed to drive that price point.
Bitcoin Price Forecast Revised to $28,000
In a subsequent post, McGlone acknowledged the feedback and adjusted his bitcoin price forecast. He pointed to $28,000 as a more likely scenario, citing historical price distribution as the basis for his updated target. Despite this revision, McGlone still maintained a cautious outlook, advising against investing in bitcoin or other risk assets.
While McGlone’s $28,000 prediction was seen as more reasonable, some market experts like Mati Greenspan remained skeptical. Greenspan suggested that although $28,000 might be possible, the likelihood of it happening was still low. He emphasized the unpredictable nature of markets, stating that while forecasts could be helpful, they should not rule out other possibilities.
Fernandes Challenges McGlone’s Forecast Shift
Fernandes, who had initially criticized McGlone’s $10,000 prediction, continued to voice concerns even after the revision. He highlighted that McGlone’s updated forecast now aligned closer to his own lower-bound estimate of bitcoin’s price range. Fernandes pointed out that a reset in the $40,000 to $50,000 range remained more probable, especially without a systemic liquidity shock.
Despite the change in McGlone’s outlook, the broader discussion highlighted the potential dangers of deterministic predictions in volatile markets like crypto. Analysts warned that alarmist forecasts could influence positioning and potentially lead to unnecessary risks for investors. Fernandes emphasized the need for more balanced approaches when discussing the future of high-risk assets like Bitcoin.


Epstein’s 2010s emails show Gensler talks, XRP/XLM bets, CBDC and stablecoin funding links.
Summary
- 2018 emails show Epstein sought crypto talks with Gensler and briefed Summers on early digital currency discussions.
- Records cite about $3m into Coinbase plus speculative exposure to XRP, XLM, Circle and early stablecoin structures tied to Brock Pierce.
- Reports mention funding for MIT-linked CBDC pilots and private crypto ventures as crypto policy circles were still nascent.
Newly released documents from the Jeffrey Epstein case contain references to communications involving cryptocurrency policy discussions and Gary Gensler, according to reports published this week.
The documents include emails dated 2018 that reportedly mention conversations between Epstein and individuals connected to policy and academic circles in the cryptocurrency sector. Gensler, who later served as Chair of the Securities and Exchange Commission, appears among the names referenced in the materials.
According to the reports, the files contain correspondence suggesting Epstein discussed arranging a meeting with Gensler regarding cryptocurrency topics. Emails from 2018 indicate Epstein told former U.S. Treasury Secretary Lawrence Summers that Gensler had arrived early for crypto-related discussions, according to the documents. Summers reportedly responded that he knew Gensler and considered him intelligent.
No documents released to date have established a direct connection between Epstein and any specific cryptocurrency decision or project, according to available reports. However, records suggest Epstein invested millions in early cryptocurrency ventures, including approximately $3 million in Coinbase in 2014, reports stated.
Some emails reportedly referenced XRP and Stellar, leading to speculation about possible investments in those projects, though the documents do not provide clear confirmation, according to observers.
Additional claims in the reports suggest Epstein provided funding for U.S. central bank digital currency pilot programs through MIT and certain Federal Reserve Banks. Gensler taught at MIT during that period and worked in academic policy circles before entering government service and participating in the development of U.S. cryptocurrency regulation.
Reports also indicate Epstein explored early stablecoin-related investments, including Circle, through connections associated with Brock Pierce. Pierce reportedly requested Epstein’s assistance in connecting with Lawrence Summers, according to accounts of the correspondence.
The documents suggest Epstein maintained investments in private cryptocurrency ventures while maintaining relationships with academic and policy circles involved in digital currency regulation, according to analysts reviewing the materials. The timing of these connections has drawn attention as they occurred before cryptocurrency markets achieved mainstream adoption.
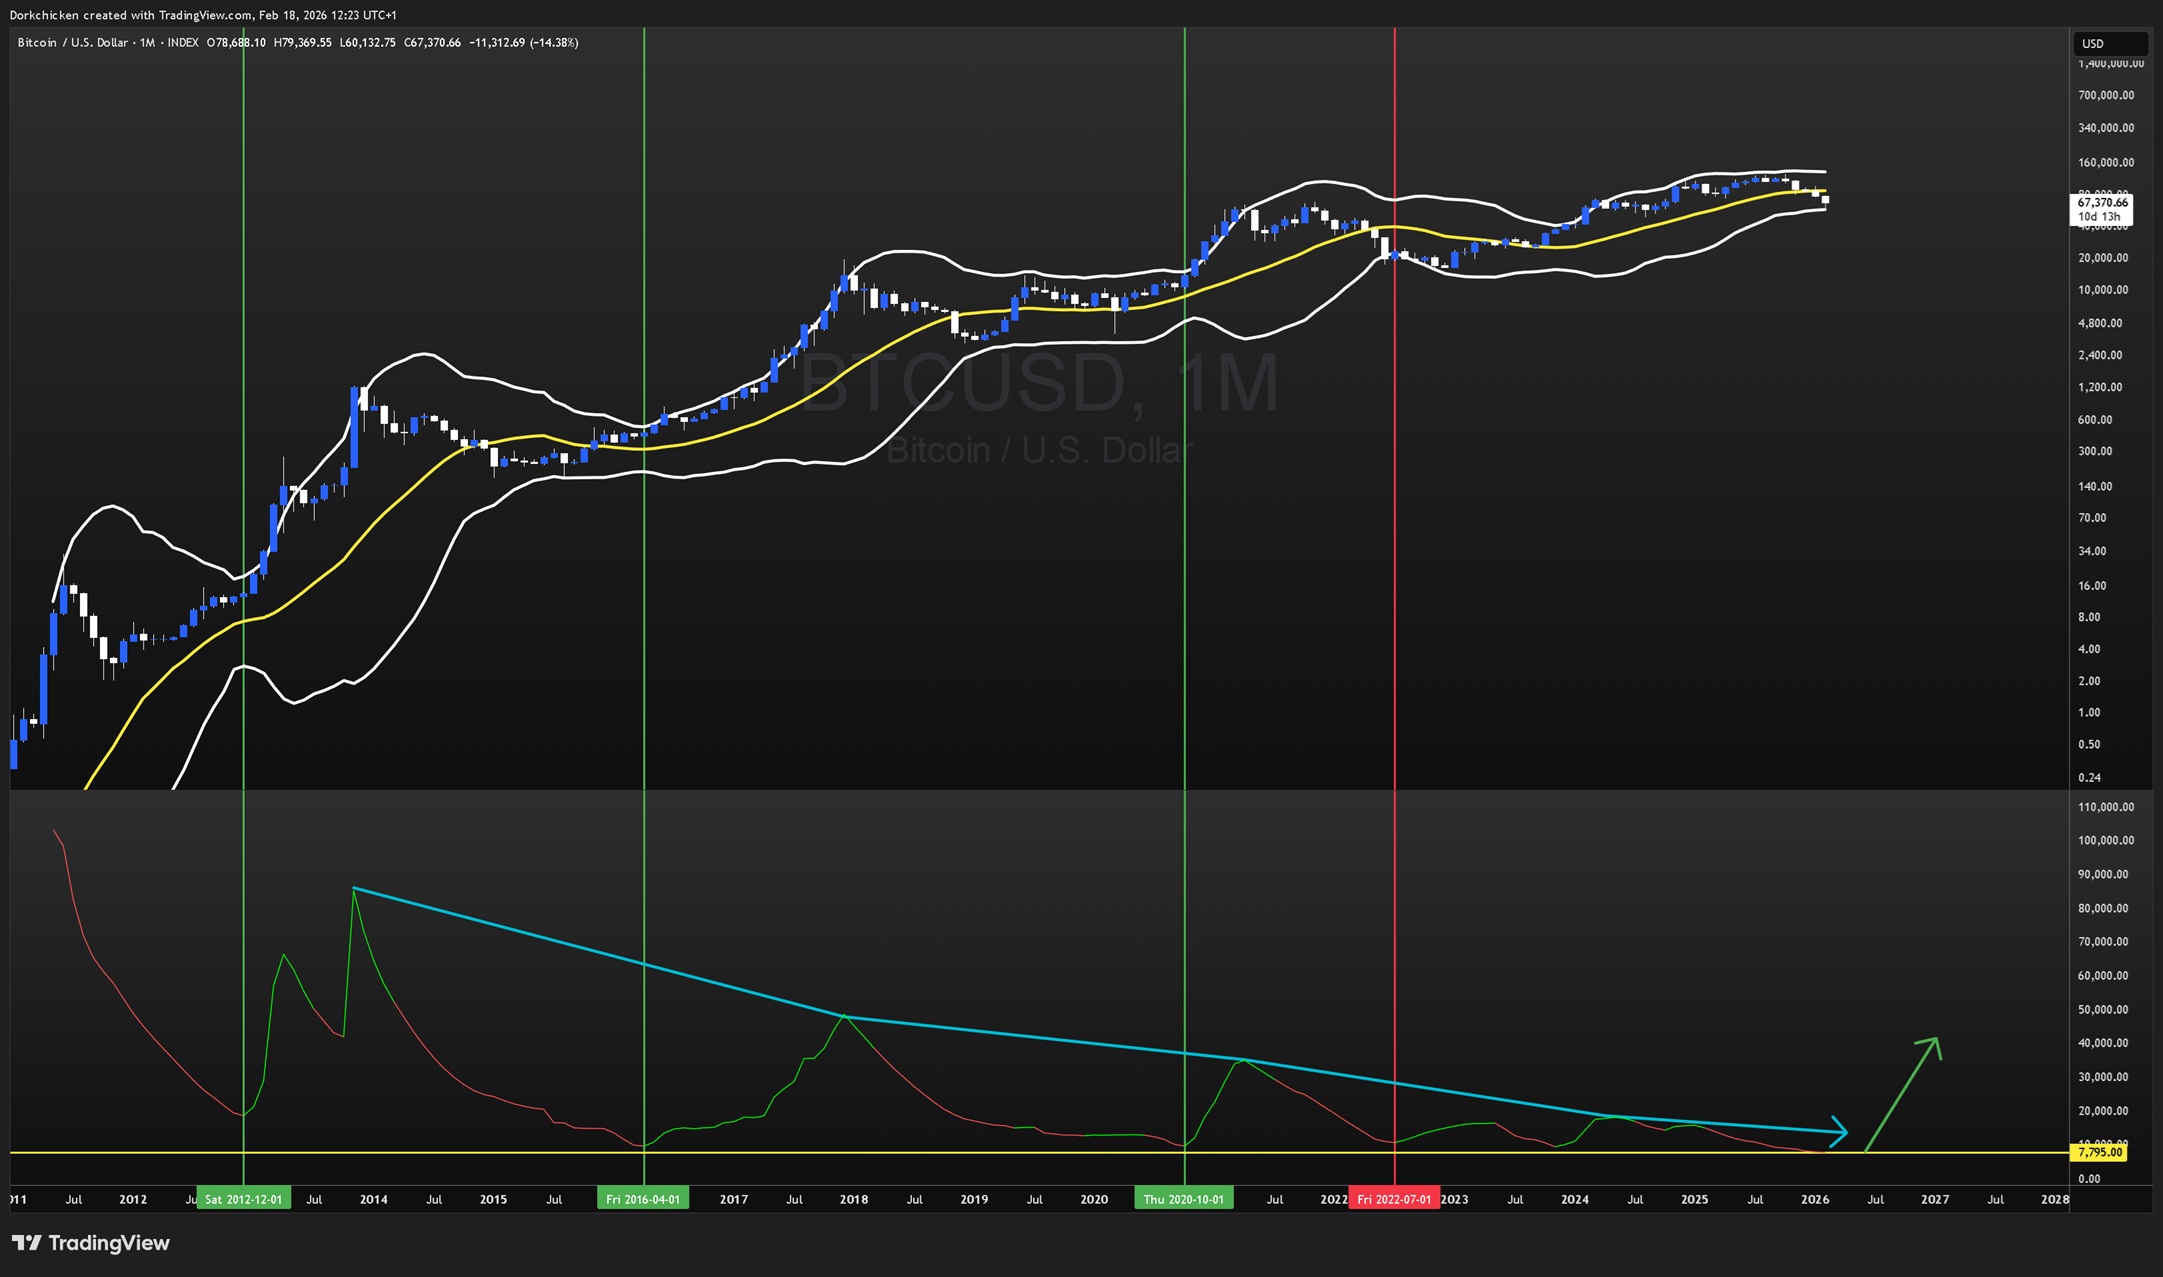
A key volatility indicator for Bitcoin (BTC) has narrowed to its tightest measurement on record, a pattern that was followed by a multimonth rally in previous bull and bear markets. Will the Bollinger Bands indicator call the market bottom again?
Record Bitcoin Bollinger Band compression hints at volatility
Analyzing the monthly Bitcoin chart, crypto analyst Dorkchicken noted that BTC’s Bollinger Bands are currently at their “tightest” level on record. Such conditions have repeatedly led to bullish breakouts, with the only prior downtrend from similar conditions occurring in 2022, during the drop to $16,000 from $20,000.

Bollinger Bands measure price volatility, and extreme compression often leads to a sharp expansion. The analyst added that there are higher odds of an upside trend once expansion begins.
On the contrary, Bitcoin trader Nunya Bizniz pointed to an approaching 50- and 200-period simple moving average (SMA) death cross on the three-day chart. A death cross occurs when the shorter-term moving average falls below the longer-term average, signaling weak price momentum.
Across the past three instances, the pattern marked drawdowns of about 50% over the following one to six months and aligned closely with final cycle capitulation phases.

A similar path may imply a potential bottom between March and August near $33,000. The trader also said that BTC has spent 110 days below its short-term holder cost basis of $89,800. During previous cycle lows, the price typically remained under that level for nearly 200 days on average.
Market analyst Ardi also noted that the long futures exposure from retail traders has increased on each dip to $68,000 from $88,000. Currently, 72% of tracked retail accounts are long into a descending trendline.
While this reflects early signs of market optimism, each recent surge in long positioning has been followed by a sharp sell-off. With positioning once again elevated, these longs remain vulnerable to liquidation, increasing the risk of a liquidity hunt if the price moves lower.

Related: Bitcoin ‘roadmap to bottom’ says $58.7K Binance cost basis now crucial
BTC’s Sharpe ratio is interesting, but $70,000 remains the level to crack
Crypto analyst MorenoDV said that Bitcoin’s short-term Sharpe ratio has dropped to -38.38, matching levels last seen in 2015, 2019 and late 2022.
The Sharpe ratio measures the risk-adjusted return, and deeply negative readings mark periods of deep drawdown and volatility. Each extremely low ratio signal has aligned closely with the major cycle lows, leading to strong BTC rallies, with the analyst noting that the current price range may be a “generational buy zone.”

Glassnode data calls for confirmation through a stronger BTC demand absorption. Since early February, each move above the $70,000 level has stalled as the net realized profits exceeded $5 million per hour.
Glassnode added that in Q3 2025, profit-taking between $200 million to $350 million per hour did not interrupt the advance to new highs in Q4.

Related: ‘Resilient’ Bitcoin holders defend BTC, but bear floor sits 20% lower: Glassnode
This article does not contain investment advice or recommendations. Every investment and trading move involves risk, and readers should conduct their own research when making a decision. While we strive to provide accurate and timely information, Cointelegraph does not guarantee the accuracy, completeness, or reliability of any information in this article. This article may contain forward-looking statements that are subject to risks and uncertainties. Cointelegraph will not be liable for any loss or damage arising from your reliance on this information.
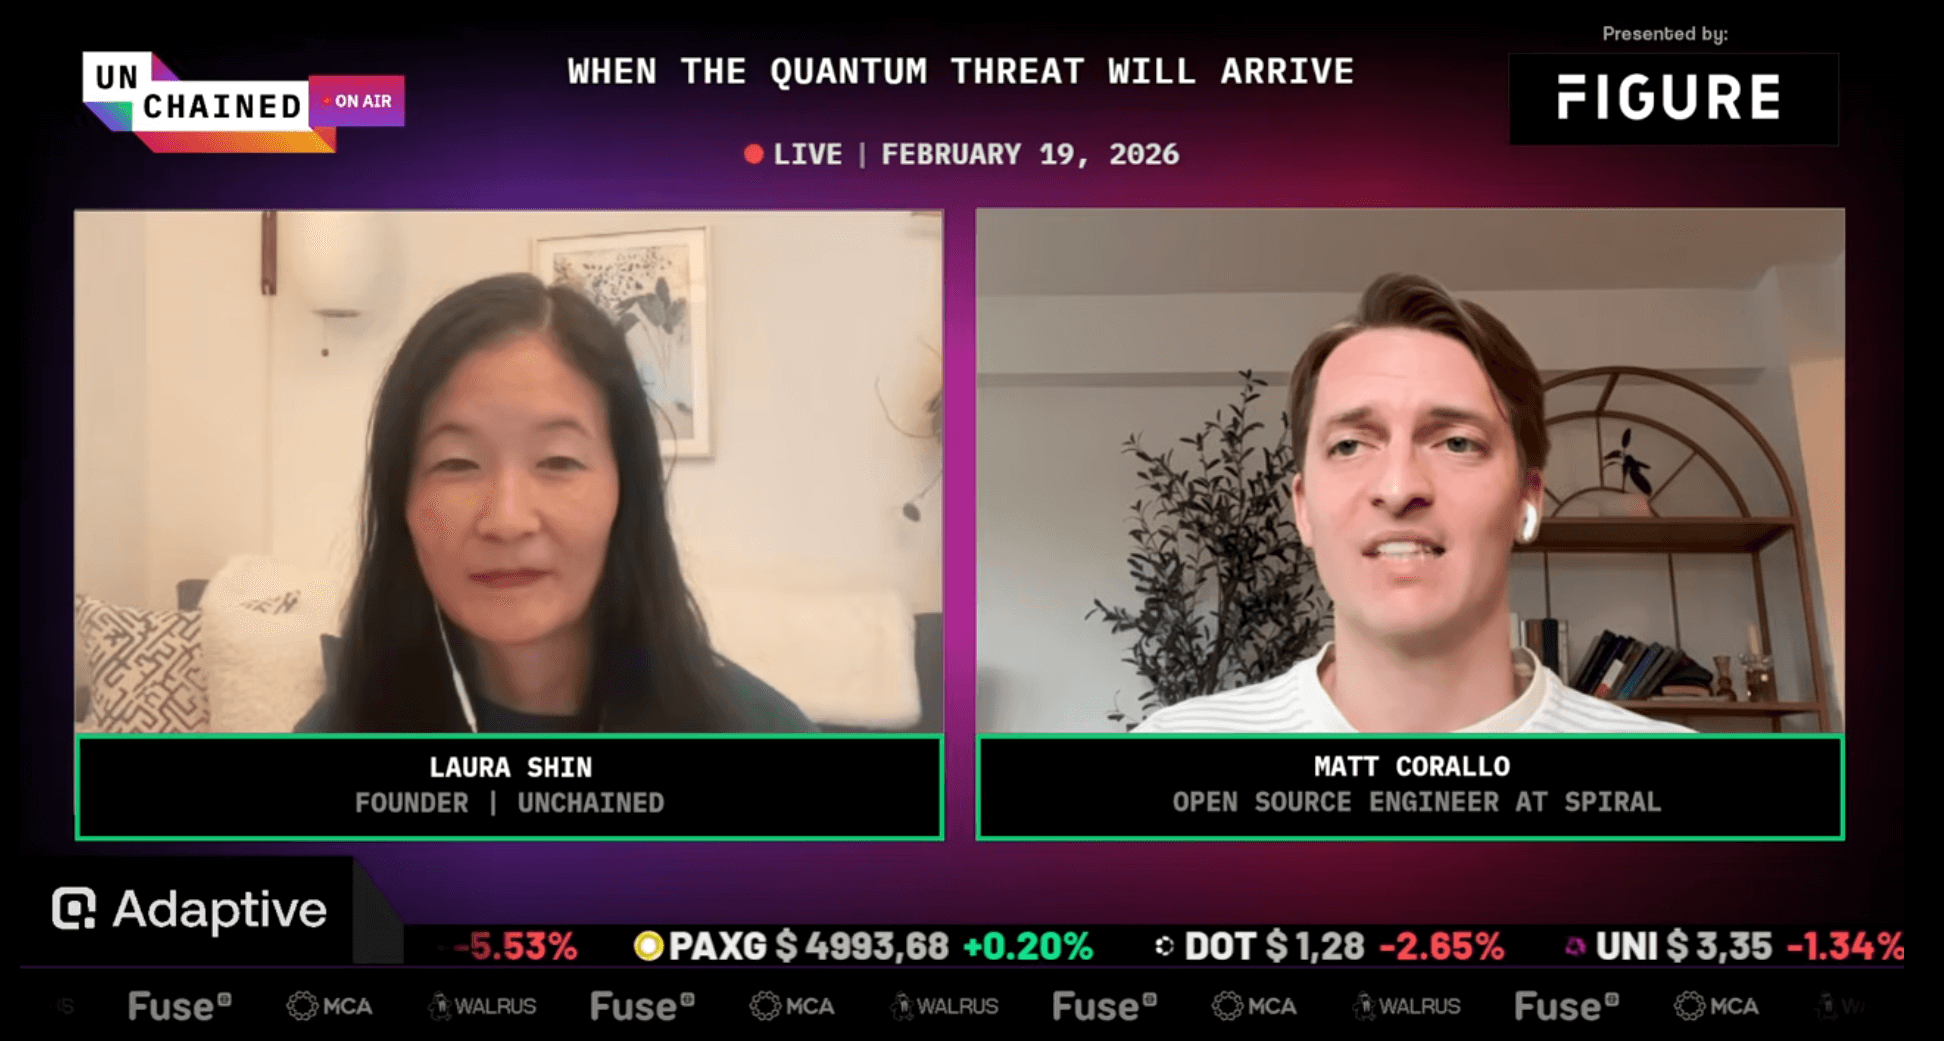
Bitcoin’s recent sell-off isn’t because of quantum computing fear, because if that were the case, Ether would be soaring, says Bitcoin developer Matt Carallo.
“I strongly disagree with the characterization that Bitcoin’s current price is materially, because of some kind of quantum risk,” Carallo told journalist Laura Shin on the Unchained podcast on Thursday.
“If that were true, then Ethereum would be up substantially on Bitcoin,” he added. Ether (ETH) is down 58% since a major crypto market crash in early October, trading at $1,957 at the time of publication.
Carallo’s comments come as several Bitcoiners have argued that fears of quantum computing affecting the blockchain is partly why Bitcoin (BTC) has dropped 46% from its October all-time high of $126,100 to now trade at $67,162, according to CoinMarketCap.

Ethereum zones in on quantum readiness
Some Bitcoin users have accused the blockchain’s developers of not moving quickly enough to make the network quantum-resistant, while the Ethereum Foundation has said it is taking measures to be ready.
In its protocol update on Wednesday, the Ethereum Foundation outlined long-term post-quantum readiness as part of its broader security initiative.
Carallo said that although quantum computing poses long-term risks to Bitcoin, market makers don’t see it as a pressing short-term threat, arguing that the Bitcoin community is just looking for a scapegoat.
“There are a lot of Bitcoiners who want to blame something, blame someone for lackluster performance.”
Carallo said that a more likely reason for Bitcoin’s price decline is that it is now “competing for capital” in a way it never has before against other technologies such as artificial intelligence.
“AI is super capital-intensive,” he said, adding that it is a “massive new investment class that is substantially competing for capital.”
“There’s a lot of interest in value accrual that will happen because of AI in traditional equities,” Carallo said.
Bitcoiners are of the opposite opinion
Not all Bitcoiners agree with Carallo, as Capriole Investments founder Charles Edwards said at Cointelegraph’s LONGITUDE event on Feb. 12, that the risk should be priced into Bitcoin until it becomes quantum-resistant.
“Today, you kind of have to start to discount the value of Bitcoin based on that risk until it’s solved,” Edwards said.
Related: Bitcoin bottom signal that preceded 1,900% rally flashes again
Meanwhile, entrepreneur Kevin O’Leary told Magazine in December that using quantum computing to crack Bitcoin may not be the most efficient use of the resources, and there is more upside in using the technology for areas such as medical research.
In May 2025, the world’s largest asset manager, BlackRock, updated the registration statement for its iShares Bitcoin ETF (IBIT) to warn investors of the potential risks to the integrity of the Bitcoin network posed by quantum computing.
Magazine: Bitcoin may take 7 years to upgrade to post-quantum: BIP-360 co-author
TLDR:
- Metaplanet reports shareholder growth into the hundreds of thousands as its Bitcoin treasury strategy gains global reach.
- The company increased Bitcoin per share by over 500 percent in 2025 through accumulation and derivatives-based income.
- Management confirmed it will never sell Bitcoin and will rely on volatility-driven strategies to grow reserves.
- Executives acknowledged drawdowns but maintained that long-term fundamentals guide every treasury decision.
Metaplanet’s shareholder base has expanded to hundreds of thousands as the company doubles down on its Bitcoin-focused treasury strategy. The firm acknowledged market volatility while confirming that its accumulation plan remains unchanged.
Management pointed to rising global adoption and Bitcoin’s fixed supply as core drivers of confidence. The update comes as digital asset markets continue to test investor patience.
Metaplanet Bitcoin Strategy Centers on Long-Term Accumulation
Simon Gerovich credited the company’s rapid shareholder growth to sustained belief in its Bitcoin-centered model.
He said early support came from only a small group of investors. Today, ownership spans multiple regions, reflecting wider participation in crypto-linked equity strategies.
According to a statement shared on X, the firm increased its Bitcoin per share by more than 500 percent during 2025. The company framed this metric as its primary performance benchmark.
Management said every decision now prioritizes expanding that ratio over short-term price movements.
Gerovich also acknowledged that volatility has created difficult periods for shareholders. He noted that conviction does not remove the pain of drawdowns.
The company stressed that its outlook remains anchored in long-term fundamentals rather than short-term market cycles.
The executive added that criticism tends to intensify when Bitcoin prices decline. He argued that abandoning strategy during downturns usually leads to weaker long-term outcomes.
The company maintained that discipline matters most during unstable market conditions.
Derivatives and Market Outlook Shape Bitcoin Accumulation Plan
Metaplanet said its derivatives strategy allows it to acquire Bitcoin at more favorable levels than spot purchases alone.
The firm uses structured trading approaches designed to benefit from price swings. Management described this as a risk-managed method that supports consistent accumulation.
The company also highlighted income generation through derivatives as a core operational pillar. This approach aims to strengthen treasury growth without selling existing Bitcoin holdings.
Metaplanet reiterated that it does not plan to liquidate its reserves under any circumstances.
Gerovich shared a personal view that Bitcoin may have found support near the $60,000 level. He emphasized uncertainty and said no one can predict exact price direction.
Despite that view, the company said its strategy would not change regardless of short-term movements.
Metaplanet linked its long-term outlook to Bitcoin’s fixed supply and expanding global use. Management said these features support its belief in higher valuations over time. The firm stated that shareholder trust remains central to every operational decision.
The update was released through Gerovich’s verified social account and echoed the company’s broader messaging on transparency. It signals continued commitment to BTC accumulation amid fluctuating market sentiment.
The firm positioned itself among a growing group of Bitcoin treasury companies pursuing long-term exposure.


Crypto fear index fell from 12 to 10 this week as Iran’s Hormuz drills raised oil and energy risk for BTC miners.
Summary
- Crypto fear and greed index dropped from 12 to 10 as Iran’s naval drills briefly closed the Strait of Hormuz, a major oil route.
- Roughly 20–25% of seaborne oil and about 20% of global petroleum consumption move via Hormuz, making closures a direct shock channel to energy prices.
- Higher energy costs can compress BTC mining margins and force some miners to scale back or sell holdings, tightening market liquidity during macro uncertainty.
Cryptocurrency market sentiment declined this week as geopolitical tensions escalated in the Middle East, with Iran conducting military drills that temporarily shut down the Strait of Hormuz, according to market data and reports.
The crypto fear and greed index dropped from 12 points on Monday to 10 points on Tuesday, reflecting subdued market sentiment that coincided with rising tensions between Iran and the United States.
The Strait of Hormuz serves as a critical passage for global oil transport, with approximately 31 percent of all crude oil transported across oceans passing through the waterway. Disruptions to this route typically result in higher oil prices and increased energy costs globally.
Elevated energy costs could impact Bitcoin mining operations, potentially forcing some miners to reduce operations or liquidate cryptocurrency holdings to cover operational expenses, according to market analysts. This represents one mechanism through which geopolitical events affect cryptocurrency valuations and market liquidity.
Iran’s temporary closure of the strait occurred as part of military exercises, though the action came amid heightened tensions with the United States. Iranian and U.S. officials met in Geneva, Switzerland, this week for diplomatic talks, according to reports.
The outcome of those negotiations could determine the trajectory of regional tensions and their impact on global markets. A breakdown in talks could signal escalation, while successful de-escalation might improve market sentiment, analysts noted.
Cryptocurrency trading volumes remained low this week as investors awaited key U.S. economic data releases. The U.S. Federal Reserve was scheduled to release durable goods data mid-week, with Personal Consumption Expenditures (PCE) data expected Friday. Traders typically await such data to establish directional market positions.
Macro factors have influenced cryptocurrency markets in recent months, with risk-on assets including digital currencies showing sensitivity to geopolitical events and global economic conditions, according to market observers.
TLDR:
- FOCIL and EIP-8141 allow smart wallet and privacy transactions to reach blocks without wrappers or intermediaries.
- Randomized includers reduce proposer dominance and increase censorship resistance for all Ethereum transactions.
- Rapid inclusion within one or two slots becomes likely even under hostile network behavior.
- Future FOCIL expansion could support most block transactions while preserving MEV auction mechanics.
Ethereum is moving closer to censorship-resistant transaction inclusion after new technical links emerged between FOCIL and EIP-8141.
The update focuses on ensuring that all transaction types reach the blockchain quickly, even under hostile network conditions. It also expands how smart accounts and privacy protocols interact with block production.
The development highlights Ethereum’s push to reduce proposer power while keeping network incentives intact.
How FOCIL and EIP-8141 Enable Direct Transaction Inclusion
According to a post shared by CEO Vitalik Buterin, FOCIL works alongside EIP-8141 to make smart accounts and privacy tools first-class transaction senders.
EIP-8141 builds on account abstraction by allowing smart wallets to submit transactions directly onchain without wrappers or intermediaries. These accounts can support multisignature controls, quantum-resistant keys, and gas sponsorship.
FOCIL then ensures that these transactions gain rapid inclusion through randomly selected includers each slot. In every block, up to 17 actors can include transactions, instead of relying on a single proposer.
Vitalik noted that this structure creates a path for almost guaranteed inclusion within one or two slots. It also allows privacy protocol transactions to enter blocks through the public mempool without relying on broadcasters or relayers.
Why FOCIL and EIP-8141 Weaken Proposer Control
FOCIL currently limits each inclusion list to about 8 kilobytes, keeping the design lightweight in its first phase. However, the roadmap allows these lists to grow and potentially carry most transactions in future blocks.
The approach mirrors some features of multiple concurrent proposer models without removing proposer-builder separation. Instead, it preserves the MEV auction for the final ordering role through ePBS.
Even if all proposer slots were captured by a hostile entity, transactions would still reach blocks through FOCIL includers. This reduces the ability of any single actor to block or discriminate against certain applications.
The design shifts power away from centralized block producers while keeping economic incentives stable. It also protects smart wallet operations and privacy protocol activity from selective exclusion.
Developers say the combination strengthens the base layer against censorship without forcing changes to existing transaction flows. Transactions from smart accounts can move through the public mempool and directly reach includers.
With these changes, ETH positions itself to support a wider range of transaction types under adversarial conditions. The update reinforces ongoing work on account abstraction and block inclusion guarantees.
TLDR:
- Payward’s acquisition of Magna links token vesting and claims infrastructure directly into Kraken’s expanding product ecosystem.
- Magna will continue operating independently while its tools integrate with Kraken’s broader token issuance and distribution roadmap.
- The deal extends Kraken’s reach from trading into fundraising and long-term token lifecycle management services.
- Magna’s platform already supports over 160 projects with peak total value locked of $60 billion in 2025.
Payward has acquired Magna in a move that extends Kraken’s services beyond trading into token lifecycle management. The deal brings vesting, claims, and distribution tools into Kraken’s broader financial infrastructure stack.
Company leaders described the transaction as part of a push toward verticalized crypto services. Terms of the acquisition were not disclosed.
Payward Acquires Magna to Build End-to-End Token Infrastructure
The announcement came through a company blog post and was later echoed in a social update from Dave Ripley. The post confirmed that Magna will continue operating as a standalone platform while integrations progress.
Magna provides tooling for onchain and offchain vesting, token claims, custody workflows, and specialized staking features. These services support teams running complex token distributions and treasury operations.
According to Payward, the acquisition supports its expansion from trading infrastructure into fundraising, issuance, and long-term network management.
The company said Magna already serves teams managing billions of dollars in active token ecosystems.
Arjun Sethi framed the deal as an effort to avoid concentration around distribution and access. He said open, chain-aware infrastructure connects fundraising, liquidity, and distribution into one operating layer.
Kraken Expands Beyond Trading With Magna Integration
Kraken’s on-chain leadership linked the move to a broader strategy around issuer services. Calvin Leyon said the exchange aims to extend trusted infrastructure across the full token lifecycle.
Magna will initially focus on onboarding and security hardening while preserving its existing integrations. Payward said later phases will align the platform with token issuance and global distribution workflows.
Magna’s client base includes more than 160 projects, with peak total value locked reaching $60 billion in 2025. The company has positioned itself as a core operational layer for token generation events and ongoing community management.
Bruno Faviero stated that joining Kraken provides resources for deeper liquidity and global reach. He added that Magna will continue supporting teams across multiple chains and custody setups.
Payward confirmed that Magna customers can keep using current products without disruption. Product updates will roll out gradually as foundational integrations advance.
The acquisition strengthens Kraken’s role beyond exchange services into infrastructure for builders and issuers. It also signals growing demand for standardized tools that manage vesting, distribution, and compliance at s
Brokerage that nailed gold, silver bull run targets fresh record highs

Illicit Stablecoins Reach 5-Year High at $141B in 2025, TRM Labs

Brooke Hogan Toys With Foot Fetish Modeling Since She’s Got the Goods


-

 Video3 days ago
Bitcoin: We’re Entering The Most Dangerous Phase
-

 Tech5 days ago
Luxman Enters Its Second Century with the D-100 SACD Player and L-100 Integrated Amplifier
-

 Crypto World3 days ago
Can XRP Price Successfully Register a 33% Breakout Past $2?
-

 Sports3 days ago
GB's semi-final hopes hang by thread after loss to Switzerland
-

 Video7 days ago
The Final Warning: XRP Is Entering The Chaos Zone
-
 Tech3 days ago
The Music Industry Enters Its Less-Is-More Era
-

 Video1 hour ago
XRP News: XRP Just Entered a New Phase (Almost Nobody Noticed)
-

 Business2 days ago
Infosys Limited (INFY) Discusses Tech Transitions and the Unique Aspects of the AI Era Transcript
-

 Entertainment2 days ago
Kunal Nayyar’s Secret Acts Of Kindness Sparks Online Discussion
-

 Video3 days ago
Financial Statement Analysis | Complete Chapter Revision in 10 Minutes | Class 12 Board exam 2026
-

 Tech2 days ago
Retro Rover: LT6502 Laptop Packs 8-Bit Power On The Go
-
 Crypto World6 days ago
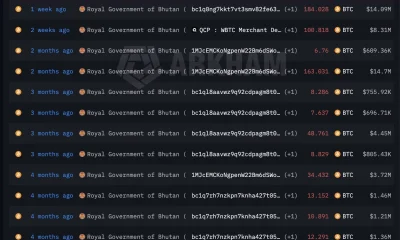
Bhutan’s Bitcoin sales enter third straight week with $6.7M BTC offload
-
 Sports24 hours ago
Clearing the boundary, crossing into history: J&K end 67-year wait, enter maiden Ranji Trophy final | Cricket News
-

 Entertainment1 day ago
Dolores Catania Blasts Rob Rausch For Turning On ‘Housewives’ On ‘Traitors’
-

 Crypto World7 days ago
Kalshi enters $9B sports insurance market with new brokerage deal
-

 Business2 days ago
Tesla avoids California suspension after ending ‘autopilot’ marketing
-
 NewsBeat4 days ago
The strange Cambridgeshire cemetery that forbade church rectors from entering
-

 Crypto World1 day ago
WLFI Crypto Surges Toward $0.12 as Whale Buys $2.75M Before Trump-Linked Forum
-
 NewsBeat5 days ago
Man dies after entering floodwater during police pursuit
-

 Crypto World6 hours ago
83% of Altcoins Enter Bear Trend as Liquidity Crunch Tightens Grip on Crypto Market