

Crypto World
BitMine Is Confident in Ethereum’s Recovery: Here’s Why
Ethereum (ETH) is holding below $2,000, leaving many investors underwater as the downtrend extends into February 2026.
Despite the sustained weakness, BitMine has maintained a bullish stance on Ethereum. This raises a key question: Is their confidence driven by narrative or sentiment, or is there another factor behind their conviction?
Ethereum’s Pain Reaches 9th Decile: What Does That Mean For The Price?
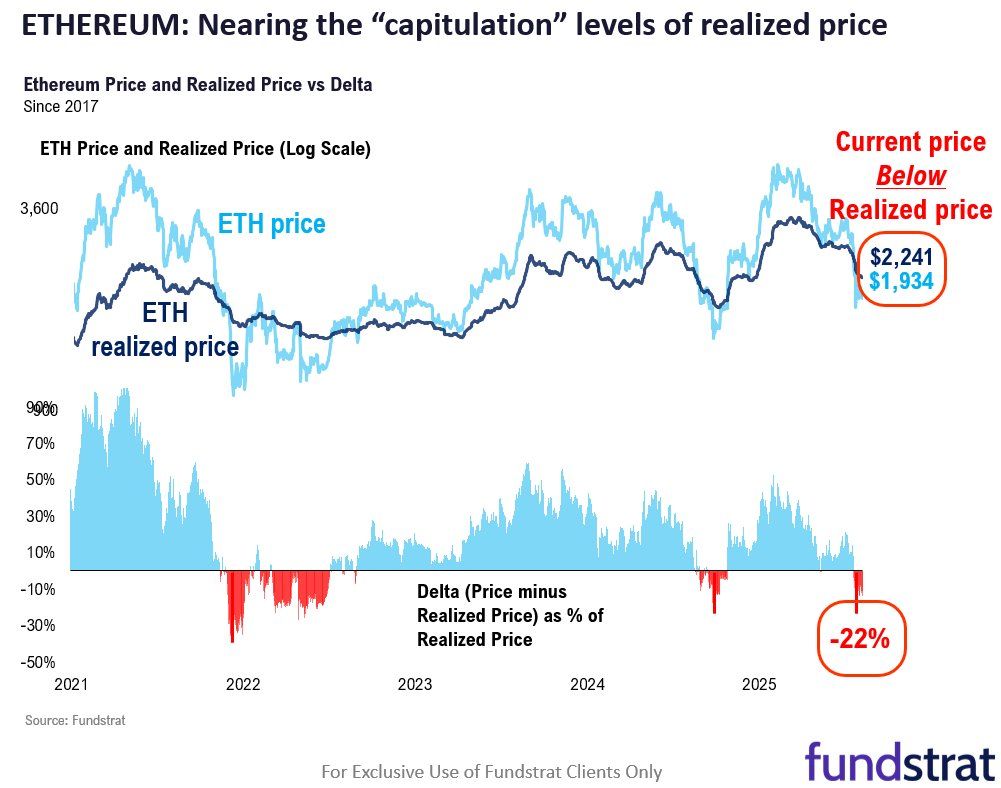
In a detailed post on X (formerly Twitter), BitMine highlighted the research by Sean Farrell, Fundstrat’s Head of Digital Asset Strategy, focusing on Ethereum’s realized price. This is an on-chain valuation metric that reflects the average acquisition cost of all coins currently in circulation.
According to the data, Ethereum’s realized price stands at $2,241. At the time of the analysis, the asset was trading near $1,934.
This leaves the average holder in the red. According to Fundstrat’s model, the “loss for realized price was 22%.”

The analysis compared the current drawdown to prior cycle lows. During the 2022 bear market, Ethereum traded as much as 39% below its realized price. In 2025, the discount reached approximately 21%.
“If we apply this ‘loss’ to the current realized ETH price of $2,241, we get implied ‘lows’ for ETH. Using 2022, this implies $1,367. Using 2025, this implies $1,770,” the analysis noted.
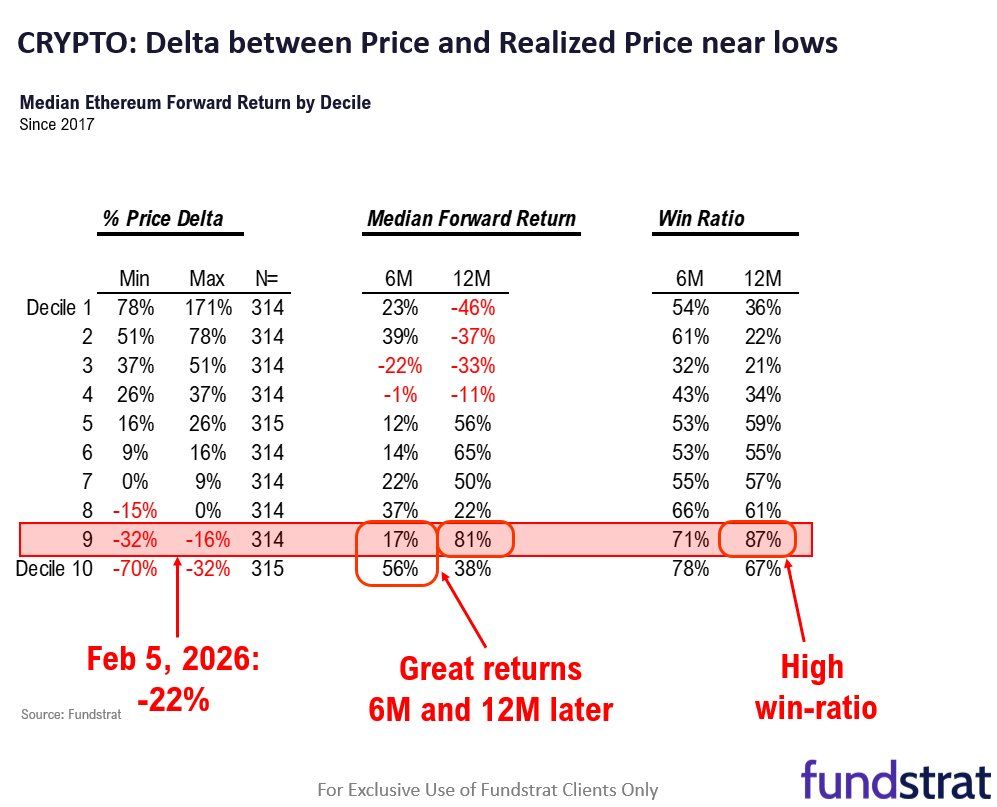
Using a decile analysis, the post revealed that the current drawdown falls into the 9th decile (extremely high). For context, a decile analysis is a quantitative method used in statistics, finance, and marketing to segment a dataset into 10 equal-sized groups (deciles) based on the distribution of a specific variable.
The data suggests that the median 12-month forward return in this decile was approximately 81%, with a 12-month win ratio of 87%. In other words, in most historical instances when ETH reached similar drawdown levels, it was trading higher one year later.
“Is this the bottom? Seems like we are closing in on that low. Looking beyond the near-term, the risk/reward for ETH is positive,” the post read.
BitMine Chairman Tom Lee previously emphasized that sharp drawdowns are a recurring feature of Ethereum’s price history. Since 2018, ETH has experienced eight separate declines of 50% or more from local highs, suggesting that corrections of this magnitude have occurred roughly once per year.
In 2025, Ethereum fell 64% between January and March. Despite that steep drop, the asset later rebounded significantly.
“ETH sees V-shaped recoveries from major lows. This happened in each of the 8 prior declines of 50% or more. A similar recovery is expected in 2026. The best investment opportunities in crypto have presented themselves after declines. Think back to 2025, the single best entry points in crypto occurred after markets fell sharply due to tariff concerns,” Lee said.
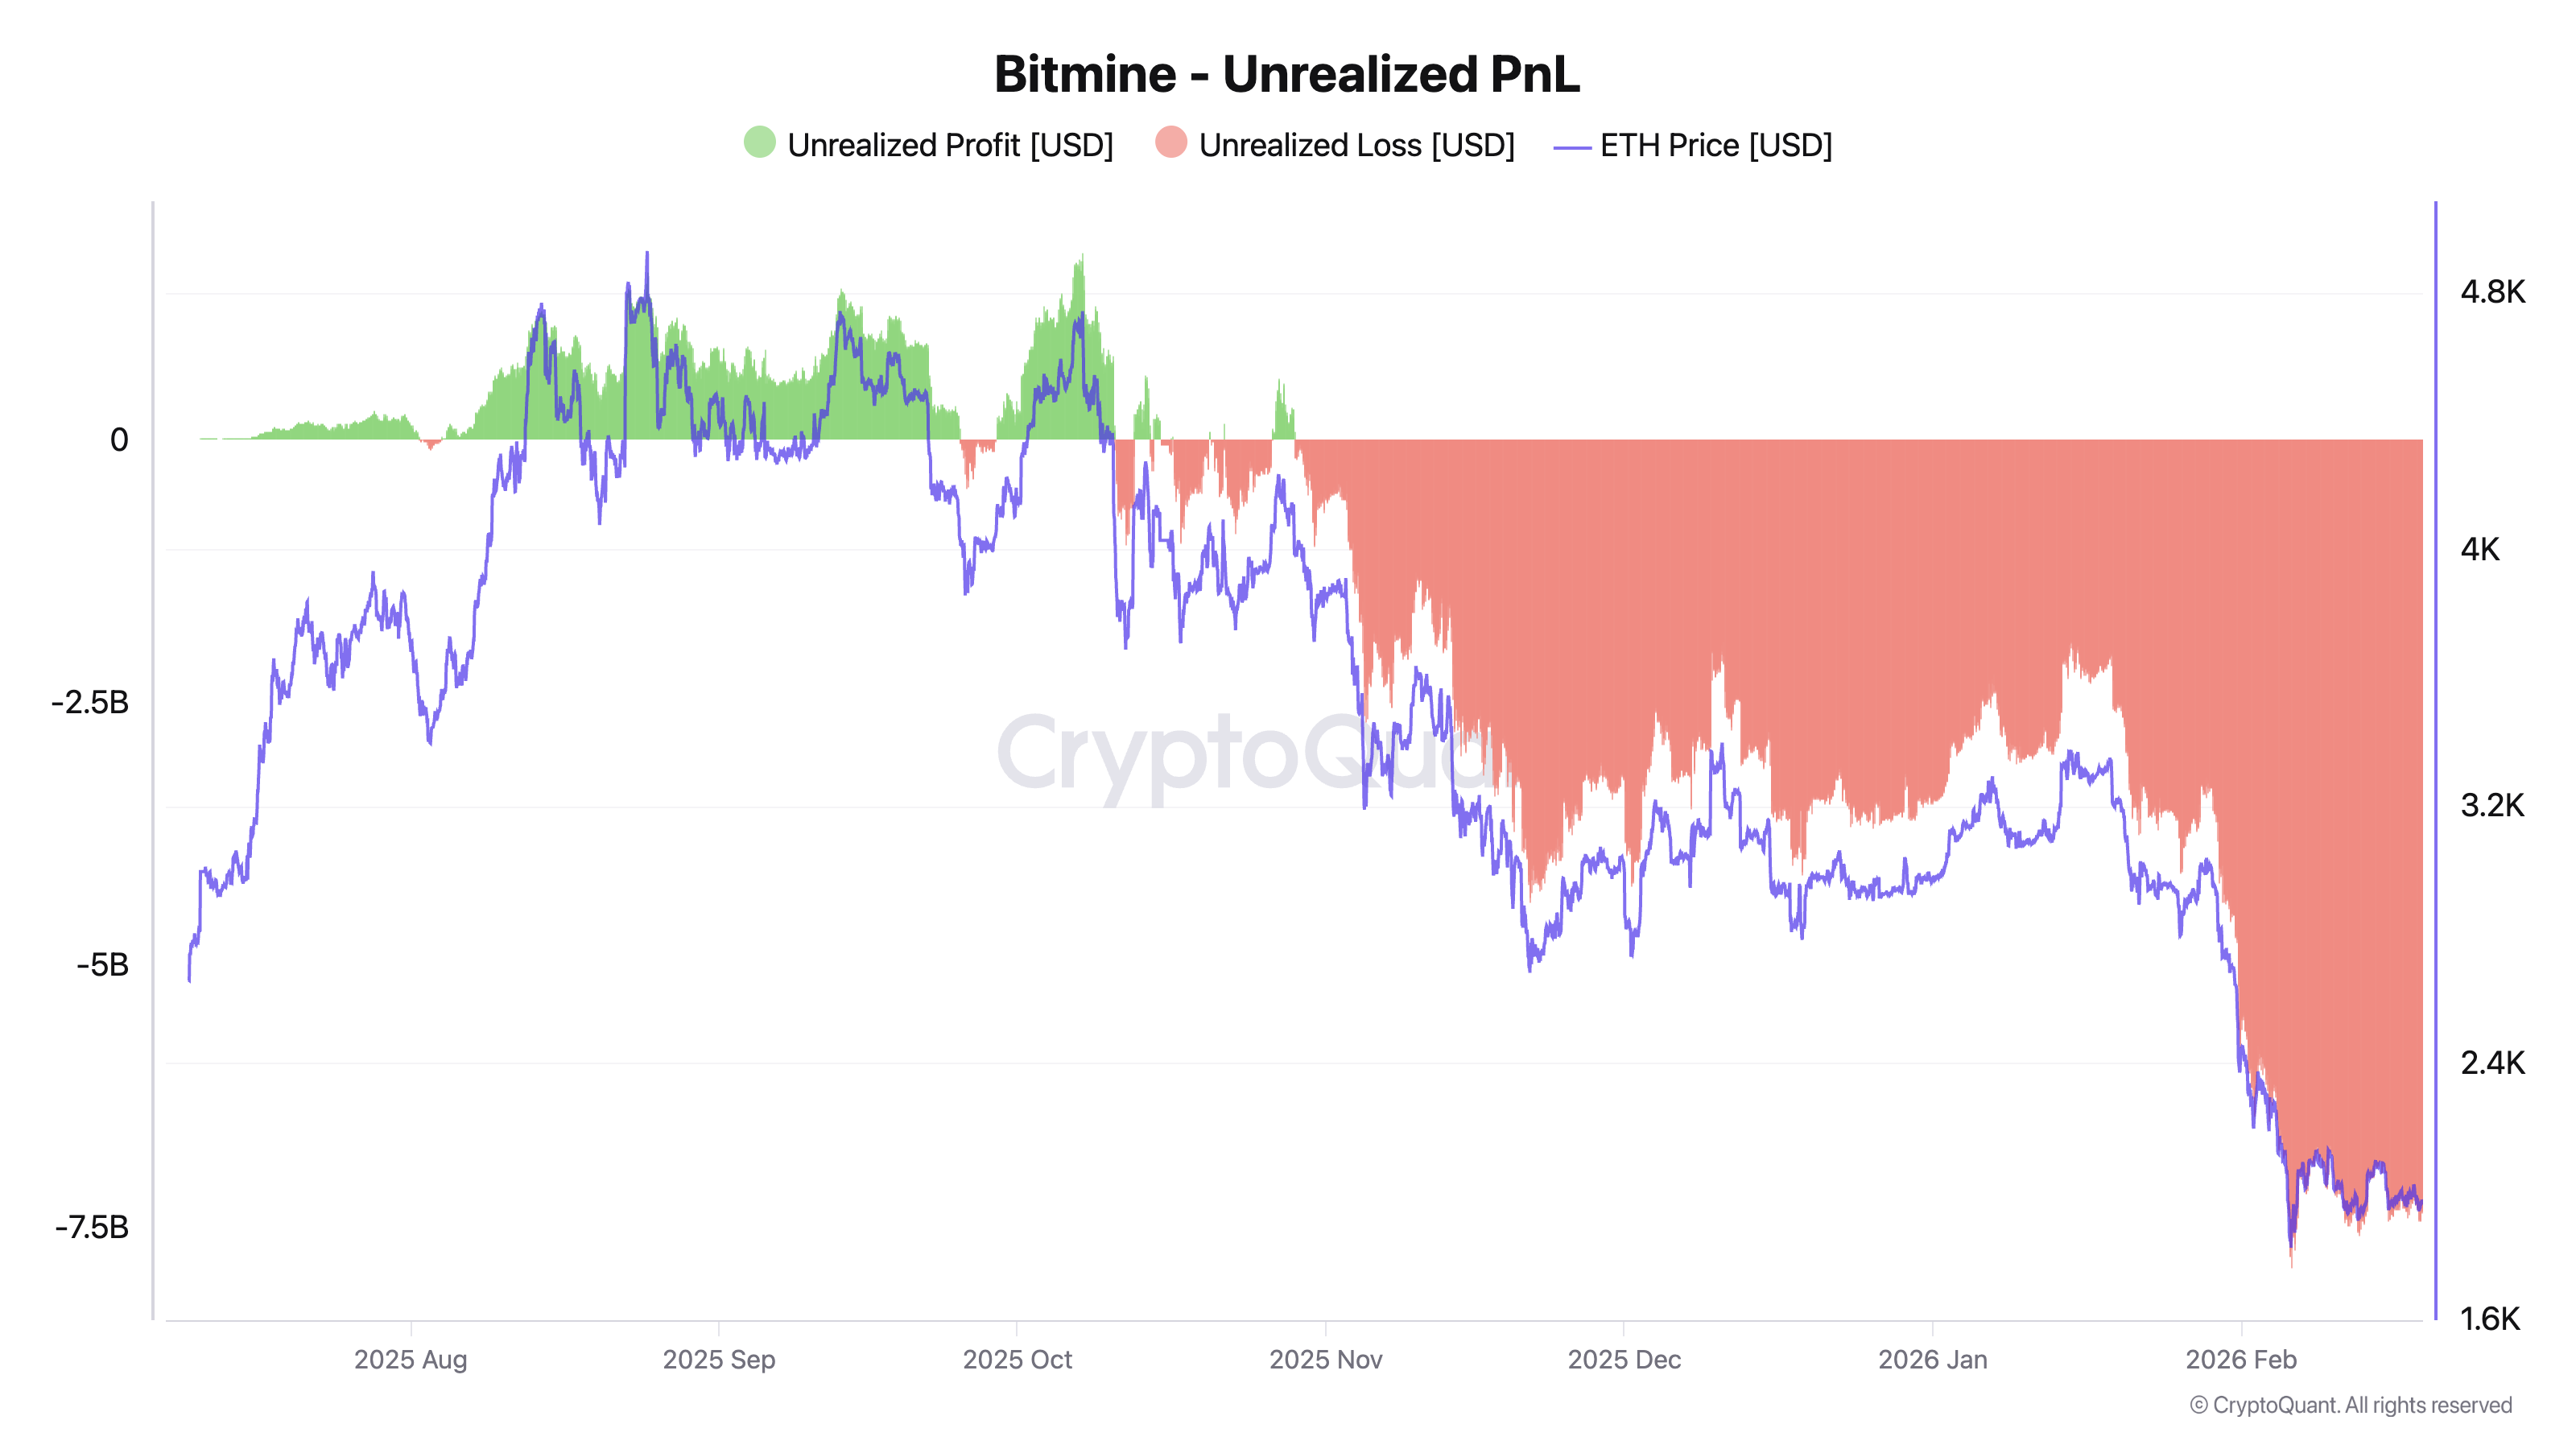
Ethereum Recovery Could Be Critical for BitMine’s $7 Billion Underwater Position
If Ethereum delivers a sustained recovery with strong upside returns, it could represent a meaningful inflection point for investors, particularly BitMine. The company’s unrealized losses have expanded to approximately $7 billion, according to CryptoQuant data.
At the same time, BitMine appears to be reinforcing its bullish stance through continued accumulation. Lookonchain reported that the firm purchased 10,000 ETH from Kraken today.
This transaction followed a much larger single-day acquisition of 35,000 ETH. BitMine acquired 20,000 ETH from BitGo and 15,000 ETH from FalconX.
Taken together, the purchases suggest that despite mounting unrealized losses, BitMine is positioning for a potential upside scenario rather than reducing exposure.


- AZTEC has surged nearly 80% after listing on major Korean exchanges.
- AZTEC has gained traction as a privacy-focused Ethereum Layer 2 solution.
- Key levels to watch are the support at $0.0188 and the resistance at $0.0371.
The Ethereum-based privacy token AZTEC has seen a dramatic surge in its price over the last 24 hours.
The current price of AZTEC is around $0.035, representing an impressive increase of nearly 80% in a single day.

Trading volumes have also spiked, reflecting heightened market activity and strong investor interest.
Exchange listings fuel the rally
One of the main drivers behind AZTEC’s surge is its listing on major South Korean exchanges.
Upbit and Bithumb have added AZTEC trading pairs, including KRW-denominated options.
These listings make it easier for South Korean retail traders to access the token directly, without needing USDT or BTC as intermediaries.
The immediate effect has been a sharp increase in buying pressure, pushing the token to new all-time highs.
Such regional exchange activity often creates a premium, as local traders bid aggressively in the initial hours after a listing.
This surge is further supported by the token’s presence on global exchanges like Coinbase, Kraken, Bybit, KuCoin, and MEXC, which listed the token on February 12, immediately after the protocol went live.
What is AZTEC?
AZTEC is not just another altcoin.
It is the native token of Aztec, a privacy-focused Layer 2 protocol built on the Ethereum Network.
The protocol uses zero-knowledge proofs to enable private transactions while maintaining Ethereum’s security standards.
This combination of privacy and scalability makes Aztec particularly appealing to users and developers looking for confidential and efficient transaction solutions.
Recent protocol upgrades and network developments have also helped strengthen confidence in the token.
Investors see both short-term trading opportunities and long-term potential as adoption grows.
The market’s response reflects the perception that privacy solutions on Ethereum are gaining traction in a competitive landscape.
AZTEC price forecast
For traders and investors alike, the coming days will be crucial in determining if AZTEC can sustain its momentum and reach higher price levels.
The immediate support lies near $0.0188, which was the lower bound of the recent 24-hour range.
On the upside, the immediate resistance is at the current all-time high of around $0.0371.
If the token can break above $0.0371, the next area of interest may approach $0.04, a psychological barrier for many traders.
However, given the rapid pace of this rally, some short-term pullbacks are possible.
Volume trends and activity on both Korean and global exchanges will likely influence the next moves.
In the short term, traders should watch for consolidation around the $0.03–$0.035 range, as this may determine whether the rally continues or enters a retracement phase.
Hedera’s native token, HBAR, is attempting to regain lost ground after weeks of constrained trading. The price recently approached the $0.10 threshold but failed to secure a decisive breakout. Since the beginning of the month, resistance near this level has limited upward progress.
While HBAR briefly reclaimed $0.10, momentum stalled just below a key technical barrier. Traders have adjusted their positioning, though not decisively in favor of sustained upside.
HBAR Holders Are Buying
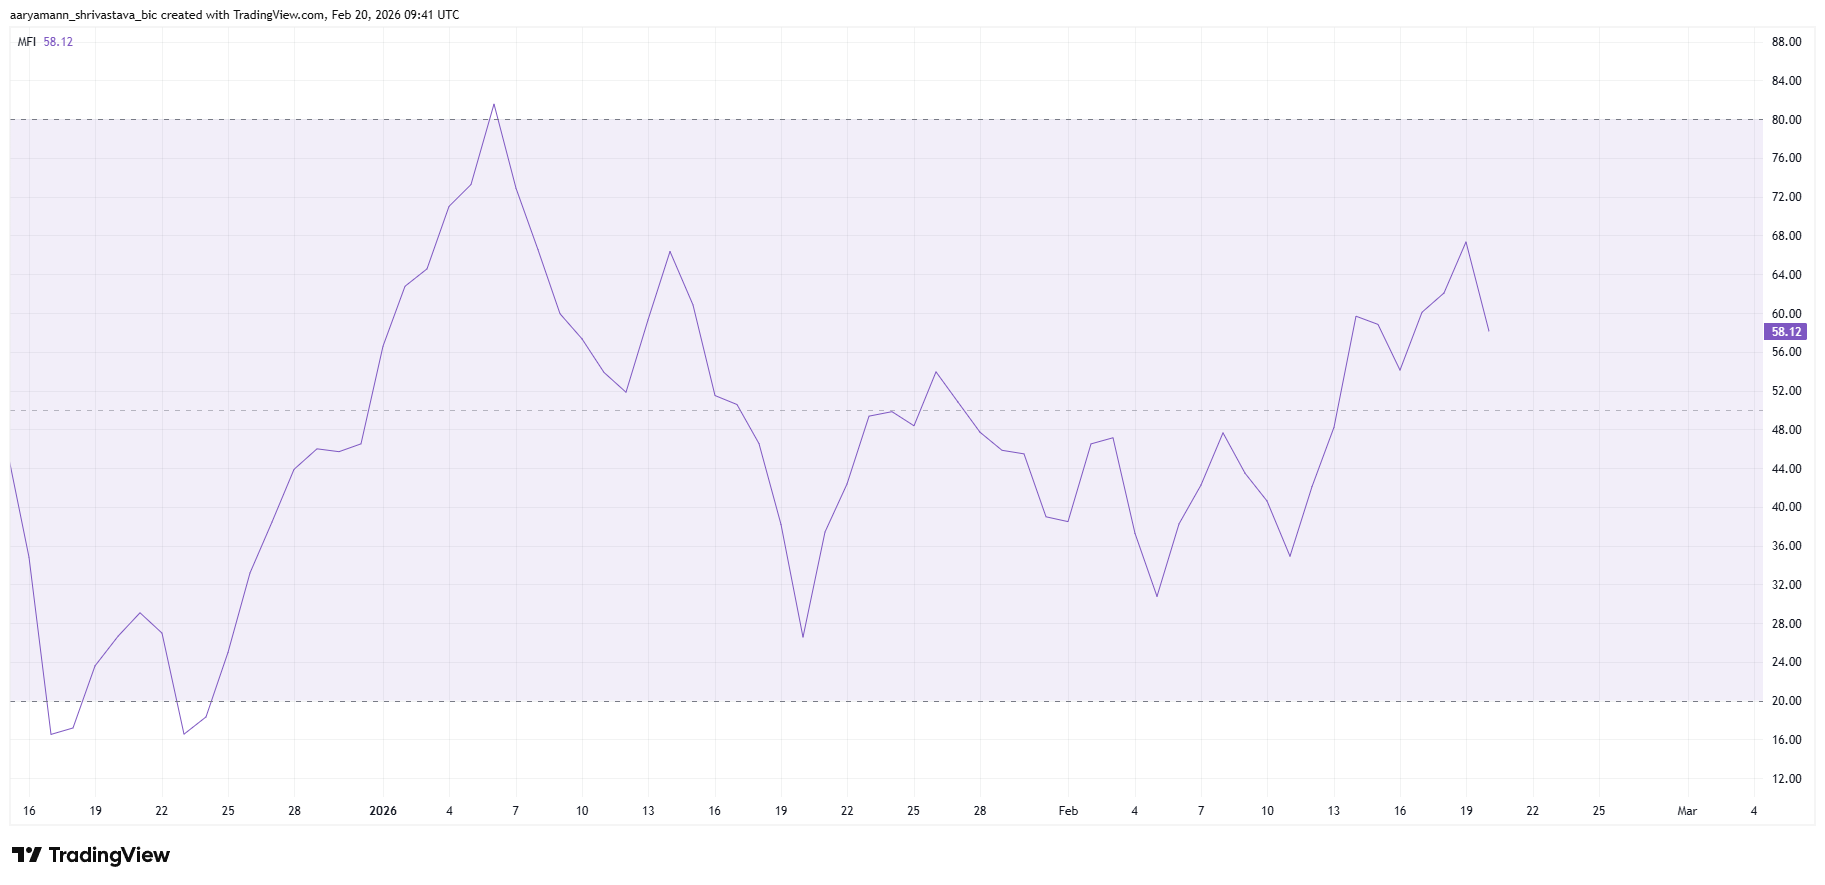
The Money Flow Index, or MFI, indicates that buying pressure is gradually building on HBAR. This volume-weighted momentum indicator measures capital inflows and outflows based on both price and trading volume. Currently, the MFI is positioned above the neutral 50 mark, signaling that buyers are regaining influence.
An MFI reading in positive territory suggests accumulation may be underway. Rising inflows often precede price appreciation, especially when supported by higher trading activity. If this trend continues, HBAR could benefit from sustained accumulation, strengthening the case for a recovery attempt above immediate resistance levels.
Want more token insights like this? Sign up for Editor Harsh Notariya’s Daily Crypto Newsletter here.

Hedera Traders Remain Skeptical
Broader derivatives data offer a mixed but slightly constructive outlook. HBAR’s funding rate is currently skewed toward long positions, indicating that traders are willing to pay a premium to hold bullish contracts. Positive funding rates typically reflect expectations of upward price movement.
However, volatility in the funding rate over the past two weeks highlights lingering uncertainty. Between February 6 and February 11, short contracts dominated open interest, placing downward pressure on HBAR. This dominance quickly reversed, turned positive, and then shifted negative again.
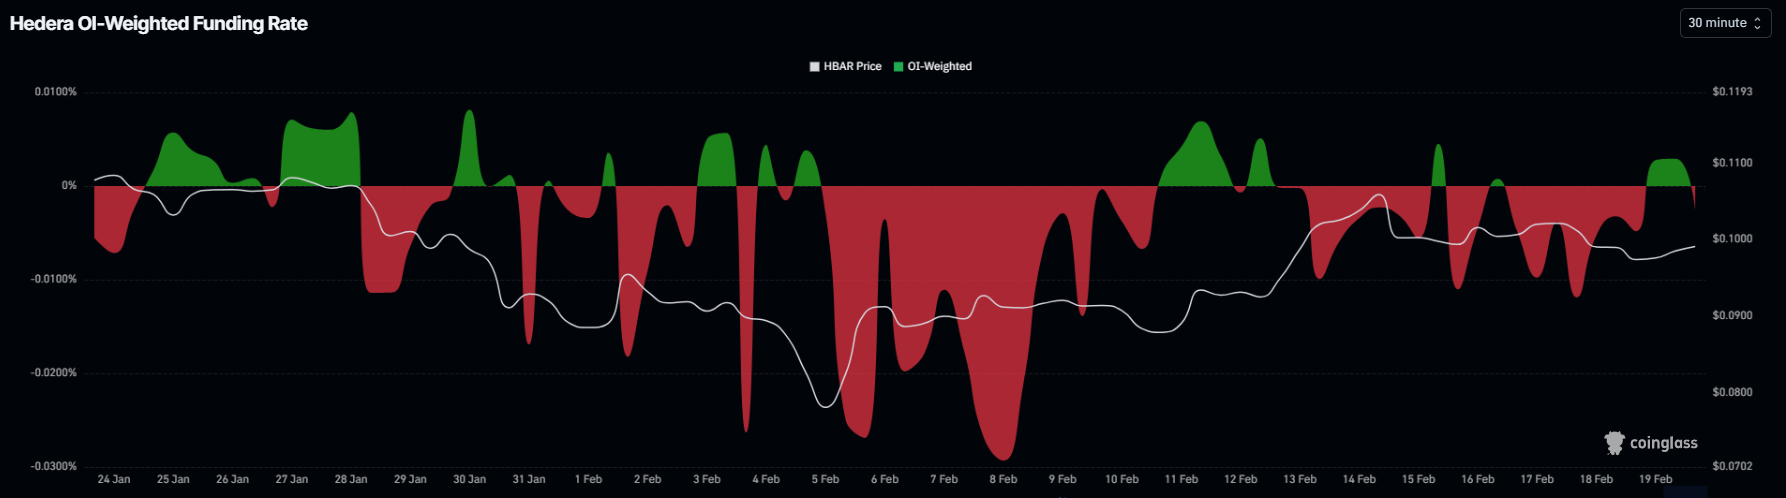
Such fluctuations reveal hesitation among leveraged traders. Although short dominance has declined recently, conviction remains fragile. Stable positive funding would strengthen the bullish thesis, but current data suggests sentiment is still reactive to short-term price swings rather than anchored in long-term confidence.
HBAR Price Aims High
HBAR is trading at $0.0992 at the time of writing. The token remains above the $0.0961 support level, which aligns with the 38.2% Fibonacci retracement. Holding this level is technically significant, as it represents a key inflection point for trend continuation.
However, resistance at $0.1035, at the 50% Fibonacci retracement, is capping upward movement and limiting breakout attempts.
A decisive move above $0.1035 would signal a short-term structural shift. Turning this resistance into support could attract fresh demand, particularly if buying pressure continues to rise.
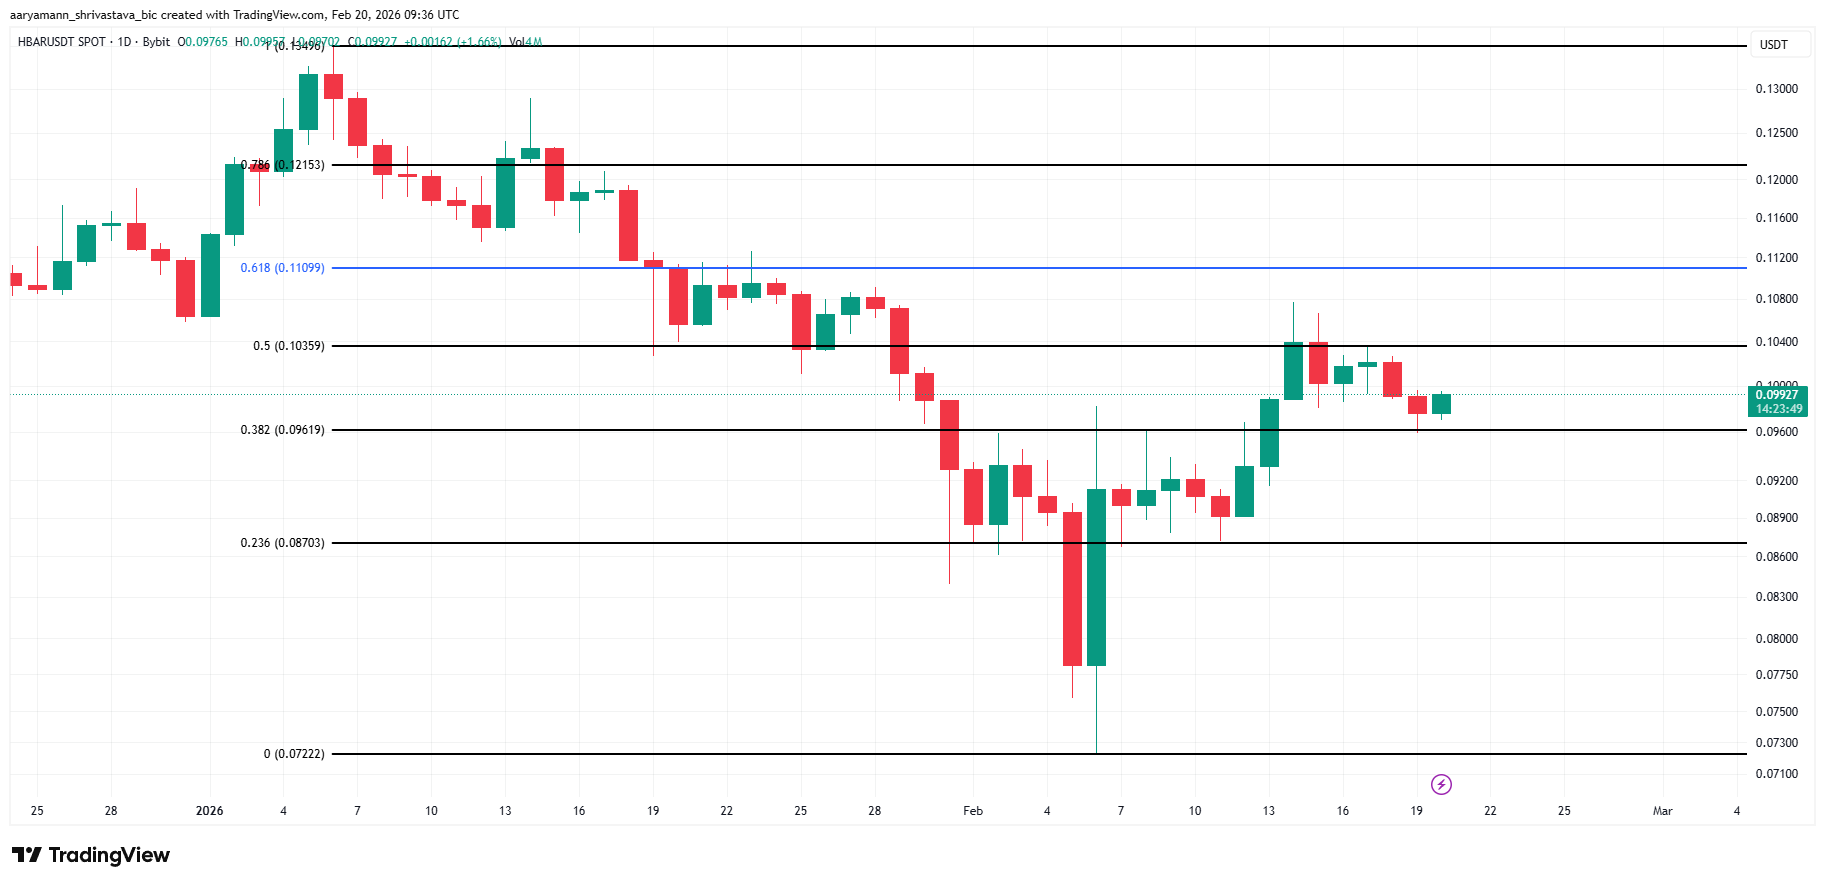
The next target would stand at $0.1109, corresponding to the 61.8% Fibonacci retracement. This level is widely monitored by traders and often acts as a strong support zone once reclaimed.
However, if bullish indicators fail to strengthen, consolidation may persist near current levels. Continued outflows would weaken breakout attempts and reinforce resistance at $0.1035.
A breakdown below the $0.0961 support would shift the short-term structure bearish. In that scenario, HBAR could decline toward $0.0870, invalidating the immediate recovery outlook and restoring stronger control to sellers.
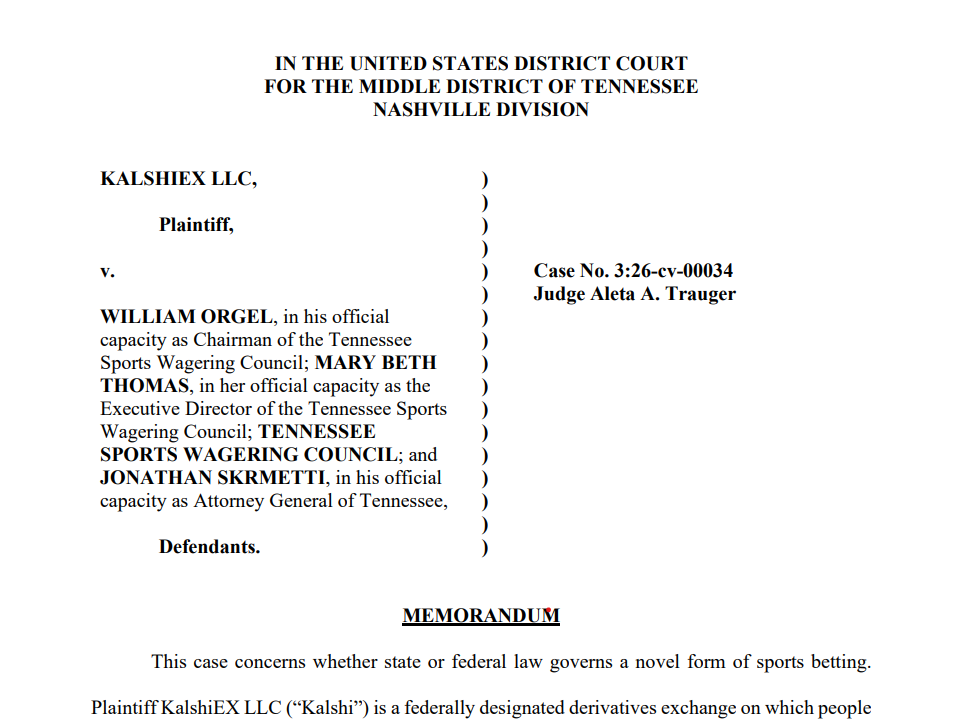
A US federal judge in Tennessee temporarily blocked the state from enforcing its gambling laws against prediction markets operator Kalshi’s sports event contracts.
The ruling, issued by Judge Aleta Trauger of the US District Court for the Middle District of Tennessee on Thursday, allows Kalshi to continue offering sports-related event contracts to users in the state while its lawsuit against Tennessee regulators proceeds.
Trauger found that Kalshi is likely to succeed on the merits of its claim that federal commodities law preempts Tennessee’s attempt to regulate its sports markets as illegal gambling.
The court concluded that Kalshi’s sports event contracts are “swaps” under the Commodity Exchange Act, over which the law grants the US Commodity Futures Trading Commission (CFTC) exclusive jurisdiction, and held that Tennessee’s enforcement efforts are likely preempted under conflict preemption principles.

The injunction applies to the identified state officials, while the Tennessee Sports Wagering Council itself was dismissed on sovereign immunity grounds, and Kalshi was ordered to post a $500,000 bond.
Long-running clash with states
The Tennessee case marks another chapter in a broader clash over how to treat event contracts in the United States.
An earlier temporary restraining order from Trauger had already paused enforcement of Tennessee’s cease-and-desist letter, which alleged that Kalshi was operating unlicensed sports wagering, ordered it to stop offering sports event contracts to customers in Tennessee, void those contracts and refund deposits, and threatened fines and further legal action.
Related: Nevada court hits Polymarket with temporary restraining order, tests CFTC control
Kalshi has similarly gone to federal court in multiple states, including Nevada, New Jersey, and Connecticut, over cease-and-desist actions targeting its event markets, with courts reaching divergent conclusions on whether to grant preliminary relief.
CFTC steps in to defend prediction markets
The injunction also lands against a shifting federal backdrop, as the CFTC moves to assert primacy over prediction markets.
In a video message on Tuesday, CFTC Chair Michael Selig said the agency had filed a friend-of-the-court brief to defend its “exclusive jurisdiction” over prediction markets, warning state authorities that the commission would meet them in court if they tried to undermine federal oversight of these derivative markets.
AI Eye: IronClaw rivals OpenClaw, Olas launches bots for Polymarket

TLDR
- Tesla launched its cheapest Cybertruck yet at $59,990 with a dual-motor AWD setup
- Cyberbeast price slashed from $114,990 to $99,990
- US Cybertruck sales fell to 20,237 units in 2025, half of 2024 totals
- The new base model has lower towing capacity and textile seats
- Tesla is removing the Luxe Package from the Cyberbeast, dropping bundled FSD and free Supercharging
Tesla announced a new entry-level Cybertruck Thursday, priced at $59,990, as the company tries to reverse a steep sales decline for its electric pickup.
The new dual-motor AWD model is the most affordable Cybertruck Tesla has ever sold. It trades some premium features for a lower price tag, coming with textile seats, heated front seats only, and a towing capacity of 7,500 pounds — down from 11,000 pounds on higher trims.
Tesla also cut the Cyberbeast price from $114,990 to $99,990. The company appears to be dropping its “Luxe Package” in the process, which had included Supervised Full Self-Driving and free Supercharger access.
Sales Are Falling Fast
The price moves come after a rough 2025 for the Cybertruck. Tesla sold just 20,237 units in the US last year, according to Cox Automotive data from January. That is half of 2024 sales and far below Musk’s 2023 forecast of 250,000 units annually.
The broader EV market has also softened since September, when the Trump administration ended the $7,500 federal EV tax credit. That has pushed price-sensitive buyers to the sidelines and increased pressure on Tesla to lower its sticker prices.
Even at $59,990, the Cybertruck remains a premium product. The Ford F-150, which Musk has long cited as a rival, starts at $39,330.
Margin Pressure Builds
Analysts have raised concerns that a shift toward cheaper models could hurt Tesla’s margins unless the company cuts manufacturing costs or grows software and services revenue to compensate.
Price cuts are now central to Tesla’s 2026 playbook. Earlier this month, Tesla also launched a new AWD Model Y variant at $41,990.
The Cybertruck has had a turbulent history beyond sales numbers. It has faced several recalls covering its rearview camera, windshield wiper, and reports of jammed accelerator pedals.
Factory Changes Ahead
Musk confirmed last month that Tesla will stop making the Model X and Model S, converting that California factory space to humanoid robot production instead.
Tesla stock closed at $411.71 on Thursday, up 0.12% on the day.


As cryptocurrency becomes increasingly intertwined with traditional finance, it is also forming the backbone of a parallel, shadow financial system that operates beyond conventional rails. A January report from TRM Labs highlighted a surge in illicit or illegal crypto use, climbing to an all-time high of $158 billion in 2025, with sanctions evasion accounting for a notable share of the activity. The analysis points to a major driver: a ruble-backed stablecoin and its ecosystem, built around the A7A5 project, which has moved billions in sanctioned value through on-chain channels. The rise of A7A5 underscores how crypto is becoming a strategic instrument for state-aligned actors seeking alternative settlement mechanisms amid growing financial restrictions.
Key takeaways
- Illicit crypto activity reached $158 billion in the referenced period, with sanctions evasion comprising a substantial portion of flows according to the TRM Labs report.
- A7A5, a ruble-based stablecoin, emerged as a focal point, with about $39 billion of sanctions-related flows attributed to its wallet cluster.
- The project is co-owned by Ilan Shor, a Moldovan-Russian political figure under sanctions, and the state-owned Promsvyazbank (PSB), linking the digital asset to established financial interests.
- Trading has shifted across multiple platforms after sanctions targeted central exchanges, with Grinex serving as a key on-ramp and other venues like Meer and Bitpapa facilitating activity despite OFAC restrictions.
- Regulators and researchers note that the A7A5 network reflects a more deliberate, state-aligned approach to crypto-enabled cross-border transfers, rather than merely opportunistic illicit use.
Tickers mentioned: $BTC
Sentiment: Neutral
Market context: The expansion of crypto-enabled flows in sanctioned environments occurs amid broader regulatory tightening, shifting risk sentiment in digital assets, and the emergence of alternative rails as traditional payment networks retreat from sanctioned jurisdictions.
Why it matters
The TRM Labs report situates A7A5 within a wider ecosystem where crypto is not just a tool for illicit finance but a potential backbone for sanctioned regimes seeking to maintain cross-border commerce. The $39 billion attributed to the A7 wallet cluster signals the scale at which a state-backed crypto network can influence the global settlement landscape, particularly as Western payment rails recede from Russia and allied actors. This development raises questions about the resilience and resilience testing of on-chain infrastructures in regions where sovereign finance is constrained, and about the evolving role of stablecoins in state-aided economic activity.
Analysts emphasize that the illicit crypto economy has evolved beyond the darknet and ransomware into a more formalized financial system that supports sanctioned activities. Ari Redbord, global head of policy at TRM Labs, described the A7A5 network as not merely experimenting with crypto but building durable, on-chain infrastructure linked to state objectives. The finding that wallets tied to the A7 network handled tens of billions in flows in 2025 illustrates how such systems are designed to operate at scale, with intent that aligns with national economic strategies rather than narrow illicit aims.
From a regulatory standpoint, A7A5’s trajectory has drawn scrutiny from researchers who point to a pattern of cross-border transfers and a cluster of related entities under the A7 umbrella, including A7-Agent, A7 Goldinvest and A71. The involvement of a sanctioned figure and a state bank creates a tightly interwoven financial ecosystem that can withstand pressure from conventional sanctions regimes, at least in the near term. Russia’s broader approach to digital assets—evolving from a prohibition to the development of sanctioned, but potentially globally accessible, crypto rails—adds an additional layer of complexity to how policymakers view digital currencies and their use in geopolitical contexts.
Industry voices stress that the picture is not solely about evading sanctions, but about enabling state-aligned economic flows that leverage the on-chain nature of modern finance. Chainalysis highlighted patterns such as weekday-dominant trading activity, suggesting that the A7A5 network is functioning within a structured, business-oriented framework rather than sporadic, criminal use. The implication is that sanctioned actors may be constructing repeatable, auditable workflows that resemble legitimate cross-border commerce in many respects, even as they operate in a legally gray area in others.
On the corporate front, spokespeople and officials have defended the project, arguing that it operates within regulatory boundaries and adheres to standard KYC/AML practices. Oleg Ogienko, A7A5’s director for regulatory and overseas affairs, emphasized that the company complies with Kyrgyzstan’s laws where it operates and follows due diligence processes. Critics, however, point to the broader implications of a sanctioned network becoming an alternative payment rail, potentially enabling a broader set of sanctioned actors to bypass established financial channels.
The story also intersects with Russia’s domestic policy trajectory. In December 2024, the Russian government signaled a shift by allowing foreign trade in “digital financial assets” and Bitcoin mined domestically, framing crypto as part of the future of global payments settlement rather than as a conventional investment vehicle. This context helps explain why a ruble-based stablecoin project could gain traction as a cross-border instrument, particularly in environments facing sanctions and currency controls.
During 2025, the A7A5 ecosystem broadened its footprint across multiple trading venues after the initial rollout on a Moscow-based exchange. Garantex—an exchange previously prominent in the region—was sanctioned and subsequently shut down, but trading persisted on Grinex, a Kyrgyzstan-based platform that Chainalysis identified as the confirmed successor to the Russian partner and that continued to accept transfers from Garantex after its closure. Additional listings appeared on Kyrgyz and regional platforms such as Meer and Bitpapa, even as OFAC sanctions targeted some of these venues. The growth in token activity across these platforms, despite sanctions, underscored how quickly crypto ecosystems can adapt to regulatory pressure while still enabling significant value transfer.
The industry narrative includes questions about why such networks persist and how they will be treated under evolving sanctions regimes. Some observers argue that the A7A5 project represents a strategic experiment rather than an isolated anomaly—a deliberate attempt to build an alternative payment rails infrastructure that can operate in parallel with traditional channels when those channels are constrained by policy actions. As the geopolitical landscape remains fluid, the balance between enabling legitimate commerce and curbing sanctioned activity will continue to be tested through on-chain technologies and cross-border finance strategies.
Beyond the technical and regulatory discussion, the ecosystem’s expansion sparked practical developments. In mid-2025, PSB cardholders were announced to be able to purchase A7A5 tokens with cards, with plans to broaden this service to additional banks. The move signals a broadening push to integrate the token into conventional consumer financial flows, blurring the lines between digital assets and everyday payments—even as the regulatory status of such use remains under close scrutiny.
As policymakers and researchers monitor the trajectory of A7A5 and related networks, the broader question remains: to what extent can sanctioned actors leverage stablecoins and on-chain rails to sustain international trade when conventional channels are constrained? The answer may hinge on regulatory clarity, on-chain transparency, and the capacity of authorities to enforce restrictions without stifling legitimate economic activity in sanctioned regions.
For readers seeking to explore the broader context of how state actors are interacting with crypto and how financial systems adapt under sanctions, related discussions, including analyses on the global reserve currency implications of such moves, provide additional angles on the evolving crypto-finance interface.
What to watch next
- Regulatory updates on OFAC and other sanctions bodies regarding A7A5 and related exchanges (Garantex, Grinex, Meer, Bitpapa) in 2026.
- Any formal government statements or legislative steps in Russia or allied states about digital financial assets and cross-border crypto trade.
- Follow-on analyses from TRM Labs and Chainalysis that quantify flows linked to sanctioned networks and their evolution over the year.
- Adoption signals from PSB or other banks about expanding card-based purchases of A7A5 and similar tokens.
Sources & verification
- TRM Labs 2026 Crypto Crime Report detailing the surge in illicit crypto activity and sanctions-related flows.
- Chainalysis analysis on the A7A5 ecosystem, Grinex, and sanctions-related activity, including platform handoffs after exchange sanctions.
- Astraea Group assessment of A7 as co-owned by Ilan Shor and Promsvyazbank (PSB), with links to the relevant corporate and regulatory context.
- Russian government commentary on digital financial assets and Bitcoin mining within foreign trade contexts, including corroborating reporting linked to official statements.
- Cointelegraph coverage of sanctions-related disputes and official responses from A7A5 representatives regarding allegations of sanctions evasion.
Crypto World
Bitcoin (BTC) Risks Deeper Drop, Ripple (XRP) Eyes New Targets, and More: Bits Recap Feb 20

Here are some of the projected scenarios involving BTC, XRP, and SHIB.
While Bitcoin (BTC) has slightly rebounded in the past several days, it might be gearing up for a renewed downtrend.
Ripple’s XRP may also experience another substantial pullback, while Shiba Inu (SHIB) can rally, but under one vital condition.
Crash to $10K Comes Next?
Bitcoin’s overall condition remains quite bearish, which gives crypto critics the opportunity to envision further declines in the near future. The popular economist Peter Schiff (who is an outspoken opponent of the digital asset industry and a proponent of gold) predicted a collapse to $20,000 should BTC break below $50,000.
“I know Bitcoin has done that before, but never with so much hype, leverage, institutional ownership, and market cap at stake. Sell Bitcoin now,” his advice reads.
The X user Chiefy, along with Bloomberg’s strategist Mike McGlone, also presented pessimistic forecasts. The former envisioned a short-term plunge to as low as $29,000, while the latter suggested BTC could plummet to $10,000.
For his part, Ali Martinez recently spotted the formation of an “Adam & Eve” pattern on the asset’s price chart, where a break above $71,500 could trigger a jump to $79,000. Michael van de Poppe also chipped in, foreseeing “a big move on the horizon.”
Unable to predict the exact direction, the analyst stated he would accumulate on a downturn and realize some profits should BTC reach $80,000-$85,000.
What Now for XRP?
Ripple’s cross-border token surged to $1.66 late last week, but the rally quickly faded, with the price retreating to the current $1.41 (per CoinGecko’s data). Some analysts warned the move could signal a deeper pullback ahead.
You may also like:
Ali Martinez described the 2-week candle as a graveston doji, reminding that the last time this formation appeared on the chart, XRP’s valuation fell by 46%. For their part, Crypto Tony identified a potential retest of $1.52 as the “perfect” scenario before a new downtrend.
Despite the grim predictions, XRP continues to draw strong interest. Earlier this week, Rayhaneh Sharif-Askary (Head of Product & Research at Grayscale) revealed that advisors at the digital asset manager are “constantly asked” by clients about the token. She also noted that, in some cases, it ranks as the second most discussed asset after BTC.
SHIB Pump Incoming?
While Shiba Inu remains the second-biggest meme coin (trailing only behind Dogecoin), its price has been on a steep decline in the past months. As of this writing, it is worth around $0.000006264, representing a 60% collapse on a yearly scale.
According to Martinez, though, the asset could restore some of its former glory if it manages to flip the $0.0000067 resistance level into support. Should that happen, SHIB might explode by 50% to approximately $0.0000099, he predicted.
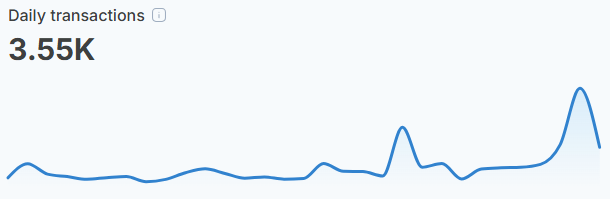
It is important to note that fading interest from traders and investors, along with Shibarium’s stalled progress, doesn’t support the bullish scenario. The security of Shiba Inu’s layer-2 scaling solution was breached in September last year, and it has been coping with issues ever since. Prior to the incident, daily transactions processed on the protocol were in the millions, while lately the figure has dropped to mere hundreds and thousands.
SECRET PARTNERSHIP BONUS for CryptoPotato readers: Use this link to register and unlock $1,500 in exclusive BingX Exchange rewards (limited time offer).


Draft rules from the White House suggest daily fines could stack fast, signaling regulators want zero loopholes in stablecoin reward designs.
The White House is advancing strict regulatory measures that would prohibit offering yield or interest on payment stablecoins.
Proposed enforcement provisions include civil penalties of $500,000 per violation, aimed at preventing firms from structuring products that resemble yield farming on stablecoin balances.
Stablecoin Yield Bank Proposal
Details from the administration’s third ongoing meeting with crypto industry leaders and banking representatives were shared by journalist Eleanor Terrett via social media.
She reported that the latest session was smaller than the previous week’s and included representatives from Coinbase, Ripple, and a16z, along with trade groups such as the Blockchain Association and the Crypto Council. However, no individual bank representatives attended, with the sector instead represented through trade associations.
During the meeting, White House Crypto Council Executive Director Patrick Witt presented draft text that became the main focus. The language acknowledged concerns raised by financial institutions in last week’s “Yield and Interest Prohibitions Principles” document while clarifying that any restrictions on rewards would be narrow in scope.
Under the current direction, earning yield on idle stablecoin balances appears to be off the table, with discussions now centered on whether firms can offer rewards tied to certain user activities.
One crypto-side attendee told Terrett that bank concerns appear to be driven more by competitive pressure than by deposit risk. A bank-side source shared that trade groups are still pushing to include a deposit outflow study in the proposal to examine how the growth of payment stablecoins could affect these transactions.
You may also like:
The same individual added that the proposed anti-evasion language would give enforcement authority to the Securities and Exchange Commission (SEC) and the Commodity Futures Trading Commission (CFTC). This provision includes civil penalties of $500,000 per violation per day for firms that attempt to bypass restrictions on paying yield on idle balances.
Discussions Continue as Industry Looks for Compromise
The crypto journalist said that public statements from attendees are once again being described as “productive” and “constructive.” People familiar with the matter noted that there was a noticeable difference in this round of talks, with the White House taking the lead in guiding the discussion instead of allowing crypto firms and banking trade groups to steer the conversation.
The latest meeting follows two previous ones where officials and industry participants debated whether the digital assets should be allowed to offer yield, the possible effects on bank deposits, and broader concerns about competitiveness and innovation if such limits are introduced.
Bank trade groups are now expected to brief their members on the latest developments and assess whether there is room for compromise on allowing crypto firms to offer stablecoin rewards. One individual also said that an end-of-month timeline for progress appears realistic, with negotiations set to continue in the coming days.
SECRET PARTNERSHIP BONUS for CryptoPotato readers: Use this link to register and unlock $1,500 in exclusive BingX Exchange rewards (limited time offer).
Crypto World
Bitcoin bounces, but $72,000 remains key price level to breaking downtrend: Crypto Markets Today


The crypto market pulled back from potential peril on Thursday, with bitcoin rising 3.9% from a local low of $65,600.
Prices advanced overnight, with bitcoin adding 2% since midnight UTC, solana (SOL) gaining 2.7% and ether (ETH) rising 1.2%.
The broader downtrend, however, remains intact with bitcoin printing a series of lower lows and lower highs to give back all of the gains it made in the 12 months ended October 2025.
In the short term, bitcoin needs to break above $72,000 to confirm a bullish shift from the range-bound price action that has seen it float between support and resistance.
Spot bitcoin ETFs in the U.S. have posted their largest drawdown of this cycle, with 100,300 BTC in withdrawals since October. That equates to around $6.8 billion of extra selling pressure on an already fragile market.
Derivatives positioning:
- Market dynamics are stabilizing. Open interest rose to $15.8 billion, signaling a shift from leverage cleanup toward a firmer floor, and retail sentiment is rebounding, with funding rates flipping flat to positive across all venues and hitting 10% on Bybit and Hyperliquid.
- Institutional conviction remains anchored, with the three-month annualized basis persisting at 3%.
- The BTC options market shows a slight shift in sentiment, with 24-hour volume reaching a 51/49 split in favor of calls.
- While the one-week 25-delta skew has jumped to 17%, the implied volatility (IV) term structure remains in short-term backwardation.
- This persistent front-end spike confirms that traders are still paying a “panic premium” for immediate protection, even as longer-dated tenors stabilize near 49%.
- Coinglass data shows $179 million in 24-hour liquidations, with a 56-44 split between longs and shorts. BTC ($59 million), ETH ($46 million) and others ($16 million) were the leaders in terms of notional liquidations.
- The Binance liquidation heatmap indicates $68,400 as a core liquidation level to monitor in case of a price rise.
Token talk
- Altcoins were perky overnight, lending token MORPHO rose by more than 12% since midnight UTC and AI payment token KITE added 11%, extending its 30-day rally of 153%.
- The rotation was also seen among DeFi tokens such as jupiter (JUP), which jumped by more than 3.6% after hitting its lowest point in seven days on Thursday.
- The CoinDesk Smart Contract Platform Select Index (SCPXC) was the best-performing benchmark over the past 24 hours, posting a gain of 2.25%, closely followed by CoinDesk’s Memecoin Index (CDMEME), up by 2.2% over the same period.
- The bitcoin-dominant CoinDesk 20 (CD20) gained by 1% as crypto majors posted more restrained gains.
- Altcoins typically perform well during periods of consolidation as traders have the freedom to rotate capital into more speculative bets without risking missing a move on the likes of bitcoin, ether and XRP.
Nvidia (NVDA) is one of the most closely watched AI and semiconductor stocks in the market. Investors looking for a NVDA stock forecast for 2026–2030 are assessing whether the company’s leadership in AI chips, data-center GPUs, and accelerated computing can sustain long-term share price growth despite ongoing volatility.
In this article, we review analysts’ Nvidia target prices for 2026–2030, outline the key drivers likely to influence the NVDA stock prediction, and examine the stock’s historical performance.
Forecast Summary
2026
Algorithmic forecasting sources project NVDA trading between $185 and $289 by year-end, while Wall Street analysts are more bullish; Goldman Sachs and Morgan Stanley both target $250, Bank of America and Wedbush $275, and Cantor Fitzgerald holds a Street-high $300. The spread reflects uncertainty around hyperscaler spending sustainability and the Blackwell-to-Vera Rubin platform transition.
2027
Predictions range from around $253 to $491. Those projecting higher assume NVIDIA retains dominant market share as AI investment deepens across enterprise, sovereign, and infrastructure applications.
2028
Estimates span $315 to $750. The widening gap reflects diverging views on competition from AMD and custom hyperscaler chips, and whether the shift from AI training to large-scale inference drives sustained or diminishing demand for NVIDIA hardware.
2029
Forecasts range from $327 to over $1,000. Conservative models anticipate slowing growth as the initial AI buildout matures, while bullish sources factor in expansion into robotics, autonomous driving, and agentic AI workloads.
2030
Long-range projections suggest $392 to almost $1,100. At this horizon, forecasts hinge heavily on whether NVIDIA maintains its estimated 90%+ AI accelerator market share against intensifying competition.
What Factors Could Impact Nvidia’s Stock Price in 2026 to 2030 and Beyond?
NVIDIA is expected to maintain its technological leadership and expand its market presence from 2026 to 2030. Analysts anticipate the company will continue to dominate the AI and data centre sectors, driving robust revenue growth. NVIDIA’s innovative products, particularly its AI chips, are poised to see increasing adoption across various industries, contributing significantly to its revenue streams.
AI and Data Center Dominance
NVIDIA’s leadership in AI and data centre technologies is a key driver of its stock performance. The company’s AI chips are integral to the growth of AI applications across various industries, and its data centre segment continues to see exponential growth. In fiscal 2025, NVIDIA’s data centre revenue reached $115.19 billion – a 142% increase year-on-year – and by Q3 of 2025, the segment had hit a record $51.2 billion in a single quarter, up 66% from the prior year, as enterprises and hyperscalers continue to ramp AI-driven infrastructure.
Revenue and Earnings Growth
NVIDIA’s financial outlook is strong, with projected substantial increases in revenue and earnings. Looking ahead, analysts expect NVIDIA’s revenue to continue climbing sharply. Consensus estimates project 2026’s revenue at around $323 billion, propelled by a $500 billion order backlog for its leading Blackwell and Rubin chips. This growth is expected to be driven by the continued demand for AI solutions and the expansion of NVIDIA’s data centre capabilities.
Emerging Markets
NVIDIA’s expansion into emerging markets such as autonomous driving, Internet of Things (IoT), and blockchain technology is expected to drive significant growth from 2026 to 2030.
Autonomous Driving
NVIDIA’s DRIVE platform is becoming a cornerstone for autonomous vehicle development. Major automotive manufacturers are incorporating NVIDIA’s AI technology to enhance vehicle safety and efficiency. The autonomous vehicle market is projected to grow substantially, and NVIDIA’s technology will be integral to this growth, providing substantial revenue opportunities.
Internet of Things (IoT)
NVIDIA is also making strides in the IoT sector, where its edge computing solutions enable real-time data processing for various applications. The proliferation of IoT devices across industries such as healthcare, manufacturing, and smart cities will drive demand for NVIDIA’s powerful GPUs and AI solutions, contributing to long-term revenue growth.
Blockchain and Cryptocurrencies*
While blockchain and cryptocurrency* markets can be volatile, NVIDIA’s GPUs are crucial for mining operations. The company’s products are highly sought after for their efficiency and performance in processing complex algorithms. As the blockchain industry evolves, NVIDIA’s technology will continue to play a vital role, offering another revenue stream.
Strategic Acquisitions and Partnerships
Analysts also highlight NVIDIA’s potential for strategic acquisitions and partnerships as a growth catalyst. The company’s strong free cash flow provides the financial flexibility to pursue acquisitions that can strengthen its technological capabilities and market reach. This strategic approach is anticipated to support long-term growth and sustain its competitive edge.
Market Challenges and Competitive Landscape
While NVIDIA’s outlook is positive, the company faces challenges from competitors such as AMD, Intel, and emerging startups. Maintaining its technological edge and market leadership will require continuous innovation and effective execution of strategic initiatives. NVIDIA’s proprietary technologies, like the Cuda programming language, provide a competitive advantage, but competitors are also advancing rapidly, which will require NVIDIA to stay ahead in the innovation curve.
Analytical NVIDIA Stock Price Forecasts for 2026 to 2030 and Beyond
In a February 2026 research note, Goldman Sachs maintained a Buy rating on NVIDIA with a $250 price target, projecting 2027 revenue of $382.9 billion and earnings per share of $8.75. The bank noted that hyperscaler capex has climbed above $527 billion for 2026 and that it remains “well above the Street” on NVIDIA’s data centre revenue estimates, though analyst Jim Schneider cautioned that “stock price outperformance will hinge on revenue visibility into CY27.”
Cantor Fitzgerald analyst C.J. Muse holds the Street-high $300 price target, but considers an opportunity of a growth to $400 “given growth prospects through the end of the decade.” He said demand for artificial intelligence is surging and noted that Nvidia’s chip supply for 2026 is likely already sold out. According to Muse, the company is now accumulating orders for 2027 and 2028. Some time ago, after meetings with NVIDIA’s leadership, Muse declared “this is not a bubble,” citing hyperscaler demand that provides “significant line-of-sight into hundreds of billions of demand for the next handful of years,” with a path to $50 EPS by 2030.
Morgan Stanley’s Joseph Moore maintains a $250 target. Furthermore, the bank offers an even more optimistic scenario of growth to $330 if the plan is successfully executed, and a downside scenario of $150 if growth slows faster than expected. The Vera Rubin platform set to “raise the bar for performance” in the second half of the year.
Bank of America reiterated a Buy with a $275 target. Analysts increased their revenue forecasts for Nvidia for fiscal 2027–2029 by 7%, 2%, and 2%, respectively, bringing projected sales to $342.33 billion, $422.75 billion, and $496.3 billion. They also lifted EPS estimates by 8%, 3%, and 3% to $8, $9.98, and $11.94 over the same period.
Likewise, Wedbush Securities analyst Dan Ives also set a $275 price target, calling 2026 “an inflection point for the AI buildout” and arguing that Wall Street is “significantly underestimating” NVIDIA’s demand drivers, with the tech sector projected to rise more than 20% as AI investments deepen across software, semiconductors, and infrastructure.
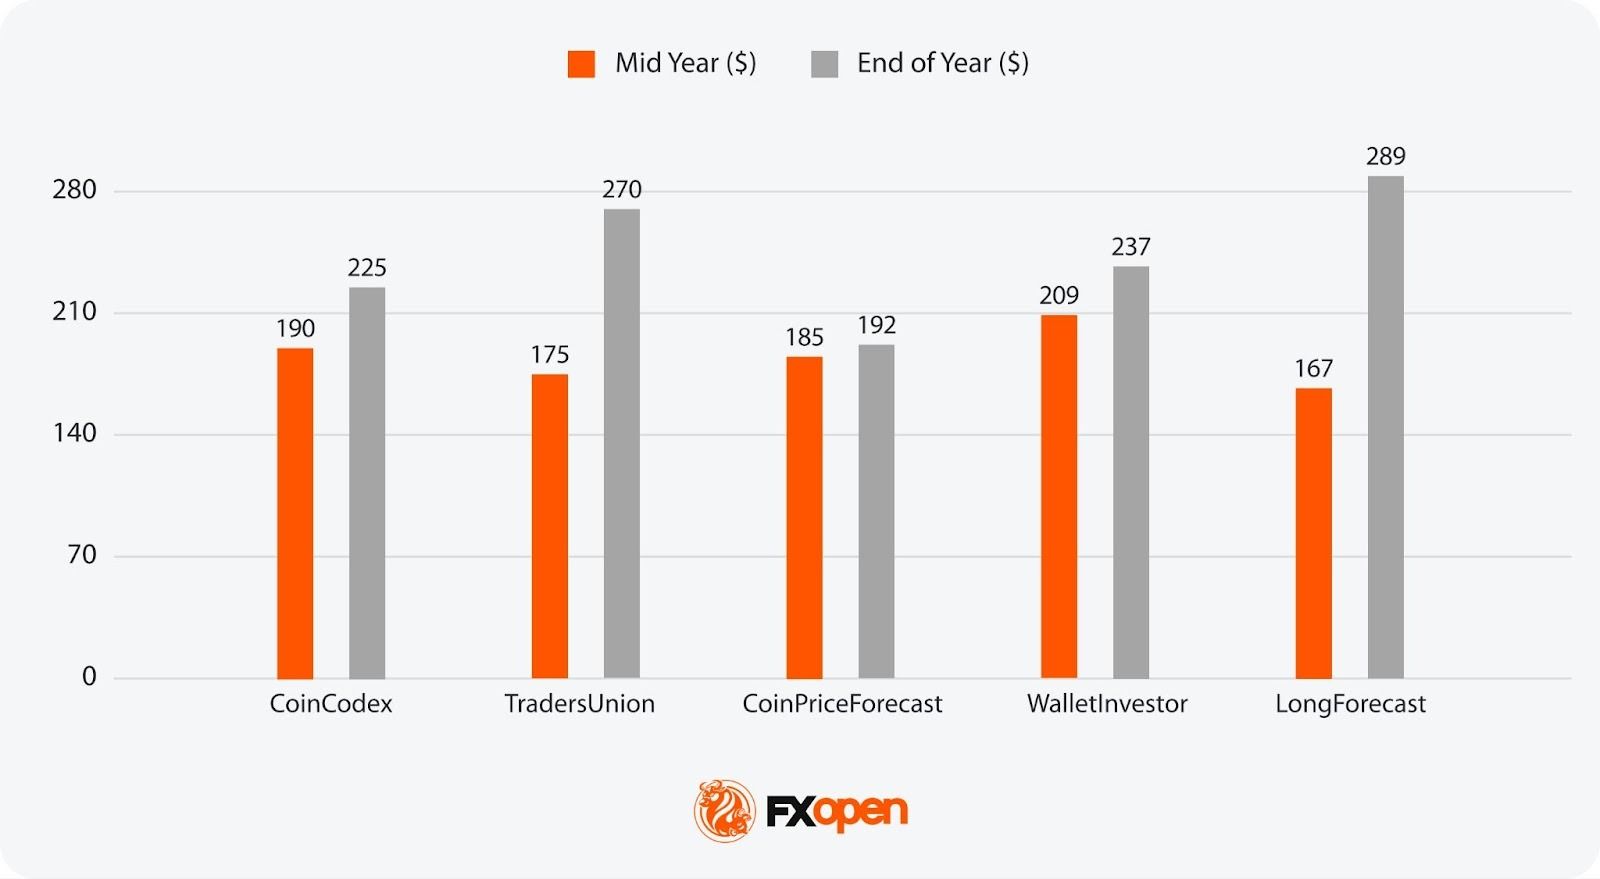
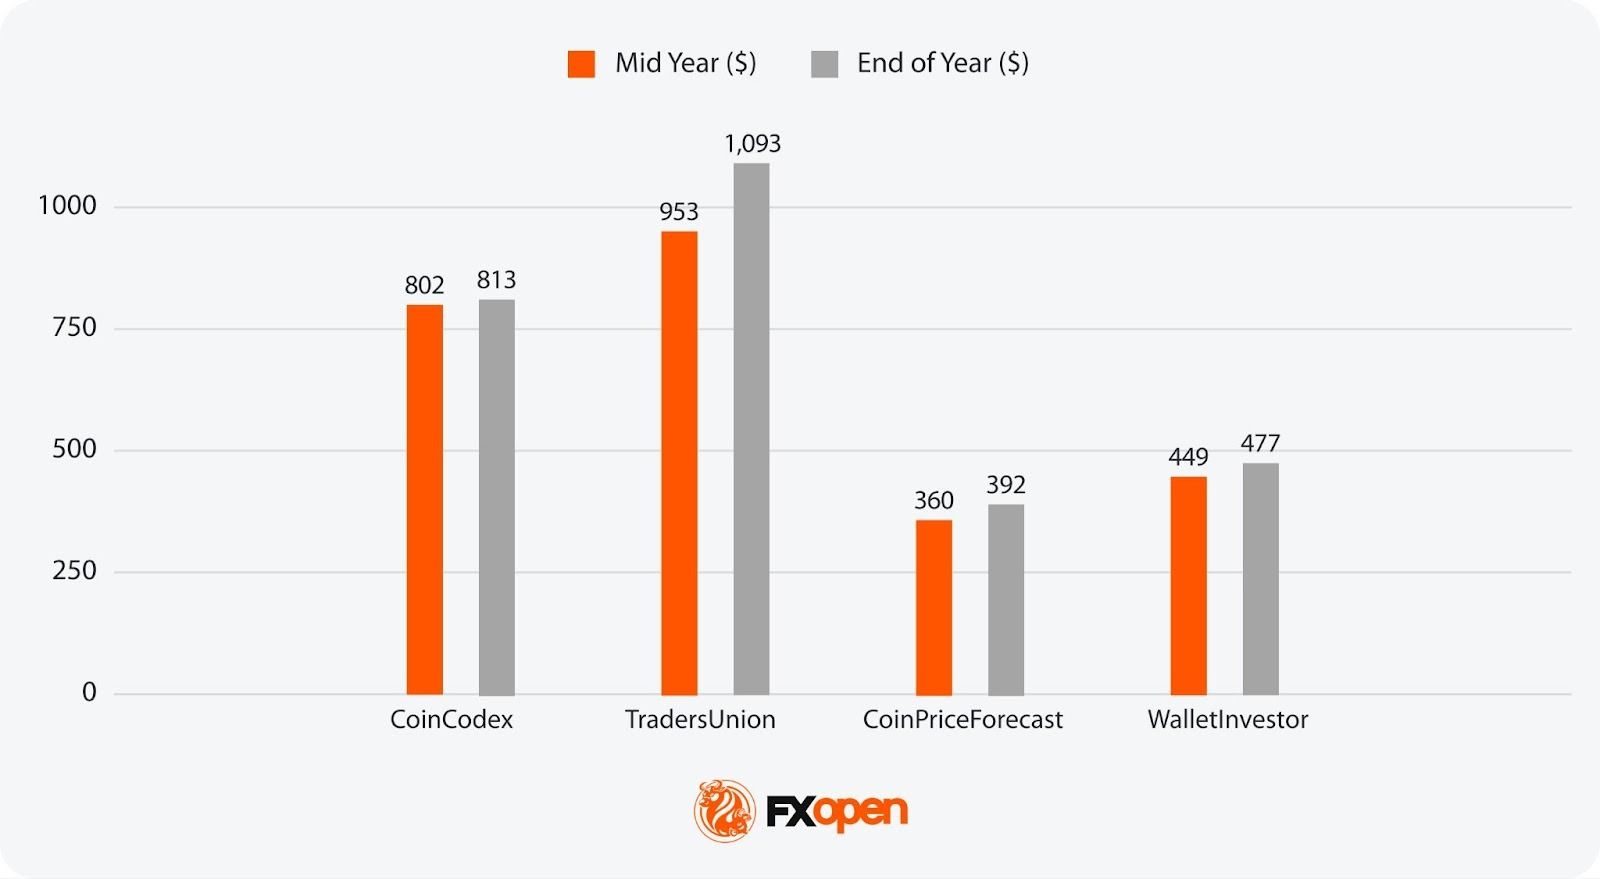
NVIDIA Stock Prediction for 2026

Mid-Year 2026:
- Most Bullish Projection: 209 (WalletInvestor)
- Most Bearish Projection: 167 (LongForecast)
End-of-Year 2026
- Most Bullish Projection: 289 (LongForecast)
- Most Bearish Projection: 192 (CoinPriceForecast)
NVIDIA Stock Prediction for 2027
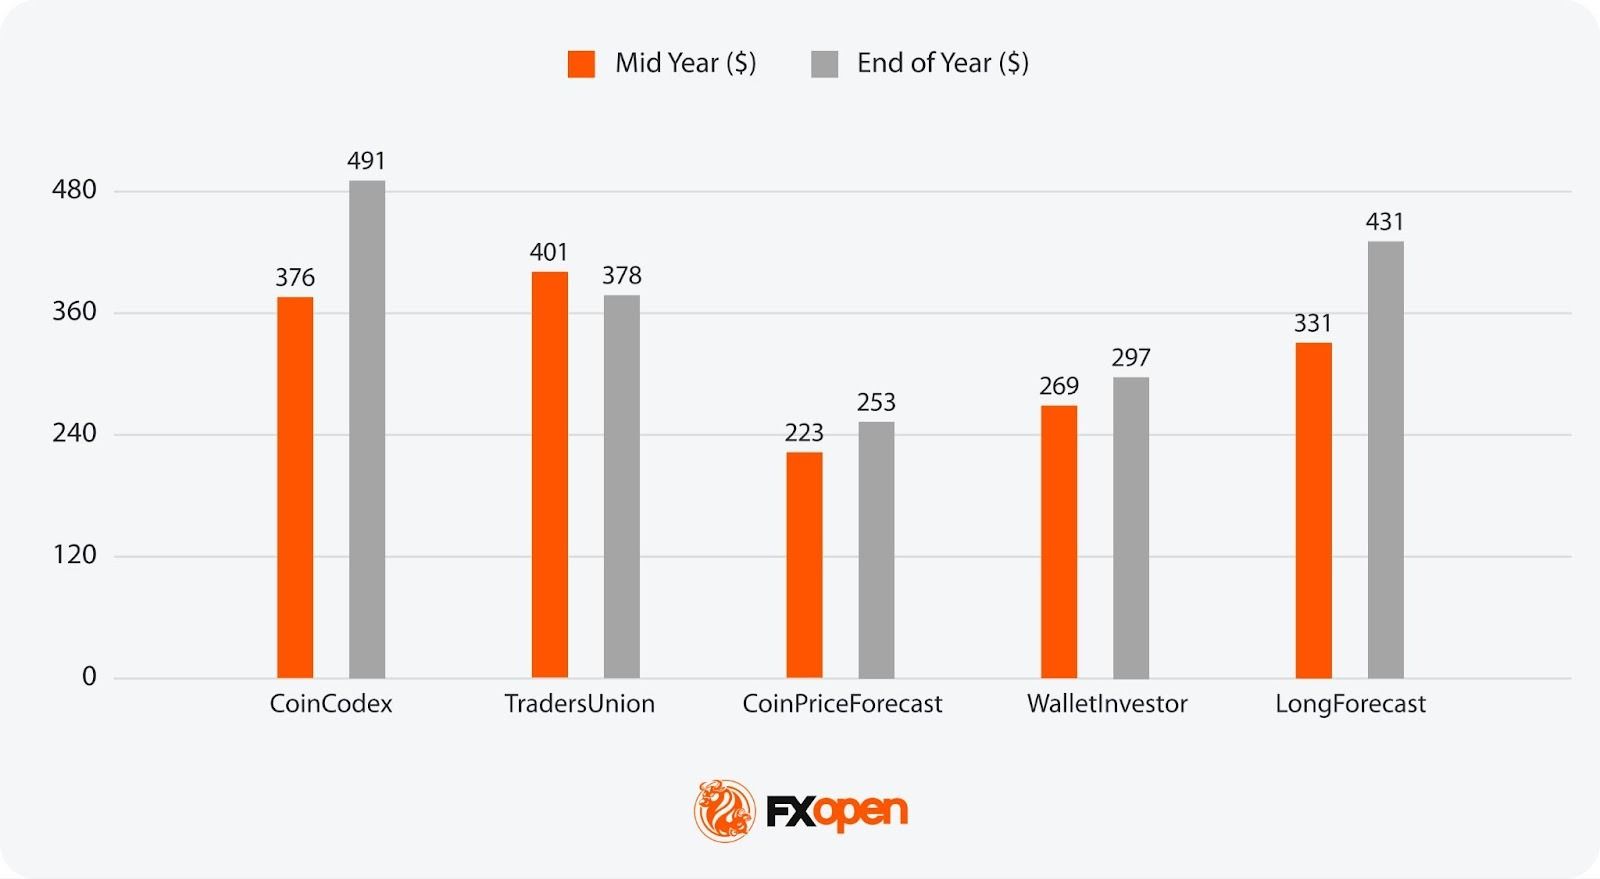
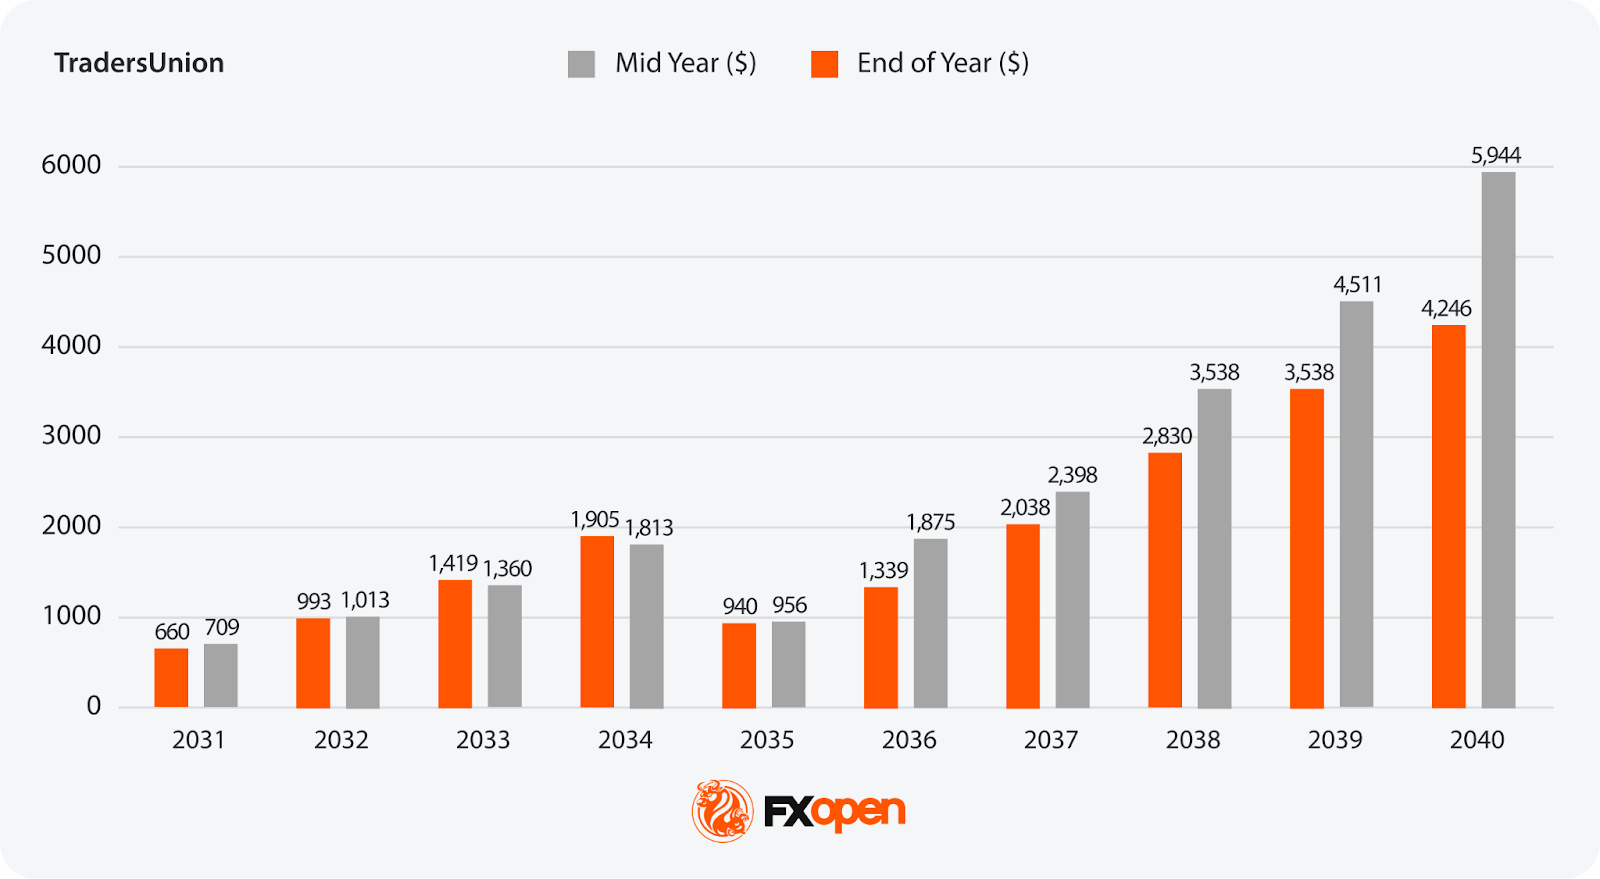
Mid-Year 2027:
- Most Bullish Projection: 401 (TradersUnion)
- Most Bearish Projection: 223 (CoinPriceForecast)
End-of-Year 2027:
- Most Bullish Projection: 491 (CoinCodex)
- Most Bearish Projection: 253 (CoinPriceForecast)
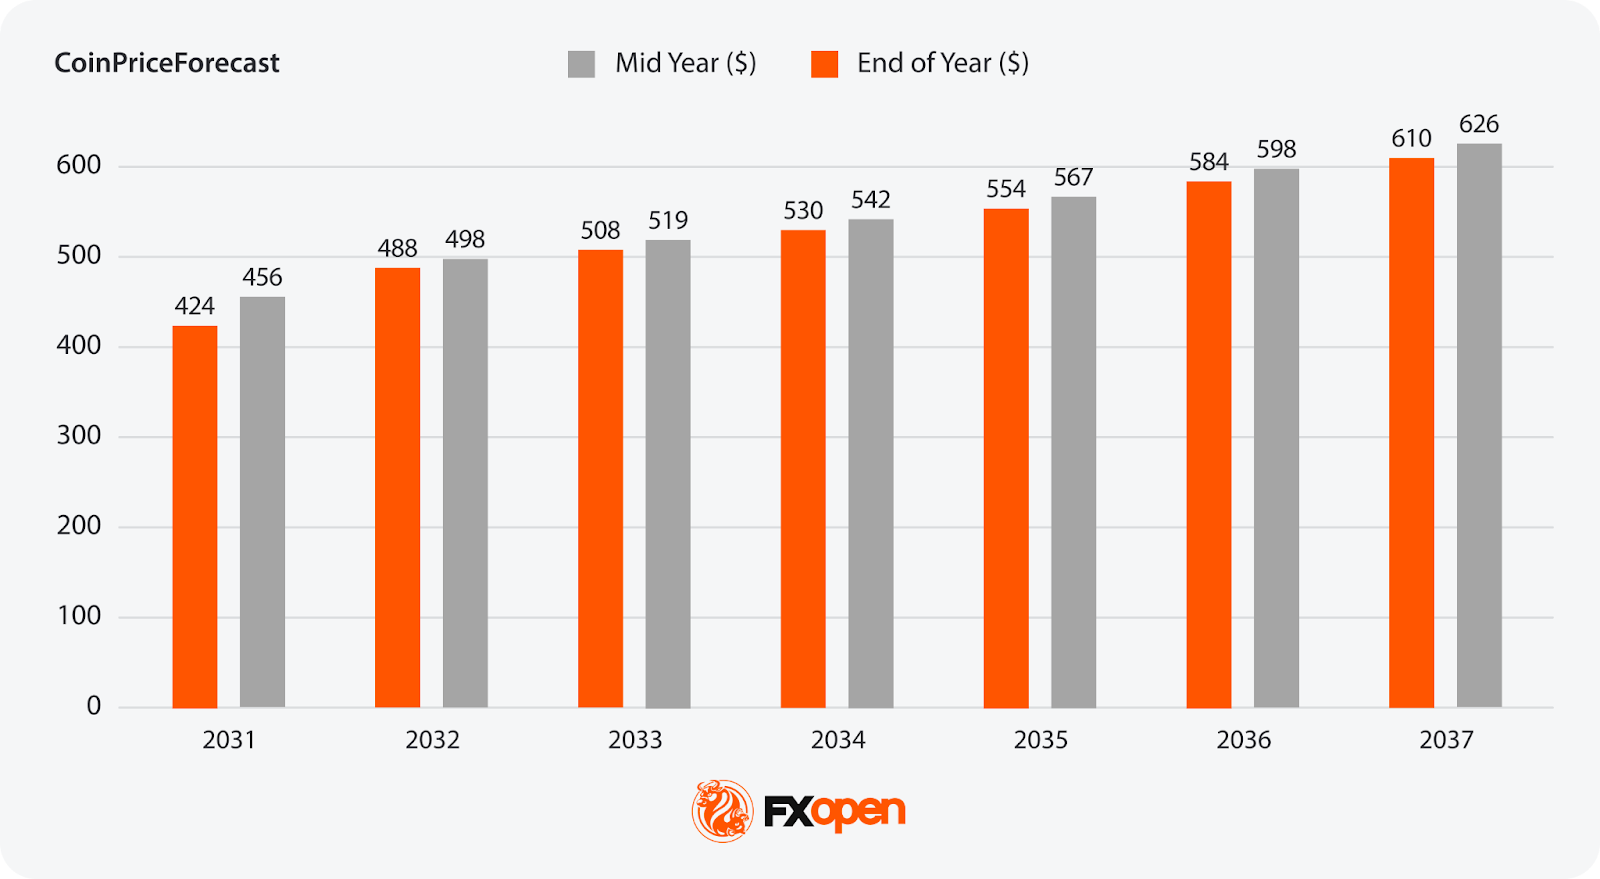
NVIDIA Stock Prediction for 2028
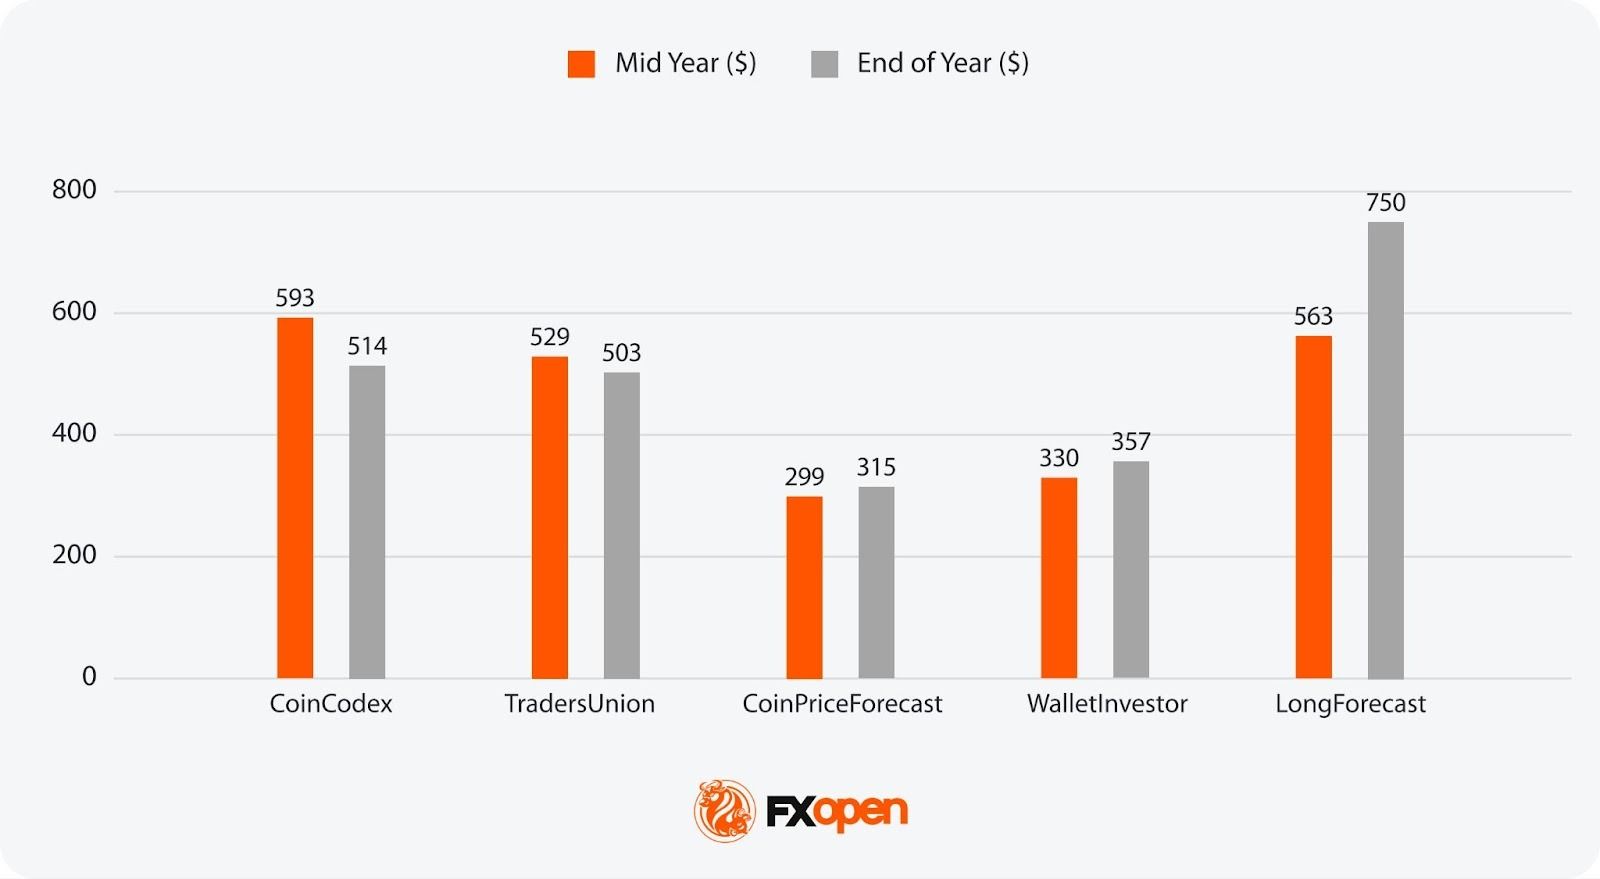
Mid-Year 2028:
- Most Bullish Projection: 593 (CoinCodex)
- Most Bearish Projection: 299 (CoinPriceForecast)
End-of-Year 2028:
- Most Bullish Projection: 750 (LongForecast)
- Most Bearish Projection: 315 (CoinPriceForecast)
NVIDIA Stock Prediction for 2029
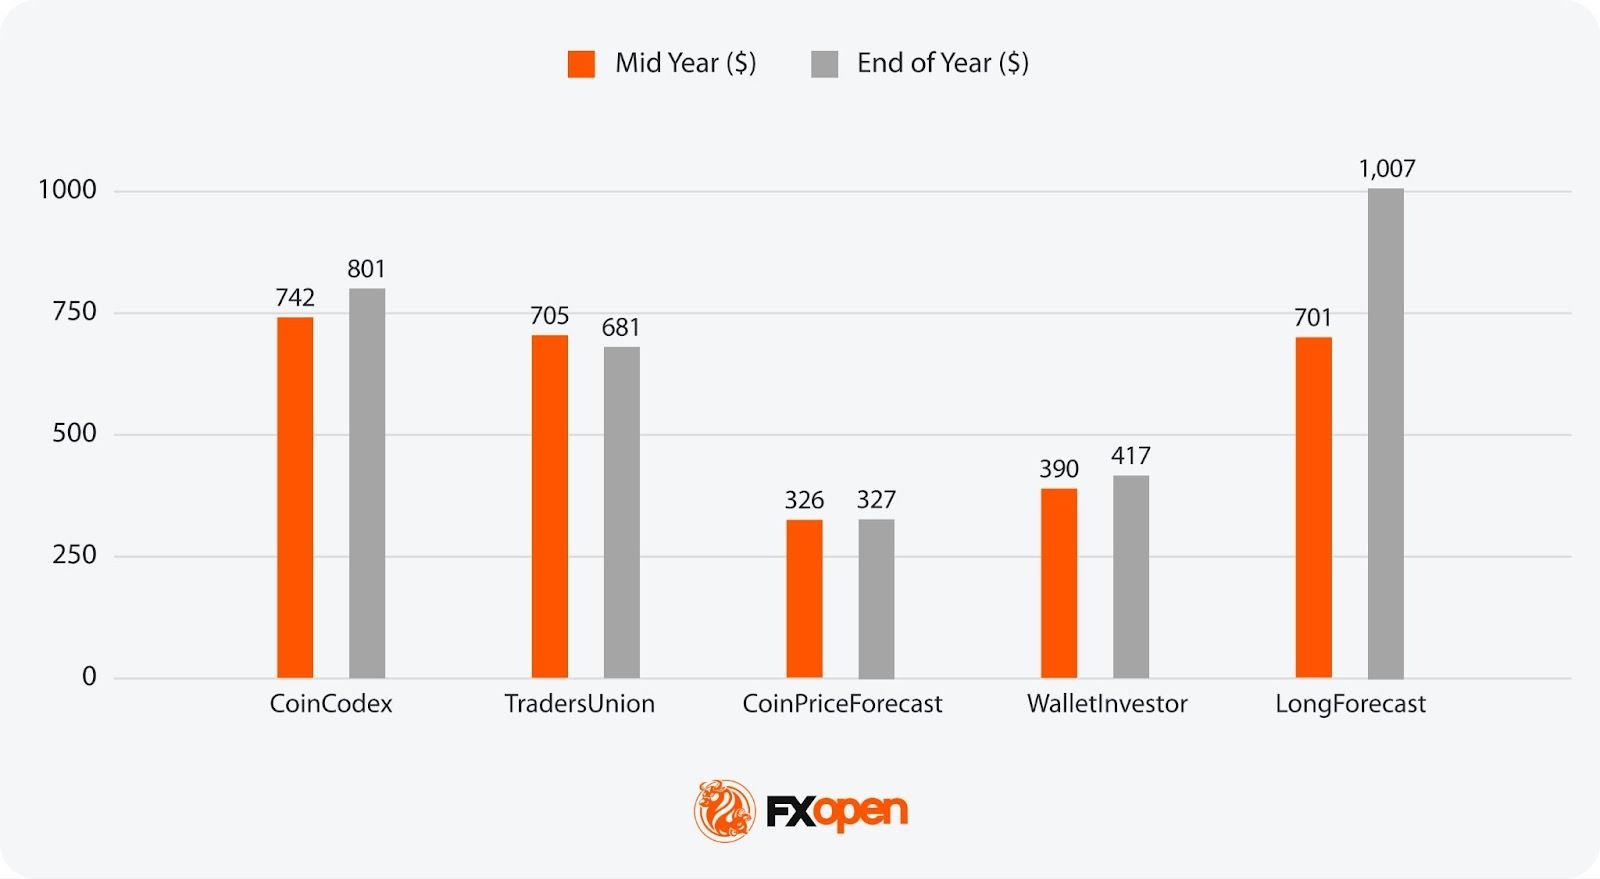
Mid-Year 2029:
- Most Bullish Projection: 742 (CoinCodex)
- Most Bearish Projection: 326 (CoinPriceForecast)
End-of-Year 2029:
- Most Bullish Projection: 1,007 (LongForecast)
- Most Bearish Projection: 327 (CoinPriceForecast)
NVIDIA Stock Price Prediction for 2030 Onwards
While NVIDIA stock projections beyond 2030 are uncertain, a few sources offer forecasts:
Consensus
While the NVDA stock price is generally expected to rise, the scale of that growth varies. From 2030 to 2040, predictions range from $400 in 2030 to $6,000 in 2040. The gap is wide.
NVIDIA’s Price History
NVIDIA’s stock price has undergone an extraordinary transformation since its early days, moving from a graphics pioneer to a tech powerhouse. Understanding its price history offers valuable insight into the key milestones that have shaped NVIDIA’s rise in the market, from its early challenges to its recent dominance in AI and data centres. Let’s look at how NVIDIA’s stock has evolved over the years.
How It Started
NVIDIA Corporation was founded in 1993 by Jensen Huang, Chris Malachowsky, and Curtis Priem with the vision of revolutionising computing through graphics processing technology. The founders saw the potential in a new computing model focused on enabling rich multimedia experiences for consumers.
Initially, NVIDIA operated in a highly competitive environment dominated by established companies like Intel and 3dfx. In its early years, the company focused on creating high-performance graphics cards, targeting a niche market of gamers and tech enthusiasts. Their breakthrough came with the launch of the NV1 in 1995, a pioneering graphics card that introduced innovative 3D rendering capabilities.
By the late 1990s, the company had gained enough traction to go public in 1999. However, after adjusting for several stock splits, including the most recent one in June 2024, this price is equivalent to just $0.0438 (we’ll refer to the split-adjusted price from here). These early steps marked the beginning of its journey to becoming a tech giant.
Early 2000s to 2015: Building the Foundation
Throughout the 2000s, NVIDIA expanded its product line, targeting both gaming and professional markets. Significant milestones included the release of the GeForce 256 in 1999, often considered the world’s first GPU.
The company’s stock price rallied in the dot-com bubble, cresting $0.6 at the start of 2002. After sinking to a low of $0.06 later in the year, NVDA began a long uptrend, peaking at $0.992 in 2007, just before the 2008 financial crisis sent it plummeting back to $0.144. Continuing to expand its presence in the GPU arena over the years, NVIDIA’s stock rebounded, closing 2015 at $0.824.
2016-2017: The Boom Begins
The period from 2016 onwards marked a dramatic shift for NVIDIA. Driven by the increasing demand for GPUs in gaming, data centres, and the burgeoning field of artificial intelligence (AI), NVIDIA’s stock price began to soar.
By mid-2016, NVIDIA had introduced the Pascal architecture, which significantly improved performance and efficiency. This innovation, coupled with strong financial results, saw the stock price surge to a high of $2.99 by the end of 2016, while by the end of 2017, the stock had been trading near $5.
2018-2020: Volatility and Growth
In 2018, NVIDIA’s stock experienced volatility due to a slowdown in cryptocurrency* mining, which had previously driven GPU sales. The stock price peaked at around $7.32 in October 2018 but closed the year at $3.38. Despite this, NVIDIA’s long-term prospects remained strong, bolstered by continued advancements in AI and data centre applications. By early 2020, the stock price had rebounded to above $7.
2020-Present: Surging Ahead
While the COVID-19 pandemic caused a brief blip in NVDA’s price, the event actually further accelerated demand for NVIDIA’s products as more people turned to gaming and remote work. NVIDIA’s willingness to acquire Arm Holdings in September 2020 for $40 billion highlighted its strategic expansion.
The stock price broke the $12.50 mark in mid-2020, closing 2021 at $29.41. While rising interest rates and restrictive financial conditions drove NVDA lower in 2022, to a low of $10.81, the debut of ChatGPT in late 2022 and the resulting surge in AI adoption marked a watershed moment for NVIDIA.
NVIDIA quickly became one of the world’s most valuable companies in 2023 thanks to exploding demand for its products. In May 2023, it crossed the $1 trillion market cap threshold and peaked at $50.26 in August.
NVIDIA continued to dominate the GPU and AI computing space in 2024, making a new all-time high of $148 on 7th November 2024.
Much of this bullishness has been supported by the introduction of its Blackwell architecture, designed to provide unprecedented levels of performance to AI applications and cement its leadership in the space.
The next all-time high of $149.43 was set on 6th January 2025. However, by April 2025, the stock had fallen below $100. There are several reasons for this. The US stock market had been undergoing a correction since mid-February. Many analysts suggested the market would cool off in 2025, as it would be unprecedented for it to deliver such returns for a third consecutive year. Moreover, tariff and AI-related concerns weighed on market sentiment, particularly affecting large-cap stocks. The DeepSeek case triggered a decline in NVIDIA shares. Although the market experienced a slight recovery, this incident raised doubts about the future of major AI-related companies.
However, the company soon experienced a remarkable recovery in its share price, surging to a closing price of $173.00 on 17th July 2025, marking a new all-time high. This resurgence was driven by several pivotal developments, most notably the lifting of US export restrictions on its H20 AI chips to China. The reversal of this ban, coupled with increased global capital expenditure in AI infrastructure, significantly bolstered investor confidence and contributed to the substantial rise in NVDA’s share value.
On 9th July, NVIDIA’s market capitalisation reached an unprecedented $4 trillion, making it the first company to achieve this milestone. Despite ongoing concerns regarding customer concentration and potential competition from emerging players, NVIDIA’s strategic initiatives and market leadership reinforced its position in the technology sector, cementing its status as a key player in the AI revolution.
It took less than four months for the company to achieve another milestone — on 29th October 2025, NVIDIA reached $5.03 trillion in market value. Moreover, NVDA stocks continued to set new all-time highs. Despite analysts’ warnings about a potential AI bubble, the stock’s rally was supported by a massive order backlog, strategic partnerships with the US government, and expansion into the telecommunications sector.
Since then, however, NVDA has pulled back from its all-time high of $212.19, set on 29th October 2025. The stock traded sideways through late 2025 and into early 2026, closing the year at around $186 before dipping below $183 in mid-February. Broader market caution and growing scrutiny over whether hyperscaler AI spending can deliver sustainable returns have weighed on sentiment.
Now, let’s take a look at analytical NVIDIA share price forecasts.
Want to keep up to date with the latest NVDA price movements? You can head over to FXOpen’s TickTrader platform to explore live NVDA CFD charts.
The Bottom Line
NVIDIA’s future looks promising with continued growth in AI, data centres, and emerging technologies. Price outlooks are bold, and NVIDIA will certainly remain an interesting player to watch in the coming years. However, traders and investors should be very careful and implement risk management tools.
If you are interested in trading NVIDIA and other stocks via CFDs, you can consider opening an account to trade with low commissions and tight spreads at FXOpen (additional fees may apply).
FAQ
What Will NVIDIA Stock Be Worth in 2026?
Most algorithmic forecasting sources project NVDA trading only slightly above its current price of ~$187 by mid-2026, before climbing to between $190 and $290 by year-end, suggesting meaningful second-half momentum driven by continued AI infrastructure spending.
Where Will NVIDIA Stock Be in 5 Years Prediction?
Analytical five-year NVDA forecasts vary widely. Conservative algorithm-based models place the stock between $350 and $500 by 2030, while more bullish projections see it approaching $800–$1000, largely depending on how deeply AI adoption penetrates autonomous driving, IoT, and enterprise computing.
Can Nvidia Hit $300?
Some Wall Street analysts already hold 2026 price targets near or at $300, and most algorithmic forecasting models project the stock reaching this level during 2027. However, reaching $300 would still require sustained revenue growth and continued investor confidence in AI demand.
Is Nvidia Stock Expected to Go Up?
The broad consensus among analysts and forecasting services is bullish, with the overwhelming majority of Wall Street ratings currently at Buy or Strong Buy. That said, competition from AMD and custom AI chips, potential demand cyclicality, and elevated valuations all represent risks to the upside case.
Can Nvidia Hit $500 a Share?
Most long-range forecasting models expect NVDA to reach $500 sometime between 2028 and 2030, supported by projected earnings growth across AI, data centres, and next-generation computing platforms. The timeline depends heavily on whether NVIDIA can maintain its dominant market share against intensifying competition.
*Important: At FXOpen UK, Cryptocurrency trading via CFDs is only available to our Professional clients. They are not available for trading by Retail clients. To find out more information about how this may affect you, please get in touch with our team.
This article represents the opinion of the Companies operating under the FXOpen brand only. It is not to be construed as an offer, solicitation, or recommendation with respect to products and services provided by the Companies operating under the FXOpen brand, nor is it to be considered financial advice.
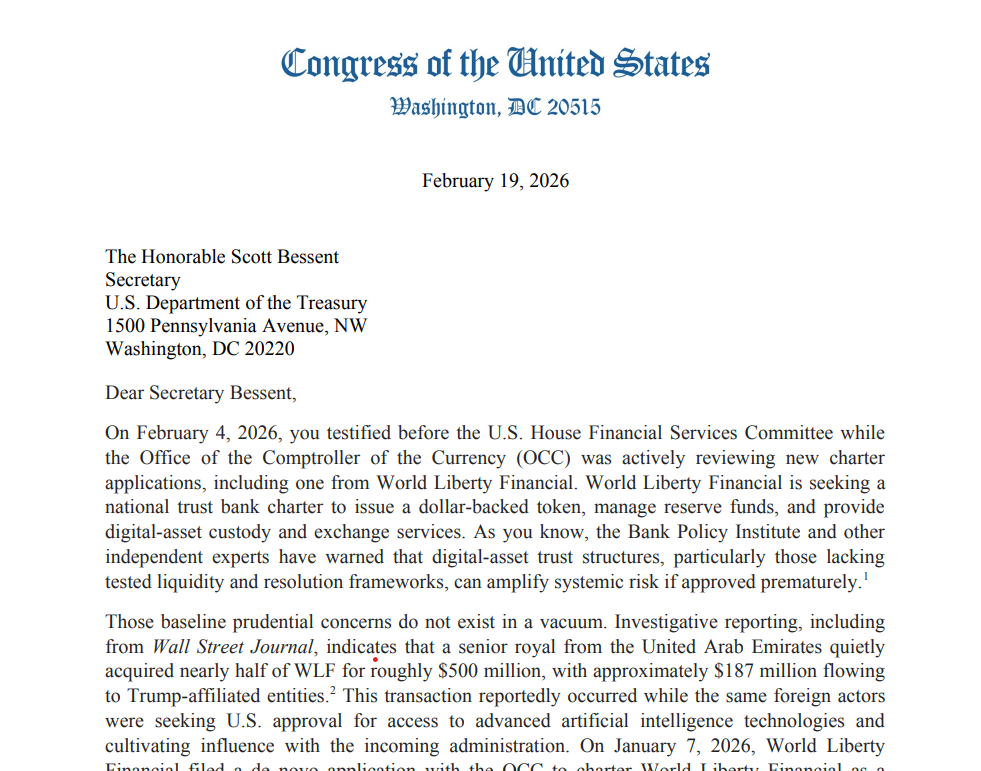
Democrats in the US House of Representatives are pressing Treasury Secretary Scott Bessent over how regulators are handling World Liberty Financial’s bid for a national trust bank charter to issue a dollar-backed token.
In a letter on Thursday, 41 House Financial Services Committee Democrats led by Representative Gregory Meeks cited systemic risk, foreign ownership and potential political pressure on the bank chartering process.
They asked Bessent to explain what safeguards exist to prevent foreign government officials or politically connected investors from using the charter process to gain leverage over the US financial system.
The lawmakers pointed to reporting that a senior royal from the United Arab Emirates quietly acquired almost half of World Liberty Financial for about $500 million, including a reported $187 million flowing to Trump-affiliated entities, while the company pursued a national trust bank charter with the Office of the Comptroller of the Currency (OCC).

They argued that the combination of digital asset trust structures, untested liquidity and resolution frameworks and foreign political interests raised questions that regulators “cannot afford to sidestep.”
Related: White House floats limited stablecoin rewards in third crypto, bank meeting
Democrats also questioned whether Executive Order 14215, which they say pulled traditionally independent financial regulators into closer White House oversight, could compromise the OCC’s autonomy in deciding on World Liberty’s application.
The letter asks Bessent to detail the role of the White House, the Office of Management and Budget, and the Treasury Department in OCC charter decisions, and to respond in writing by Thursday.
World Liberty Financial’s high profile
The letter arrives as World Liberty Financial and other Trump-aligned crypto initiatives raise their profile in Washington and on Wall Street, including through a well-attended crypto event at Trump’s Mar-a-Lago club on Wednesday that drew crypto and traditional finance executives, including Coinbase CEO Brian Armstrong, Binance co-founder Changpeng Zhao and Goldman Sachs CEO David Solomon.
In the run-up to the event, the WLFI token associated with the Trump family-aligned platform recorded a 23% gain as organizers promoted the event as a venue to spotlight World Liberty’s roadmap and its role in the broader crypto market.
No bailout of “cryptocurrency billionaires”
Separately, Senate Banking Committee Democratic Senator Elizabeth Warren urged Bessent and Federal Reserve Chair Jerome Powell on Wednesday not to deploy taxpayer-backed support to stabilize crypto markets. She warned that any bailout of “cryptocurrency billionaires” would create a moral hazard and shift losses from large investors onto taxpayers.
Warren’s letter framed potential rescue measures for major crypto firms and investors as a test of whether policymakers would extend bank-style backstops to the digital asset sector, as regulators weigh new charters and oversight for crypto-linked institutions.
Big Questions: Is China hoarding gold so yuan becomes global reserve instead of USD?

Types of Financial Markets – Money Market, Capital Market, Currency Markets
First picture of dad who died in Tesco car park crash in Edinburgh

Equinox’s $40,000-a-year Optimize membership has a waiting list

Smart energy pays enters the US market, targeting scalable financial infrastructure

Why Israel is blocking foreign journalists from entering
Software stocks enter bear market on AI disruption fear with ServiceNow plunging 10%
Types of Financial Markets – Money Market, Capital Market, Currency Markets

EXPECT XRP PULLBACKS & SHAKEOUTS ON THE WAY UP – WARNING GET YOUR XRP OFF EXCHANGES – XRP NEWS

Manchu Lakshmi Quits Film Production After Financial Losses and Debts#shortsfeed
-

 Video4 days ago
Bitcoin: We’re Entering The Most Dangerous Phase
-

 Tech5 days ago
Luxman Enters Its Second Century with the D-100 SACD Player and L-100 Integrated Amplifier
-

 Crypto World3 days ago
Can XRP Price Successfully Register a 33% Breakout Past $2?
-

 Sports3 days ago
GB's semi-final hopes hang by thread after loss to Switzerland
-

 Video12 hours ago
XRP News: XRP Just Entered a New Phase (Almost Nobody Noticed)
-
 Tech3 days ago
The Music Industry Enters Its Less-Is-More Era
-

 Business3 days ago
Infosys Limited (INFY) Discusses Tech Transitions and the Unique Aspects of the AI Era Transcript
-

 Video3 days ago
Financial Statement Analysis | Complete Chapter Revision in 10 Minutes | Class 12 Board exam 2026
-

 Entertainment2 days ago
Kunal Nayyar’s Secret Acts Of Kindness Sparks Online Discussion
-

 Tech2 days ago
Retro Rover: LT6502 Laptop Packs 8-Bit Power On The Go
-
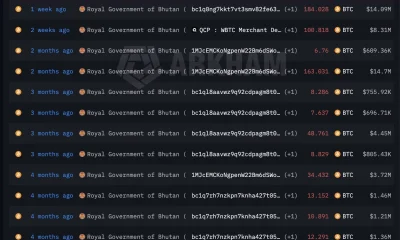
 Crypto World6 days ago
Bhutan’s Bitcoin sales enter third straight week with $6.7M BTC offload
-
 Sports1 day ago
Clearing the boundary, crossing into history: J&K end 67-year wait, enter maiden Ranji Trophy final | Cricket News
-

 Entertainment2 days ago
Dolores Catania Blasts Rob Rausch For Turning On ‘Housewives’ On ‘Traitors’
-

 Business2 days ago
Tesla avoids California suspension after ending ‘autopilot’ marketing
-
 NewsBeat5 days ago
The strange Cambridgeshire cemetery that forbade church rectors from entering
-

 Crypto World2 days ago
WLFI Crypto Surges Toward $0.12 as Whale Buys $2.75M Before Trump-Linked Forum
-
 NewsBeat5 days ago
Man dies after entering floodwater during police pursuit
-

 Crypto World17 hours ago
83% of Altcoins Enter Bear Trend as Liquidity Crunch Tightens Grip on Crypto Market
-

 NewsBeat6 days ago
UK construction company enters administration, records show
-
 Crypto World7 days ago
BlackRock Enters DeFi Via UniSwap, Bitcoin Stages Modest Recovery