

Crypto World
BitMine ramps Ethereum to 3.6% supply while price tests support


Ethereum slid ~5% toward $1.9k as whale selling and ETF outflows hit sentiment, despite bullish RSI divergence hinting at a potential reversal.
Summary
- ETH trades around $1.9k with key support at $1.8k–$1.85k; a daily close below opens $1.7k–$1.6k downside.
- Spot ETH ETFs logged multi‑week net outflows in recent sessions, with single‑day withdrawals near $40m–$50m weighing on demand.
- BitMine now holds about 4.42m ETH (3.66% of supply), mostly staked, while other whales and even Vitalik reduced exposure, adding mixed on‑chain signals.
Ethereum (ETH) traded near a critical support level as large holders sold significant amounts of the cryptocurrency, creating downward pressure despite technical indicators suggesting a potential reversal, according to market data and on-chain analytics.
The cryptocurrency displayed bullish divergence on 12-hour charts, with the Relative Strength Index making a higher low while the price established a lower low over the prior month. This technical pattern typically precedes price reversals in traditional technical analysis.
However, substantial selling activity by large holders has complicated the technical outlook. A major wallet address sold a substantial amount of Ethereum in a concentrated period, according to blockchain data. Another dormant whale address transferred coins to an exchange after remaining inactive for years, a movement typically associated with selling intentions. Ethereum co-founder Vitalik Buterin also sold a notable amount over recent days, data showed.
BitMine Immersion Technologies moved counter to the broader trend, substantially increasing its Ethereum holdings to represent a notable share of circulating supply, according to company disclosures. The firm maintains a large staked position generating annualized yield and completed a major purchase last week. The company has publicly stated an acquisition target that would capture a meaningful share of total supply.
Traditional financial institutions showed opposite behavior. Ethereum exchange-traded funds posted consecutive weeks of net outflows, indicating capital exiting these regulated investment products, according to fund flow data.
On-chain metrics presented mixed signals. New wallets received materially higher-than-normal inflows, whale inflows spiked well above average levels, and top profit-and-loss wallets added sizable amounts, blockchain analytics firms reported. The combination of ETF outflows and major whale selling has kept downward pressure on the price in the near term.
The cryptocurrency’s price trajectory depends on whether current support levels hold, analysts noted. A daily close below the key support level would invalidate the bullish divergence pattern and expose lower support zones. Technical analysts identified a downside scenario involving continued large holder selling, ongoing ETF outflows, and absent buying interest until a lower level triggers capitulation selling.
The alternative scenario requires the support level to hold, followed by a reclaim of recent consolidation highs, which would signal a reversal pattern and open movement toward the next technical resistance level, according to chart analysis.

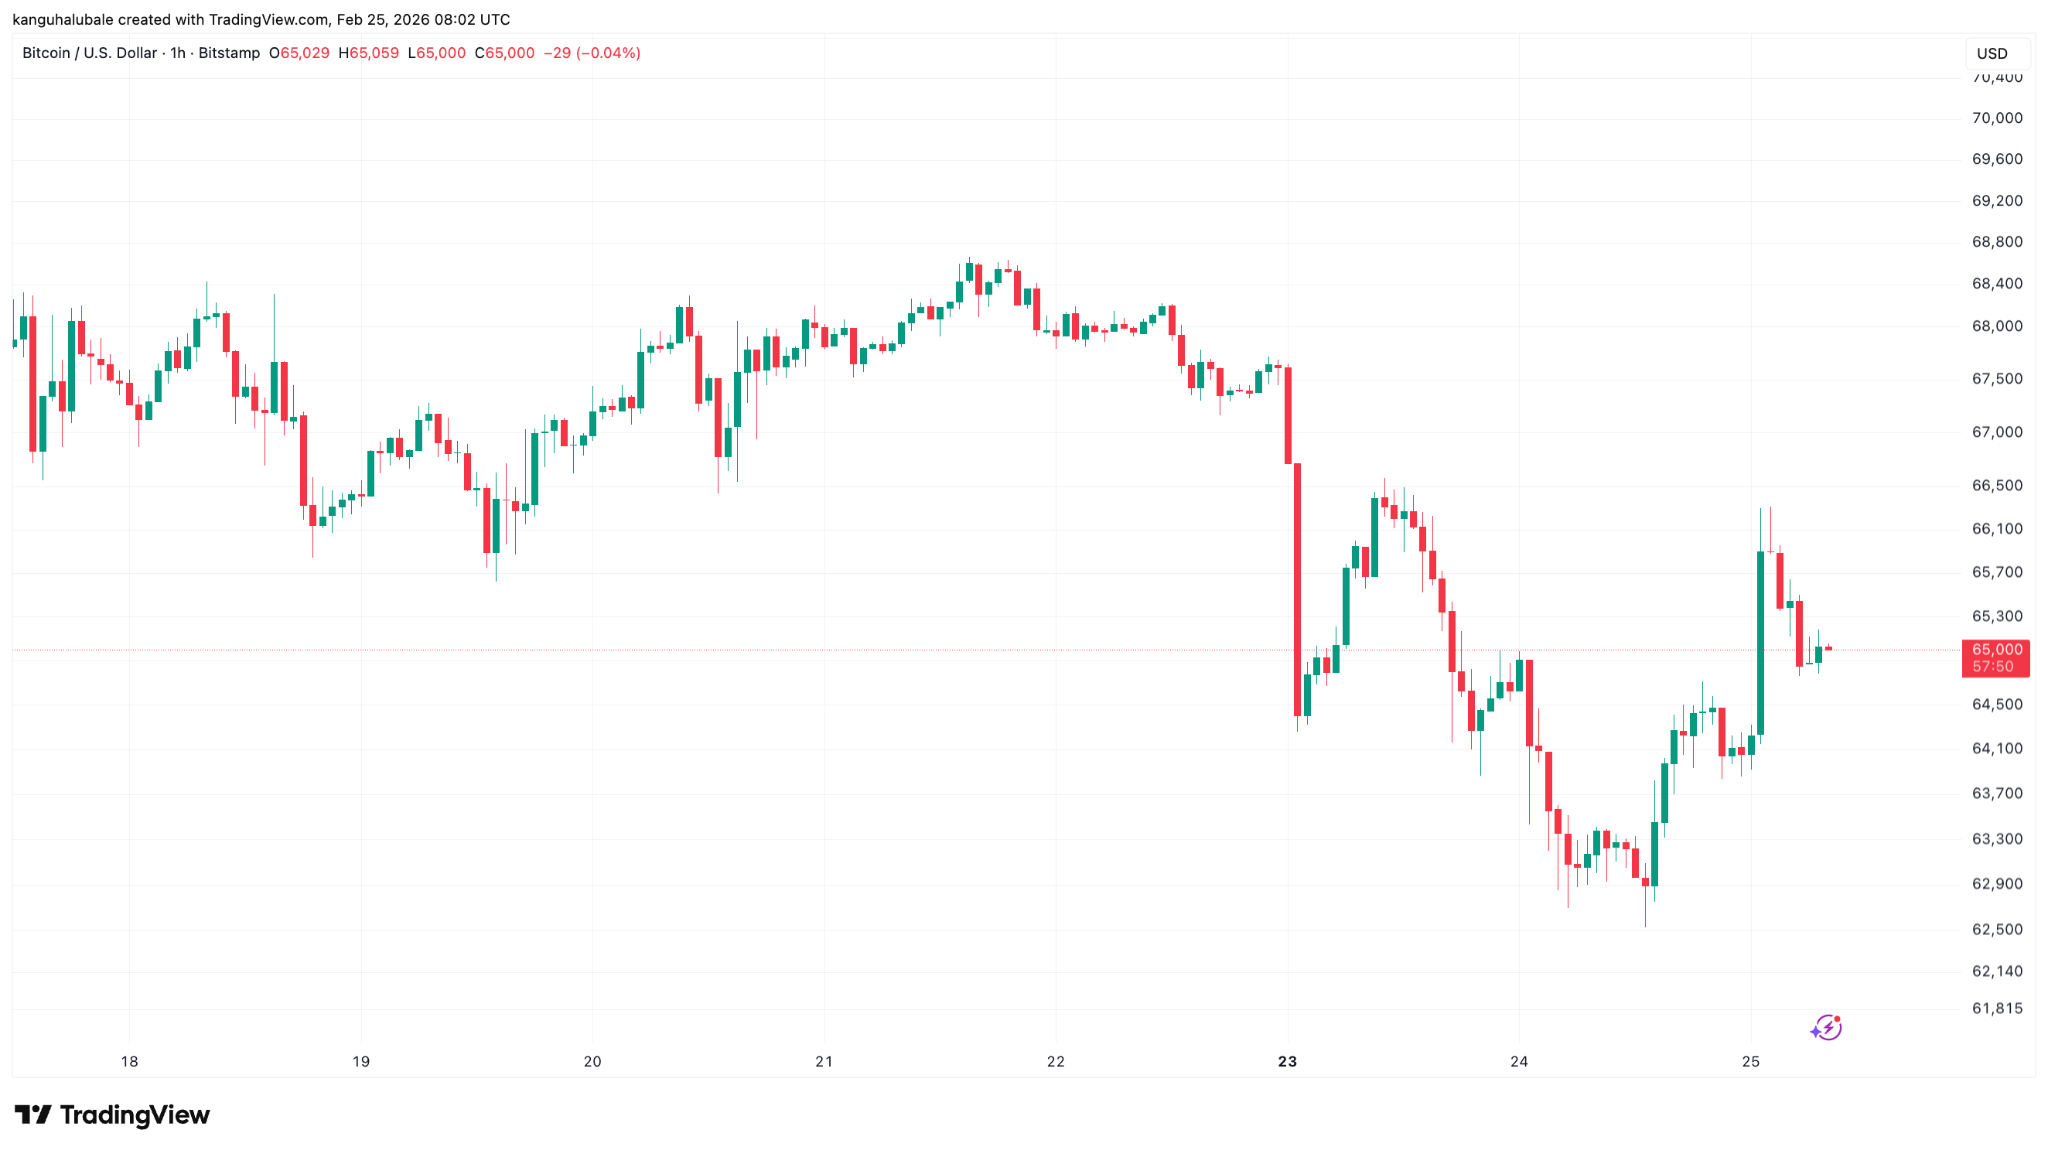
Bitcoin (BTC) rallied toward $66,000 after Tuesday’s gains in the US stock market, as cryptocurrencies sought to halt their 2026 slump.
Key takeaways:
-
Bitcoin rallied above $66,000 on Wednesday, recovering alongside US stocks.
-
Bitcoin Coinbase Premium Index flipped positive amid $258 million in ETF inflows.
-
While BTC’s correlation with stocks and gold is at its weakest since 2022, it historically signaled significant upside upon reversion.

BTC price recovers in tandem with US equities
Bitcoin’s recovery Wednesday aligns closely with similar rebounds in the US stock market, with AI and tech stocks leading the market higher.

The tech-focused Nasdaq led the recovery with 1.05% daily gains, while the S&P 500 rose 0.68%. The Dow locked in a 421-point gain, closing the trading day on Tuesday 0.86% higher.
Related: Bitcoin bounces to $66K as rumors swirl over Jane Street selling algorithm
Crypto-related stocks also saw moderate gains, with crypto exchange Coinbase (COIN) rising by 1.12% and Strategy (MSTR) gaining 0.73%.

The swift recovery of US equity markets appears to have played a role in easing negative pressure on crypto investors looking to cut risk asset exposure.
This is evidenced by the Bitcoin Coinbase Premium Index, a metric that tracks the price difference between BTC on Coinbase and Binance, which has flipped positive for the first time since Jan. 15.
This means “US buyers are stepping in,” said analyst Nic in a post on Wednesday, adding that the index needs to stay positive to ensure sustained buying pressure.

The return of demand in the US was also reflected by Bitcoin ETFs, which recorded $258 million in net inflows on Tuesday.
Bitcoin won’t stay disconnected forever: Analysis
Bitcoin, which is often viewed as a risk asset in the short term, has frequently moved in tandem with the stock market, particularly the S&P 500.
The past six months have seen a sustained period of this correlation breaking. The daily correlation coefficient index between BTC price and the US benchmark index, the S&P 500 index, is currently 0.32, and -0.45 with gold.

“Since late August, gold has surged +51%, the S&P 500 has gained +7%, and Bitcoin has fallen -43%,” onchain data provider Santiment said in a recent post on X.
This marks the weakest correlation between Bitcoin and stocks since the FTX chaos in late 2022.
“Historically, when an asset that is usually correlated breaks away in this dramatic fashion, it typically does not stay disconnected forever,” Santiment said, adding:
“In the long term, this unusual separation actually argues for significant upside for Bitcoin and altcoins.”

If Bitcoin returns to its historical pattern of tracking equities during economic expansions, “it may have significant room to catch up,” Santiment concluded.
This view was echoed by the founder and CIO of trading company QCP Capital, Darius Sit, who argued that the “Bitcoin vs. gold” debate is often misread as a price contest, when the “more important driver is liquidity and market structure.”
The divergence between stocks and BTC “reflects position unwinds and leverage-driven flows, not a failure of Bitcoin’s longer-term narrative,” Sit said, adding:
“Bitcoin still behaves like a long-term inflation hedge and an increasingly legible form of collateral.”
As Cointelegraph reported, Bitcoin’s adoption by institutions, banks, merchants, public companies and nation-states surged in 2025, confirming it as a maturing asset class for investors.
This article does not contain investment advice or recommendations. Every investment and trading move involves risk, and readers should conduct their own research when making a decision. While we strive to provide accurate and timely information, Cointelegraph does not guarantee the accuracy, completeness, or reliability of any information in this article. This article may contain forward-looking statements that are subject to risks and uncertainties. Cointelegraph will not be liable for any loss or damage arising from your reliance on this information.
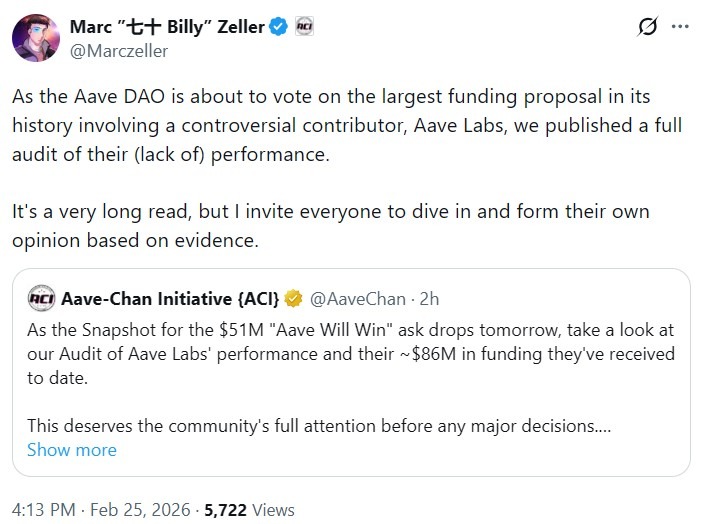
A governance dispute inside the Aave ecosystem intensified after two detailed reports offered contrasting interpretations of the protocol’s past funding and contributions ahead of a vote on a proposed $50 million package for Aave Labs.
Aave Chan Initiative (ACI) founder Marc Zeller on Wednesday published what he called a transparency report reviewing Aave Labs’ historical funding and applied a return-on-investment framework to past DAO grants. Hours earlier, Aave Labs released its own contributions report outlining its role in building the protocol since 2017.
The dispute centers on the “Aave Will Win” framework, a proposal asking tokenholders to approve funding worth up to $42.5 million in stablecoins and 75,000 AAVE (AAVE) tokens. In return, Aave Labs would route 100% of revenue from Aave-branded products to the Aave DAO treasury under a DAO-funded operating model, according to the proposal and related forum posts.
The debate has broadened beyond the size of the funding request to include questions about accountability standards, revenue attribution and who maintains the protocol’s core infrastructure.
It follows the recent announcement that BGD Labs, a core technical contributor, will conclude its involvement with the DAO on April 1.
Competing views on funding and value
Zeller’s report said Aave Labs has received about $86 million in lifetime capitalization, including its 2017 initial coin offering (ICO) proceeds, venture funding and DAO payments.
He argued that future DAO grants should be evaluated using measurable revenue impact and clearer disclosure standards.
ACI, a service provider to the Aave DAO and not a neutral party in the debate, questioned whether governance votes should be unbundled to separate funding, revenue alignment and V4 ratification.
Zeller wrote that funding decisions should be tied to performance benchmarks and transparent reporting.

Aave Labs, in its contributions report, highlighted its role in designing and shipping Aave V1, V2 and V3, and highlighted features it said underpin the protocol’s current revenue model, including flash loans, the Safety Module and Efficiency Mode.
Aave Labs argued that counting governance proposals or forum posts does not reflect the full scope of research, development, security and infrastructure work required to maintain a protocol used by millions of users.

What tokenholders are voting on
Under the “Aave Will Win” framework, Aave Labs would transition to a DAO-funded operating model while directing product-level revenue, including from aave.com and planned consumer-facing products, to the DAO.
Related: Curve Finance founder says disagreement within a DAO is a healthy sign
The proposal also seeks ratification of Aave V4 as the protocol’s long-term technical foundation and outlines plans for a new foundation to steward the Aave brand.
Some community members have previously raised concerns about the size of the funding package and the inclusion of 75,000 AAVE tokens, which carry voting power.
On Feb. 13, critics called for clearer definitions of revenue and greater transparency around governance holdings.
The Snapshot vote, scheduled for Thursday, is an initial offchain vote that gauges community sentiment before any binding onchain proposal is submitted.
Magazine: Hong Kong stablecoins in Q1, BitConnect kidnapping arrests: Asia Express

The United Kingdom’s Financial Conduct Authority (FCA) selected four companies to join a dedicated stablecoin cohort within its long‑running Regulatory Sandbox.
In a Wednesday press release, the FCA said it chose Monee Financial Technologies, ReStabilise, Revolut and VVTX from a pool of 20 applicants to test how their stablecoin services perform under the UK’s proposed rules in a “safe environment.”
The UK regulator said that its testing would focus primarily on stablecoin issuance and that the four companies would pilot a range of use cases, including payments, wholesale settlement and crypto trading, with findings intended to inform the UK’s final stablecoin rules.
Matthew Long, director of payments and digital assets at the FCA, said that the regulator would support UK stablecoin issuers to ensure that they could “be trusted for payments, settlement and trading.”
He said that the FCA’s involvement would “benefit consumers and financial transactions,” and that it would help to “deliver the FCA’s strategy and the Government’s National Payments Vision.”
Sandbox permits testing in controlled environment
The FCA’s sandbox was launched in 2016 under Project Innovate, and the stablecoin‑specific cohort opened for applications in November 2025, aimed at prospective UK stablecoin issuers wanting to pilot pound or other fiat‑backed tokens and related payment use cases while the country’s permanent stablecoin regime is being finalized.

The four companies chosen for the cohort are expected to begin testing in the first quarter of 2026, and their findings will “help shape the UK’s final stablecoin rules later in 2026,” the release states.
Related: Gemini exit a ‘blow for policymakers’ with UK crypto hub ambitions
All companies will need to be authorized under the new regime once it goes live in October 2027.
The regulator had previously flagged sterling‑denominated stablecoin payments as a priority for everyday use and has already brought in projects like regulatory technology firm Eunice to explore disclosure standards and market data frameworks for crypto markets.
FCA’s stablecoin plans face industry criticism
Despite the FCA’s efforts, industry leaders such as Coinbase CEO Brian Armstrong have warned that the UK’s emerging stablecoin regime risks undercutting the country’s competitiveness in the digital economy.
In a Wednesday X post, Armstrong pointed to proposals from the Bank of England to cap the amount of stablecoin individuals and businesses can hold, arguing that such caps would act as an “innovation blocker” at a time when other jurisdictions are moving quickly to attract stablecoin and blockchain businesses.
He urged UK residents to support a pro‑innovation strategy for blockchain and stablecoins by signing a petition coordinated by advocacy group Stand With Crypto UK that has already garnered over 80,000 signatures, highlighting the tension between the UK’s cautious, payments‑first approach and industry calls for looser limits on stablecoin use.
Magazine: How crypto laws changed in 2025 — and how they’ll change in 2026


Crypto exchange-traded product (ETP) provider 21Shares has launched an investment product giving European investors access to a preferred stock issued by Michael Saylor’s Strategy, the world’s largest public holder of Bitcoin.
The asset manager will list its 21Shares Strategy Yield ETP under the ticker “STRC NA” on Euronext Amsterdam on Thursday, the company said Wednesday.
The ETP is available to institutional and retail investors, offering a dividend backed by Strategy’s Bitcoin (BTC) treasury, which currently holds 717,722 BTC, valued at around $47 billion. With dividends set at a variable 11.25% annualized rate, the ETP represents one of the earliest structured, BTC-backed corporate securities available to European investors.
How the STRC ETP Works
The 21Shares Strategy Yield ETP with exposure to Strategy’s preferred stock STRC, officially known as Variable Rate Series A Perpetual “Stretch” Preferred Stock, is designed to act as a “cash-flow bridge” between traditional finance and Strategy’s Bitcoin treasury.
21Shares said the ETP structure is intended to make the instrument easier to access for European investors through standard brokerage accounts, rather than requiring investors to buy the preferred shares directly.
“By combining high income potential with a familiar exchange traded structure, STRC offers both institutional and retail investors an efficient and accessible way to add yield to their portfolios,” 21shares president Duncan Moir said.
21Shares enters equity-linked ETPs
The company positioned the launch as its first equity-linked product, expanding beyond its traditional lineup of crypto-only ETPs, Moir noted.
He added that the move reflects the company’s broader mission to provide accessible exposure to digital assets.
“Since our inception, we have focused on providing straightforward access to digital assets,” Moir said. “With this product, we are extending that expertise into equity-linked exposure tied to the Bitcoin ecosystem,” he added.
Related: Bitcoin ETFs post $258M inflows as institutional Q4 selling hits 25,000 BTC
Operating since 2018, 21Shares is one of the largest crypto ETP providers globally, managing about $5.3 billion across 60 ETPs on 13 exchanges as of Monday.
The company has continued its global expansion, launching a new exchange-traded fund in the US on Tuesday: the 21Shares Spot SUI ETF (TSUI), which has started trading on the Nasdaq.
This follows a series of ETP launches by 21Shares, as asset managers continue to broaden the menu of regulated products tied to crypto markets for both institutional and retail investors.
Magazine: Bitdeer sells all Bitcoin, Metaplanet rejects misconduct claims: Asia Express


BlockFills co-founder and CEO Nicholas Hammer has stepped down from his leadership role, with the company’s website now listing Joseph Perry as interim CEO.
Summary
- BlockFills co-founder and CEO Nicholas Hammer has stepped down, with Joseph Perry appointed as interim CEO.
- The firm halted deposits and withdrawals earlier this month after suffering a reported $75 million lending loss.
- BlockFills is now exploring a potential sale or strategic partnership as it navigates liquidity pressures during the ongoing crypto bear market.
Leadership shakeup at BlockFills as firm seeks buyer after market stress
The leadership change comes as the Chicago-based crypto lending and liquidity firm grapples with significant financial stress, operational freezes and strategic uncertainty.
On February 11, 2026, BlockFills temporarily suspended client deposits and withdrawals, a decision attributed to challenging market conditions and liquidity pressures. The suspension remains in place with no clear timeline for resumption, prompting concern among its roughly 2,000 institutional clients, which include hedge funds, asset managers and mining firms.
According to media reports, the company also has an approximate $75 million loss linked to its crypto lending business after the value of collateral backing loans declined sharply during the recent downturn in digital asset prices.
Some clients were privately advised to withdraw assets before the full freeze was implemented, a move that industry watchers see as indicative of deeper liquidity stress.
BlockFills’ management and investors are now reportedly actively seeking a buyer or strategic partner to stabilize operations, with Joseph Perry stepping in to lead these efforts. The firm, which processed more than $60 billion in trading volume in 2025, is supported by backers including Susquehanna Private Equity, CME Ventures, Simplex, C6E and Nexo.
Amid a persistent bear market, capital constraints and broader risk aversion in crypto markets, the company’s fate remains uncertain. Prolonged freezes on liquidity could damage confidence and hinder institutional participation, echoing patterns seen in previous crypto downturns where lenders faced severe solvency challenges.
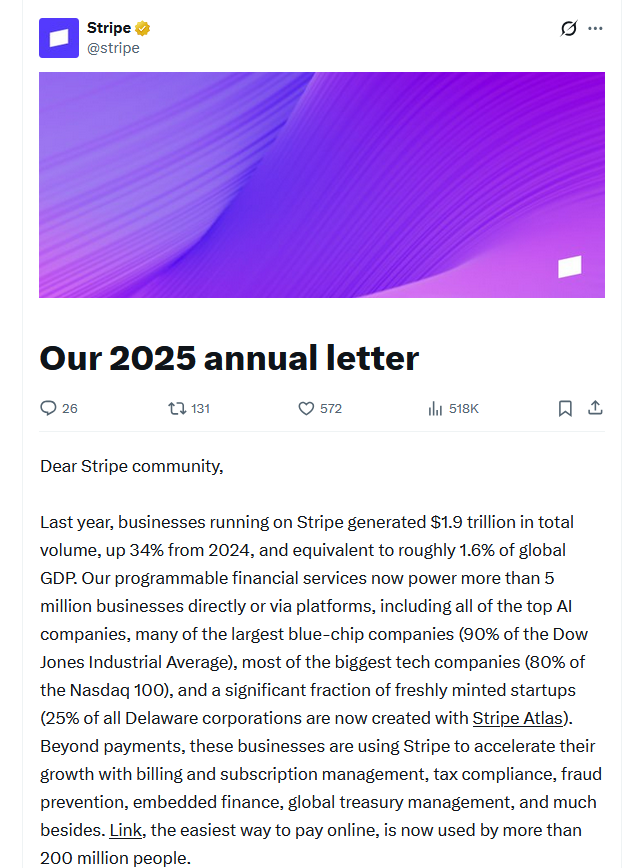
Financial technology firm Stripe says blockchains may need to process up to 1 billion transactions per second to support the future of artificial intelligence agents.
In an annual letter posted to X on Tuesday, Stripe CEO and co-founder Patrick Collison and co-founder John Collison gave a rundown of the firm’s performance over 2025, while also making some predictions for the near future.
One of the key talking points was the adoption of AI agents and what widespread use could look like in the future. The duo argued that blockchain transaction activity will soon skyrocket as AI agents gradually become the primary conductors of online transactions.
However, the Stripe co-founders said there is a significant infrastructure gap in blockchain and said immense scaling is required to meet this incoming demand.
“Last year, a memecoin trading frenzy on one of the major blockchains delayed payouts for one Bridge user by over 12 hours and spiked per-transaction prices 35x. While such operational issues are already significant, they will only intensify, for we expect the appetite for transactions to grow a great deal,” they wrote, adding:
“In our view, agents will most likely soon be responsible for most internet transactions, and we will likely need blockchains that support more than one million — or even one billion — transactions per second.”

According to data from Chainspect, Internet Computer Protocol and Solana are currently the top two blockchains by transaction speed, with roughly 1,196 and 1,140 transactions per second (TPS), respectively.
They are the only two on the market currently processing more than 1,000 TPS, and at their peak, they have processed 25,621 TPS and 5,289 TPS, respectively.
As it stands, both networks have a theoretical maximum of only 209,708 TPS and 65,000 TPS, respectively.
AI commerce is past the “hype phase”
Alongside their predictions on the incoming demand, the Stripe execs also outlined what the main kinds of use cases AI agents will be serving online. Currently, they said that AI agents have moved beyond a phase of “pure hype” into a time of building and “real-world experimentation.”
Related: Stripe considers acquiring some or all of PayPal: Report
They outlined five levels of AI agent capabilities. The first two levels include: completing web forms and descriptive search — being able to find results for users based on descriptions of situations rather than specific attributes.
According to the Stripe execs, AI agents are “hovering on the edge” of levels one and two.
The next three levels include: persistence — remembering user information, requirements, and preferences; delegation — handling tasks like grocery shopping on your behalf; and anticipation — being able to provide solutions to problems or schedules without being prompted.
“As with the early internet, the future success of agentic commerce is contingent on universal interoperability. Our ascent through the five levels depends on our ability to work together,” they wrote, adding:
“If all goes well, the little critters won’t be cooped up in walled gardens, but will be zooming down the wide-open protocol highways.”
Magazine: Crypto loves Clawdbot/Moltbot, Uber ratings for AI agents: AI Eye
Traditional investors don’t yet realize the impact crypto may have on financial markets, meaning there could be an opportunity to invest in what the technology could eventually become, says Bitwise investment chief Matt Hougan.
“Everywhere I look, Wall Street is screaming that finance is moving on-chain. Not a little of it; all of it,” Hougan said in a note on Tuesday. “Yet traditional investors can’t hear it.”
He argued investors are suffering from “anchoring bias” and are still fixated on how crypto was perceived in its early days — when it was still an unknown technology mostly used by cypherpunks and dark web black markets.
“They look at crypto and still see a punk skateboarder with tattoos. They don’t realize he’s shaved, put on a suit, and is deploying infrastructure that will underpin the next generation of capital markets,” Hougan said.
Major finance companies have launched or are experimenting with facets of crypto technology, mainly tokenization and stablecoins, spurred on by US regulators and lawmakers moving to support the sector.
Crypto investors not registering the shift
Hougan said that crypto investors are also not taking notice of the current shift, as traditional institutions have taken a passing interest in the space before.
“They’re suffering from ‘the boy who cried wolf’ syndrome,” he said. “They’ve heard the promises of institutional adoption for so long that they no longer register.”
Hougan argued, however, that major finance players have begun to move on-chain with the backing of regulators, namely the Securities and Exchange Commission’s “Project Crypto,” launched in July to “enable America’s financial markets to move on-chain,” according to its chair, Paul Atkins.
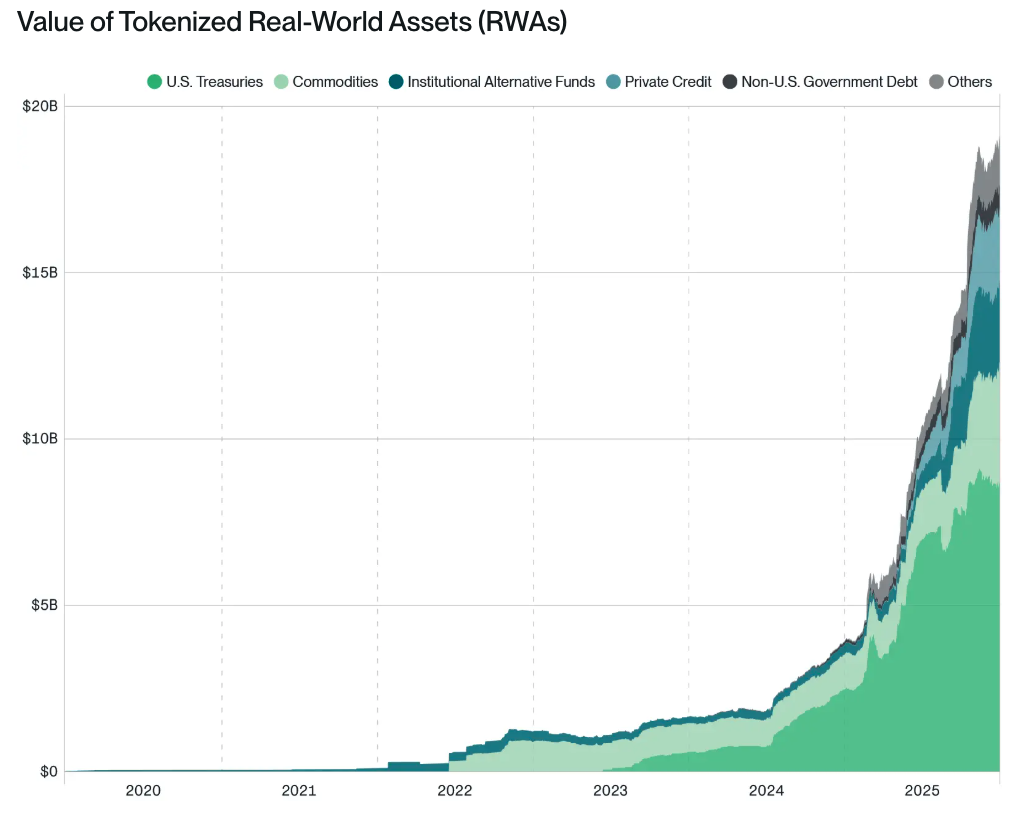
The value of tokenized assets on blockchains, such as US Treasurys and commodities, has quickly begun to approach $20 billion, he said, more than quadrupling over 2025.

“The numbers in question are enormous,” he said, adding that the hundreds of trillions of dollars floating around in exchange-traded funds, stocks and bonds means the tokenization market “can grow 10,000x and still have room to grow.”
Related: Tokenization without provenance is complicity
Hougan added that BlackRock and credit manager Apollo have launched tokenized funds on-chain worth billions of dollars, and major banks JPMorgan, Bank of America, Citigroup, and Wells Fargo are in talks for a stablecoin.
“There is a large delta between what people think is happening in crypto and what is actually happening,” Hougan said.
“From where I sit, that gap creates a significant opportunity — not to try to pick winners prematurely, but to build broad exposure to the space while the market is still mispricing the structural shift,” he added.
Magazine: Bitcoin’s ‘biggest bull catalyst’ would be Saylor’s liquidation — Santiment founder
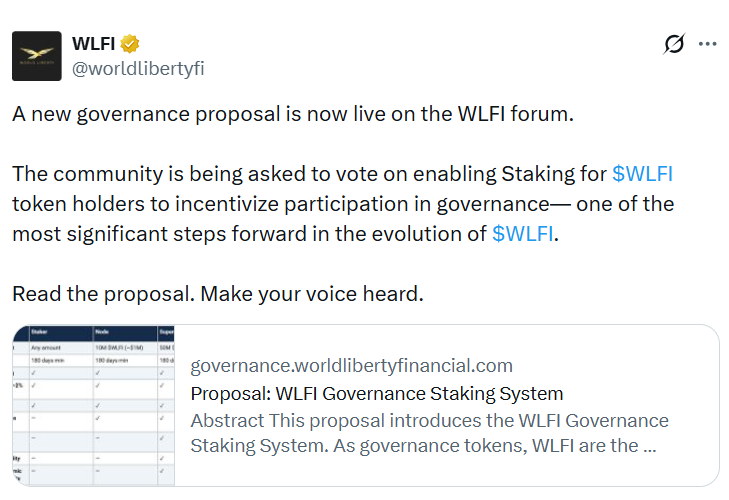
Trump family-backed crypto venture World Liberty Financial (WLFI) has proposed new measures to boost participation in governance through a staking system and incentivize the use of its stablecoin USD1.
In its latest proposal on Wednesday, the team suggested governance votes should require holders to stake their tokens for at least 180 days to ensure “voting power is held by participants with long-term alignment to the protocol,” instead of “short-term holders or speculators.”
Stakers would earn an annual percentage rate of 2% provided they participate in at least two governance votes during the lock-up period. Governance power would be based on the amount staked and the time left in the lock-up. Users with locked tokens can continue to vote as usual.

Incentives for USD1 usage on the table too
WLFI has been trying to increase USD1 adoption since it launched through rewards programs and partnerships with institutional platforms and other protocols.
As part of the staking system, the WLFI team said users who stake their tokens would also gain “additional benefits for USD1 usage,” with USD1 deposits made on the trading and lending platform WLFI Markets attracting unspecified “incentives” from the DeFi protocol Dolomite.
At the same time, “Nodes,” holders with at least 10 million WLFI tokens, will gain access to providers who offer conversion of other stablecoins like USDC (USDC) and USDt (USDT) into USD1 at a 1:1 rate and can provide an off-ramp directly to fiat.
“Super Nodes,” or holders with more than 50 million WLFI tokens, will also have access to the feature.

For the vote to be valid, the WLFI team has set the bar at one billion voting tokens participating, with a majority voting in favor required for it to pass. CoinGecko lists over 27 billion WLFI tokens in circulation.
If approved, the rollout will be in three phases: starting with staking rewards and USD1 deposit incentives, followed by the 1:1 conversion feature and lastly partnership access and a revenue-sharing framework for “Super Nodes.”
Related: Trump crypto company says ‘coordinated attack‘ on stablecoin failed
Stablecoin market dominated by USDC and USDT
The total market capitalization for stablecoins is over $309 billion as of Thursday, according to DeFi aggregator DefiLlama. USDT has the largest market cap with over $183 billion and a market dominance of 59%.
Circle’s USDC is the second-largest stablecoin by market cap, with $75 billion. WLFI’s USD1 is the fifth-largest stablecoin with a $4.7 billion market cap.
Magazine: Bitcoin’s ‘biggest bull catalyst’ would be Saylor’s liquidation: Santiment founder

Tap to Earn is no longer a novelty mechanic. In 2026, it has matured into a scalable user acquisition & token distribution model built around frictionless onboarding, micro-interactions, and viral network effects, especially within the TON ecosystem and Telegram infrastructure.
Unlike traditional Web3 games that demand high production budgets and long development cycles, Tap to Earn games optimize for speed, distribution, and engagement density. However, while they may appear simple on the surface, building a sustainable Tap to Earn ecosystem on TON requires strategic architecture, disciplined tokenomics, backend scalability, and strong anti-fraud design.
This Tap to Earn game development 2026 guide explores the structural foundation on TON and what it takes to build for long-term growth.
What Is Tap to Earn in 2026?
Tap to Earn in 2026 is not just about tapping a screen to collect tokens. It represents a behavioral reward engine designed around micro-engagement cycles. At its core, Tap to Earn is built on three mechanics:
- Ultra-simple interaction loops
- Instant reward feedback
- Referral-amplified growth
However, what makes it powerful today is not the tap, it is the ecosystem design. Modern Tap to Earn systems integrate:
- On-chain reward validation
- Token-based incentive layers
- Community leaderboard gamification
- Progressive unlock systems
- Hybrid off-chain performance optimization
The reason this model works so effectively on TON is that Telegram removes the largest friction point in gaming that is app installation. Users need not download and they need not register. They simply click and start interacting. This instant participation layer plays a significant role in dramatically improving early retention metrics. In 2026, Tap to Earn is less about “earn by tapping” and more about “engage and amplify within an ecosystem.”
Reason Behind the Explosion of Tap to Earn in 2024–2026
The growth of Tap to Earn is not accidental. It is structurally aligned with current user behavior and Web3 distribution dynamics. Typically, there are four primary reasons for its rapid adoption.
1. Distribution Without Friction
Telegram provides a ready-made network. Every user is already authenticated. Wallet integrations through TON helps reduce onboarding complexity further. No app store policies applicable, no 30% deduction in revenue, and no installation barrier.
2. Viral Referral Loops
Tap to Earn thrives on referral multipliers. Most games are architected to incentivize inviting friends. Every new user increases reward potential for existing participants, which, in turn, creates network compounding effects.
3. Micro-Session Behavior
Modern users prefer short engagement bursts. Tap to Earn sessions often last seconds or minutes, making them highly repeatable. This helps increase daily active usage frequency.
4. Tokenized Incentives
Unlike Web2 games, Tap to Earn integrates token ownership. This adds speculative and financial motivation layered on top of gameplay.
However, growth alone does not guarantee sustainability. Many projects in 2024 collapsed because they were optimized for viral spikes rather than focusing on economic durability.
Tap to Earn vs Play to Earn: Structural Differences
A number of new entrants in the field of gaming tend to get confused between Tap to Earn and Play to Earn model. While both Tap to Earn and Play to Earn fall under the category of Web3 gaming, they are fundamentally different in architecture, user behavior, and scalability potential. Understanding the difference between Tap to Earn and Play to Earn helps businesses and decision-makers choose the right model for their Web3 gaming strategy.
| Factor | Tap to Earn Games | Play to Earn Games |
|---|---|---|
| Core Interaction Model | Built around simple micro-interactions such as tapping, claiming rewards, or completing lightweight tasks. Designed for rapid engagement cycles. | Built around deeper gameplay mechanics such as battles, quests, strategy, or asset management requiring longer sessions. |
| User Onboarding | Extremely low friction. Users can start instantly through Telegram Mini Apps or bots without downloads or complex registration. | Typically requires wallet setup, NFT purchases, or platform onboarding before meaningful participation begins. |
| Development Complexity | Focuses on scalable backend systems, referral engines, and reward validation logic rather than complex gameplay mechanics. | Requires complex gameplay systems, NFT logic, multiplayer infrastructure, and advanced in-game mechanics. |
| Infrastructure Requirements | Lightweight frontend but strong backend validation systems to support large user volumes and prevent bot abuse. | Heavy infrastructure requirements due to complex gameplay, marketplace interactions, and asset ownership tracking. |
| Economic Structure | Growth-driven economies that depend on network expansion and controlled reward distribution. | Asset-driven economies focused on NFT ownership and in-game asset value appreciation. |
| Entry Barrier for Users | Usually free-to-start, allowing rapid user acquisition and viral growth. | Often requires upfront investment in NFTs or tokens to participate meaningfully. |
| User Session Length | Short sessions lasting seconds or minutes, encouraging frequent return visits throughout the day. | Longer sessions require dedicated gameplay time and higher user commitment. |
| Scalability Potential | Highly scalable due to lightweight interaction design and Telegram-based distribution. Can reach millions of users quickly. | Scaling requires significant infrastructure investment and longer development cycles. |
| Primary Growth Driver | Viral distribution and referral mechanics integrated into Telegram ecosystems. | Gameplay quality, asset value, and long-term player engagement. |
| Sustainability Challenges | Requires strong anti-bot protection and controlled token emissions to maintain ecosystem stability. | Requires balanced tokenomics and consistent player demand to prevent economic collapse. |
Strategic Takeaway
Tap to Earn is optimized for speed & distribution, while Play to Earn is optimized for depth and long-term gameplay value.
For projects launching within the TON ecosystem, Tap to Earn models often provide a faster path to user acquisition and ecosystem expansion. Play to Earn models, on the other hand, require significantly higher investment and longer development timelines but can support deeper gaming experiences.
Want to Build Your Viral Tap to Earn Game on TON?
Why TON Became the Default Ecosystem for Tap to Earn
TON particularly favors Tap to Earn due to its messaging-based ecosystem. Its technical architecture complements Tap to Earn mechanics exceptionally well, thereby making it ideal for Tap to Earn game development.
1. Native Telegram Integration
TON is embedded within Telegram’s infrastructure. This means wallet setup, notifications, and user verification happen inside the same ecosystem.
2. Transaction Efficiency
Low gas fees make micro-reward distribution economically viable. High gas environments would render Tap to Earn unsustainable.
3. Scalability
TON supports high transaction throughput. Viral Tap to Earn games may experience explosive user growth; infrastructure must support it.
4. Community Alignment
Telegram’s user base is already crypto-aware, which reduces user education barriers.
However, simply launching on TON does not guarantee success. Smart contract design, backend validation, and anti-bot systems remain critical.
Technical Architecture of TON Tap to Earn Games
Although Tap to Earn games appear simple to users, production-ready TON Tap to Earn game development relies on a multi-layered technical architecture. Each layer plays a critical role in ensuring scalability, reward validation, and long-term stability. Behind the simplicity lies layered engineering.
| Architecture Layer | Components | Purpose | Why It Matters |
|---|---|---|---|
| User Interaction Layer | Telegram Mini Apps, Bot Interfaces, Lightweight UI Components, Instant Feedback Systems | Provides a frictionless gameplay experience directly inside Telegram without requiring downloads or account creation | Fast and responsive interaction directly affects retention and engagement. Even small delays reduce daily active usage. |
| Application Logic Layer | Game logic engines, Reward calculation modules, Progress tracking systems, Leaderboards | Processes gameplay actions and determines how rewards are generated and distributed. | Ensures fair reward distribution and consistent user progression without manipulation. |
| Backend Infrastructure Layer | User databases, Referral tracking engines, Activity logging systems, API services | Stores player activity, validates interactions, and maintains the state of the game ecosystem. | Without robust backend infrastructure, viral growth can cause system instability and downtime. |
| Reward Validation Layer | Anti-bot detection systems, Rate-limiting controls, Behavioral analysis tools, Fraud monitoring systems | Detects suspicious activity and prevents automated reward farming or exploit attempts. | Tap to Earn ecosystems attract bots quickly. Without protection, token pools can be drained within weeks. |
| Blockchain Integration Layer | TON smart contracts, Token reward logic, Wallet connectivity, On-chain verification | Handles token distribution, asset ownership, and secure blockchain-based validation. | Ensures transparency and trust while keeping transaction costs low enough for micro-rewards. |
| Wallet & Identity Layer | TON Wallet integration, User identity mapping, Secure session handling | Connects players to blockchain assets and enables secure reward distribution. | Seamless wallet interaction reduces onboarding friction and improves user retention. |
| Analytics & Optimization Layer | Player behavior tracking, Retention analytics, Economy monitoring dashboards | Provides data-driven insights into user behavior and token circulation. | Enables continuous optimization and prevents economic imbalance over time. |
| Administration Layer | Admin dashboards, Economy controls, Reward adjustment tools, and User management panels | Allows operators to manage rewards, monitor activity, and maintain system stability. | Without administrative control, adjusting reward systems after launch becomes difficult. |
Architectural Insight
Most failed Tap to Earn projects underestimate the backend and validation layers. The visible interface may be simple, but scalable TON Tap to Earn game development requires disciplined engineering across multiple layers.
Successful projects typically implement hybrid architectures where:
- Frequent user actions are processed off-chain for speed
- Final reward distribution happens on-chain for transparency
- Smart contracts handle ownership and token logic
- Backend systems protect against exploitation
This hybrid model is considered best practice for TON Tap to Earn game development in 2026.
Monetization & Sustainability in Tap to Earn
Monetization models must go beyond token distribution. Sustainable Tap to Earn models integrate:
- Token sinks (upgrades, boosts, access rights)
- NFT premium layers
- Sponsored reward campaigns
- Marketplace transaction fees
- Tier-based reward multipliers
The biggest mistake projects make is treating token emission as marketing rather than economic policy. Economic modeling should actually account for:
- User growth velocity
- Token circulation rate
- Secondary market liquidity
- Inflation control mechanisms
Without this, reward dilution erodes value quickly.
Risks & Common Reasons for Failure
The majority of failed Tap to Earn projects tend to share similar weaknesses.
1. Bot Exploitation
If reward validation is shallow, automated systems drain tokens rapidly.
2. Backend Instability
Sudden user spikes overwhelm weak infrastructure.
3. Poor Token Design
High emission with low utility leads to rapid devaluation.
4. Short-Term Hype Mentality
Projects focused solely on viral marketing rarely sustain engagement beyond initial weeks.
Proper engineering and long-term modeling mitigate these risks. This is exactly where the role of the best Tap to Earn game development company comes into play.
Choosing the Best Tap to Earn Game Development Company
Selecting the best Tap to Earn game development company requires evaluating more than just portfolio aesthetics. Key evaluation criteria include:
- TON smart contract expertise
- Proven anti-bot engineering capability
- Backend scalability experience
- Tokenomics advisory understanding
- Telegram Mini App specialization
Antier, as a professional Tap to Earn game development company, understands both blockchain and high-scale backend systems to approach your project as an ecosystem, not just a bot.
Strategic Outlook for 2026 and Beyond
Tap to Earn game development is evolving into:
- AI-personalized reward loops
- Dynamic token emission adjustments
- Cross-chain integration models
- Community governance overlays
- Hybrid Web2-Web3 reward systems
The projects that will dominate are those that appropriately integrate growth mechanics, secure architecture, sustainable economic design, and continuous iteration. Tap to Earn is not here to disappear. It is here to mature. Those who engineer for sustainability rather than hype will certainly capture long-term value.
Frequently Asked Questions
01. What is Tap to Earn in 2026?
Tap to Earn in 2026 is a behavioral reward engine focused on micro-engagement cycles, featuring ultra-simple interaction loops, instant reward feedback, and referral-amplified growth, all designed to enhance user acquisition and token distribution.
02. How does Tap to Earn leverage the TON ecosystem?
Tap to Earn leverages the TON ecosystem by utilizing Telegram’s infrastructure to eliminate friction points like app installation, allowing users to engage instantly without downloads or registrations, which significantly improves early retention metrics.
03. What are the key components of a successful Tap to Earn ecosystem?
A successful Tap to Earn ecosystem includes on-chain reward validation, token-based incentive layers, community leaderboard gamification, progressive unlock systems, and hybrid off-chain performance optimization, all contributing to sustainable growth.


Talk about winning the lottery. A solo miner walked away with over $200,000 in bitcoin while renting just $75 of hash power.
A solo miner validated block 938,092 around 8:04 a.m. UTC on Tuesday, earning the full 3.125 BTC block reward using hashrate rented through on-demand cloud services, according to blockchain data from Mempool.space.
The miner spent roughly 119,000 satoshis, about $75, to rent 1 petahash per second of computing power and used CKPool, a service that lets individual miners work independently while relying on a pool server to broadcast and submit solutions.
The math on that return is absurd. It’s a 2,600x payoff on what amounts to a lottery ticket with better odds than most actual lotteries.
Bitcoin’s network processes transactions by bundling them into blocks, which are added to the blockchain roughly every 10 minutes. Miners compete to solve a cryptographic puzzle for the right to add each block, and the winner collects the reward.
The competition is measured in hashrate, the amount of computing power a miner throws at the puzzle. More hashrate means more guesses per second and better odds.
Statistically rare
A solo miner renting 1 petahash is like bringing a slingshot to a gunfight. The odds of that single petahash solving a block before the industrial operations do are vanishingly small, roughly equivalent to finding one specific grain of sand on a beach.
But someone has to win each block, and probability doesn’t care about scale. As such, while solo-mined blocks remain statistically rare, they’re not as rare as they used to be.
Data from solo mining aggregator Bennet shows 21 individual miners have successfully validated blocks over the past year, earning a combined 66 BTC worth $4.1 million at current prices. That’s a 17% increase in solo blocks found year-over-year, with one landing roughly every 17 days on average.
The rise of on-demand hashrate rental has lowered the barrier to entry.
Miners no longer need to own physical hardware to take a shot. Cloud-based services let anyone rent computing power for as little as a few dollars, turning solo mining from an infrastructure-heavy operation into something closer to a scratch-off card with transparent odds.
Meanwhile, the lucky block landed during an interesting moment for bitcoin mining economics.
Network difficulty just climbed to 144.4 trillion after the latest adjustment, a 15% increase that reversed an 11% drop caused by severe U.S. winter storms earlier this month. The climb means miners now need on the order of 144.4 trillion hash attempts, on average, to find a valid block, compared with the very first blocks in 2009.
That storm-driven decline was the sharpest hashrate drop since China’s 2021 mining ban, temporarily making blocks easier to find before the network recalibrated.
And for one miner with $75 and good timing, the window was enough.

A Comprehensive Guide to Business Opportunities in Indonesia 2026

Bitcoin Taps $66k as Stock Divergence Hints at a BTC Price Rally

Survivor 50 Stars Reveal The Hardcore Ways They Prepared to Return (Excl)


-

 Video6 days ago
XRP News: XRP Just Entered a New Phase (Almost Nobody Noticed)
-

 Politics4 days ago
Baftas 2026: Awards Nominations, Presenters And Performers
-

 Fashion5 days ago
Weekend Open Thread: Boden – Corporette.com
-

 Sports2 days ago
Women’s college basketball rankings: Iowa reenters top 10, Auriemma makes history
-

 Politics3 days ago
Nick Reiner Enters Plea In Deaths Of Parents Rob And Michele
-

 Crypto World2 days ago
XRP price enters “dead zone” as Binance leverage hits lows
-

 Business4 days ago
Mattel’s American Girl brand turns 40, dolls enter a new era
-

 Business4 days ago
Law enforcement kills armed man seeking to enter Trump’s Mar-a-Lago resort, officials say
-

 Tech2 days ago
Unsurprisingly, Apple's board gets what it wants in 2026 shareholder meeting
-
 NewsBeat8 hours ago
Manchester Central Mosque issues statement as it imposes new measures ‘with immediate effect’ after armed men enter
-

 NewsBeat6 hours ago
Cuba says its forces have killed four on US-registered speedboat | World News
-

 Tech4 days ago
Anthropic-Backed Group Enters NY-12 AI PAC Fight
-
 NewsBeat3 days ago
‘Hourly’ method from gastroenterologist ‘helps reduce air travel bloating’
-

 Business1 day ago
True Citrus debuts functional drink mix collection
-

 NewsBeat3 days ago
Armed man killed after entering secure perimeter of Mar-a-Lago, Secret Service says
-

 Politics4 days ago
Maine has a long track record of electing moderates. Enter Graham Platner.
-
 NewsBeat1 day ago
Police latest as search for missing woman enters day nine
-

 Crypto World1 day ago
Entering new markets without increasing payment costs
-
 Sports3 days ago
2026 NFL mock draft: WRs fly off the board in first round entering combine week
-

 Crypto World6 days ago
83% of Altcoins Enter Bear Trend as Liquidity Crunch Tightens Grip on Crypto Market