Crypto World
BitMine Stock Price Faces 60% Drop Despite Citigroup Support

The BitMine stock price has started showing early signs of recovery. BMNR rose 6% on Feb. 13 before closing and is up 7.32% over the past five days. This rebound comes even as Ethereum, which BitMine closely tracks due to its ETH treasury exposure, has fallen 3.3% over the past week. This divergence suggests BitMine’s stock price may be trying to catch up.
BMNR charts also show that this rebound may be weak despite big players like Citigroup increasing BMNR holdings quarter-on-quarter. The bearish structure is still active, and the next few trading sessions could decide whether BitMine continues recovering or enters another major drop.
Bear Flag Structure Shows Recovery Attempt — But Breakdown Risk Remains
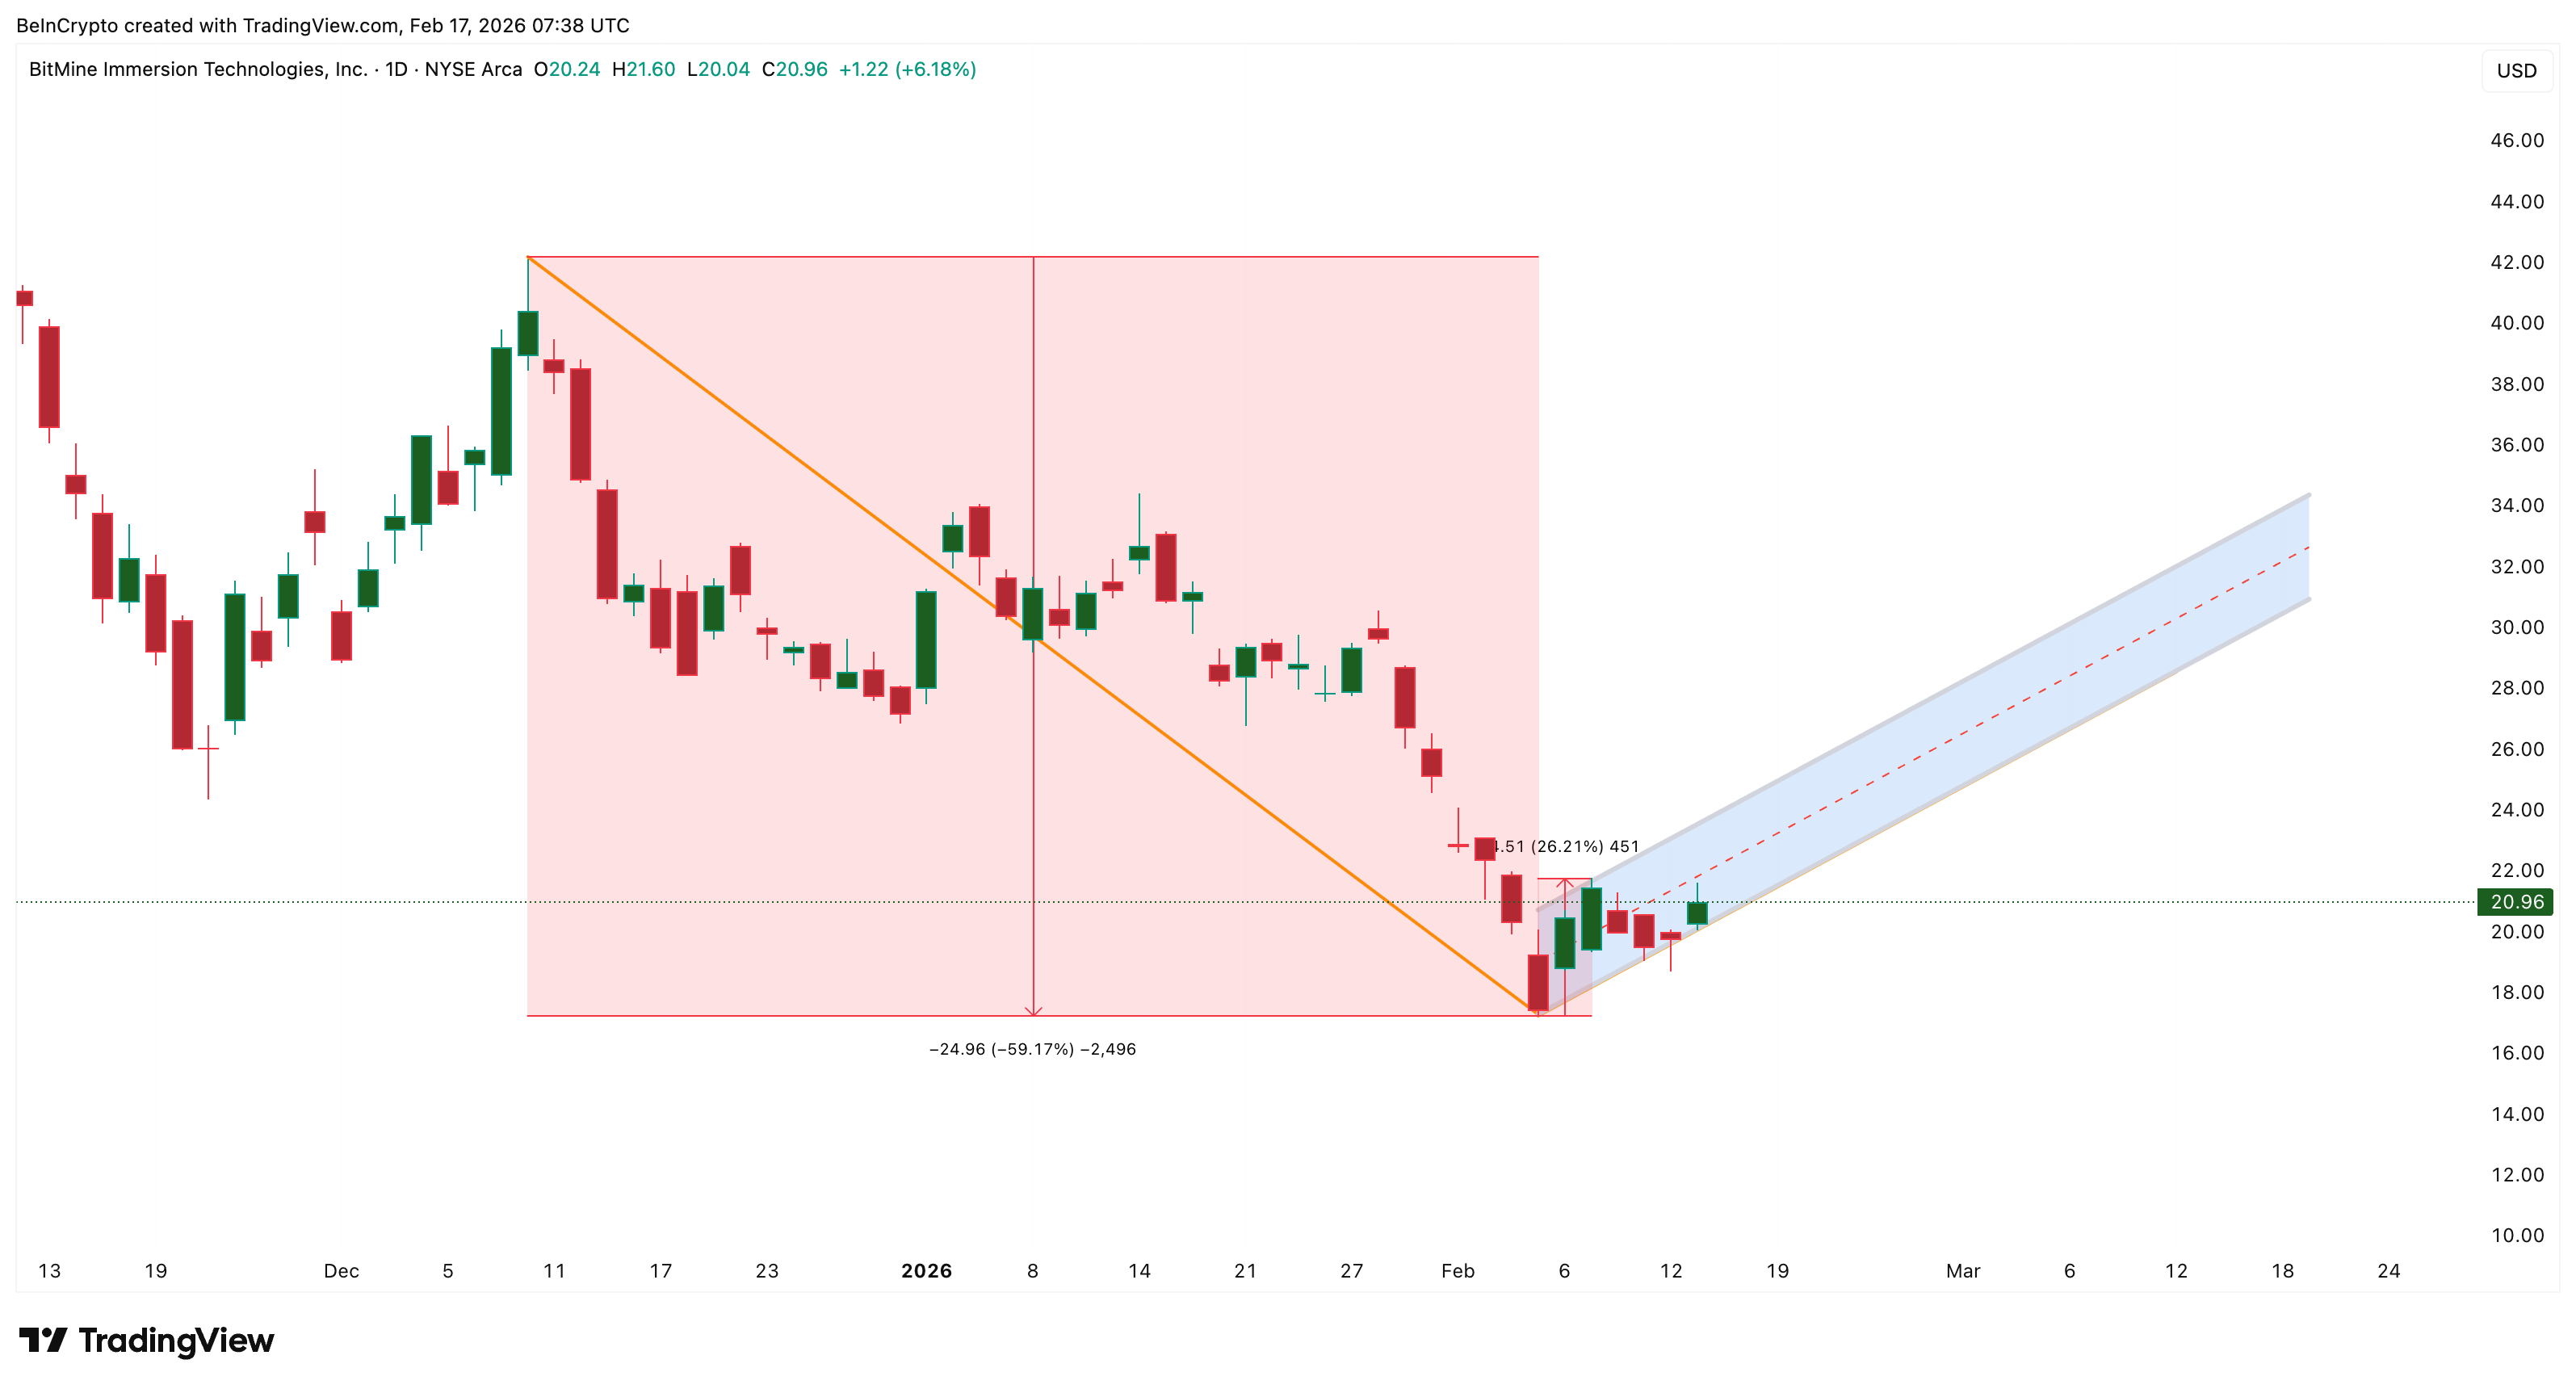
The BitMine stock price has been trading inside a bear flag pattern since early February. A bear flag forms after a sharp decline, followed by a temporary upward consolidation. This pattern often leads to another drop if buyers fail to fully regain control.
Sponsored
Sponsored
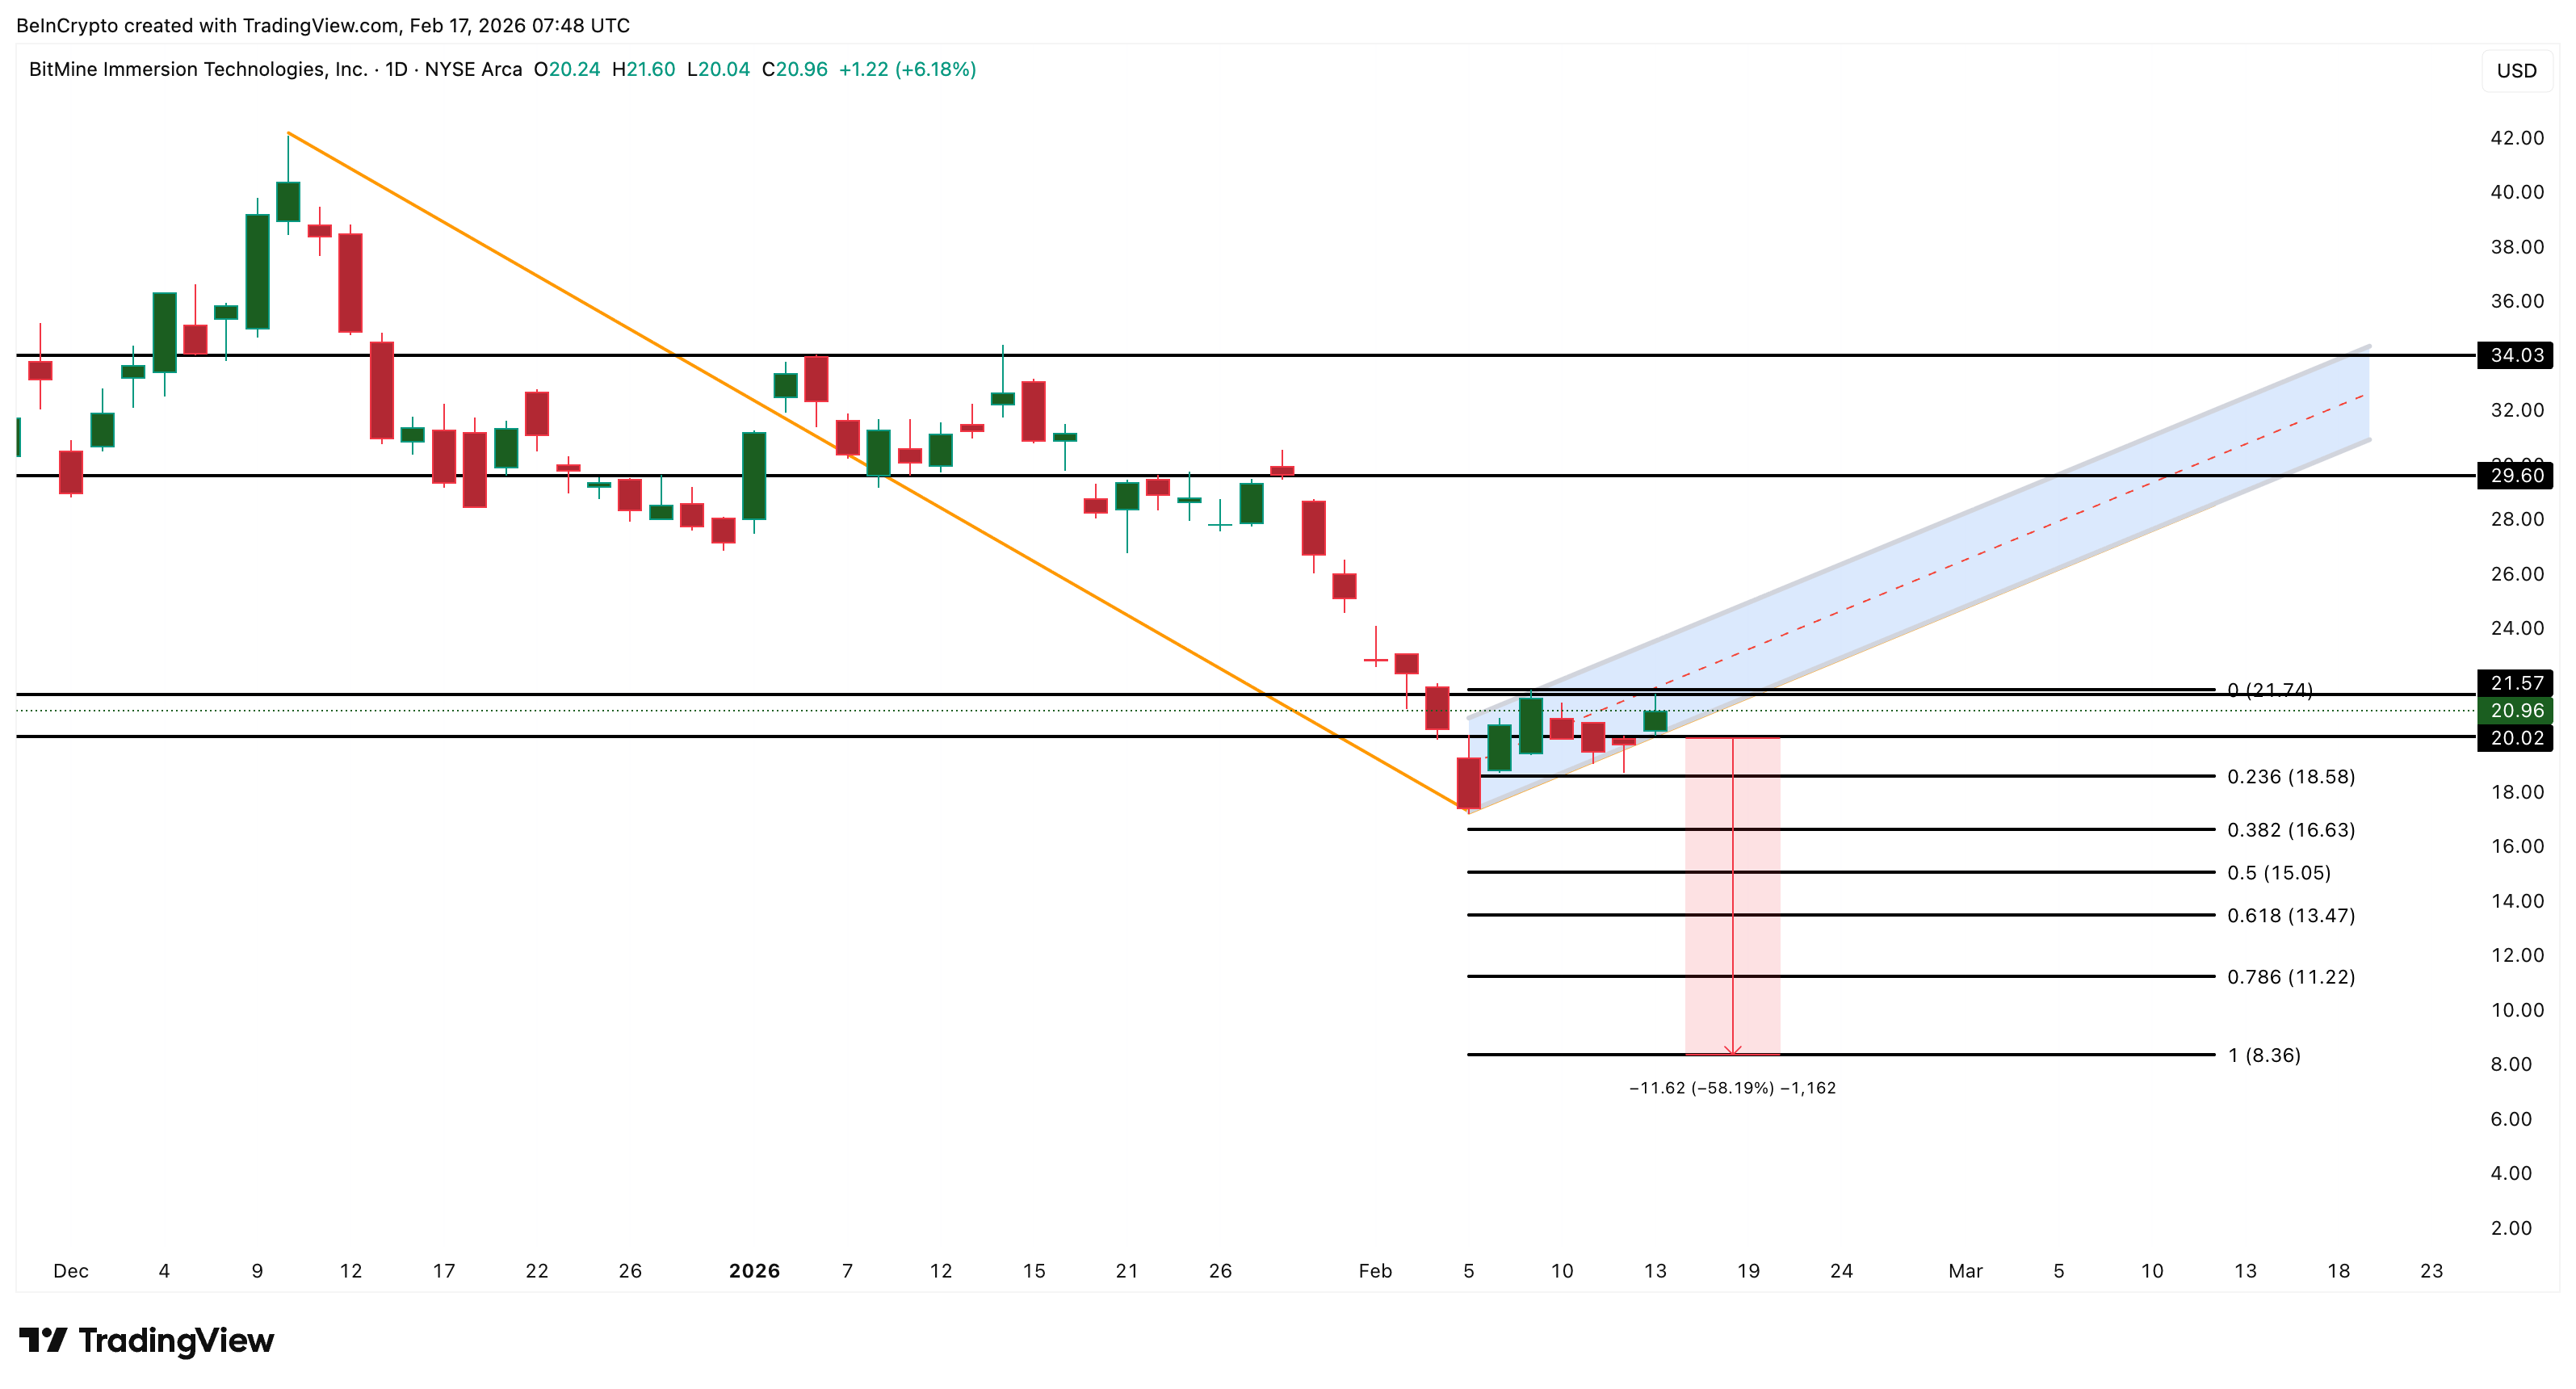
Between Dec. 10, 2025, and Feb. 5, 2026, BitMine’s stock price fell nearly 60%. This steep drop created the “pole” phase of the pattern. Since Feb. 5, the stock has rebounded about 26%, forming a bear “flag” pattern, which represents a recovery attempt.

Want more insights like this? Sign up for Editor Harsh Notariya’s Daily Crypto Newsletter here.
However, this recovery remains inside the bearish structure. Unless the stock breaks above key resistance levels, this rebound could simply be a temporary pause before another decline.
If the bear flag confirms, BitMine’s stock price could fall by nearly a 60% drop from the lower trendline breach point. This raises a critical question. If the BitMine stock price is recovering, why does the breakdown risk still remain high?
The answer becomes clearer when looking at momentum indicators.
Hidden Bearish Divergence Shows BMNR Sellers Still Maintain Control
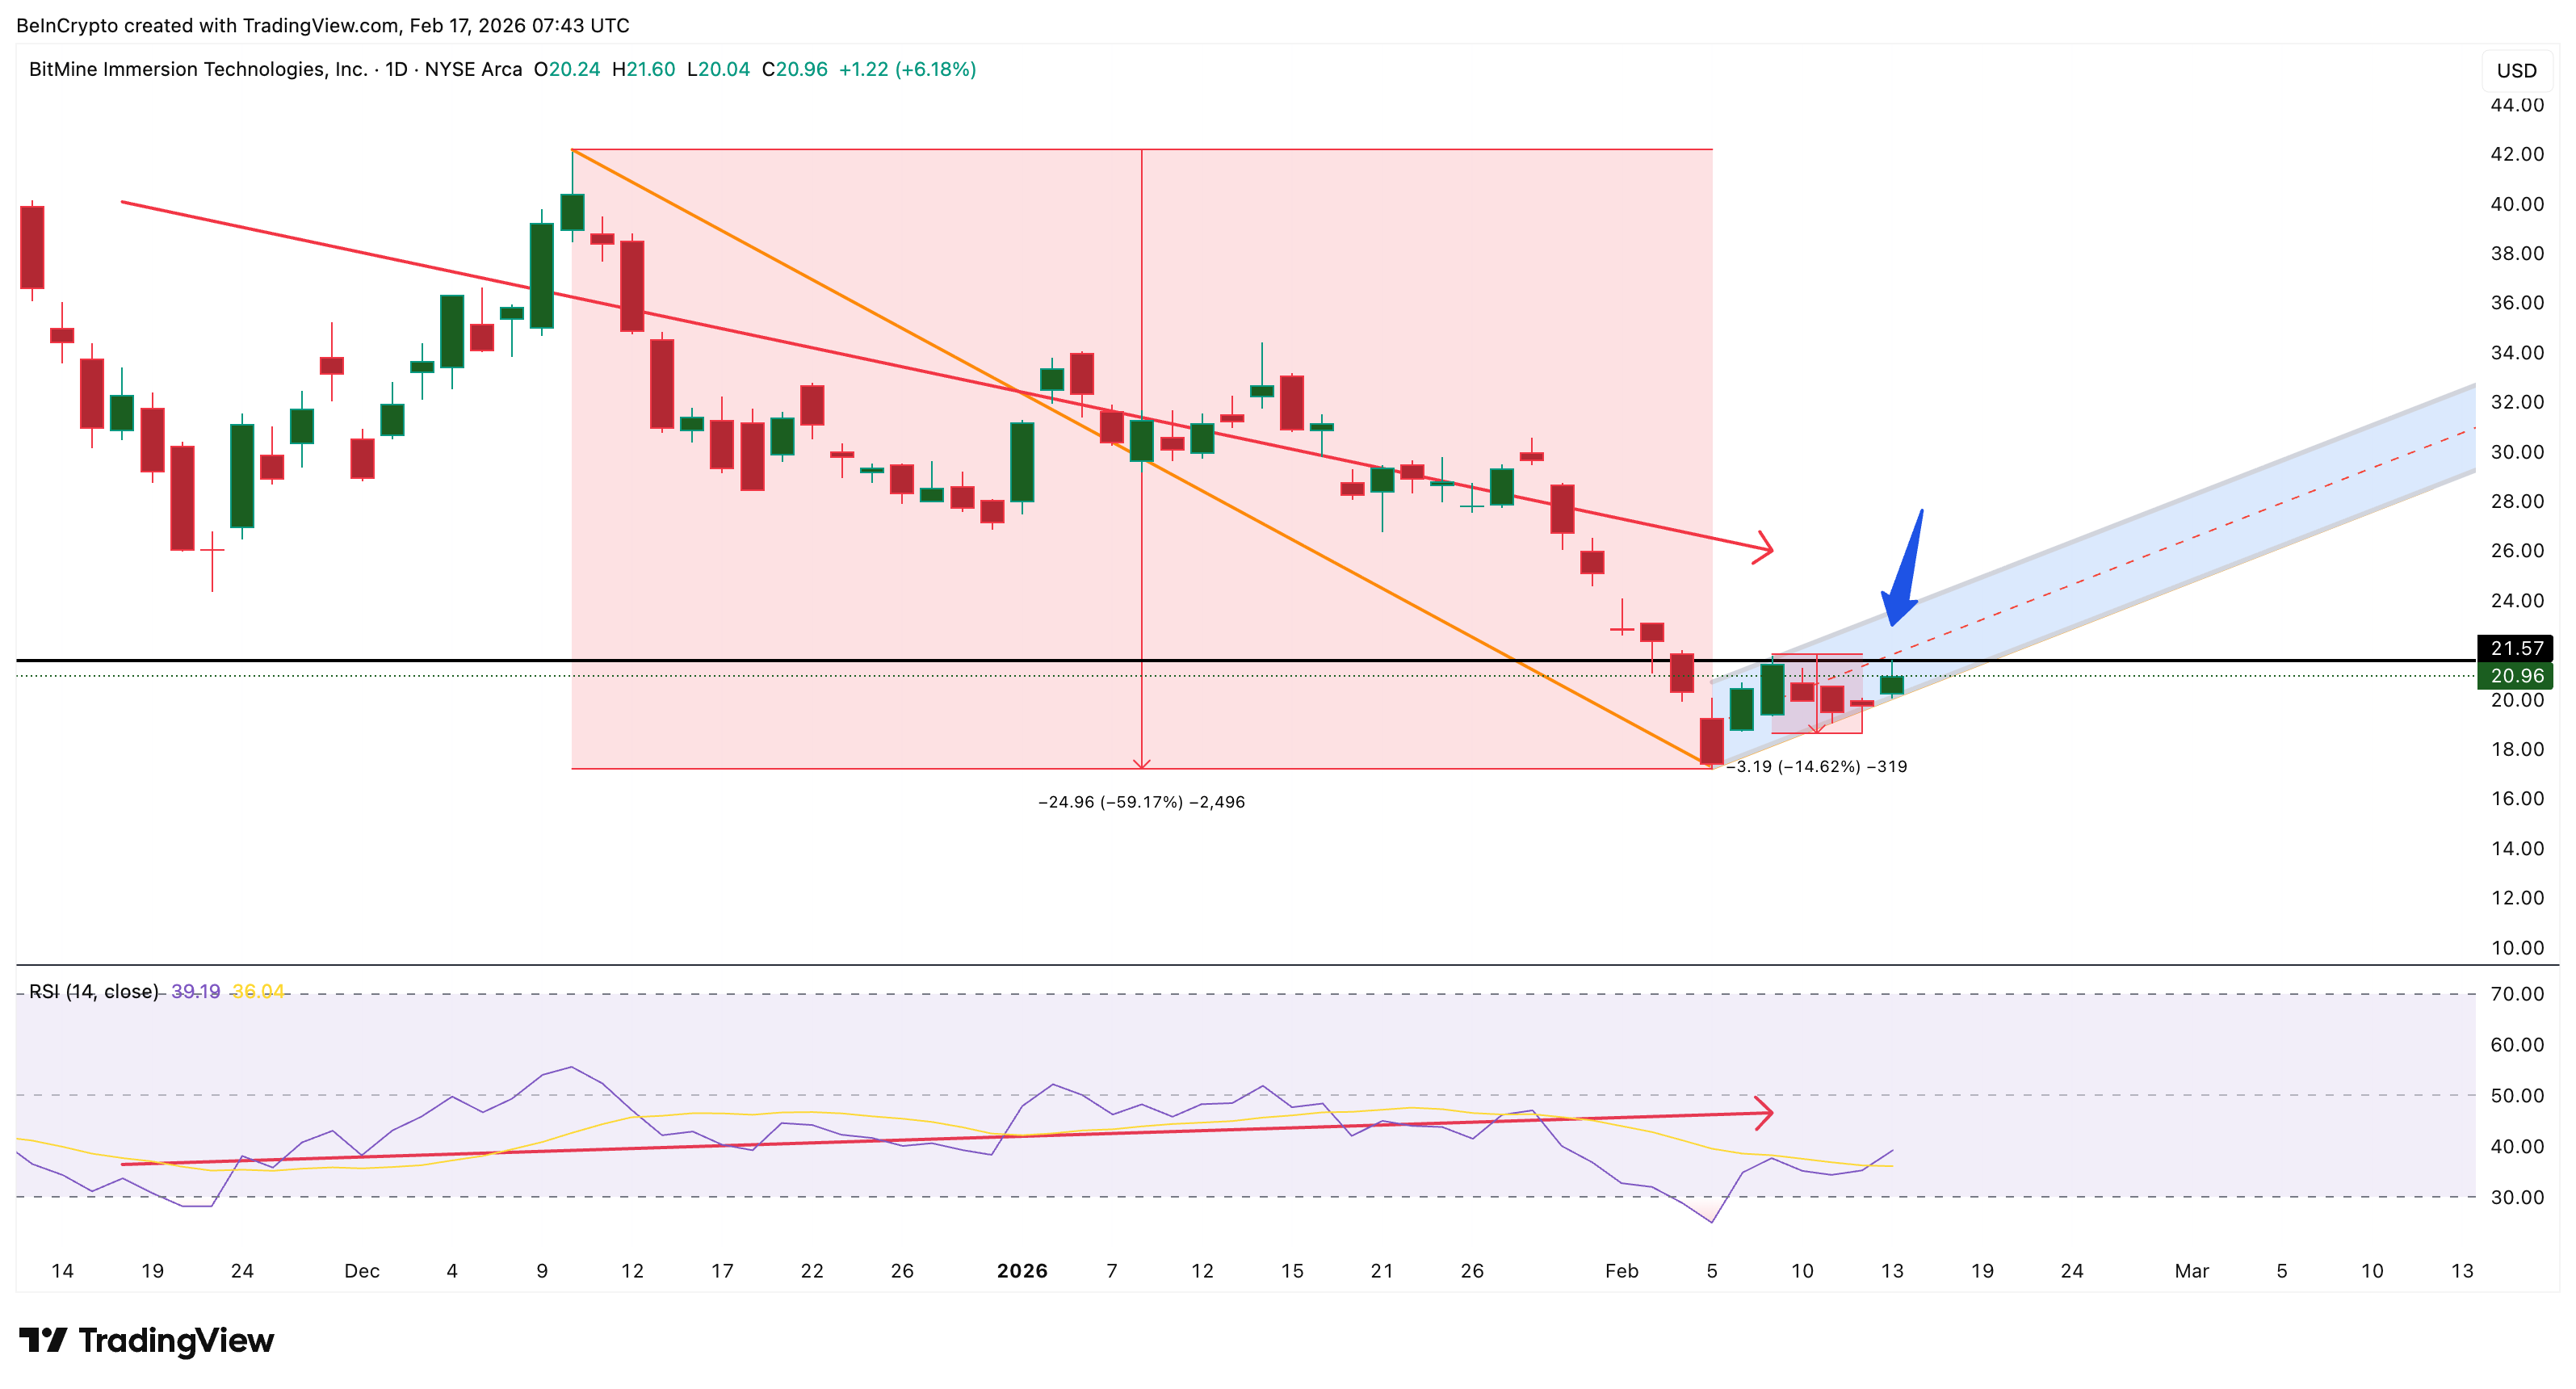
Momentum analysis using the Relative Strength Index (RSI) shows signs of underlying weakness. RSI is an indicator that measures buying and selling strength on a scale from 0 to 100. When RSI rises while price struggles, it can signal weakening buyer strength.
Sponsored
Sponsored
The BitMine stock price formed a hidden bearish divergence between Nov. 18, 2025, and Feb. 9, 2026. During this period, the price created a lower high, while RSI formed a higher high. This pattern typically signals that sellers remain in control and further downside may follow.
After this divergence appeared, BitMine’s stock price dropped by over 14%.
Now, a similar setup appears to be forming again. RSI has started rising, but the price still remains below key resistance near $21.57. If the stock fails to break above this level, another bearish divergence could confirm.
This would increase the probability of a breakdown from the bear flag pattern. However, momentum alone does not fully explain price direction. Capital flow data provides another important clue.
Capital Flow Remains Weak Despite Institutional Buying
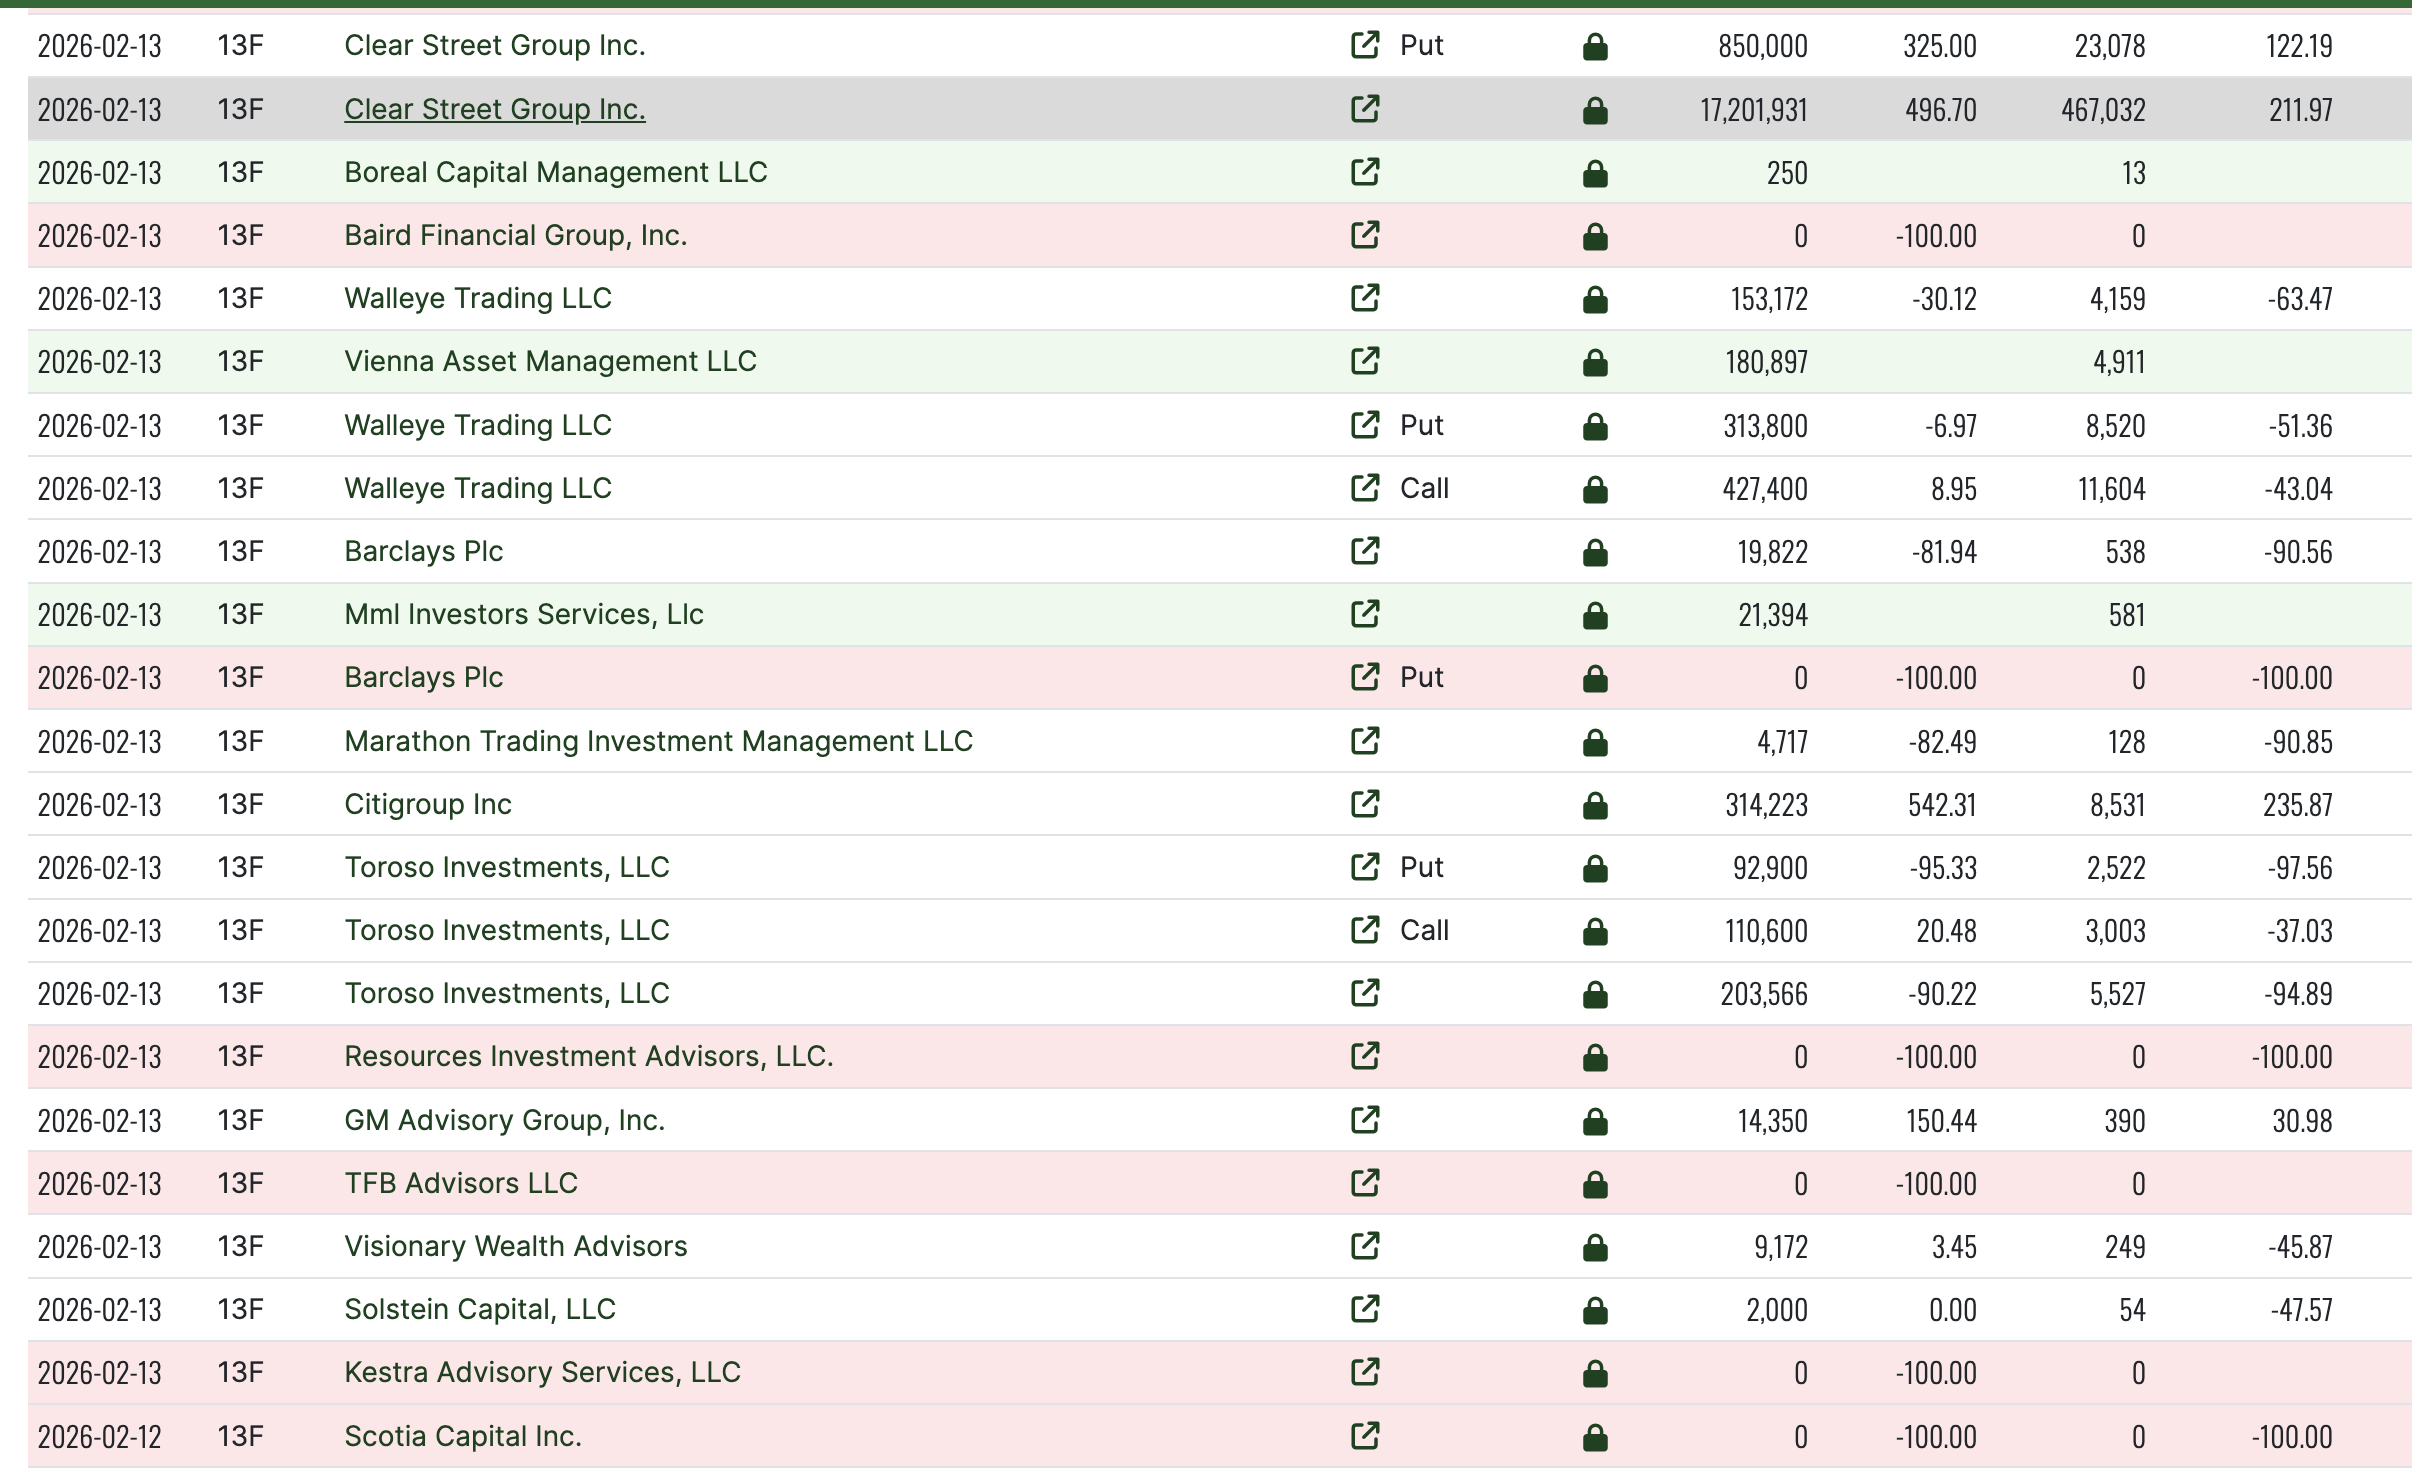
Institutional interest in BitMine has increased significantly. Citigroup raised its ownership stake by over 540%, while firms like BlackRock and BNY Mellon also expanded their exposure. Normally, such buying would support price growth.
Sponsored
Sponsored
The Fintel snapshot shows Citigroup’s addition but also highlights several BMNR dumps by firms like Baird Financial, Resources Investment Advisors, and more, which can be alarming to the price.
The Chaikin Money Flow (CMF) indicator shows a similar picture. CMF measures whether large investors are putting money into or taking money out of an asset. When CMF stays below zero, it signals that overall capital is still leaving the asset.
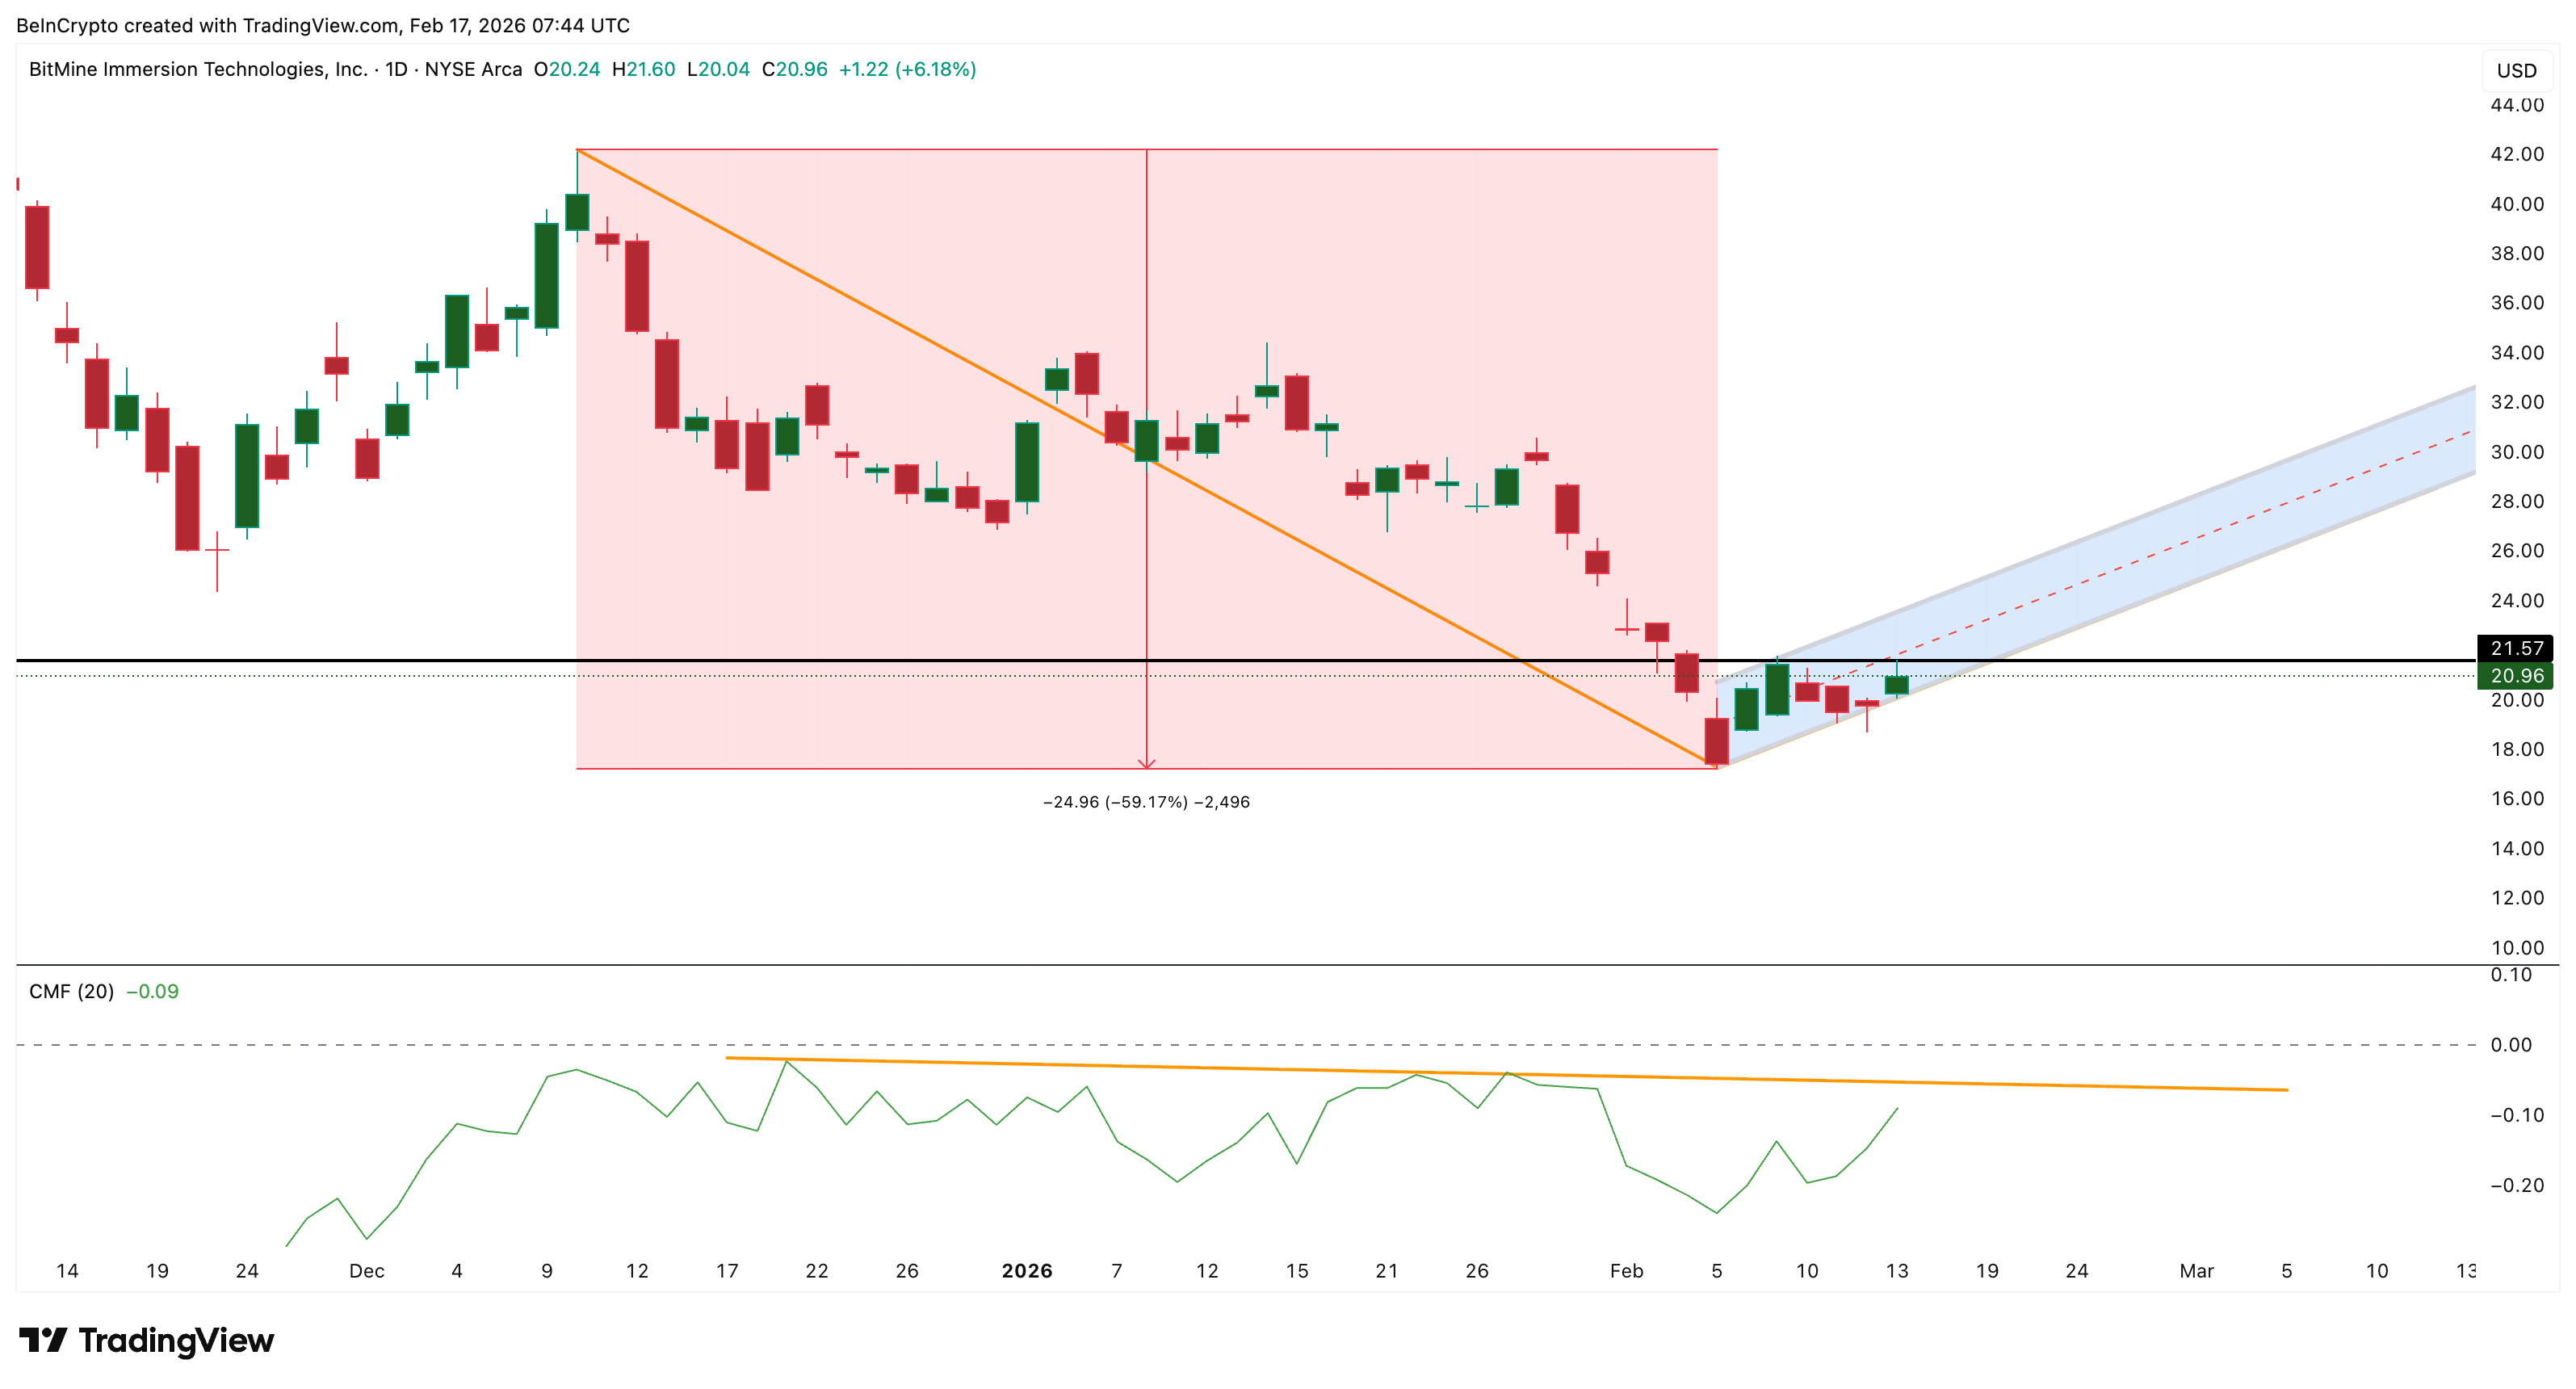
BitMine’s CMF has started rising gradually, showing that selling pressure is slowing. But the indicator remains below the zero line. This means total institutional buying has not yet fully reversed the broader selling trend. This creates a conflict. While some major firms are increasing exposure, overall, large-scale money flow remains cautious, as highlighted by the earlier snapshot.
Sponsored
Sponsored
This explains why BitMine’s stock price recovery still appears weak.
Price Levels Now Decide Whether BitMine Stock Price Recovers or Breaks Down
The BitMine stock price now sits at a critical level. If BMNR breaks above resistance between $21.57 and $21.74, the bearish structure would weaken for now. This could allow the stock to rise toward $29.60 and potentially $34.03, provided ETH also gains strength.
Such a move would confirm that buyers have regained control. However, downside risk remains significant.
If the BMNR stock price falls below the $20.02 support level, the bear flag breakdown could begin. This may push the stock toward lower support levels at $15.05 and $11.22. A full breakdown could eventually send the stock toward $8.36.
For now, BitMine’s stock price sits at a turning point. Citigroup’s aggressive accumulation shows institutional confidence. But bearish momentum and weak capital inflows still limit recovery strength.
The next few trading sessions will likely decide whether Tom Lee’s BMNR follows institutional optimism higher or confirms the bearish breakdown pattern.
You must be logged in to post a comment Login