
Crypto World
BlackRock Crypto Cuts Ethereum Staking Fee to 18%: Too Cheap to Ignore?
BlackRock crypto just moved on Ethereum staking fees, and the number is 18%. The world’s largest asset manager has set its commission on gross staking rewards at 18% inside its iShares Staked Ethereum Trust, a fresh product that launched March 12 under the ticker ETHB, layered on top of a 0.25% annual management fee.
That dual-fee structure is already attracting fire from advisors and institutional allocators who built their models around simpler cost assumptions.
The trust holds $318 million in staked ETH as of publication, with the 18% staking commission split with Coinbase as custodian and validator operator.

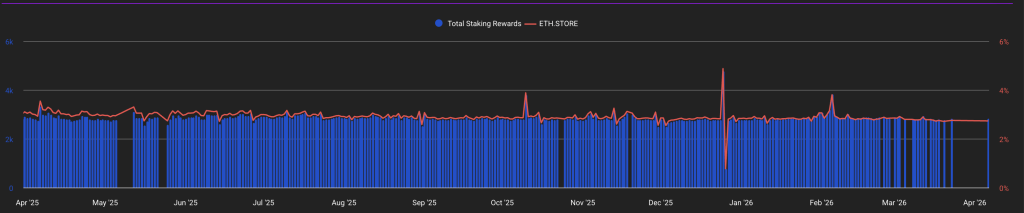
At current ETH staking yields of roughly 2.74%, that commission alone translates to approximately 49 basis points of clipped return – before the sponsor fee touches the NAV.
Discover: The best crypto to diversify your portfolio with
Will the Blackrock Ethereum Staking ETF Fee War Hit the Same Floor as Bitcoin?
Bitcoin ETF fees fell to zero in just 12 months. The largest issuers temporarily waived management fees entirely just to grab AUM, borrowing the index fund playbook and compressing margins until custody costs were practically the product.
The question now hanging over Ethereum staking ETFs is whether the same gravity applies – or whether staking complexity creates a structural floor that protects issuer margins.
The uncomfortable truth is that staking ETFs are operationally heavier than spot bitcoin products. Issuers must manage validator economics, slash risk exposure, define MEV extraction mechanics, and build reward distribution infrastructure, none of which is free.
BlackRock’s ETHB charges 0.25% on assets, the same rate as its iShares Bitcoin Trust ETF (IBIT), but the 18% staking commission is a fundamentally different fee model with no direct parallel in the bitcoin ETF market.
Fidelity’s competing staking product sits at roughly 10% on rewards – a gap that makes BlackRock look expensive by 800 basis points on the commission line alone.
Tyrone Ross, CEO of Turnqey Financial, said plainly: “To me it was always about a fee grab. It was always about the big banks and the big funds packaging this up and hitting retail investors with fees.” Ethan Buchman, co-founder of Cosmos, takes a longer view – he expects the 18% rate to compress toward 15% or even 10% as competition intensifies, mirroring bitcoin ETF erosion.
But Harriet Browning, VP of Sales at Twinstake, warned that aggressive fee compression carries a hidden cost: providers cutting corners on security and validator transparency to protect margins. Those two realities coexist, and neither cancels out the other.
Discover: The best pre-launch token sales
LiquidChain Targets Early Mover Upside
LiquidChain is a Layer 3 infrastructure project positioning itself as the cross-chain liquidity layer — fusing Bitcoin, Ethereum, and Solana liquidity into a single execution environment.
The architecture centers on four pillars: a Unified Liquidity Layer, Single-Step Execution, Verifiable Settlement, and a Deploy-Once system that lets developers access all three ecosystems without rebuilding for each chain.
The project has been gaining visibility as institutional capital flows accelerate into L3 infrastructure. The presale is currently priced at $0.01447, with $646,857.56 raised to date. Presale-stage assets carry meaningful risk — liquidity is thin and execution is unproven. That caveat stands.
But for traders mapping the next cycle’s infrastructure layer, LiquidChain.
The post BlackRock Crypto Cuts Ethereum Staking Fee to 18%: Too Cheap to Ignore? appeared first on Cryptonews.


Prediction markets are seeing steady growth in the U.S., but a wave of legal disputes and shifting competition is beginning to reshape the sector, a new report from Bank of America said.
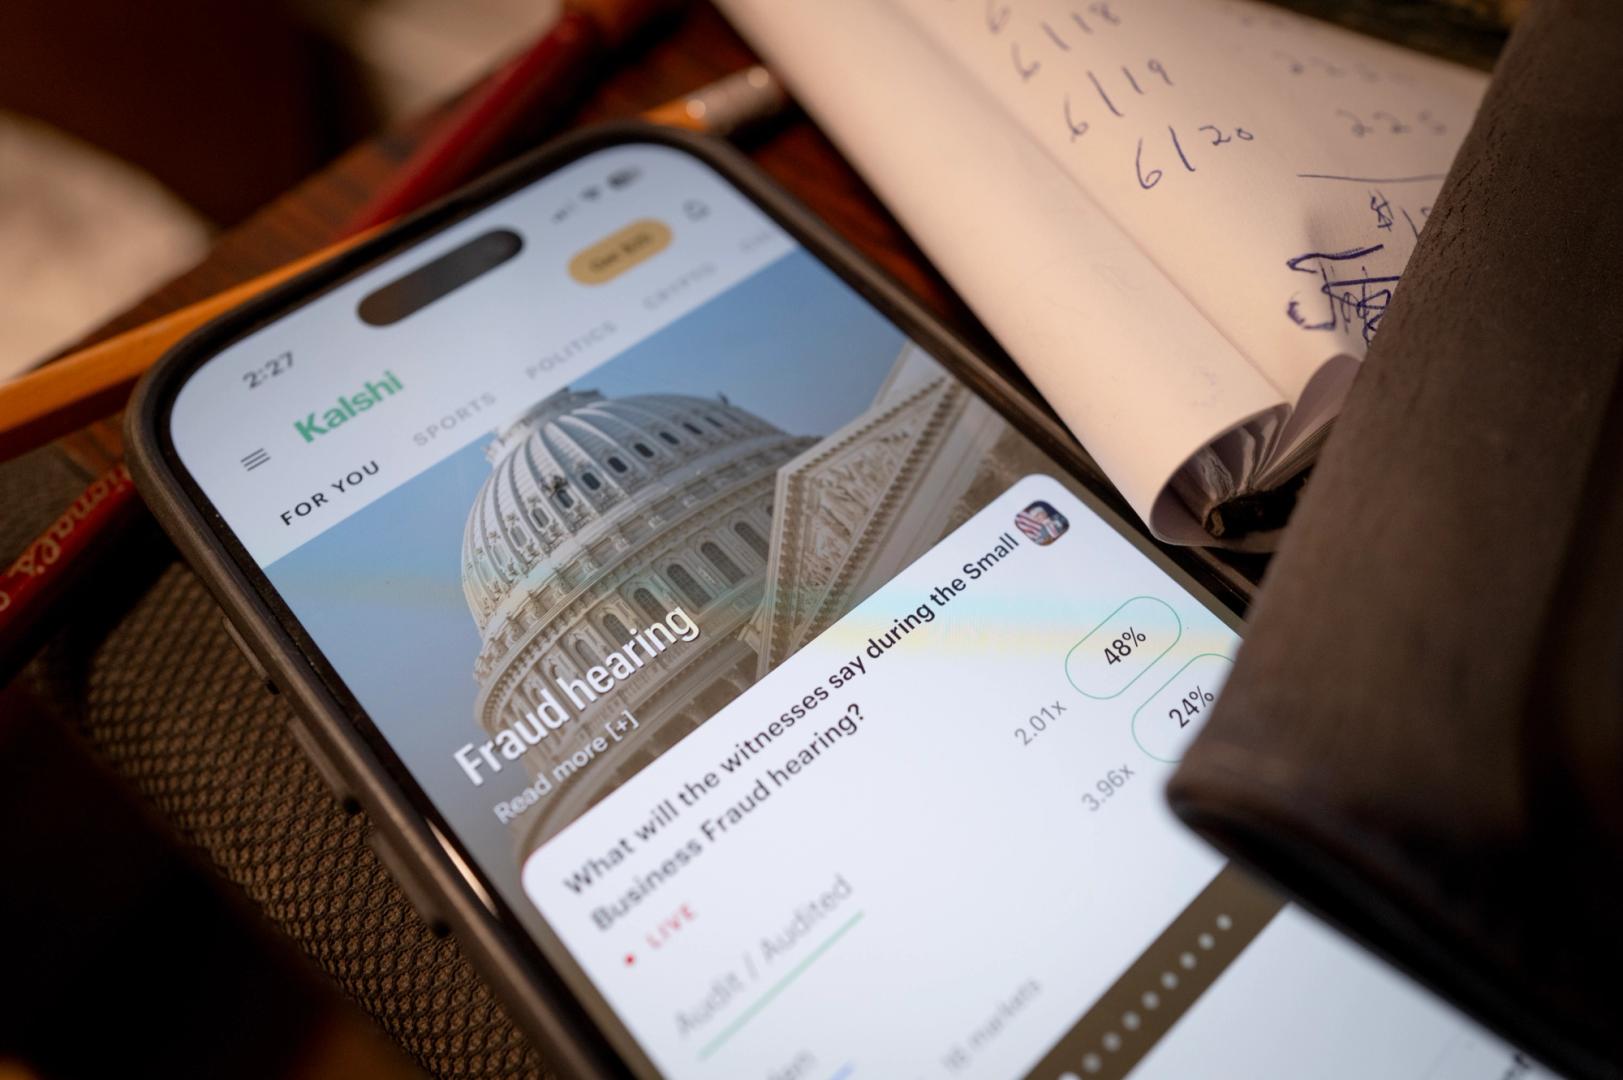
Total weekly volume rose 4% week-over-week, according to the report, with Kalshi — a federally regulated exchange — leading gains at 6%. Crypto.com posted a smaller increase, while Polymarket, a crypto-native platform that had surged in prior weeks, saw overall volumes fall 16%.
Kalshi now controls roughly 89% of measured U.S. prediction market volume, far ahead of Polymarket at 7% and Crypto.com at 4%, according to BofA estimates. The shift points to a market consolidating around platforms with clearer regulatory standing.
That divide reflects a deeper tension. At the center is whether prediction markets should be treated as financial instruments or as gambling. Kalshi operates under oversight from the Commodity Futures Trading Commission (CFTC), framing its contracts — including those tied to political or sports outcomes — as derivatives.
Polymarket runs on blockchain rails and has historically operated outside U.S. regulatory boundaries. It allows users to trade on event outcomes using crypto, often attracting global liquidity but facing restrictions domestically.
The gap is becoming more visible as regulators step in. Nevada and Massachusetts have both secured preliminary injunctions against Kalshi at the state level, while New Jersey lost an appeal that limits its ability to enforce gambling laws against the firm.
At the same time, the CFTC has taken an aggressive stance in support of prediction markets.
The agency has sued multiple states, arguing that federal law preempts state-level gambling rules. CFTC leadership has also drawn a distinction between sports betting, which it views as entertainment, and event contracts, which it classifies as financial tools for hedging risk.
The outcome of that fight could define the industry. A federal win would allow platforms like Kalshi to scale nationally under a single framework. A loss could push the market into a state-by-state model similar to online sports betting, slowing growth.
Crypto firms are still trying to carve out a role. Polymarket remains one of the largest global platforms and has drawn attention during major events like elections, where trading volumes can spike sharply. Meanwhile, companies like Crypto.com and Coinbase (COIN) are experimenting with prediction market-style products, signaling broader interest from centralized exchanges. The largest crypto exchange in the world, Binance, announced Thursday that it added a prediction markets feature to Binance Wallet.
Even traditional gaming firms are adjusting. FanDuel recently shut down parts of its fantasy sports offerings, a move Bank of America links in part to the rise of prediction markets. The shift suggests users may be moving toward products that resemble trading more than betting.
Ether’s (ETH) recent sell-off was stopped at $1,800, as bulls aggressively defended the level. Ether’s rebound above $2,100, along with on-chain and technical data, suggests that traders will hold the price above $2,000 for the short-term.
Key takeaways:
-
Ether’s profitability metrics drop to levels that have historically marked local bottoms.
-
The MVRV Z-score and pricing bands suggest ETH price drop to $1,800 was the bottom.
-
ETH price bounced off a multi-year trendline that has marked previous macro lows.
Ether traders realize losses
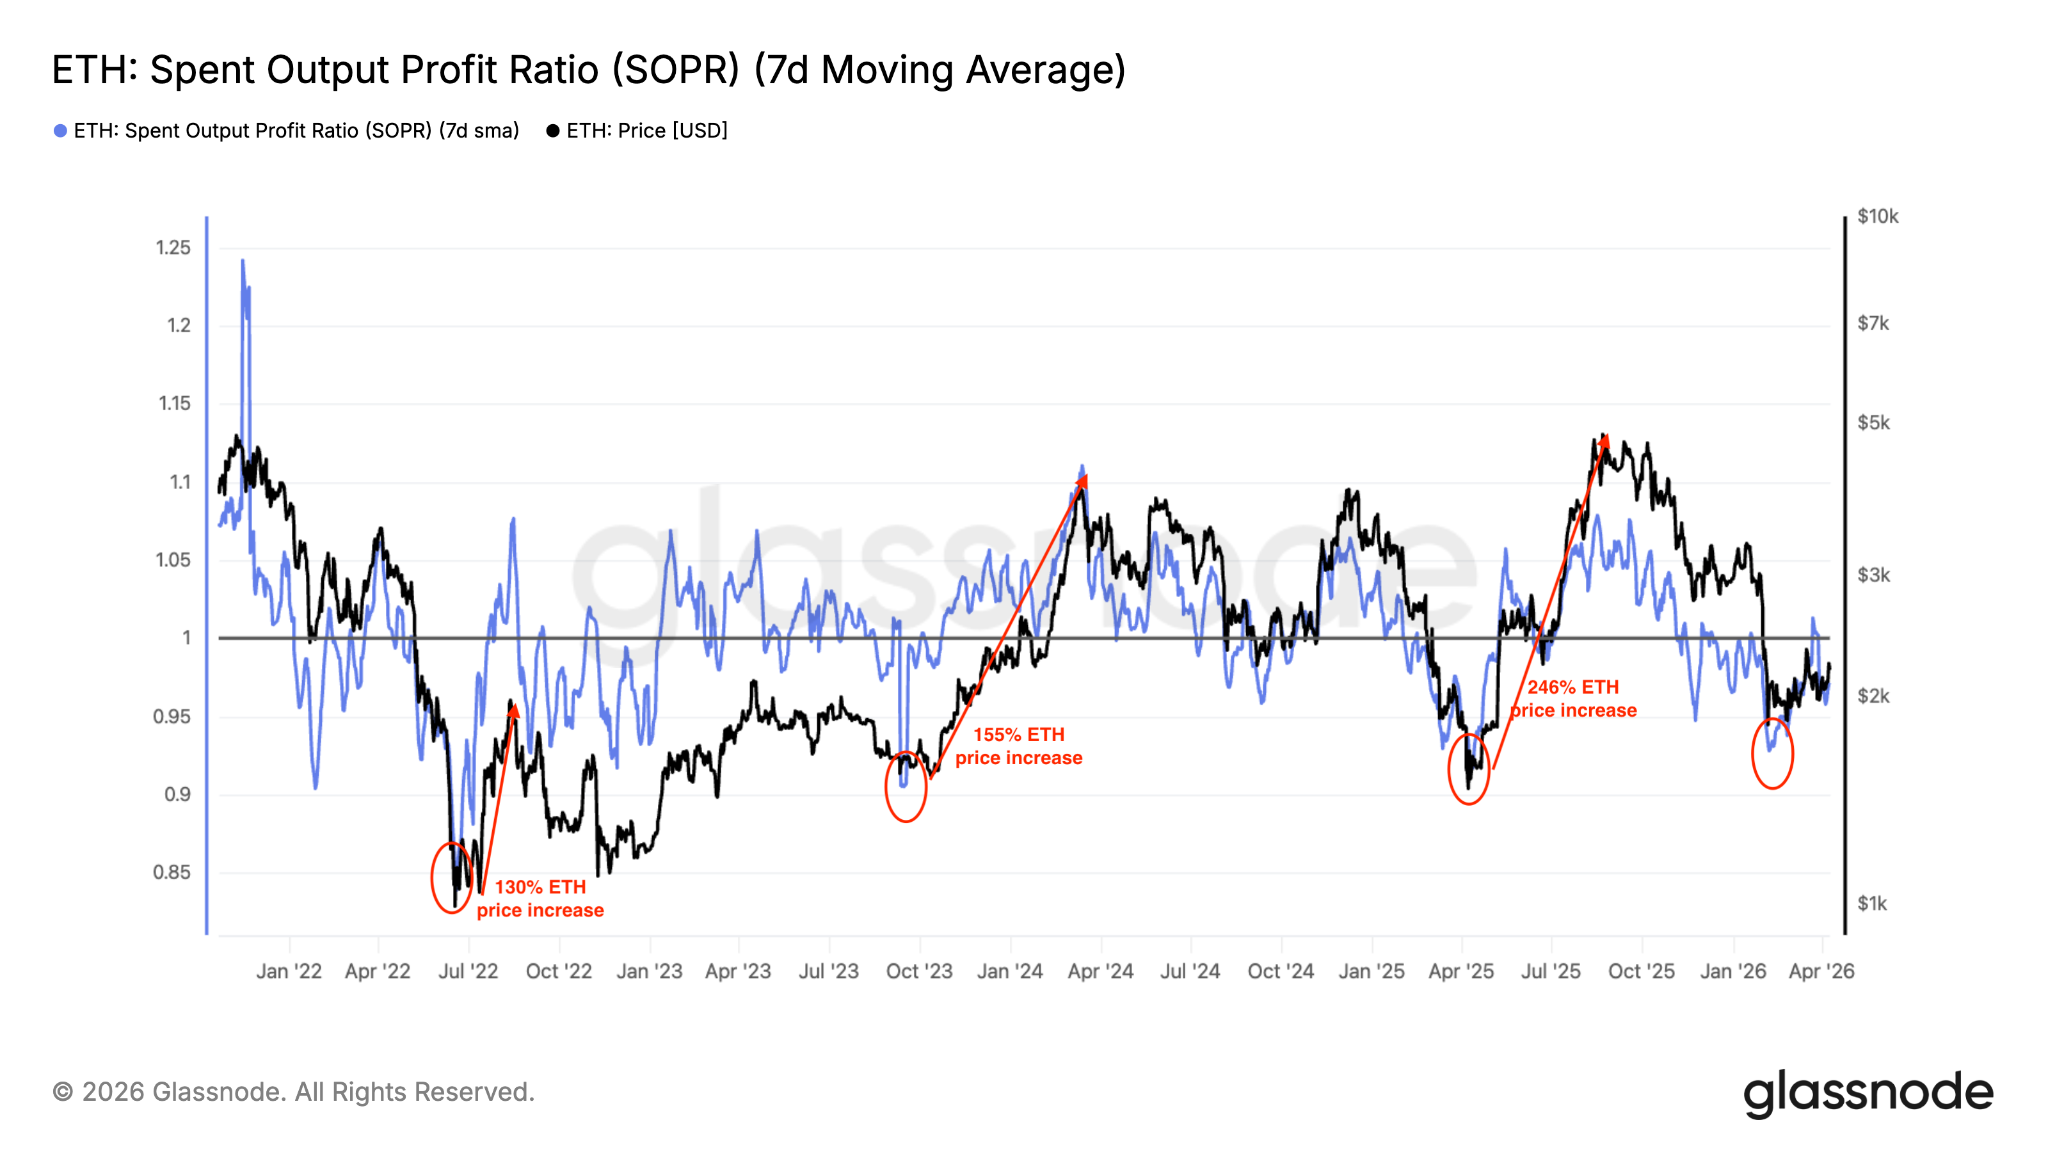
Onchain data shows that Ether’s Spent Output Profit Ratio (SOPR) is at 0.96, suggesting ETH investors are still selling at a loss.
This metric dropped as low as 0.92 on Feb. 6, implying that Ether’s price drop to $1,800 was driven by traders realizing losses amid panic and extreme fear.
Related: Ethereum stablecoin supply hits $180B all-time high: Token Terminal
SOPR measures the profit or loss of spent ETH outputs by comparing the value of coins when they were last moved to their value when they are spent again.
A value below 1 might suggest capitulation or a market bottom, potentially signaling a good time to buy.

Historically, this scenario has often preceded price recoveries. When SOPR fell to 0.86 following Ether’s drop to $1,500 in April, it was followed by a 246% price recovery to its current all-time high of $4,950.
Similar scenarios in 2022 and 2023 were followed by 130% and $155% ETH price rallies, respectively.
As such, some investors saw the drop to $3,000 as an opportunity to buy.
MVRV Z-Score suggests Ether bottomed at $1,800
Ether’s MVRV Z-Score, a key onchain metric used to identify market tops and bottoms, has dropped into the historical accumulation zone (the green line in the chart below), strengthening the argument that ETH may have found a bottom.

The last time Ether’s MVRV Z-score fell to the current levels was in April 2025, after a 66% price drawdown. This coincided with a macro market bottom at $1,400 and preceded a multi-month rally, with the ETH/USD pair rising 258% to its current all-time high of $4,950.
Meanwhile, the 0.80 MVRV pricing band, which has historically marked cycle bottoms, is currently at $1,880.

This indicates that, from an onchain perspective, Ether is undervalued and may continue the ongoing recovery, potentially rising toward dense liquidity clusters between $2,400 and $2,600 in the short term.
ETH price sits on strong support above $1,800
Data from TradingView shows that ETH price has successfully held above a key support zone over the last two months, as illustrated in the chart below.
This is the area around $1,800, where investors acquired more than 1.35 million ETH, according to Glassnode’s cost basis distribution heatmap.

This level aligns with a multi-year trendline that has historically marked the bottom for ETH/USD, as seen in 2022 and in April 2025.

Ether’s rebound from this level in early February suggests the trendline still holds as support, paving the way for a sustained recovery toward $4,800.
As Cointelegraph reported, a drop below $2,000, where the 20-day EMA and the 50-day SMA converge, could see the price drop toward the next major support at $1,750.
This article is produced in accordance with Cointelegraph’s Editorial Policy and is intended for informational purposes only. It does not constitute investment advice or recommendations. All investments and trades carry risk; readers are encouraged to conduct independent research before making any decisions. Cointelegraph makes no guarantees regarding the accuracy or completeness of the information presented, including forward-looking statements, and will not be liable for any loss or damage arising from reliance on this content.

Gunzilla Games, the developer behind NFT-incorporating battle royale game Off The Grid, has allegedly stopped paying staff as the shooter struggles to maintain its player base.
As reported by Insider Gaming, a number of Gunzilla employees have taken to LinkedIn to detail the state of affairs at the company.
The firm’s Talent Acquisition Lead, Anna Savina, claimed that employees had gone months without receiving their salary, and alleged that Gunzilla execs were ignoring requests for payment.
“I dedicated three years of my professional life to Gunzilla Games. I built teams, found top talent, and lived the company’s mission 24/7. Today, I’m forced to face a significant outstanding debt that covers several months of my professional life,” Savina said.
Read more: Otherside got $450M from Yuga Labs but its latest game is ‘virtually unplayable’
She now claims her “personal matter” has been resolved.
Anton Pali, a senior QA engineer, claimed that he’s gone five months without a paycheck from Gunzilla, and that the company’s CEO, Vlad Korolev, backtracked on promises to pay him in full.
Meanwhile, retired VFX animator Paul Creamer claimed, “Gunzilla Games has not paid its employees for many months but still expects them to work,” adding that he hasn’t been paid since October 2025 with some waiting even longer.
Creamer also claimed that in December, Korolev called his department to inform them that salaries would be paid, the firm is profitable, and that they should keep quiet about salaries.
He said, “He was not being truthful and now the company ignores our questions and removes our posts about what’s going on trying to silence us. Silence is what they’re hoping for, wishing that we’ll just quietly go away.”
It’s not just pay, either. Former biome artist Théa Dorangeon claims they were mistreated by former colleagues, and that the game’s artistic guidelines lacked clarity and drove artists “crazy.”
These are just a few of the upset employees who’ve taken to LinkedIn to air their grievances over delayed payments.
Gunzilla Games CEO defends salary delays
In response to the slew of allegations, Korolev admitted that the salaries have been delayed while also claiming that this was necessary for the company’s success. He described the salary revelations as “a new narrative from haters.”
He posted, “Yes, we are optimizing costs — like every company in gaming, crypto, and tech is doing right now. We have been doing this for over a year.”
“And yes, to not disrupt company operations, some payments may be scheduled in a way that works for the company’s cash flow — not always for everyone individually. That’s the reality of the world we live in.”
He went on, “But to protect the interests of our players and our full-time official employees — whose salaries, over six years, have never been delayed by more than a week — we operate at a pace that ensures the company continues moving forward.”
Read more: CZ cries FUD as anti-Binance posts flood X
“And of course, we honor every obligation. We apologize for any inconvenience this may have caused,” he said.
These explanations were buried near the end of his post, while the majority of his address was used to brag about player counts, subscriber numbers, and game updates.
Oddly, he offered a live dashboard for “those still spreading FUD” to see new players joining, but added that it would cost the viewer 100,000 GUNZ tokens to access.
The GUNZ token, which is utilized in Off The Grid’s in-game economy, is down almost 86% since its launch last year and at its current price, it would cost the viewer $1,649 to check this dashboard.
Off The Grid’s developer isn’t off the hook.
Some of the disgruntled workers are now trying to recover compensation through the European Union’s legal framework.
Vladyslav Spitkovskyi, Gunzilla’s senior game programmer, claims he hasn’t been paid since December 2025, and is now pursuing compensation in court.
He said, “The legal process for recovering unpaid compensation in the EU is well-defined, and the costs are relatively modest compared to what is owed.”
Savina also noted that she was undertaking formal steps within the EU legal framework.
Off The Grid was launched in 2024 and was one of the more mainstream video games to incorporate blockchain technology into its game store.
Read more: ‘Biggest NFT trading platform on TRON,’ AINFT, has $6 in volume
The game launched with a decent amount of player traction.
By 2025, publications reported it had 450,000 daily active players. However, this statistic was just active addresses holding its GUNZ token, and not a metric for actual players.
It initially struggled with a litany of optimization issues for console players, and reviews for the game have been less than stellar. On Steam, it now pulls in roughly 12,000 players a day.
In March 2025, Gunzilla acquired video game news outlet Game Informer after it was shut down by GameStop in 2024. All of its old staff were rehired in the process.
Off The Grid testers say they were paid inconsistently
Former Blockworks journalist Kate Irwin also shared this week that Off The Grid game testers told her that they weren’t being paid, or received incredibly late payments, for their work.
“On Glassdoor, you can also see reports of delayed payments going back years from people who say they worked at Gunzilla as full-time employees, not as contractors or freelancers,” Irwin added.
The testers told Irwin that there were at least 700 of them, and some suffered delayed payments. They claimed there was inconsistency across the wages of testers, while some said they were simply happy to be paid during the Ukraine-Russia war.
Irwin noted, however, that a third-party intermediary in charge of the payments may have been the problem, and not necessarily Gunzilla.
Protos has reached out to Game Informer and Gunzilla for comment and will update this piece should we hear anything back.
Got a tip? Send us an email securely via Protos Leaks. For more informed news and investigations, follow us on X, Bluesky, and Google News, or subscribe to our YouTube channel.

Former Crypto Czar David Sacks and CFTC Chair Michael Selig both called on the Senate to pass the Digital Asset Market Clarity Act (CLARITY Act) on Wednesday, April 9.
The posts arrived four days before the Senate returns from its Easter recess on April 13, with a Banking Committee markup targeted for late April.
Coordinated Pressure Before the Senate Reconvenes
Sacks, who recently concluded his role as White House AI and crypto czar, posted that the GENIUS Act had already established US leadership on stablecoins.
He argued the CLARITY Act would extend that to all other digital assets by providing clear regulatory rules.
“…the time to act is now. Senate Banking and then the full Senate should pass the market structure. I’m confident that they will. And then President Trump will sign this landmark bill into law,” Sacks emphasized.
Minutes earlier, Treasury Secretary Scott Bessent had called on the Senate Banking Committee to hold a markup and send the bill to the president’s desk.
CFTC chair Michael Selig also endorsed Bessent’s call and stated that he and Securities and Exchange Commission (SEC) Chair Paul Atkins are prepared to implement the legislation.
According to Selig, the bill is a way to protect digital asset markets from future regulatory reversals under a different administration.
In the same tone, SEC’s Paul Atkins urges Congress to future-proof against rogue regulators and advance comprehensive market structure legislation to President Trump’s desk.
“Project Crypto is designed so once Congress acts, SEC and CFTC are ready to implement the CLARITY Act,” wrote Atkins.
Late-April Window Carries High Stakes
Senator Cynthia Lummis confirmed the Banking Committee will attempt a markup in the second half of April.
Senator Bernie Moreno has warned that if the bill does not pass by May, digital asset legislation could stall until after the November 2026 midterms.
The CLARITY Act passed the House 294-134 in July 2025. The Senate Agriculture Committee advanced its portion in January 2026.
However, the Banking Committee has postponed its markup twice, first in January over stablecoin yield disputes and again in March.
Wednesday’s coordinated messaging from four senior administration-aligned figures suggests the White House is applying maximum pressure as the Senate’s final realistic window opens next week.
The post Trump’s Inner Circle Rallies Behind CLARITY Act Days Before Senate Returns appeared first on BeInCrypto.
Crypto World
U.S. Treasury to loop in crypto sector on hacker warnings shared with traditional firms

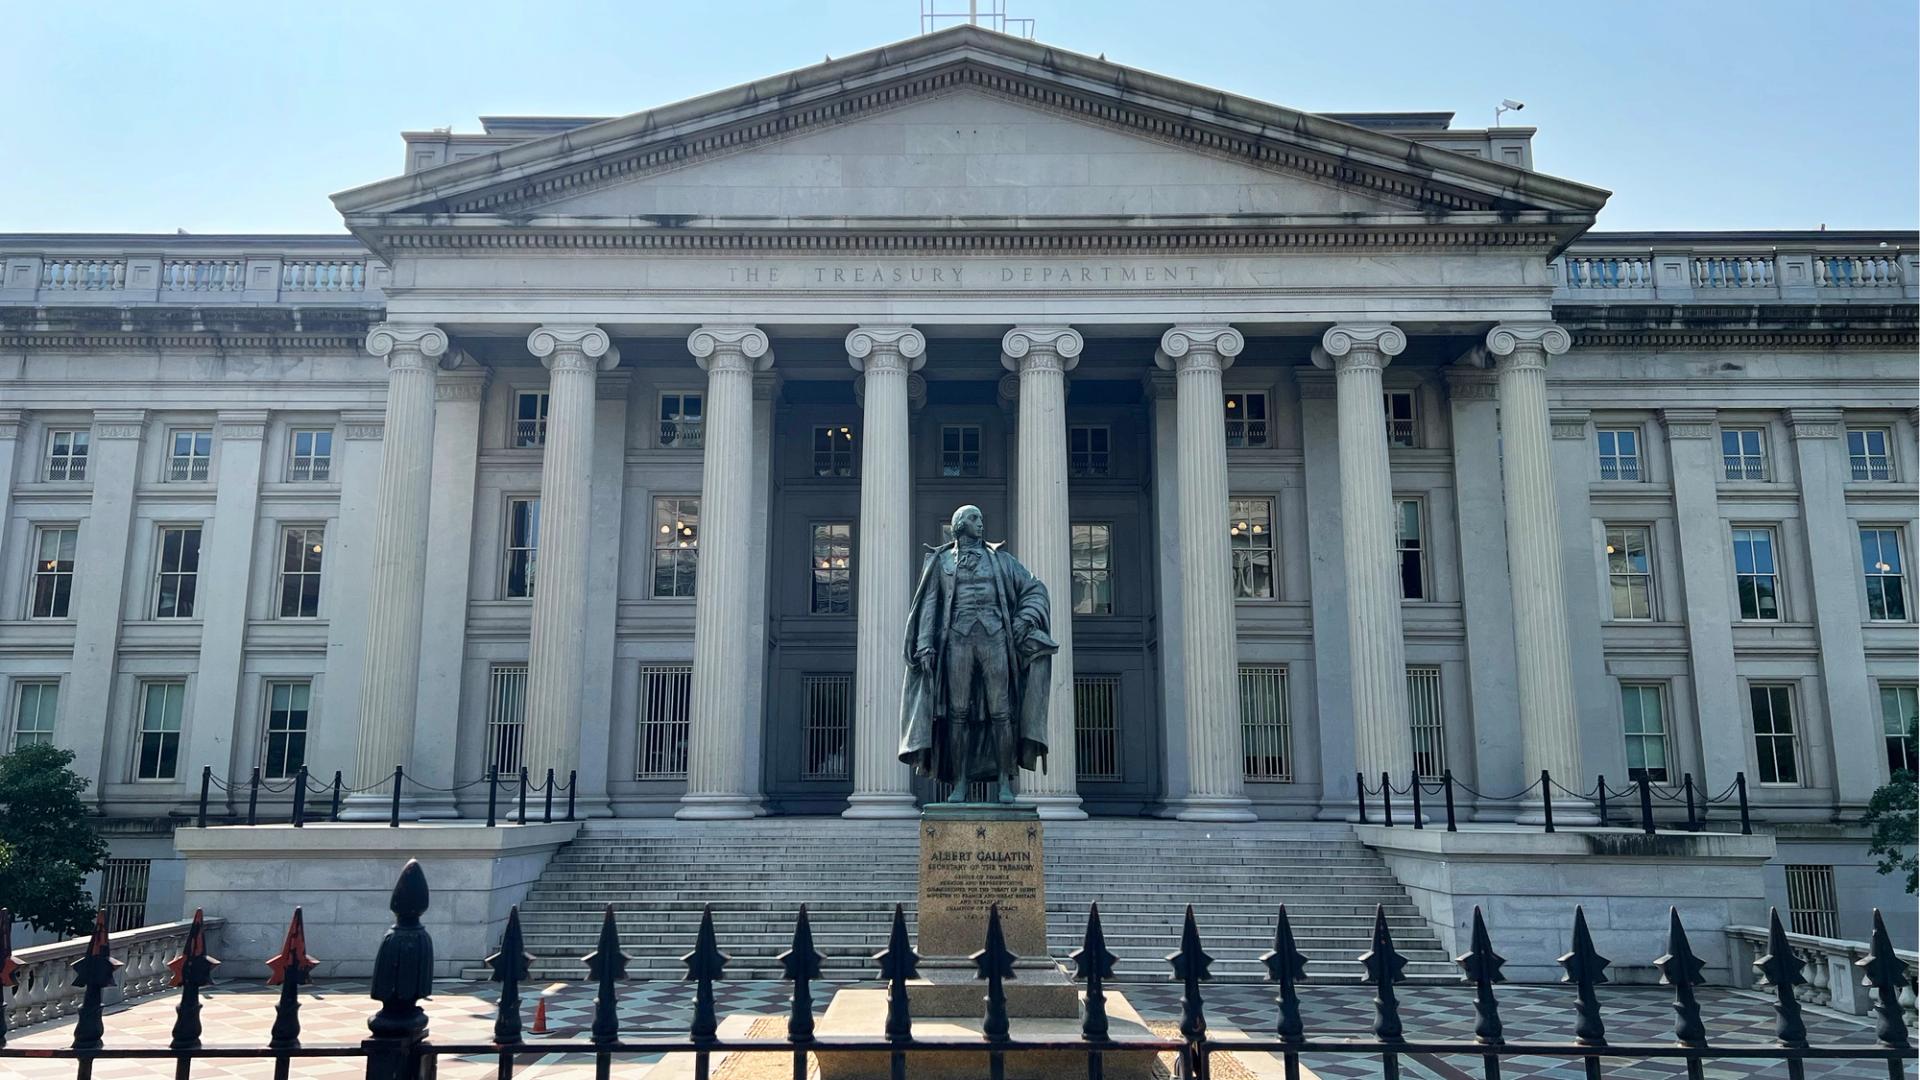
The U.S. Department of the Treasury is opening its cybersecurity information sharing to crypto businesses to help them ward off attacks as the industry becomes an increasingly important arm of the financial system, according to a Thursday statement.
Eligible crypto firms and organizations — a status not yet clearly defined in the announcement — can sign on for the same service enjoyed by traditional financial institutions. The Treasury’s Office of Cybersecurity and Critical Infrastructure Protection will include them on “timely, actionable cybersecurity information,” and encouraged interested companies to reach out to that office if they’re interested in the free service.
The move responds to an earlier recommendation from the President’s Working Group on Digital Asset Markets, which issued a report last year that included several information-sharing ideas on cyber-attack dangers.
“By extending access to the same high-quality cybersecurity information used by traditional financial institutions, Treasury is helping promote a more secure and responsible digital asset ecosystem,” said Luke Pettit, assistant secretary for financial institutions, in a statement.
The digital assets sector has been plagued since its earliest days by malicious hacks. Hardly a month goes by without a noteworthy cyber assault draining significant funds or data from crypto operations. North Korean-linked hackers stole over $280 million from decentralized platform Drift last week. Just this week, recent incidents spurred the Solana Foundation to pursue new security measures to prevent exploits.
Billions of dollars in assets are stolen each year, often by hacker groups sponsored by nations such as North Korea. Digital security has remained one of the points of concern for U.S. lawmakers weighing legislation that would bring the crypto sector into the regulated financial system.
Read More: U.S. DOJ Pursues North Korea’s Illicit Money Machine, Seizes More Crypto
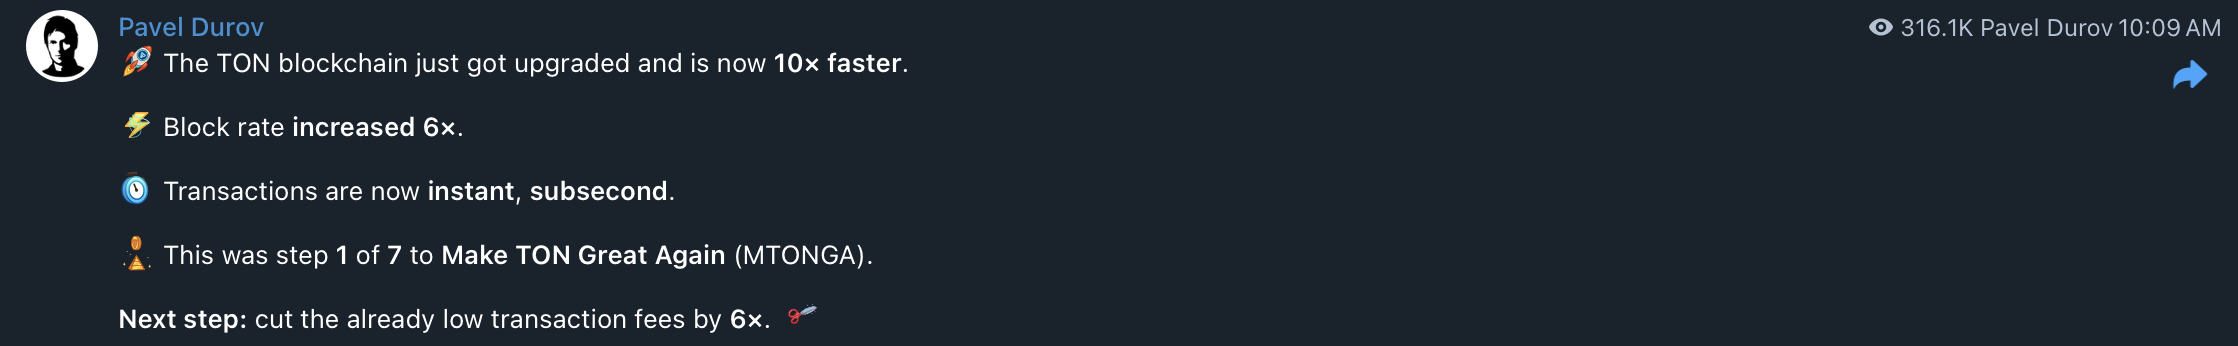
The Open Network (TON), an independent layer-1 blockchain that has integrations with the Telegram messaging application, said it has slashed block times to 400 milliseconds with the release of its Catchain 2.0 consensus upgrade.
Payment transactions now settle in about 1 second, while trades settle in “real time,” and decentralized applications will now operate at speeds comparable to traditional apps, according to TON’s announcement on Thursday.
Faster block times produce more validator rewards, as the number of blocks added to the chain increases. TON’s annual inflation is projected to increase six-fold, to 3.6% from about 0.6% following the update, TON said. Inflation represents the continuing minting and burning of Toncoin within its ecosystem.

“More blocks mean more validator rewards, which create stronger staking incentives and bring more TON into the network,” according to TON’s announcement.
The update builds on TON’s Catchain consensus algorithm, first proposed in 2020, and brings near-instant settlement to the blockchain network integrated into an application with more than 1 billion users worldwide.
TON was trading up 2.3% to $1.28 at last look on Thursday, data from CoinMarketCap showed. Volume was $130.1 million, up more than 35%. The token’s market cap was $3.17 billion.

Related: Dynamic adds embedded wallet infrastructure to TON for Telegram apps
Telegram provides users with a lifeline to communicate and send crypto worldwide
Pavel Durov, the co-founder of Telegram, said that despite government bans in Iran and Russia, significant numbers of people in both countries still use the application.
Telegram bans have backfired, as users circumvent national firewalls and state-imposed online restrictions by using virtual private networks (VPNs), which mask IP addresses, allowing users to bypass banned content online.
“The government hoped for mass adoption of its surveillance messaging apps, but got mass adoption of VPNs instead,” Durov said.

The integration with TON enables Telegram users to send crypto payments directly within the messaging application to other users, including businesses.
In February, the in-app crypto wallet in Telegram introduced self-custodial vaults that allow users to earn yield on Bitcoin (BTC), Tether’s USDt stablecoin (USDT) and Ether (ETH).
Earlier this month, the wallet launched perpetual futures trading for users directly in the Telegram application.
The integration was launched with perpetual decentralized exchange Lighter, and supports perpetual futures trading across multiple asset classes, including crypto, equities, commodities, precious metals and energy.
Magazine: As Ethereum phishing gets harder, drainers move to TON and Bitcoin

Disclosure: This article does not represent investment advice. The content and materials featured on this page are for educational purposes only.
Zcash and Avalanche show steady gains as investors eye faster-moving opportunities like BlockDAG.
Summary
- Zcash gains 6% toward $257 while Avalanche advances RWA strategy amid steady crypto market growth
- BlockDAG (BDAG) surges with rapid growth, drawing attention as a high-momentum contender in 2026
- Investors eye BDAG entry levels as strong demand and price momentum fuel market interest
The recent market trends show that the Zcash price has climbed 6% toward the $257 liquidity zone, showing steady momentum for privacy-focused investors. At the same time, Avalanche crypto continues to focus on institutional deals and real-world assets to maintain its market standing. While these traditional coins show steady growth, BlockDAG (BDAG) is moving at a much faster pace, offering a rare opportunity that outshines the rest.

With its $300 million market cap already secured and a recent $0.4 surge on CoinMarketCap, BlockDAG is building massive trust as the next market leader. The current $0.0000061 price is offering a final window for a potential 95x ROI.
Plus, with the project already tradable on LBank, BitMart, Coinstore, Biconomi, Acendex, etc., soon, this is the absolute last call to secure coins before the price explodes, making BlockDAG one of the top crypto gainers today.
Zcash price rises 6% past $250 resistance
The Zcash price recently jumped by over 6%, moving past the $250 price level. On April 6, it reached around $254.70 as more people started trading the coin. This increase happened alongside a general rise in the digital money market. Right now, the total value of all Zcash in the world is about $4.22 billion. Many people use this coin because it helps keep their transaction details private and safe.
Experts are watching a specific area near $257. If the Zcash price stays above $250, it might climb even higher toward $270. However, there is a risk that the price could drop again. If buyers decide to sell their coins to take a profit at $257, the price might fall back down to $240, which could make investors nervous about its future growth..
Avalanche crypto launches multi-chain subnet upgrades
Avalanche crypto is currently focused on bringing large financial companies onto its network. It uses a fast system that helps banks and businesses handle digital assets and official tasks like shareholder voting. Because of this, the value of real-world assets on the network is expected to hit $2.1 billion very soon. New updates have also made it much easier for organizations to build their own custom projects on the platform.
While Avalanche crypto is working with major names like ANZ and Galaxy Digital, the market still sees some ups and downs. Even with all the new partnerships, the price recently saw a dip of over 4%. This shows that while the technology is growing, the coin’s value can still be affected by general market shifts. If these big institutional projects don’t bring in enough regular users, they could face a slow period.
Why BlockDAG is the ultimate opportunity for 95x ROI at just $0.0000061
BlockDAG is currently moving at a speed that has left the market stunned. It has already secured a massive $300 million market cap, a milestone that most projects take years to reach. A recent price surge to $0.4 on CoinMarketCap proved that this network is a serious contender for the top spot. This rapid growth has built deep trust among experts who now name BDAG as the next potential market leader.
The window to secure BDAG at the Batch 4 price of $0.0000061 is closing fast. This specific entry point is ending soon, and once the transition happens, this low price will likely never be seen again.
Analysts suggest that entering at $0.0000061 could deliver a staggering 95x ROI for those who act now. Since Batch 3 sold out almost instantly, the rush for Batch 4 is even more intense. Market makers are also predicting BDAG to hit the $1 mark soon. This represents the final opportunity to get in before the project hits a whole new level of value.

Global demand is about to explode as BDAG has just become tradable on major exchanges, including XT.com, LBank, Coinstore, Biconomi, and Ascendex. Following even broader exchange coverage in late April, the roadmap shifts to DEX integration and liquidity incentives in May.
By June, the project will launch its “Super App,” featuring lending protocols and dApps. With a $300M market cap, rapid $0.4 price surge on CMC, and a low-entry price of $0.0000061, it is clear why everyone is rushing to jump in on one of the top crypto gainers today.
Final verdict
While the Zcash price shows steady growth near its liquidity zones and Avalanche crypto secures its future with institutional partnerships, they lack the explosive potential of newer projects. These established coins are reliable, but they don’t offer the rapid wealth-building power seen in the BlockDAG presale.
BlockDAG has already proven its dominance with a $300 million market cap and a massive surge on CoinMarketCap. With the $0.0000061 price ending and a 95x ROI on the horizon, the opportunity to act is vanishing. Investors are quickly moving their funds into this project to secure a spot in one of the top crypto gainers today.
For more information, visit the presale website, official website, Telegram, and Discord.
Disclosure: This content is provided by a third party. Neither crypto.news nor the author of this article endorses any product mentioned on this page. Users should conduct their own research before taking any action related to the company.
The Commodity Futures Trading Commission (CFTC) filed a motion Wednesday seeking a preliminary injunction and temporary restraining order against Arizona’s enforcement of state gambling laws on prediction markets.
The motion escalates an already historic conflict. The agency sued Arizona, Connecticut, and Illinois last week, marking the first time in its 50-year history that it has sued a state.
Federal Power Play With Family Ties
CFTC Chairman Michael S. Selig framed the injunction request as a defense of federal authority, noting that the CFTC will vigorously defend its exclusive authority over prediction markets.
“The agency won’t stand for intimidation by states seeking to nullify federal law,” wrote Selig in a post.
It follows a motion in Arizona that builds on a recent filing against States that use criminal and gambling laws to interfere with CFTC-regulated prediction markets.
Arizona’s decision to weaponize preempted state criminal law against companies that comply with a comprehensive federal regime sets a dangerous precedent… The CFTC is committed to vigorously defending its exclusive authority over prediction markets,” read an excerpt in the press release, citing Selig.
Arizona filed criminal charges against Kalshi in March, alleging illegal gambling and unauthorized election wagering.
The CFTC argues that prediction markets fall under the Commodity Exchange Act (CEA), which grants the agency exclusive federal jurisdiction over event contracts.
However, the platforms the CFTC is defending carry significant financial ties to the Trump family.
Donald Trump Jr. serves as a paid strategic advisor to Kalshi and sits on Polymarket’s advisory board. His venture capital firm, 1789 Capital, invested millions into Polymarket in August 2025.
Crypto.com, Robinhood, and the Conflict Question
The connections extend further. Trump Media & Technology Group (TMTG) partnered with Crypto.com to build Truth Predict, a prediction market platform for Truth Social.
Crypto.com has donated at least $35 million to MAGA Inc., Trump’s primary Super PAC.
Robinhood announced Monday it will serve as the brokerage and initial trustee for Trump Accounts. All four companies received cease-and-desist letters from the states the CFTC is now suing.
Georgia State University professor Todd Phillips told NPR the federal suits go beyond advocacy. He described them as an attempt to tilt the scales in favor of prediction markets.
Connecticut Attorney General William Tong pushed back, calling prediction market contracts plainly unlicensed illegal gambling and pledging to defend state consumer protection laws.
The Ninth Circuit will hear oral arguments on April 16 in a consolidated case involving Kalshi, Robinhood, and Crypto.com.
That ruling could determine whether prediction markets operate under one federal framework or face state-by-state restrictions.
The post Trump’s CFTC Shields His Family’s Prediction Market Partners From Prosecution appeared first on BeInCrypto.
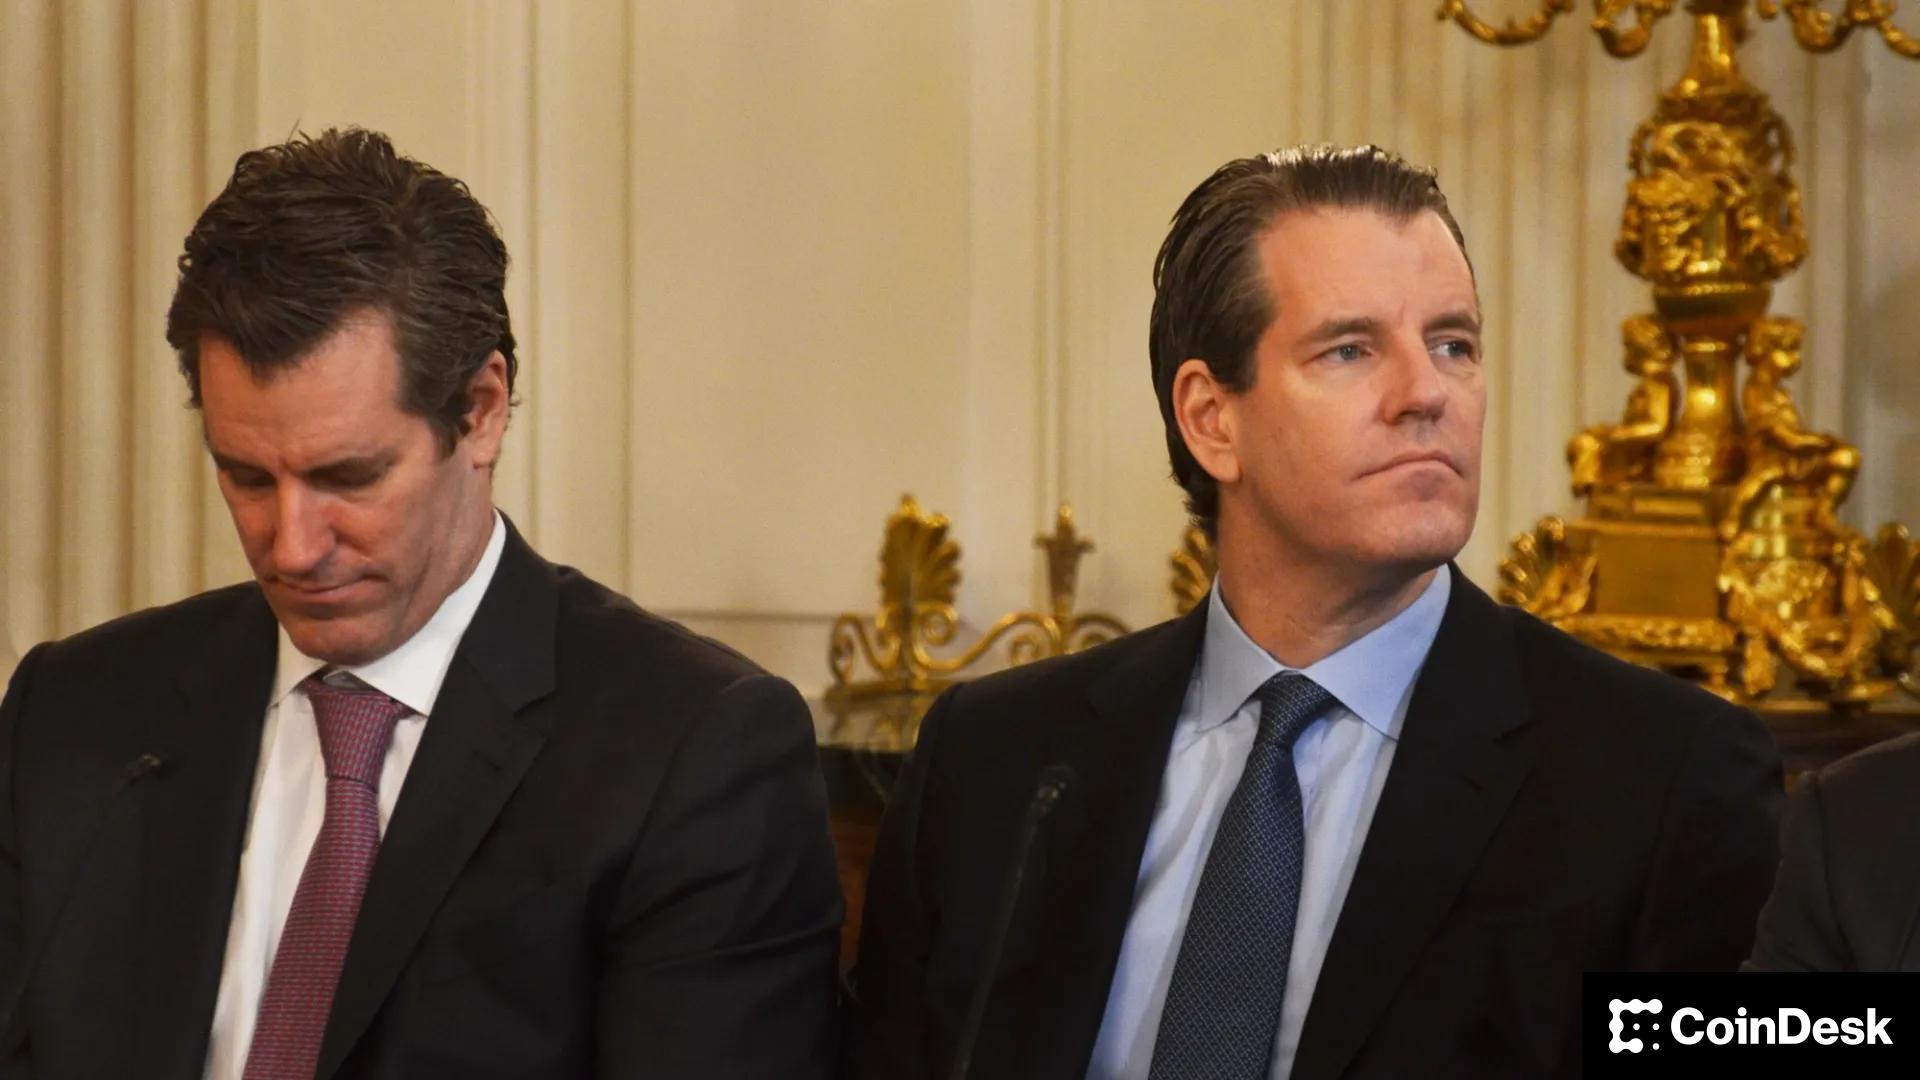

Potential buyers are evaluating an acquisition of parts of Gemini Space Station (GEMI), the crypto exchange backed by the billionaire Winklevoss twins, according to a person with direct knowledge of the matter.
The New York-based firm said in February that it was cutting its global workforce by 25% and shutting down its operations in the U.K., the European Union and Australia and keeping only its U.S. and Singapore businesses.
Some would-be acquirers are interested in buying the company’s now-shuttered operations in Europe and the U.K. to obtain regulatory licenses in these jurisdictions and are not interested in a full takeover of the Nasdaq-listed company, the person said, who spoke on condition of anonymity as the matter is private.
A company spokesperson declined to comment.
Gemini extends beyond a trading venue, offering institutional custody, staking and yield products, and payments infrastructure enabling fiat–crypto on- and off-ramps. It has also built brokerage and clearing capabilities, positioning itself as a full-service platform rather than just an exchange. The firm also provides a crypto rewards credit card, allowing users to earn digital assets on everyday spending.
Regulatory approvals
In Europe, Gemini operated under a combination of national registrations across several jurisdictions and a Markets in Crypto-Assets (MiCA) license that enabled it to offer services across the EU single market.
In the U.K., the exchange is registered with the Financial Conduct Authority (FCA) as an electronic money institution (EMI), allowing it to provide certain regulated payment services. It also appears on the FCA’s register of approved cryptoasset service providers.
Securing regulatory approvals in Europe and the U.K. can take years, which is why acquiring Gemini’s now-shuttered operations makes sense, the person added.
Under Europe’s MiCA regime, a crypto license doesn’t simply transfer to a new owner in an acquisition. Instead, any takeover of a licensed firm is treated as a “change of control” event, meaning regulators reassess the deal rather than automatically allowing the authorization to pass.
Acquirers must notify the relevant national competent authority and, in many cases, secure approval, or at least a formal non-objection, before closing, effectively subjecting the new owner to regulatory scrutiny similar to a fresh applicant.
The Financial Conduct Authority takes a very similar approach. A crypto firm registered with the FCA does not have a transferable license in an acquisition. A takeover is treated as a change of control, not a transfer of authorization.
Volatile run
Gemini’s shares have been volatile since its September 2025 IPO.
The stock was priced at $28 in its IPO, opened above $37 and closed its first day around $32, with intraday gains of more than 30% signaling strong investor demand.
However, that early momentum quickly unraveled.
The stock has since collapsed from its post-listing highs and now trades at around $4.36, down more than 80% from its IPO price, underscoring a steep loss of investor confidence amid a broader crypto market downturn and company-specific headwinds.
Senior departures
The company recently parted ways with three top executives, including its chief operating officer (COO), chief financial officer (CFO), and chief legal officer (CLO), the exchange disclosed in a February filing.
COO Marshall Beard, CFO Dan Chen and CLO Tyler Meade all left with immediate effect, according to the filing. Beard also resigned from Gemini’s board of directors, with the firm stating his departure was not the result of any disagreement related to its operations, policies or practices.
The departures came just days after Gemini announced it would shut down its crypto exchange operations in the U.K., European Union and Australia.
Gemini shares were 11% higher after the news. Short interest is 15% of the float according to FactSet data.
Read more: Gemini stock falls 10% after it parts ways with COO, CFO and Chief Legal Officer months after IPO
UPDATE (April. 9, 6.20 pm UTC): Updates story with the share price move and short interest data.

The window of opportunity in the digital asset market is closing faster than most traders realize. While many investors wait for mainstream news outlets to confirm a breakout, the real wealth is being generated in the quiet moments before the vertical climb.
Identifying the best crypto to buy right now requires a shift in perspective from following the crowd to anticipating the needs of the future global financial infrastructure. The market is currently signaling a massive rotation into projects that offer more than just hype; it is hungry for scalability, interoperability, and genuine utility.
Those who hesitate to diversify into these high-conviction assets today may find themselves watching from the sidelines as the most promising opportunities move out of reach forever.
1. BlockDAG (BDAG): The 95x Opportunity of the Year
BlockDAG is currently dominating conversations as the best crypto to buy right now due to a unique pricing gap that savvy investors are exploiting for maximum gain. On CoinMarketCap, the asset has already crossed the $0.02 threshold, after validating the early projections made by market makers who foresaw a climb to $0.4. With that milestone achieved, the trajectory is now set for a $1 valuation in the near future.
However, a massive opportunity remains for those who know where to look. While the public market price reflects steady growth, individuals can still acquire BDAG tokens directly through the BlockDAG website for just $0.0000061. This price difference creates a mathematical path toward 95x returns for those who act before the direct sale window terminates.
The momentum behind this project is fueled by its upcoming accessibility on several major trading platforms. Liquidity and volume are expected to surge as BDAG becomes tradeable on XT.com, LBank, Coinstore, Biconomi, BitMart, P2B, AscendEX, and more. These listings ensure that once the direct purchase phase concludes, the asset will have the global reach necessary to sustain its march toward the $1 target.
Investors are rushing to secure their positions at the fractional entry price of $0.0000061, recognizing that the current discrepancy between the direct sale and the market price is a rare chance to front-run the broader retail market.
2. Chainlink (LINK): The Essential Backbone of DeFi
Chainlink remains a staple for anyone searching for the best crypto to buy right now because it functions as the central nervous system for decentralized finance. It provides the essential oracle infrastructure that bridges the gap between isolated blockchains and the vast amount of data existing in the real world.
Without the reliable data feeds provided by Chainlink, smart contracts would be unable to execute based on price fluctuations, weather patterns, or even sports results. This makes LINK a fundamental necessity rather than a speculative luxury, as the entire DeFi ecosystem relies on its accuracy to maintain its integrity and security.
Beyond simple data delivery, the project has introduced the Cross-Chain Interoperability Protocol (CCIP), which is setting the global standard for how different blockchains communicate. This technology has caught the attention of major traditional financial institutions like Swift and DTCC, which are using Chainlink to explore how tokenized assets can be settled across various networks.

Because node operators must stake LINK as collateral to secure the network, there is a direct correlation between the adoption of these services and the demand for the token. As more global banks integrate CCIP, the pressure on LINK’s circulating supply could lead to a significant valuation shift.
3. Polkadot (DOT): Leading the Multi-Chain Future
Polkadot offers a sophisticated solution to the problem of blockchain fragmentation, making it a top contender for the best crypto to buy right now. Its unique architecture allows various specialized blockchains, known as parachains, to run in parallel while leaning on the central Relay Chain for their security.
This setup allows developers to build chains that are perfect for one specific task without having to worry about building their own security from scratch. With the transition toward Polkadot 2.0 and the implementation of async backing, the network has seen a massive boost in how many transactions it can handle, drastically reducing wait times for users.
One of the most significant changes to the ecosystem is the introduction of Coretime. This new model changes how blockspace is distributed, making it much more affordable and flexible for new projects to join the network compared to the old auction system.
For those holding DOT, the project offers a governance system that provides actual power over the network’s future, including how the treasury is spent. Additionally, with staking rewards currently sitting between 14% and 16% APY, DOT provides a way to grow a portfolio through passive income while the broader ecosystem of specialized chains continues to expand.
4. Cosmos (ATOM): Powering the App-Chain Revolution
Cosmos is built on the belief that the future of the internet consists of thousands of independent blockchains, and it provides the tools to make that happen. The Cosmos SDK is currently the most popular framework for creating custom blockchains, utilized by heavy hitters like Celestia and the BNB Chain.
This widespread use ensures that ATOM remains at the heart of a massive network of interconnected apps. The Inter-Blockchain Communication (IBC) protocol is the secret sauce here, allowing over 100 different chains to trade data and assets instantly, creating a web of value that is unmatched in its fluidity.
The value of the ATOM token has recently been strengthened by the introduction of interchain security. This allows the main Cosmos Hub to lend its security to newer, smaller chains. In return, ATOM stakers receive a portion of the revenue generated by these newer projects.
This creates a diversified reward stream for holders, who earn from both the main hub and the various “consumer chains” it protects. For investors looking for the best crypto to buy right now, ATOM represents a diversified bet on the entire “app-chain” philosophy, capturing value from every new project that chooses to build within the Cosmos ecosystem.
Which is the Best Crypto to Buy Right Now?
The current market window presents a rare alignment of technological maturity and undervalued entry points. While the fear of missing out often drives irrational decisions, the data behind these four projects suggests that the real risk lies in inaction.
From the massive 95x potential found in the BlockDAG direct purchase to the institutional-grade stability of Chainlink, Polkadot, and Cosmos, the best crypto to buy right now is defined by utility and scalability.
Securing a position in these assets today is not just about catching a trend; it is about owning a piece of the infrastructure that will define the next decade of finance. The opportunity to buy at these levels is a fleeting moment in a rapidly accelerating market cycle.
Disclaimer: This is a Press Release provided by a third party who is responsible for the content. Please conduct your own research before taking any action based on the content.


Jake Claver Live – 04-07-2026 – XRP & Digital Assets Q&A

Lidl unveils plans for 50 new stores to open in next year

IGA: Discount Widens Back Out, Making It A More Interesting Choice (Upgrade) (NYSE:IGA)


-

 NewsBeat7 days ago
Steven Gerrard disagrees with Gary Neville over ‘shock’ Chelsea and Arsenal claim | Football
-

 Business7 days ago
No Jackpot Winner and $194 Million Prize Rolls Over
-

 Fashion6 days ago
Weekend Open Thread: Spanx – Corporette.com
-

 Business5 days ago
Expert Picks for Every Need
-

 Business4 days ago
Three Gulf funds agree to back Paramount’s $81 billion takeover of Warner, WSJ reports
-

 Sports5 days ago
India men’s 4x400m and mixed 4x100m relay teams register big progress | Other Sports News
-

 Tech2 days ago
How Long Can You Drive With Expired Registration? What Florida Law Says
-
Business4 days ago
No Jackpot Winner, Prize to Climb to $231 Million
-

 Fashion3 days ago
Massimo Dutti Offers Inspiration for Your Summer Mood Board
-
Politics6 days ago
Wings Over Scotland | The quality of mercy
-

 Fashion2 days ago
Let’s Discuss: DEI in 2026
-

 Business5 days ago
Akebia Therapeutics, Inc. (AKBA) Discusses Pipeline Progress and Strategic Focus on Kidney Disease Treatments at R&D Day – Slideshow
-

 Fashion7 days ago
Statement Sunglasses: The Accessory Shaping Modern Fashion
-

 Crypto World1 day ago
Bitcoin recovers as US and Iran Agree a Ceasefire Deal
-

 Politics7 days ago
East Jerusalem Palestinian families eviction orders
-

 Politics7 days ago
Why so many children are now classified as ‘disabled’
-

 Fashion7 days ago
For Love & Lemons’ Spring 2026 Line is for the Romantics
-

 Politics7 days ago
Nuclear rockets, moon bases and NASA’s Mars plan
-

 Tech7 days ago
The Threadless Ball Screw Never Took Off, But Don’t Write It Off
-
 Business6 days ago
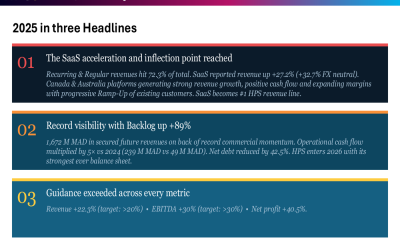
HPS FY 2025 slides: SaaS inflection drives 22% revenue growth
You must be logged in to post a comment Login