

Crypto World
BlackRock Says Bitcoin is Onboarding Investors Into TradFi

BlackRock’s spot Bitcoin exchange-traded fund has been a gateway for new investors to enter the wider ETF market, according to Jay Jacobs, US head of equity ETFs at BlackRock.
Around three-quarters of investors in BlackRock’s iShares Bitcoin Trust ETF have never owned an ETF before, Jacobs told Cointelegraph on the Chain Reaction podcast Thursday.
“IBIT was a way for traditional investors to now get into digital assets. But we have seen a lot of people really kind of enter into IBIT, starting with digital asset ETPs,” he said.
Bitcoin ETFs were heralded as a way to bring traditional investors into the world of digital assets. BlackRock’s Jacob suggests the shift has been two-way.
The iShares Bitcoin Trust, launched in January 2024, is BlackRock’s flagship crypto product with $48 billion in assets under management. It holds 765,936 BTC and has been an on-ramp for many digital asset investors to engage with ETPs.
However, Jacobs said that once investors get exposure to the Bitcoin product, many start buying other BlackRock funds, such as S&P 500 (IVV), artificial intelligence (BAI) and gold (IAU).
“We absolutely see it as this is a way to engage with a different group of people than maybe we’ve engaged with in the past,” he said.
The company launched a new product called the iShares Bitcoin Premium Income ETF (BITA) on Wednesday, which generates income by selling covered call options on Bitcoin holdings.
The “Great Convergence” of TradFi and crypto
Bitcoiners’ engagement with TradFi comes amid a growing overlap between crypto, decentralized finance and traditional finance, which BlackRock is calling the “Great Convergence,” according to Jacobs.
“Historically, you’ve seen a lot of different assets held separately,” he said. “DeFi versus TradFi, actively managed funds versus index funds, private assets versus publicly listed assets… and what’s happening is people are looking for more solutions to manage their portfolios,” he said.
“I think you’re gonna hear a lot less about versus, you know, TradFi versus DeFi, and I think you’re gonna see a lot more ampersands, it’s TradFi and DeFi.”
Related: TradFi advisers want stablecoins, tokenization over Bitcoin: Bitwise
A recent example could be seen during the high-profile SpaceX IPO earlier this month, with crypto traders given an opportunity to get a piece of the action through pre-IPO perpetual futures or tokenized stocks.
Pre-IPO perps enable investors to get exposure to private companies before they start trading on TradFi exchanges.
All major crypto exchanges are now offering pre-IPO perps, and trading volume has skyrocketed from around $1 billion in early May to about $22 billion, with Binance establishing itself as the largest venue, according to CryptoQuant.
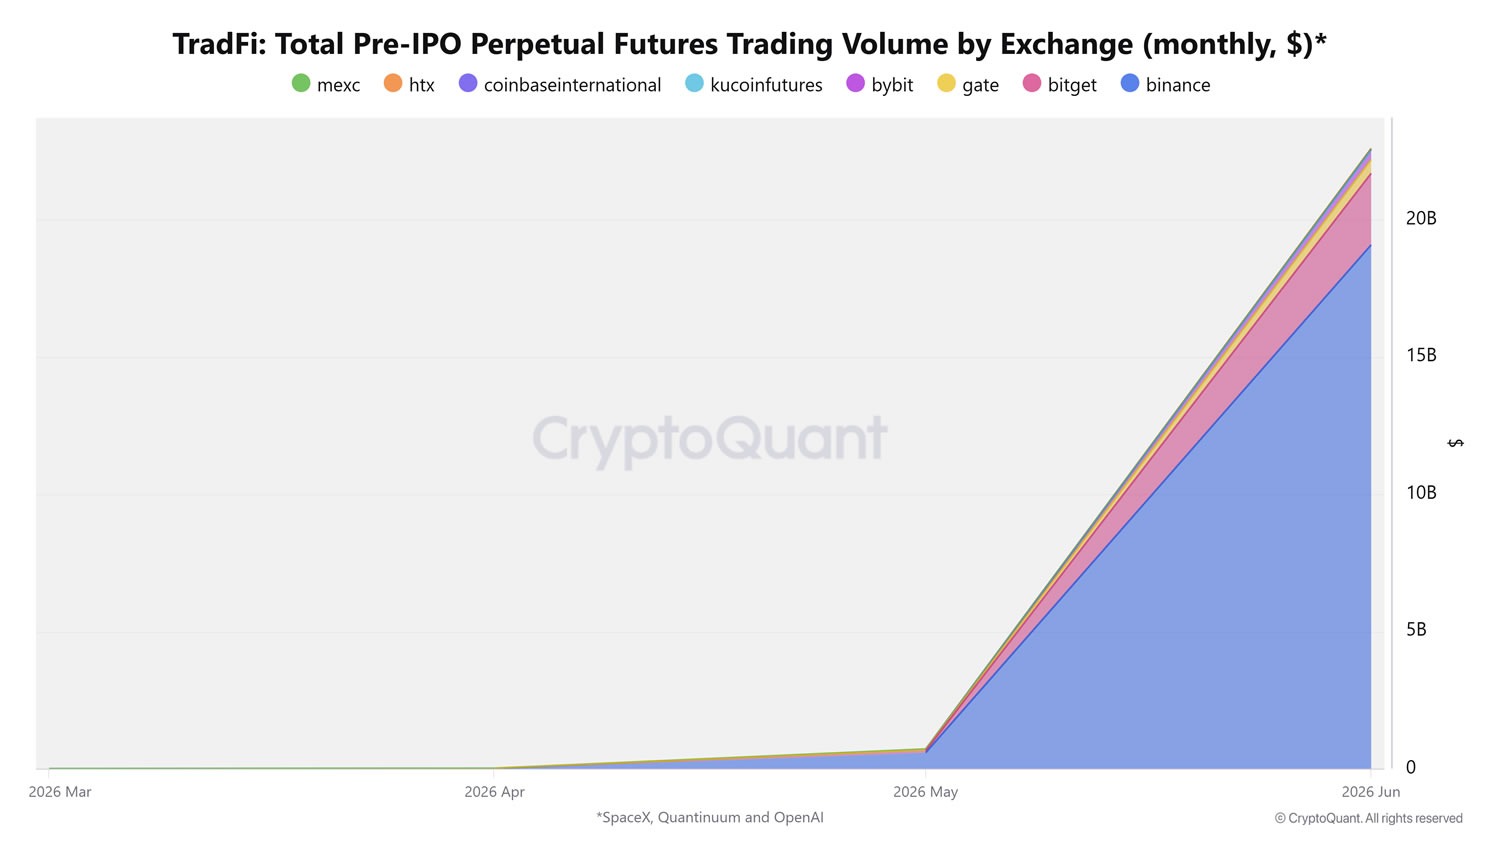
Pre-IPO perp volumes on crypto exchanges have surged over the past few weeks. Source: CryptoQuant
Magazine: The end of anon? AI could unmask crypto’s hidden identities


The new Fed chair held rates steady in his debut, then quietly inverted the entire outlook. The dot plot that projected cuts in March now projects hikes. For a crypto market that spent all year waiting on cheaper money, the ground just shifted.
Summary
- Warsh held rates steady, but the dot plot changed the entire market outlook.
- Crypto fell because the expected path of rates moved higher, not because current rates changed.
- A hawkish Fed raises the bar for every crypto bull case.
- Inflation is now the key number for crypto investors to watch.
On June 17, 2026, Kevin Warsh chaired his first meeting of the Federal Reserve and left interest rates exactly where they were, at 3.50% to 3.75%, the fourth consecutive hold and an outcome markets had fully expected. That decision changed nothing.
What Warsh did to the projections changed everything. Its updated dot plot, the chart showing where officials expect rates to go, flipped from projecting cuts to projecting hikes, and the forward guidance that markets had leaned on for a year was stripped out entirely.
Most major cryptocurrencies fell between 1% and 3% on the news, with Bitcoin sliding toward $64,000. The reason was not the rate decision, which was priced in, but the realization that the cheap-money future crypto had been pricing for the second half of 2026 had just evaporated.
For most of this year, a large part of the crypto bull case rested on a single assumption: that the Fed would cut rates in 2026, easing financial conditions, increasing liquidity, and lifting risk assets including crypto. That assumption is now in serious doubt, and the man who put it in doubt is, ironically, the crypto-friendly chair the industry welcomed.
This piece works through what Warsh actually did at his first meeting, why the dot-plot reversal matters more than the rate hold, why a hawkish Fed is a headwind for crypto, the inflation backdrop forcing the Fed’s hand, and what changes for a market that has to rebuild its thesis without the rate cuts it was counting on.
The rate-cut trade is dead, and understanding why is essential to understanding where crypto goes from here.
What Warsh actually did
The meeting held rates steady, so the story is entirely in the projections and the language, and both pointed firmly in one direction.
The Federal Open Market Committee voted twelve to zero to keep the federal funds rate at 3.50% to 3.75%, a decision so widely expected that on its own it would have passed without much market reaction. The market-moving content sat in the Summary of Economic Projections, the quarterly document that includes the dot plot.
In March, before Warsh took over, that dot plot showed zero officials projecting a rate hike for 2026 and the committee as a whole forecasting a cut. At this meeting, the picture inverted: nine of eighteen officials now project at least one rate hike in 2026, and six of those project two hikes, while only one official still pencils in a cut.
The median projection for the end-of-2026 rate rose to 3.8% from 3.4% in March. In the space of one quarter, the Fed went from expecting to cut to expecting, on balance, to hold or hike, which is a sharp and consequential reversal.
Its language shifted just as hard. The policy statement dropped its easing bias, removing the references to future rate adjustments that had signaled cuts were coming, and became shorter and blunter, declaring that the committee “will deliver price stability.”
Warsh explicitly abandoned the practice of telegraphing future moves, the forward guidance that markets had relied on under the previous chair. He signaled a Fed that would be data-dependent and unwilling to promise the easing that traders wanted.
He also announced a broad review of the central bank’s work, naming five task forces covering inflation, communications, economic data, productivity, and the labor market, a sign that he intends to reshape how the Fed operates, not merely to chair its meetings. The combination, a hawkish dot plot, stripped-out guidance, and a price-stability-first message, told markets that this Fed is focused on inflation and is not preparing to cut.
Why the dot-plot reversal matters more than the hold
The rate hold was a non-event because it was expected; the projection reversal was the event because it rewrote what markets expect next, and expectations are what move asset prices.
Markets do not price the current interest rate so much as the expected path of future rates, because asset values reflect what investors believe will happen, not only what is true today. For a year, the crypto market and the broader risk-asset complex had priced in a path of falling rates in 2026, an easing cycle that would loosen financial conditions and support higher valuations.
The dot-plot reversal demolished that priced-in path in a single afternoon, replacing an expected easing with an expected hold-to-tightening. When the expected path of rates shifts upward, the assets that were priced for falling rates have to reprice downward to reflect the new reality.
That repricing is what the 1% to 3% crypto decline represented. It was not a reaction to a rate that did not change, but an adjustment to a future that did.
Removing forward guidance compounds the effect by injecting uncertainty. Under the prior regime, markets received signals about where rates were heading, which let them price the future with some confidence.
Warsh’s refusal to telegraph moves means markets must now navigate without that guidance, pricing a wider range of outcomes and demanding more compensation for the uncertainty. That tends to pressure risk assets that depend on confident expectations of easier conditions.
A Fed that will not promise cuts, that projects hikes, and that anchors everything to delivering price stability is a Fed that has taken the rate-cut assumption off the table. Every asset that was leaning on that assumption, crypto prominently among them, has to find its footing without it.
The hold kept rates still; the projections moved the market, because the market trades the future the projections describe.
Why a hawkish Fed is a headwind for crypto
The connection between Fed policy and crypto prices is direct and well-known, and a hawkish turn works against crypto through several reinforcing channels.
The clearest channel runs through liquidity and risk appetite. When the Fed holds or raises rates, it keeps money relatively expensive and scarce, which reduces the flow of capital into speculative, risk-sensitive assets, and crypto sits at the far end of the risk spectrum.
Higher rates make safe assets like Treasury bills more attractive by paying a solid yield for no risk. That raises the bar for holding a volatile, yield-less asset like Bitcoin, since the opportunity cost of choosing crypto over a safe 4% return goes up.
Crypto has shown a persistent correlation with risk assets during periods of monetary tightening, and the precedent is recent and painful. When the Fed hiked aggressively in 2022 and 2023, crypto fell hard alongside equities, and the same dynamic can reassert itself when policy tightens or simply refuses to loosen.
A hawkish Fed drains the cheap liquidity that fuels crypto rallies. It is one of the macro forces pressuring crypto, and it now sits at the center of the market’s 2026 problem.
A second channel runs through the dollar and real yields. A more hawkish Fed tends to strengthen the dollar, and a stronger dollar is generally a headwind for crypto, which is priced in dollars and competes with the dollar as a store of value.
Rising real yields, interest rates adjusted for inflation, make holding non-yielding assets like Bitcoin and gold less attractive by raising the return available elsewhere. That is part of why both have struggled in this environment.
A third channel is sentiment and the narrative. The crypto market had built a meaningful part of its 2026 optimism on the expectation of rate cuts, and removing that expectation removes a pillar of the bullish story, leaving the market to lean on other catalysts.
None of this means crypto cannot rise in a hawkish environment, since asset-specific catalysts can override the macro. But it means the macro tide is now running against crypto instead of with it, and swimming against a tide is harder than swimming with one.
The inflation backdrop forcing the Fed’s hand
Warsh’s hawkishness is not arbitrary; it is a response to an inflation problem that has worsened, and understanding the backdrop explains why the rate-cut trade was always vulnerable.
This meeting unfolded against the worst inflation reading in three years. Consumer prices rose 4.2% in May from a year earlier, the largest annual increase since April 2023, driven substantially by higher energy costs tied to the conflict in the Middle East that began earlier in the year.
Inflation running well above the Fed’s 2% target, and rising instead of falling, leaves the Fed little room to cut even if it wanted to. Cutting rates into rising inflation risks letting that inflation accelerate, the cardinal error a central bank focused on price stability must avoid.
The Fed’s statement explicitly tied the inflation backdrop to supply shocks including energy, and Warsh’s price-stability-first framing is the natural response of a central bank confronting inflation that has not been tamed. The hawkish turn is the Fed reacting to the data in front of it.
This is why the rate-cut trade was built on a shaky foundation from the start. The market wanted cuts, and priced them, but the inflation data never supported them, and a Fed serious about its 2% mandate was always going to struggle to deliver easing while prices climbed at 4.2%.
The irony of the Middle East situation is sharp here. The same geopolitical conflict that briefly lifted crypto on risk-on relief when a peace deal approached is also the source of the energy-driven inflation that is keeping the Fed hawkish.
That is the geopolitical side of the same backdrop. The story cuts both ways, offering a sentiment tailwind while feeding the inflation that produces a monetary headwind.
It is also the oil-inflation-Fed chain in action: energy prices feed inflation, inflation shapes Fed policy, and Fed policy shapes the crypto liquidity environment.
Warsh inherited an inflation problem, and his first meeting signaled that he intends to treat it as the priority. That means the easy money the crypto market wanted is not coming while inflation runs this hot.
The data killed the rate-cut trade; Warsh merely confirmed the death.
What changes for crypto
With the rate-cut assumption gone, several things change for how the crypto market should be understood and how its thesis has to be rebuilt.
One change is that the macro tailwind many were counting on for the second half of 2026 is now a headwind, or at best a neutral. That means the crypto bull case can no longer lean on easing financial conditions and has to rest on other foundations.
Asset-specific catalysts become more important precisely because the macro is no longer doing the work. Adoption, institutional flows, regulatory clarity, and project-level developments now have to carry more of the burden of driving prices, since they cannot count on a rising liquidity tide to lift everything.
That is how a softer Fed shaped the XRP case: without easier money, even strong asset-specific theses need a clearer mechanism and real inflows to matter.
Regulatory catalysts still matter, especially when they change who can buy, hold, or finance digital assets. That is why letters to federal banking regulators on digital-asset risk weights still sit inside the broader crypto thesis, even as the Fed turns hawkish on rates.
This raises the bar for any bullish thesis, which now has to identify a specific reason an asset will rise despite a hawkish Fed, instead of assuming the macro will provide the lift. The market that spent 2026 waiting for the Fed has to start finding reasons that do not depend on it.
Another change is in how to read the data going forward. The single most important number for crypto is now the inflation print, because the path of rates, and therefore the macro environment for crypto, depends on whether inflation continues climbing or begins to ease.
If the 4.2% figure keeps rising, the probability of actual rate hikes increases, and the headwind for crypto intensifies. If inflation cools, the Fed could soften and the rate-cut hope could revive.
Crypto investors who were watching for dovish signals from the Fed should now be watching the inflation data that drives the Fed, because that data is upstream of everything.
A third change is psychological: the market has to absorb that the crypto-friendly chair it welcomed is, on monetary policy, a hawk, and that personal comfort with Bitcoin does not translate into the easy money that lifts its price. Warsh can like crypto and still run a policy that pressures it, and the market is learning that distinction the hard way.
That distinction matters even as Congress advances crypto-related limits on the Fed, including a CBDC pause in a major housing bill. A crypto-friendly policy environment can exist alongside a hostile liquidity environment.
What it means for investors
For anyone navigating crypto in this environment, the Warsh pivot reframes the landscape, and a few principles follow from it.
Realistically, crypto now faces a less supportive macro backdrop than the market assumed for most of 2026. The expected rate cuts have been replaced by an expected hold-to-tightening, and that is a genuine headwind that has to be weighed against whatever asset-specific catalysts an investor is following.
It does not mean crypto cannot rise, because strong enough catalysts can overcome a hawkish macro. A major adoption event, a regulatory breakthrough, a powerful project development, or sustained institutional flows can still move individual assets even in tight environments.
But it means the broad, rising-tide bull case that depended on easing is off the table for now. An investor should be skeptical of any thesis that quietly assumes the Fed will ride to the rescue with cuts, because the Fed has just signaled it will not.
The macro wind is in crypto’s face, and a position should be sized with that in mind. That is the broader question this raises: whether crypto can keep advancing when the liquidity story no longer does the lifting.
Discipline means separating the macro from the micro and watching the inflation data as the key variable. An investor can still find compelling asset-specific opportunities in a hawkish environment, but should hold them understanding that they are fighting the macro instead of riding it, and should adjust expectations and risk accordingly.
Watching the inflation prints, the dollar, and real yields gives a clearer read on the crypto environment now than watching for Fed dovishness that is not coming. Those are the forces actually driving the policy.
None of this is investment advice; it is a frame for a market whose central macro assumption just changed, and which has to be understood in light of that change rather than in the comfortable terms it used for most of the year.
The easy money is not coming
Kevin Warsh’s first meeting as Fed chair will be remembered not for the rate hold, which surprised no one, but for the projection reversal that killed the rate-cut trade.
The dot plot that showed cuts in March now shows hikes, the forward guidance is gone, the message is price stability above all, and a crypto market that spent the year pricing in easier money has had to reprice for a Fed that is not going to provide it.
The 1% to 3% decline on the news was the market beginning to absorb a future without the cuts it was counting on, and that absorption is not finished.
The deeper lesson: the macro foundation of the 2026 crypto bull case has shifted, and the market has to rebuild its thesis on something other than Fed easing. The rate cuts that were supposed to lift crypto in the second half of the year are not coming while inflation runs at 4.2%, and the crypto-friendly chair the industry welcomed has turned out to be, on the policy that matters most for prices, a hawk.
What carries crypto from here will have to be asset-specific: adoption, flows, regulatory clarity, and real catalysts. The macro is no longer offering a free lift and may be pushing the other way.
The rate-cut trade is dead, the inflation print is now the number that matters most, and the comfortable assumption that cheap money would return in 2026 just ran out of road. Crypto can still rise, but it will have to earn it without the Fed’s help, and that is the change that matters.
Frequently asked questions
What did Kevin Warsh do at his first Fed meeting?
At his June 17, 2026 debut, Warsh held the federal funds rate steady at 3.50% to 3.75% on a 12-0 vote, an expected decision. The market-moving change lived in the projections: the dot plot flipped from projecting rate cuts in March to projecting hikes. Nine of eighteen officials now see at least one 2026 hike and six see two, while the median end-2026 rate rose to 3.8% from 3.4%. The statement also dropped its easing bias and emphasized delivering price stability.
Why did crypto fall after the Fed held rates steady?
Because markets price the expected path of future rates, not just the current rate. For a year, crypto had priced in rate cuts in 2026. The hawkish dot-plot reversal replaced that expected easing with an expected hold-to-tightening, forcing assets that were priced for falling rates to reprice downward. Most major cryptocurrencies fell 1% to 3%, with Bitcoin sliding toward $64,000, reacting not to the unchanged rate but to the changed outlook.
Why is a hawkish Fed bad for crypto?
A hawkish Fed keeps money expensive and scarce, reducing the flow of capital into speculative assets like crypto. Higher rates make safe assets like Treasury bills more attractive, raising the opportunity cost of holding yield-less crypto. A hawkish stance also tends to strengthen the dollar and raise real yields, both headwinds for Bitcoin. Crypto has shown persistent correlation with risk assets during tightening, falling alongside equities when the Fed hiked in 2022 and 2023.
Why is the Fed turning hawkish now?
Inflation has worsened. Consumer prices rose 4.2% in May from a year earlier, the largest annual increase since April 2023, driven substantially by higher energy costs tied to the Middle East conflict. With inflation well above the Fed’s 2% target and rising, the Fed has little room to cut without risking accelerating inflation. Warsh’s price-stability-first stance is a response to this data, which is why the rate-cut trade was built on a shaky foundation.
Does this mean crypto cannot go up in 2026?
No, but it means the macro is now a headwind rather than a tailwind. Crypto can still rise on strong asset-specific catalysts, adoption, institutional flows, regulatory clarity, or major project developments, which can override a hawkish macro. But the broad, rising-tide bull case that depended on rate cuts is off the table for now. Any bullish thesis has to identify a specific reason an asset will rise despite the Fed, not assume easing will lift everything.
What should crypto investors watch now?
The inflation print is now the most important number, because the path of rates depends on whether inflation keeps climbing or eases. If inflation rises, rate hikes become more likely and the crypto headwind intensifies; if it cools, the Fed could soften. Investors should also watch the dollar and real yields, which drive the crypto environment. Watching the inflation data that drives the Fed gives a clearer read than waiting for Fed dovishness that the June meeting signaled is not coming.
As of June 19, 2026. Monetary policy and markets change quickly; verify current data before relying on this analysis. This article is information, not investment advice.
The broader market weakness, perhaps prompted by the latest FOMC meeting or fears about Strategy having to sell more BTC to fund dividend payments, has not spared Ripple’s cross-border token.
The asset is down by well over 4% in the past day and a whopping 18% on a monthly scale. It was rejected at $1.30 earlier this week and now fights to stay above $1.10. However, there are some warning signs about a more profound breakdown.
Warning Shots
Ripple whales have been a crucial part of the broader project investment ecosystem, as recent reports indicate they control nearly 70% of the entire supply. Additional data from CryptoQuant doubled down on their bullishness, as the analysts noted that they had refused to sell despite XRP’s price drop.
However, Ali Martinez shared a more concerning statistic earlier today. Citing data from Santiment, he said XRP whales have distributed (likely sold) more than 30 million tokens in the past five days alone, as their total holdings have declined toward 3.78B.
Similar moves by the largest cohort of investors not only increase the immediate selling pressure, but their example could also be followed by smaller market participants, who tend to mimic their actions.
The second major warning sign comes from the declining network usage. More data from the same two sources suggested that the XRP network activity has plummeted by nearly 50% in the past two weeks. Active addresses have fallen from around 50,000 to 25,000. The graph below illustrates this substantial decline, as there were days with even fewer than 25,000 active wallets.
$XRP network activity has dropped by nearly 50% in the past two weeks, as active addresses declined from 50,000 to around 25,000. https://t.co/aFHyt1Wdo1 pic.twitter.com/9pHudnAUpf
— Ali Charts (@alicharts) June 18, 2026
The Silver Lining
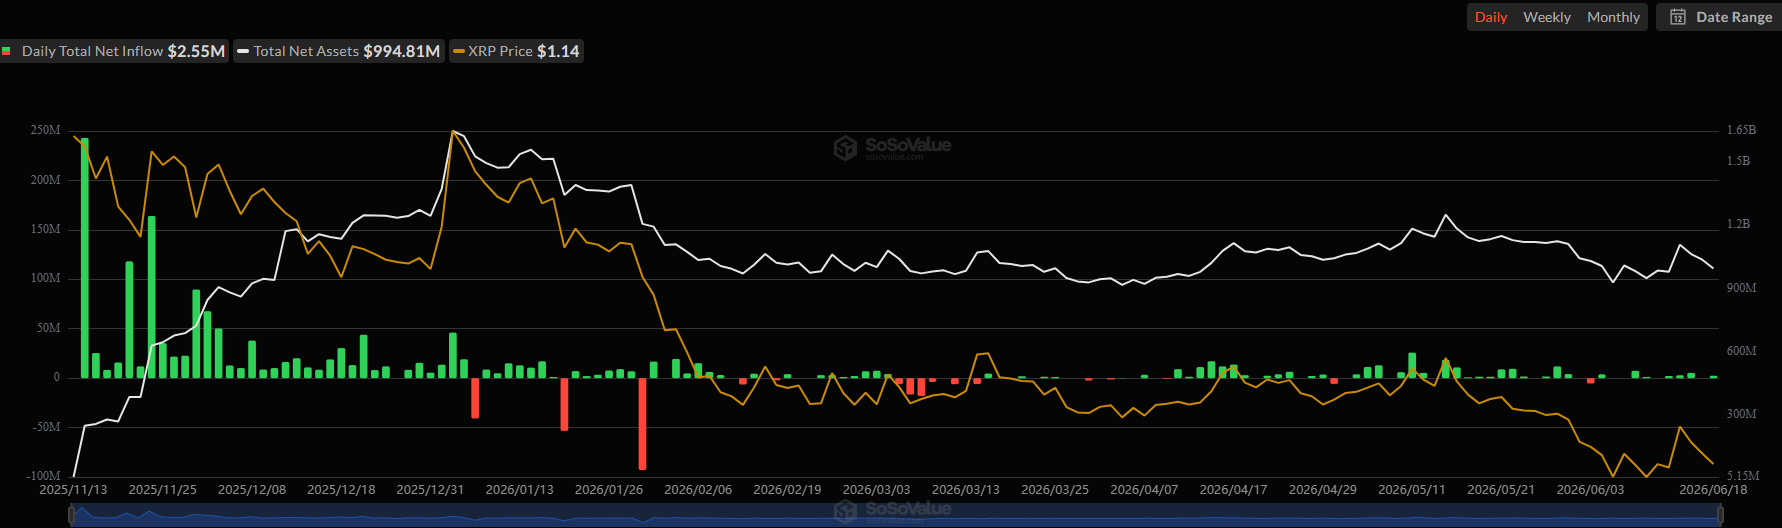
The only positive constant for Ripple’s native token remains the institutional appetite for the exchange-traded funds tracking its performance. Even during weeks where the BTC and ETH ETFs recorded massive net outflows, the spot XRP counterparts kept defying the bearish trend, staying in the green.
The past four trading days were no exception. SoSoValue data shows that the net inflows stood at $2.82 million on Monday, $5.30 million on Tuesday, and $2.55 million on Thursday, with Wednesday seeing no reportable action. The total cumulative net inflows have risen slightly again, to a fresh all-time high of $1.45 billion.
The post 2 Major Red Flags for Ripple’s Price as XRP Dumps 4.5% Daily: Details appeared first on CryptoPotato.


The Algorand Foundation will harden its blockchain against quantum attacks by the end of 2027, moving before the National Security Agency’s deadline.
The roadmap targets every layer of the network. It spans user wallets, developer tools, and the consensus mechanisms.
A Timeline Built Around Q-Day
Algorand frames the work against Q-Day, the point at which quantum computers could break the cryptography securing most blockchains today. The 2027 target arrives before the National Institute of Standards and Technology phases out legacy RSA key sizes. It also lands three years ahead of the NSA’s deadline for national security systems.
According to the roadmap, native post-quantum accounts will arrive with the Q3 2026 protocol release. Users will create them inside the Pera wallet, and all software development kits will support the new format.
Stakers will also be able to stake from the quantum-resistant accounts. Moreover, with the Q3 2026 upgrade, Algorand will support multiple signature types at once.
Follow us on X to get the latest news as it happens
The effort builds on work that began in 2022, when Algorand deployed State Proofs signed with the Falcon scheme. Post-quantum multi-signatures and a treasury migration are scheduled for later this year.
“Post-quantum security cannot be retrofitted after Q-Day. Every institution tokenizing or staking, every developer building, and every user transacting on Algorand needs to know their assets will remain secure should the quantum threat materialize. This roadmap gives them that assurance, starting with concrete deployments in 2026,” Bruno Martins, Chief Technology Officer, Algorand Foundation, said.
Chris Peikert, the Foundation’s Chief Scientific Officer, said upgrading a live protocol takes years as attack odds rise toward the end of the decade. The coming releases will test whether Algorand holds to its schedule.
Rival chains are moving on parallel tracks. TRON plans a quantum-resistant testnet in Q2 2026 and a mainnet rollout in Q3. Solana has said its migration is fully researched and ready to deploy once the threat lands. Ethereum developers, meanwhile, expect Layer 1 upgrades by 2029.
Subscribe to our YouTube channel to watch leaders and journalists provide expert insights
The post Algorand Targets Broad Quantum Resilience by End of 2027 With New Roadmap appeared first on BeInCrypto.
Goldman Sachs lowered its year-end gold forecast by $500 an ounce, citing expectations that the US Federal Reserve won’t cut interest rates this year.
The revised target places gold at $4,900, down from earlier estimates of $5,400. It comes on the assumption that the next Fed cuts could be pushed to March 2027 and December 2027.
“Our gold price views remain structurally constructive but tactically cautious, with near-term downside risk and medium-term upside risk,” Goldman Sachs commodity analysts Lina Thomas and Daan Struyven said, according to Bloomberg.
A delay in US interest rate cuts could also weigh on cryptocurrencies, as lower interest rates tend to be favorable for digital assets such as Bitcoin. The war in Iran has also taken its toll on the assets.
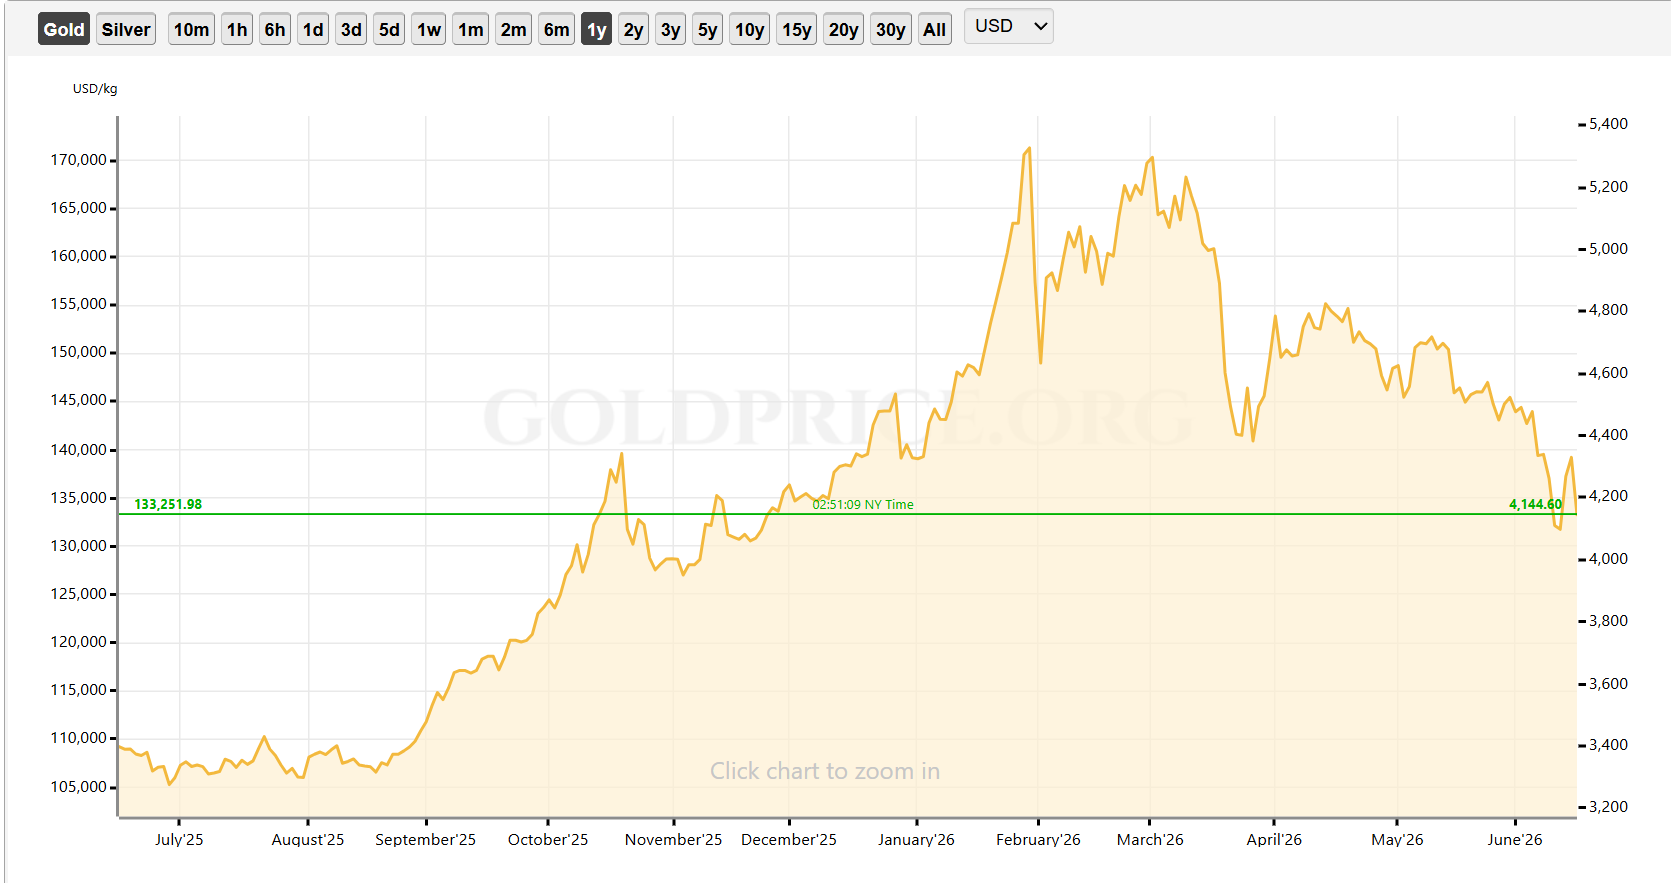
Bitcoin has fallen 28.3% since January, and gold has declined more than 22% since its January all-time high of $5,327 per ounce. Gold is now just $135 away from dipping below $4,000, a level not seen since November, according to GoldPrice.

Gold price one-year chart. Source: GoldPrice
Related: Bitcoin’s deeply discounted versus AI-stocks, but hawkish Fed risk lingers: Bitwise
Last week, analysts cautioned that Bitcoin and gold may face further headwinds this year following a 4.2% annual increase in the US Consumer Price Index in May, coupled with the conflict in the Middle East.
Since gold pays no yield, rising rates could mean that holding gold becomes more expensive relative to bonds or cash, and the market may be repricing the entire “easy money” thesis that drove gold to record highs earlier this year.
“Only when inflation drops, rate cuts become viable, and liquidity improves alongside lower capital costs, will the overall risk appetite truly reverse,” HashKey Group senior researcher Tim Sun told Cointelegraph.
CME’s FedWatch tool shows a high chance of rates staying the same or rising in the remaining months of 2026, compared with the current target rate of 3.5% to 3.75%.
Magazine: The end of anon? AI could unmask crypto’s hidden identities


Bitcoin and Ethereum faced a $2.13 billion options expiry on June 19 as both assets traded below their max pain levels.
Summary
- Bitcoin options worth $1.9 billion expired with max pain at $65,000, above spot prices Friday.
- Ether options worth $230 million expired near $1,725 max pain as ETH traded lower.
- GreeksLive said $60,000 remains a critical Bitcoin strike as quarterly expiry nears next week.
The expiry covered 31,000 BTC options with a put-call ratio of 0.78 and a notional value of $1.9 billion.
Ether also had 138,000 options expire, with a put-call ratio of 1.03 and a notional value of $230 million. ETH’s max pain level stood at $1,725, while BTC’s max pain level stood at $65,000.
Bitcoin traded near $62,500 during the session, below the level where many options would expire with the least value to buyers. Ethereum traded near $1,690, also below its max pain area.
Bitcoin momentum fades near key support
Bitcoin briefly rebounded toward $67,000 earlier this week, but the move lost strength. Sellers pushed the asset below $63,000 before expiry, keeping attention on the $60,000 to $63,000 range.
As previously reported by crypto.news, last week’s options expiry also placed the $60,000 to $62,000 Bitcoin area in focus. GreeksLive had said downside exposure was concentrated in that region.
The same level remains important this week. GreeksLive said the $60,000 strike acts as a “critical threshold.” The firm added that a “sustained breach” below that level could turn dealer hedging into a force that supports a faster move lower.
ETF flows and Strategy concerns weigh on sentiment
The market has also struggled to absorb pressure from institutional selling. Strategy, formerly MicroStrategy, has drawn attention after a small Bitcoin sale earlier this month shook confidence among some traders.
Crypto.news earlier reported that analysts pushed back against claims that Strategy alone caused Bitcoin’s drop. ETF outflows and whale selling were seen as larger forces behind the decline.
Still, the Strategy debate has added pressure to a market already dealing with weaker liquidity and falling prices. Traders have become more cautious as Bitcoin trades closer to downside strikes than upside call levels.
ETF demand has also cooled during the recent pullback. That matters because spot Bitcoin ETFs have been one of the main sources of institutional demand since their launch.
Traders watch quarterly settlement
This week’s expiry was smaller than last week’s, but next week brings the quarterly settlement. About 15% of options positions are set to expire, making June 26 a key date for derivatives traders.
Open interest remains large near the $80,000 strike, while bearish exposure still sits near $60,000. That split shows a market caught between longer-term upside bets and short-term downside protection.
Laevitas said a “week of grinding calm” had weakened the front end of Bitcoin volatility. That suggests traders have not priced in a large near-term move, even as quarterly expiry approaches.
Skew remains negative, showing that traders still pay more attention to downside protection. If Bitcoin holds above $60,000, volatility could remain contained. A break below that level may bring faster hedging flows and another test of lower support.
For Ethereum, the $1,700 area remains the near-term line to watch. ETH traded below its $1,725 max pain level, and a failure to reclaim that area could keep pressure on the $1,650 to $1,600 range.
The options expiry did not change the wider market trend by itself. It did, however, show that traders remain cautious while BTC and ETH trade below their pain points before a larger quarterly settlement.
Disclosure: This article does not represent investment advice. The content and materials featured on this page are for educational purposes only.

Strive CEO Matt Cole said on June 19 that the recent steep sell-off in Strategy’s STRC and his company’s SATA was caused by forced liquidation from leveraged investors and not by any deterioration in the financial strength of the issuers.
His comments came after one of the most volatile trading sessions the sector has ever seen, with STRC falling to $82.50 and SATA dropping into the low $90s before both recovered as buyers stepped back into the market.
Cole Says Fundamentals Are Still Intact Despite Sell-Off
In a lengthy post on X, the Strive chief called Thursday the most difficult day in the history of what he termed Digital Credit. According to him, investors looking for higher yields increasingly borrowed against assets such as STRC and SATA, but when prices started falling, margin calls triggered even more selling, creating a cascade that pushed prices lower regardless of fundamentals.
“What happened today was a leverage liquidation event, not a deterioration in underlying credit quality,” he wrote.
He pointed to blowups that happened in the past in leveraged Treasury trades as a parallel, saying those failures had nothing to do with Treasuries becoming bad credits and everything to do with investors overextending themselves while chasing yield on something they assumed was safe.
Talking about Strive specifically, Cole said the firm’s dividend reserves have not been touched and that the company wasn’t under any strain. Further, he pointed out that leveraged flushes aren’t necessarily a signal of weak collateral, since, if anything, they tend to happen because the collateral looked stable enough to tempt people into piling on leverage in the first place.
But when Udi Wertheimer, co-founder of Taproot Wizards, pressed Cole on why STRC’s peak had looked weak even before the crash, with the stock only reaching $97 around its last ex-dividend date, he conceded that the demand picture had softened somewhat. He blamed that on a weak Bitcoin market, jitters around Strategy’s recent corporate moves, and unease over the company using cash to pay down a convertible note.
However, Cole also said that the bigger factor was the kind of buying involved.
“If a security has billions of dollars of demand from long-only institutions, that is very different from demand driven by highly leveraged buyers,” noted the executive. “The latter can create strong demand on the way in, but also a much sharper unwind when prices move against them as we saw.”
According to him, Strive has one obvious lever with SATA if growth gets ahead of demand, which is to cut the interest rate to slow things down.
STRC’s Design Is Getting Stress-Tested
Market data shows STRC has since recovered to around $89 after the selloff, which is still some way off its $100 par, putting its effective yield near 13%, with a 30-day volatility of roughly 21%. Meanwhile, SATA, its newer and smaller sibling product, has held up somewhat better and was sitting just above $97 at the time of writing.
Strategy has said that its BTC treasury, currently valued at around $53 billion given Bitcoin’s price near $63,000, is enough to cover dividends for 32 years, considering the firm has about $1.7 billion in annual obligations. However, critics like Peter Schiff have often disputed that figure on the grounds that it assumes the cryptocurrency’s price doesn’t fall and the dividend rate doesn’t climb any higher.
The post Strive CEO: Sharp STRC, SATA Drops Were Leverage Liquidations, Not Credit Failures appeared first on CryptoPotato.


Noam Shazeer, Google’s vice president of engineering and co-lead of its Gemini AI models, announced on June 18 that he is leaving the company to join OpenAI.
The departure lands less than two years after Google paid a reported $2.7 billion to bring Shazeer back from Character.AI, the startup he co-founded after leaving Google in 2021.
A Costly Exit for Google
Shazeer, who first joined Google in 2000, is one of the most consequential researchers in modern AI. He co-authored the landmark 2017 paper “Attention Is All You Need.” That paper introduced the Transformer architecture underlying virtually every major language model today.
The news was confirmed by Shazeer on X, and Google made a brief statement: “We are grateful for Noam’s meaningful contributions to Google over the years.”
Timing Raises Stakes for OpenAI’s IPO Push
The move comes as OpenAI pushes ahead with plans for a public offering. The company confidentially filed an S-1 with the U.S. Securities and Exchange Commission earlier this month. Goldman Sachs and Morgan Stanley are advising on a listing that could exceed $1 trillion.
Adding Shazeer to its roster strengthens OpenAI’s technical credibility at a sensitive moment. The company has faced growing pressure from rivals. For instance, Anthropic is gaining ground in enterprise markets and competing in a crowded 2026 IPO wave alongside SpaceX.
Whether Shazeer’s arrival shifts product momentum ahead of the public listing is a question investors will likely watch closely.
The post Gemini Co-Lead Noam Shazeer Quits Google, Joins OpenAI Before IPO appeared first on BeInCrypto.
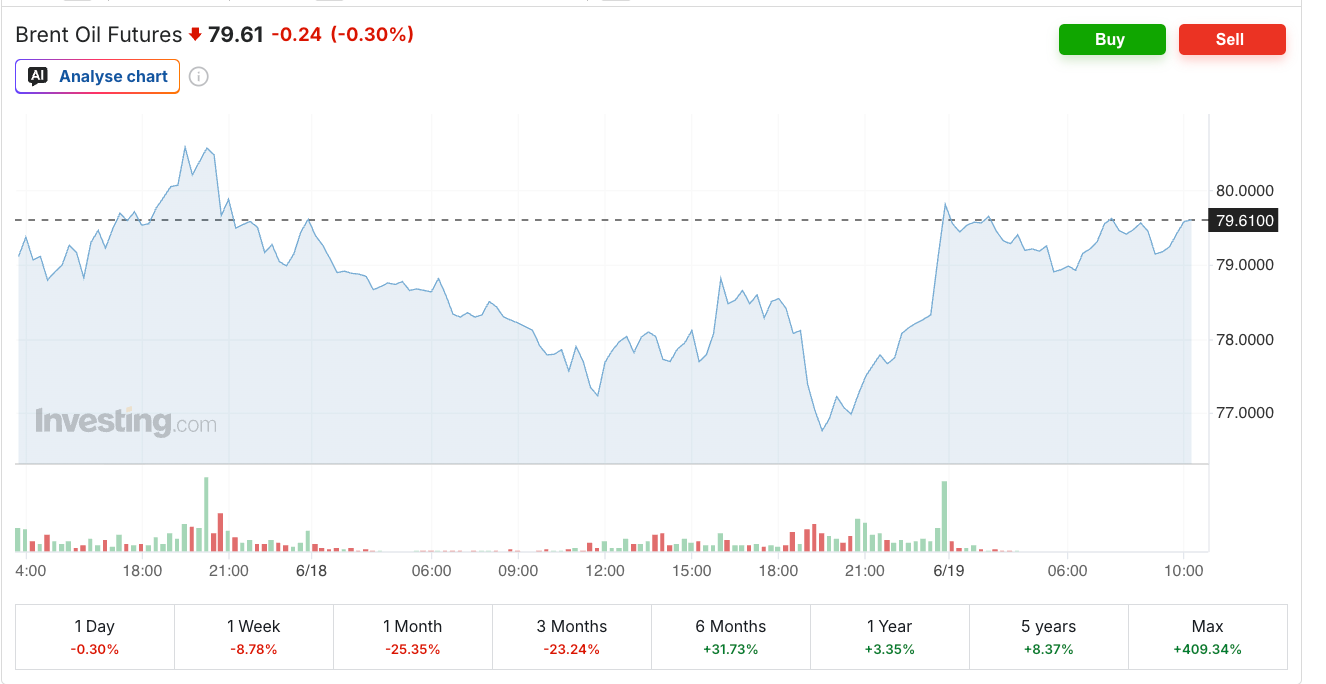
Brent crude just logged its steepest weekly drop in months, yet the Bitcoin (BTC) price barely budged. For the record, Brent is down 9% week-on-week against BTC’s 1%. That split is testing the oil and Bitcoin link many traders and market experts treat as a rule.
Several market participants read falling oil as a green light for a Bitcoin rebound. The real story runs through inflation, market positioning, and the network’s own miners, and it points somewhere unexpected.
Why Traders Tie Bitcoin’s Bottom to Falling Oil
Brent crude, the global oil benchmark, slid below $80 this week, down about 9%. WTI crude, the US benchmark, fell with it toward the mid-$70s.


The US-Iran deal to reopen the Strait of Hormuz drove crude sharply lower.
A view circulating among traders holds that whenever oil collapses, Bitcoin carves a macro bottom soon after. Some expect oil to climb again later this year on renewed Iran-Israel tension and a probable Hormuz toll. That rebound, they argue, would force one final Bitcoin flush that marks the low.
Meanwhile, that risk is not imaginary. Iran just suspended its 60-day talks with the US, which could lift crude again. Yet one price relationship rarely tells the full story, and five years of data barely back the Bitcoin oil link.
Five Years of Data Show the Bitcoin Oil Link Barely Exists
Over five years, the Bitcoin oil correlation with crude sits at just 0.036. Correlation runs from +1, where assets move in lockstep, to −1, where they move opposite. At 0.036, oil and Bitcoin show no reliable link.

Still, one average number can mislead. It is often suspected that the link only appears when oil turns turbulent. So we split the history into two groups, calm oil markets and wildly swinging ones. If oil and Bitcoin behaved differently in each, a single figure would blur it.

Even split, both readings come back near zero. The correlation is −0.02 when oil swings hard and +0.05 when it stays calm. Both sit close to zero, so neither setting shows a true link.
Want more token insights like this? Sign up for Editor Harsh Notariya’s Daily Crypto Newsletter here.
The latest 30-day reading is −0.21. That means oil and Bitcoin have drifted slightly opposite lately (agreed), but only weakly. In short, no market condition makes oil a reliable driver of Bitcoin.
The chain from oil to Bitcoin is also partly broken. Oil moves breakeven inflation, the market’s gauge of expected price growth, at a moderate 0.41. However, that inflation signal barely reaches real yields, which are bond returns after inflation. Those yields tie only weakly to Bitcoin. Therefore, the Bitcoin-Oil link loses its steam while traveling from the first point to the last.
Instead, the more direct pressure now comes from the Fed. New Chair Kevin Warsh held rates on June 17, and nine of 18 officials projected a 2026 hike.
Therefore, rate policy reaches Bitcoin faster than crude does. If oil is not steering Bitcoin, the next question is what is, and the charts point to behavior.
When Oil Spiked, Bitcoin’s Strongest Hands Held
History makes the point. When Brent hit a cycle high near $119 in late March, Bitcoin held steady instead of breaking down.

Long-term holders, the wallets that keep coins for many months (over 155 days), kept adding through that stretch. Their net position stayed positive into June, a clear shift from the heavy selling of late 2025. That pattern suggests the most patient owners were not rattled by costly oil.

The one genuine oil-Bitcoin link runs through mining. Energy is the main input to producing Bitcoin, so sustained high oil can squeeze miners’ margins. Yet the Bitcoin hash rate, the total computing power securing the network, has been rising recently even as WTI falls. Rising hash rate into cheaper energy points to miner conviction, not capitulation.
What’s interesting is that the hash rate remained steady even when the oil prices surged in March.

With holders and miners steady, the pressure is coming from a different place, the derivatives market.
What Is Really Pressuring Bitcoin Right Now
The pressure shows up in derivatives. Bitcoin open interest, the total value of active futures contracts, has climbed since June 11. It rose from $21.83 billion to about $23.45 billion. Over the same days, the Bitcoin funding rate flipped from roughly +0.0023% to about −0.002%.
Funding is the regular payment swapped between long and short traders. A negative reading means shorts now pay longs, a bearish tilt. More contracts plus negative funding suggests traders are building short bets, not going long on the oil-driven dip.
The logic matters. If cheaper oil were directly bullish, positioning would lean long. Instead it leans short. That setup could spark a short squeeze. In a squeeze, a small bounce forces shorts to buy back and cover, which speeds up gains.

Here is the trap. If that squeeze fires, many will again credit falling oil for the lift. But the bounce would come from shorts covering, not from crude. The underlying sentiment stays negative, so any push would be mechanical, not a clean oil signal.
For now, the Bitcoin oil link is too weak to drive the tape. Brent trades near $79, down about 9% on the week. Bitcoin sits near $62,800, roughly half its October record near $126,200, yet down just 1% over the same stretch. The next real move likely hinges on funding and the Fed, not the oil price.
If shorts capitulate, a squeeze could lift Bitcoin fast. If the Fed stays hawkish, the pressure holds, with or without oil. Oil still shapes inflation and the Fed’s path. But the Bitcoin oil link loses steam at each stage of that chain, fading before it reaches price.
The post Bitcoin Didn’t Care about the Oil Market Recovery, 5-Years of Data Shows Why appeared first on BeInCrypto.
Key Takeaways
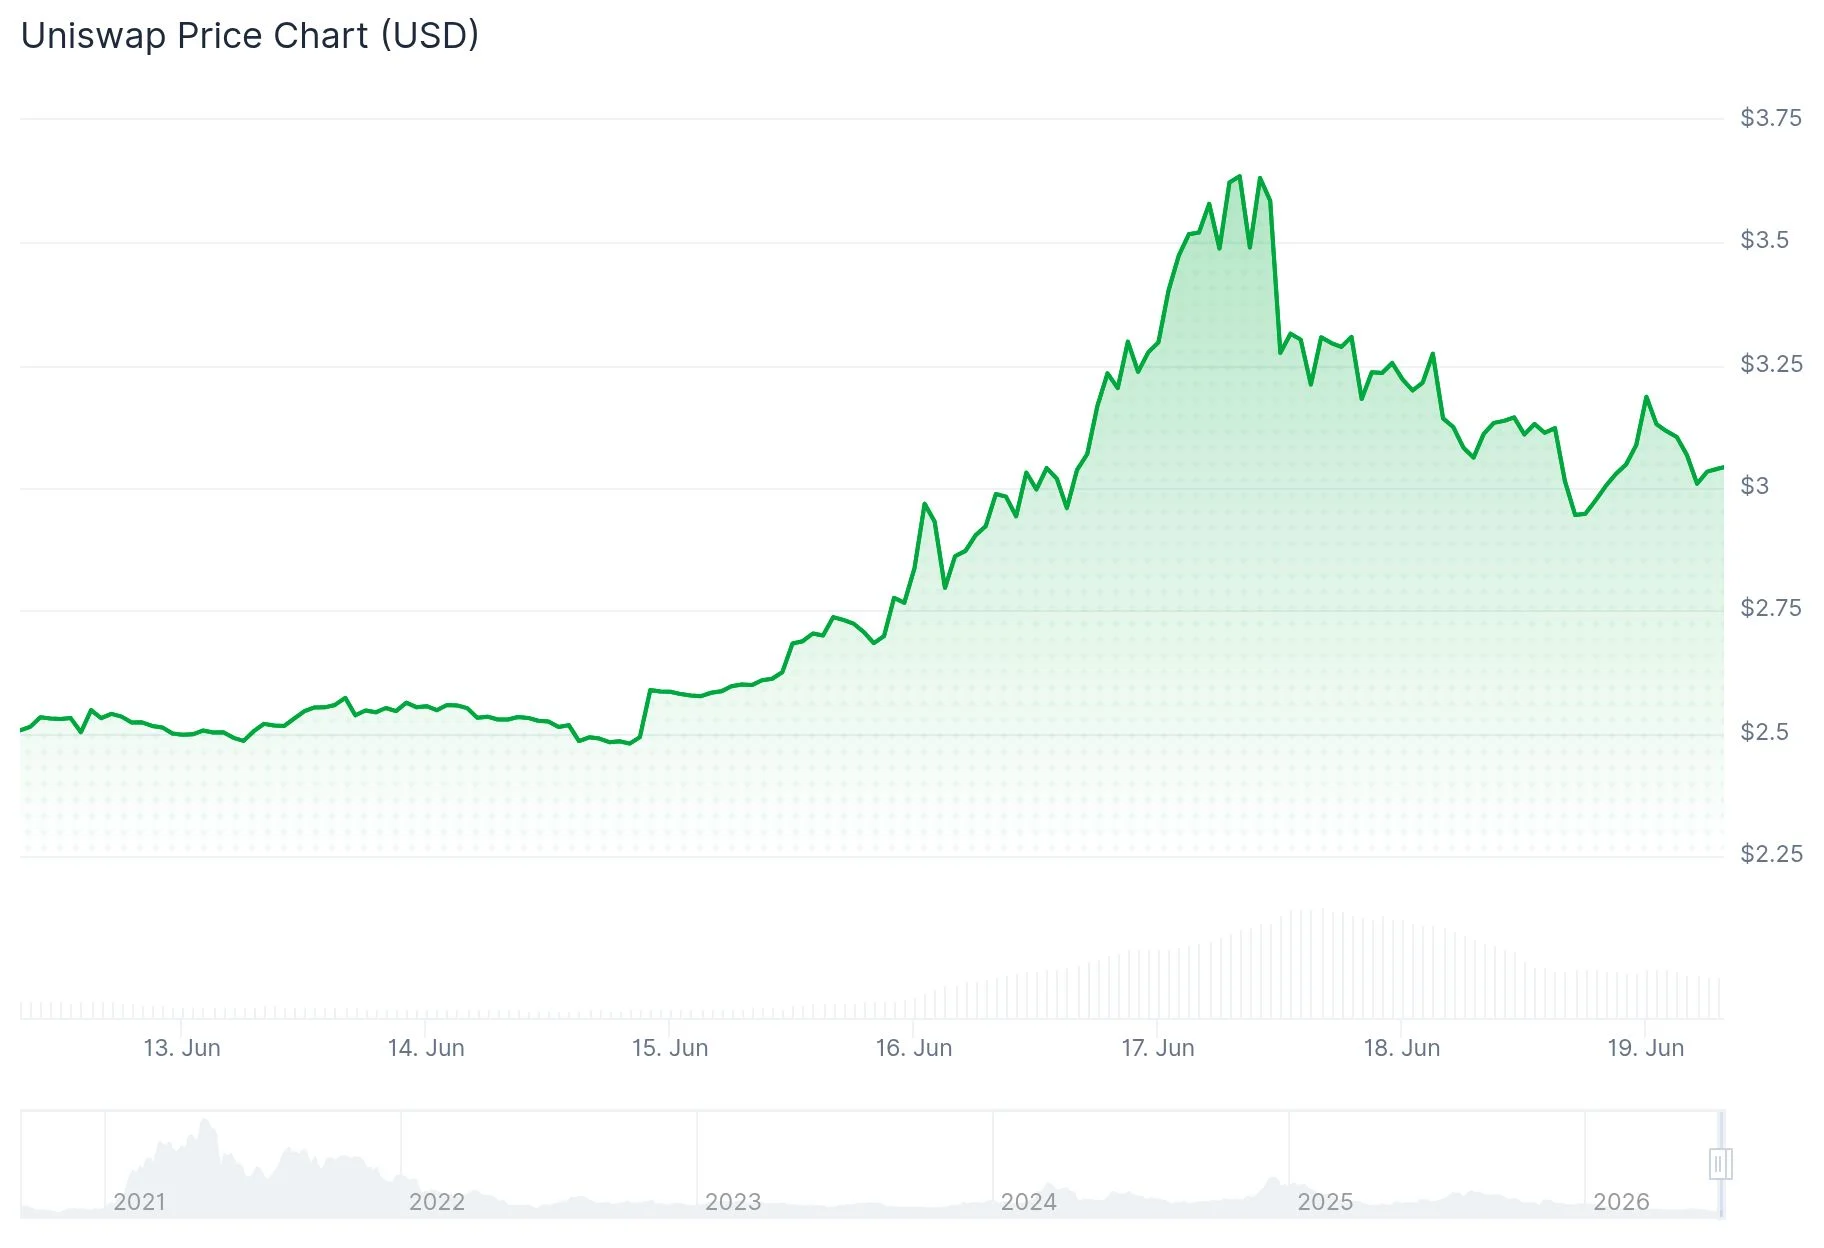
- A major banking institution established an ambitious $100 valuation target for UNI, catalyzing significant blockchain network activity
- Large-holder transactions reached their highest level in seven months immediately after the bullish price projection
- Network participants rose to levels not seen since October
- Daily wallet generation experienced its most significant jump since the final weeks of December
- The token is approaching critical resistance around $3.30, with $4.13 representing the subsequent major barrier
The blockchain metrics for Uniswap are displaying their most robust signals in several months. What sparked this shift? Standard Chartered, a prominent global financial institution, issued a $100 price projection for the protocol’s native token.

Blockchain analytics provider Santiment documented the activity spike immediately following the announcement. Their findings reveal widespread increases across numerous network indicators, signaling a resurgence in market attention toward UNI.
Participating addresses across the Uniswap protocol surged to their highest point in four months. Simultaneously, high-value transfers — substantial movements generally associated with institutional participants — hit a seven-month maximum.
Wallet creation also experienced a notable jump. Santiment documented the most substantial one-day growth in fresh UNI addresses since December’s closing weeks, further confirming the heightened engagement.
The analytics firm attributes this entire wave of activity to Standard Chartered’s price projection, rather than any protocol developments or technical updates.
Major Holders Accumulate at Levels Unseen in Months
Cryptocurrency market observer Zayn, known as @Zaynnode on X, disclosed a $10,000 spot purchase in UNI. He highlighted that the token had reversed an entire month’s worth of negative price movement within just several days. Zayn observed that UNI is currently positioned near price levels that preceded its significant 2020 rally, stating he’s building his spot holdings and allowing market forces to play out.
Institutional participants entering positions before widespread market movement represents a behavioral pattern closely monitored by market participants. The seven-month peak in substantial transactions indicates that significant stakeholders are establishing positions in anticipation of potential price appreciation.
The banking giant’s $100 forecast implies considerable upside potential from present valuations. This projection has redirected market focus toward Uniswap’s standing as a premier decentralized trading platform within the ecosystem.
Token Nears Critical Technical Threshold
From a technical perspective, UNI has remained confined within a descending formation for several months — characterized by progressively lower peaks and troughs. Recent purchasing momentum has elevated the asset toward the upper boundary of this formation, approximately $3.30.
Prior upward movements have encountered resistance at this zone. Surpassing this threshold would represent the first significant structural change in market dynamics for 2026.
The subsequent resistance objective stands at $4.13, representing a crucial level on the daily timeframe. Should bullish momentum persist, market observers have identified $6.34 as the following target. Conversely, price support exists within the $2.80–$2.90 zone.
Santiment’s analysis confirms that network engagement across Uniswap has climbed to multi-month peaks, propelled exclusively by the major bank’s valuation forecast.

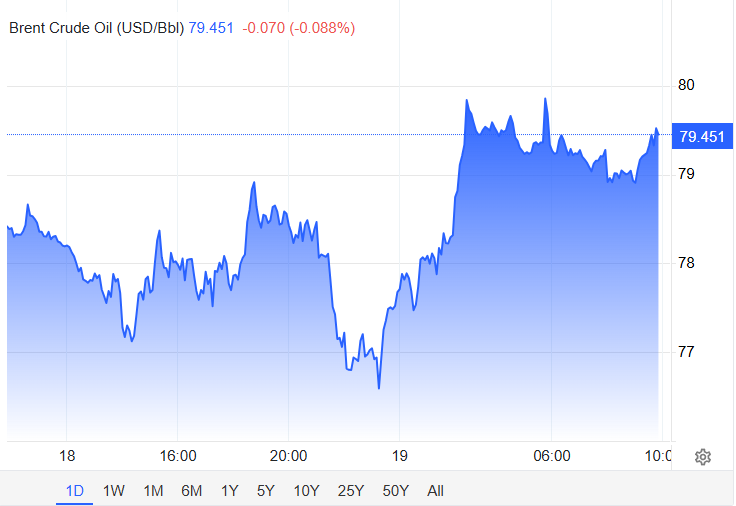
Brent crude traded at $79.46 a barrel on June 18, down roughly 30% from $112.93 a month ago, and with the Strait of Hormuz now open and ships moving again, many expected prices to fall further still. They haven’t.
The answer comes down to the forces quietly keeping a floor under crude even as supply returns.
Open Does Not Mean Flowing
Around 500 commercial vessels remain stranded inside the Persian Gulf, according to maritime intelligence firm Kpler, and the narrow strait cannot clear them at once. Hormuz shipping traffic remains a fraction of pre-war levels, with ship captains, insurers, and owners waiting for confirmed mine clearance and a return to internationally recognized transit lanes before committing their vessels.

The Energy Information Administration’s June outlook assumed Hormuz stays effectively closed through most of the summer, with oil shipments only ramping back toward pre-conflict traffic levels in early 2027.
Producers Face Their Own Timeline
Restarting oil fields shut in for over three months is not a switch that flips overnight. Claudio Galimberti, chief economist at Rystad Energy, put it plainly in a statement to the Associated Press.
“Sentiment has clearly improved. But sentiment is not the same as supply. It will take time for production to ramp back up, for logistics to normalize, and for the risk premium embedded in crude prices to dissipate.”
Economists at Capital Economics estimate energy flows could reach 80% of pre-war levels by September. Iraq, whose fields sustained deeper shut-ins, may need close to a year to fully recover.
Markets are also pricing in the possibility that the Iran deal doesn’t hold. The ongoing US Navy presence in the Gulf, combined with uncertainty over Iran’s compliance, means traders haven’t fully priced out a geopolitical disruption. That residual risk premium is acting as a price floor.
The post Strait of Hormuz Is Open: So Why Hasn’t Oil Crashed Harder? appeared first on BeInCrypto.
Wings Over Scotland | A Fishy Tale

Tori Penso leads historic all-women refereeing team at FIFA World Cup | FIFA World Cup 2026

Accenture makes three-pronged OT security acquisition for $4.17bn


![THIS WILL END BADLY FOR BITCOIN!!!!!!!!!! [SPACEX IPO]](https://wordupnews.com/wp-content/uploads/2026/06/1781858709_maxresdefault-80x80.jpg)

-

 Business5 days ago
No Jackpot Winner as $257 Million Prize Rolls Over to $269 Million Monday Draw
-

 Fashion7 days ago
Weekend Open Thread: Tuckernuck – Corporette.com
-
 Crypto World4 days ago
Zimbabwe Requires Crypto Businesses to Register Annually Under New FIU Regulations
-

 Crypto World6 days ago
Bitget enters Argentina’s regulated crypto market through PSAV registration
-

 Tech6 days ago
NanoClaw integrates JFrog registries to secure AI agent downloads
-

 Tech7 days ago
This Week In Security: Microsoft On Microsoft, Register Your Domains, Linux On ARM, And FreeBSD Joins The File Cache Club
-

 NewsBeat7 days ago
FBI searches office of Ohio voter registration group
-
 Entertainment5 days ago
Matt Damon’s Viral Sci-Fi Thriller Has Taken Over HBO Max
-

 Business5 days ago
Anthropic staff to meet White House officials next week, Axios reports
-

 Tech5 days ago
As AI companies race to go public, who else is along for the ride?
-
 Crypto World5 days ago
Bitcoin could crash to $48,000, if this historical pattern is triggered
-

 Politics5 days ago
“Israel’s” ban on ICRC visits ruled illegal, but Knesset moves to stop them permanently
-
 NewsBeat5 days ago
Warning of disruption as Cardiff Crossrail works to start
-

 News Videos5 days ago
Financial Accounting | Last Day Revision Strategy and Booster | CMA Inter – June 2026
-
 NewsBeat5 days ago
Tributes to former deputy head teacher at Cambridge school among death and funeral notices
-
 Crypto World5 days ago
Market Preview: SpaceX (SPCX) IPO Record, Federal Reserve Meeting, and Iran Nuclear Agreement
-
 NewsBeat5 days ago
what doctors are seeing in ebike crashes
-

 Entertainment5 days ago
Deion Sanders Shares Powerful Post After Viral Advice To Deiondra
-
 Entertainment5 days ago
Kate Middleton Glare Goes Viral After Kids Booed At Royal Event
-

 Business5 days ago
Invesco Quality Income Fund Q1 2026 Commentary
You must be logged in to post a comment Login