
Crypto World
BNB price compresses into a rising wedge with $580 target
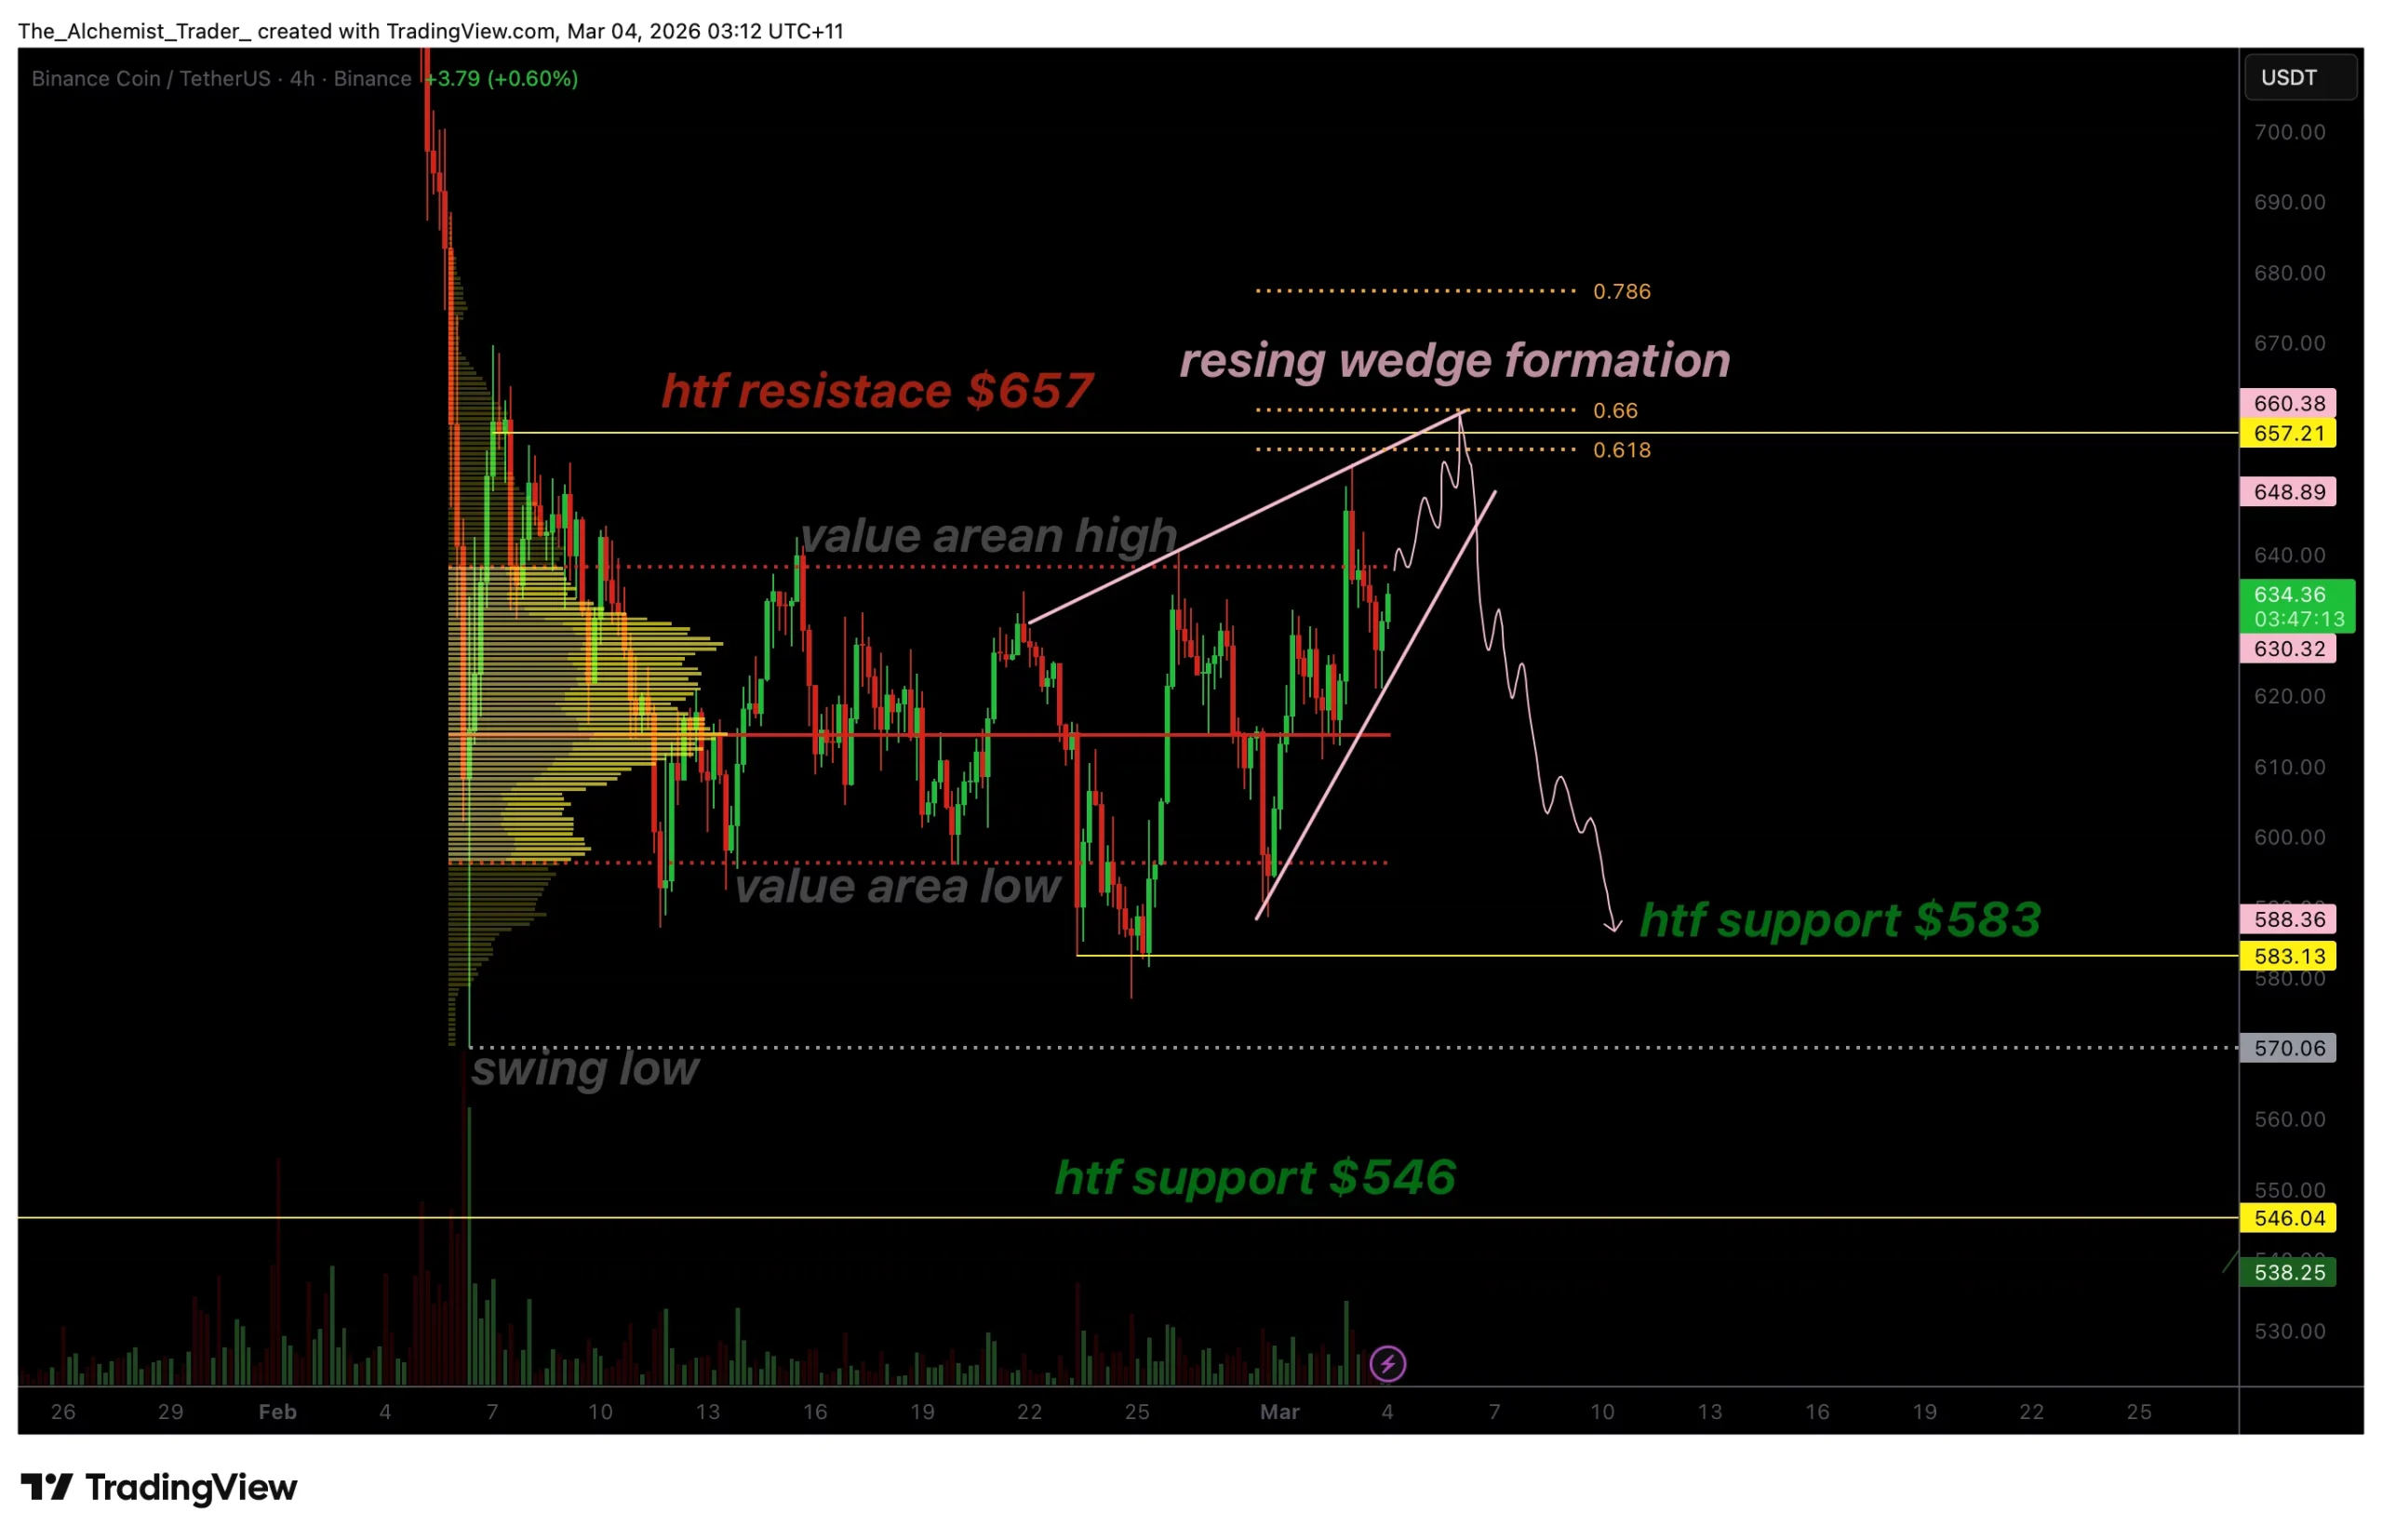
BNB price is trading within a rising wedge formation, a structure that often precedes bearish breakdowns. With price nearing major resistance near $657, a move toward $580 becomes increasingly likely if support fails.
Summary
- Rising wedge pattern signals potential bearish breakdown
- $657 resistance aligns with 0.618 Fibonacci confluence
- Breakdown targets $583–$580 high timeframe support
BNB’s (BNB) recent price action reflects a corrective phase rather than a confirmed bullish expansion. While the asset has been gradually pushing higher, the structure of the advance suggests weakening momentum.
The development of a rising wedge pattern, combined with heavy overhead resistance, places the market at a critical inflection point where downside risk is building.
BNB price key technical points
- Bearish Pattern: Rising wedge formation nearing apex.
- Major Resistance: $657 aligns with 0.618 Fibonacci and wedge resistance.
- Downside Target: Breakdown projects toward $583–$580 support.
BNB is currently compressing within a rising wedge, a pattern characterized by higher highs and higher lows that converge over time. Although price appears to be trending upward, rising wedges are typically considered bearish formations, particularly when they develop after corrective rallies rather than strong impulsive moves.
At present, price is trading near the Value Area High, approaching a major resistance cluster near $657. This level aligns with the 0.618 Fibonacci retracement and overlaps with the upper boundary of the rising wedge. The convergence of these resistance factors creates a technically significant supply zone where sellers may reassert control.
The market is now positioned near the apex of the wedge formation, meaning volatility compression is reaching its limit. In such setups, price often breaks decisively in one direction once liquidity builds sufficiently. Given the bearish characteristics of the structure, the probability slightly favors a downside resolution.
For the pattern to activate, BNB would need to break below the lower boundary of the wedge. This confirmation would require a decisive close beneath the Value Area Low, signaling acceptance at lower prices.
A breakdown accompanied by expanding volume would validate the bearish thesis and increase confidence in a corrective move, even as Binance introduces seven AI-powered agent tools aimed at automating trading, data analysis, and risk management workflows.
Should this scenario unfold, the next high timeframe support sits near $583–$580, which represents the broader range support and prior structural demand. This level becomes the primary downside target in the event of a wedge breakdown.
From a market structure perspective, BNB remains within a corrective environment. Despite recent upward movement, the asset has not yet reclaimed significant high timeframe resistance on a sustained basis. Until the $657 zone is decisively broken and converted into support, upside continuation remains uncertain.
Volume dynamics also warrant attention. Breakouts from wedge patterns typically require increased participation to confirm direction. A surge in selling volume during a breakdown would reinforce the bearish case, while strong bullish volume pushing above $657 would invalidate it.
The technical setup currently leans bearish, with downside risk emerging should lower support fail, even as Senator Richard Blumenthal has opened a Senate inquiry into Binance over reports it processed $1.7 billion in transactions tied to sanctioned entities, adding regulatory uncertainty to the broader landscape.
What to expect in the coming price action
BNB remains vulnerable while trading within the rising wedge and below $657 resistance. A confirmed breakdown below the Value Area Low would activate the pattern and project a move toward $580 support.
Conversely, a strong breakout above resistance with volume expansion would negate the bearish setup and shift momentum back to the upside.

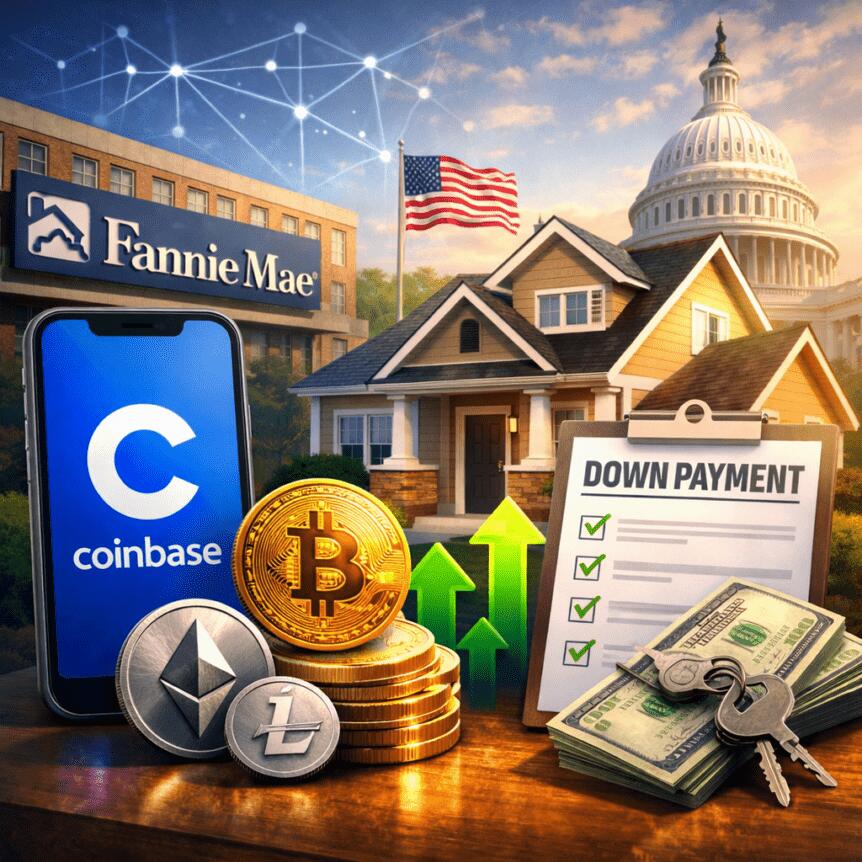
Crypto exchange Coinbase Global has launched a mortgage structure with Better Home & Finance that lets qualified borrowers pledge digital assets held in Coinbase accounts to fund down payments on standard conforming mortgages designed in accordance with Fannie Mae guidelines.
According to Coinbase, the structure enables borrowers to pledge digital assets such as Bitcoin (BTC) or USDC (USDC) as collateral for a separate loan used to fund the down payment, while the primary mortgage remains a standard, Fannie Mae–backed loan. Better will originate and service the mortgages.
When rolled out, the new development could mark a shift in how crypto assets are used in US housing finance, extending their role from qualifying assets in underwriting to a more direct component of mortgage financing.
The news follows earlier regulatory signals to integrate crypto into mortgage frameworks. In June, the US Federal Housing Finance Agency directed Fannie Mae and Freddie Mac to prepare proposals to recognize cryptocurrency as an asset in mortgage risk assessments without requiring conversion to US dollars.
It also builds on a series of developments integrating crypto into home lending, with lenders like Newrez and Rate recently recognizing crypto holdings in underwriting, signaling a broader push to embed crypto across the mortgage stack.
Cointelegraph reached out to Fannie Mae for more information but did not receive a response before publication.
Pledging crypto for down payments comes with added risks
According to Coinbase, borrowers would take out a standard conforming mortgage while using a separate loan secured by crypto holdings to cover the down payment.
The setup allows buyers to retain exposure to digital assets, but replaces upfront cash with additional debt.
Related: Crypto mortgages in US face valuation risks, regulatory uncertainty
Coinbase said the model introduces constraints tied to pledged assets, with borrowers unable to trade collateral while it is locked.
The company said market volatility alone does not trigger margin calls as long as borrowers continue making payments, and mortgage terms remain unchanged once the loan is active.
The model also introduces new risks tied to the pledged assets. While price swings do not directly affect the mortgage, they may still influence borrower risk exposure and financial decisions over time.
Lenders have been gradually integrating crypto into mortgage underwriting
The new development follows several US lenders that recently incorporated crypto assets into mortgage processes.
On Jan. 17, loan servicer Newrez said it would allow borrowers to use BTC, Ether (ETH), crypto ETFs and stablecoins as qualifying assets in underwriting, without requiring liquidation.
On Feb. 23, mortgage lender Rate launched its RateFi program, which allows verified crypto holdings to count toward reserves and, in some cases, income. However, borrowers are still required to convert their crypto into cash for down payments and closing costs.
Ex-Congressman Ryan frames crypto as a housing tool
Ahead of the rollout, Cointelegraph’s Turner Wright spoke with former Ohio Representative Tim Ryan, a member of Coinbase’s advisory council who has focused on middle-class affordability, including housing.
Ryan cast mortgage financing as a practical, real-world use case for crypto, arguing that digital assets can unlock wealth for early investors and help address one of the biggest barriers to homeownership — the down payment.
“Digital assets have a place for working-class people… all the way down to getting a home,” Ryan said. “To see the industry move into… the housing sector… is a really huge deal.”
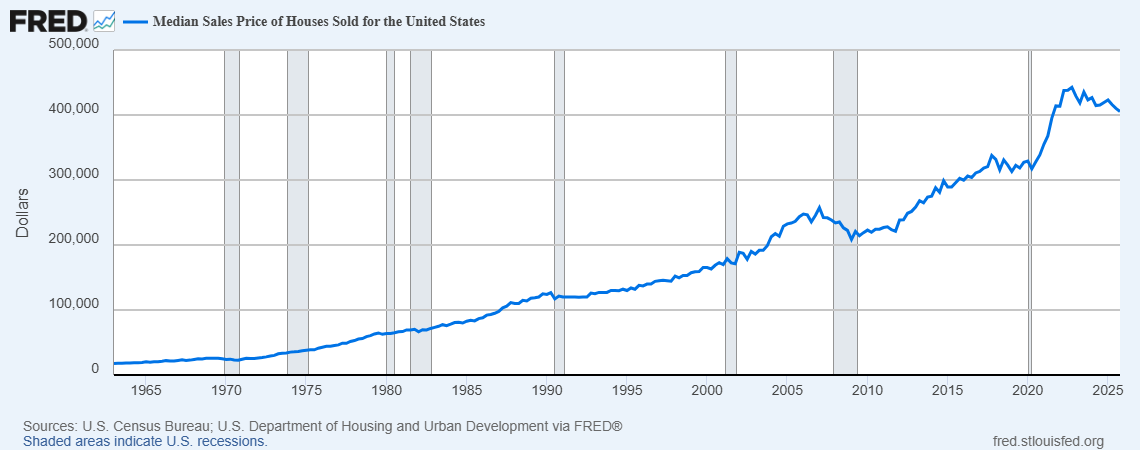
Affordability remains a major challenge for US homebuyers. Despite slower activity tied to low inventory and elevated mortgage rates, the average home price still exceeded $405,000 in the fourth quarter.

A 20% down payment, often required to avoid private mortgage insurance, would still cost buyers more than $80,000, a hurdle that could be less challenging now for crypto investors.
Additional reporting by Sam Bourgi and Turner Wright.
Related: Bitcoin ‘compression’ outcome may send BTC to $80K: Analyst
Magazine: Nobody knows if quantum secure cryptography will even work

Fenbushi Capital co-founder Bo Shen has reignited the chase for assets stolen in a 2022 wallet breach tied to a compromised seed phrase. Shen announced a bounty of 10% to 20% of any recovered funds, payable to individuals or organizations contributing meaningfully to the recovery. In parallel, on-chain investigators have already frozen roughly $1.2 million in related assets as fresh leads reshape the tracing narrative.
Shen first disclosed in November 2022 that about $42 million in crypto had been drained from his personal wallet, a loss he said did not affect Fenbushi-related entities. SlowMist, a blockchain analytics and forensics firm, later attributed the breach to a mnemonic seed phrase compromise. The renewed effort, Shen said, follows investigators developing new leads and a clearer view of how the stolen funds moved across chains and through exchanges. Still, as with many asset-recovery efforts in crypto, there is no guarantee of full restitution.
Key takeaways
- Investigators have already frozen about $1.2 million in related assets as new tracing techniques come online.
- Bo Shen’s bounty offers 10% to 20% of recovered assets, with rewards distributed after recovery is achieved.
- Stolen funds were originally estimated to comprise roughly $38.2 million in USDC, 1,607 ETH, nearly 720,000 USDT, and 4.13 BTC, and they were moved through exchanges such as ChangeNow and SideShift.
- Advances in AI-driven data analysis and on-chain forensics are expanding the ability to track asset flows across chains and platforms in seed-phrase breach scenarios.
- The outcome remains uncertain, but the case could serve as a practical test case for new tools and cross‑agency coordination in crypto security investigations.
A renewed hunt: from a 2022 breach to today’s tracing frontier
The 2022 incident marked a high-profile reminder of how quickly digital assets can be drained when seed phrases are compromised. Shen’s initial disclosure outlined a loss of roughly $42 million, describing it as personal wealth shorn from his own wallet rather than from Fenbushi-managed funds. In the months that followed, SlowMist attributed the breach to mnemonic phrase exposure, a two-step reality check for users and firms alike: seed phrase security remains foundational, yet defense-in-depth across custodial and cross-chain channels continues to evolve.
What changes now is not just the potential recovery of funds but the methodological leap in tracing capabilities. Shen notes that earlier, on-chain tracking and cross-chain forensics were more limited, constraining the ability to map flows as assets moved through wallets, exchanges, and liquidity venues. The latest wave of investigations leverages AI-assisted data analysis and more sophisticated on-chain forensics to identify transaction patterns, link addresses, and reconstruct asset paths with greater confidence. This shift is partly why the effort has gained renewed momentum after years of limited visibility.
Assets in play and how they traveled
According to SlowMist, the assets believed to have been stolen included about $38.2 million in USDC, 1,607 ETH, nearly 720,000 USDT, and 4.13 BTC. These funds did not remain static; they were subsequently moved through various channels and, at times, routed through centralized exchanges and swap services. The report notes that paths to recoveries were traced via routes that included platforms such as ChangeNow and SideShift, underscoring the challenge of cross‑exchange reconciliation in a fragmented, multi‑ledger environment.
The ongoing recovery effort cites the involvement of prominent on-chain researchers and investigators who have helped freeze assets in transit. Notably, the on-chain researchers identified in the public discourse contributed to actions that froze about $1.2 million of the missio funds. While this figure is a partial win, it also highlights how swiftly funds can fragment and reappear across pools and rails, complicating efforts to secure a full restitution.
The bounty and the evolving role of forensics
The bounty framework introduced by Shen is notable for two reasons. First, it aligns incentives around the asset-recovery process in a field where cooperation among individuals, firms, and exchanges is often essential but not always straightforward. Second, it reflects a broader trend in crypto security: using tangible rewards to mobilize disparate actors into coordinated action, especially when traditional legal avenues may be slower or less effective in a borderless ecosystem.
Shen’s announcement also foregrounds a shift in what researchers and investigators can offer beyond standard disclosure and reporting. By tying compensation to successful recovery, the effort implicitly endorses more aggressive tracing and collaboration across platforms. It also places a spotlight on the capabilities of on-chain analytics to parse histories that span multiple chains and custodial arrangements—an area where AI-enabled tooling is increasingly becoming a differentiator for investigators and security firms alike.
What this means for investors and the ecosystem
For investors and builders, the Bo Shen initiative illustrates both risk and progress. On the one hand, seed-phrase compromise remains a persistent risk vector; the value of robust key management and hardware wallets, combined with best practices for seed storage, remains undiminished. On the other hand, the case signals that the industry is gradually building a more effective toolkit for tracing and recovering misused assets. The involvement of high-profile figures in the space, coupled with the procedural use of bounties, could persuade more participants to collaborate openly when breaches occur, potentially accelerating the identification of compromised funds and their trajectories.
From a market perspective, the development suggests a growing willingness among insiders to publicly address losses and pursue remedies through non-traditional channels. It also highlights the ongoing tension between privacy, traceability, and accountability in the crypto world. While full restitution is far from guaranteed, the partial freezing of funds demonstrates the practical utility of advanced forensics and coordinated responses in reducing the velocity with which stolen assets can vanish from the system.
What to watch next
Readers should monitor updates on the recovered assets and any progress toward tracing additional funds. The outcome of the bounty—whether and how much of the $42 million ultimately surfaces—will hinge on ongoing forensic work, the cooperation of exchanges and liquidity venues, and the efficacy of the tracing methods being deployed. The case could set a precedent for future crypto-security investigations, especially in scenarios where seed-phrase compromises intersect with cross‑chain activity and exchange liquidity.
As investigators press forward, market participants will be watching how AI-driven analytics and contemporary on-chain forensics continue to reshape asset tracing. While uncertainty remains, the evolving toolkit offers a clearer picture of how complex thefts unfold—and how cooperative, incentive-driven efforts might improve chances of recovery in the volatile landscape of digital assets.
Stay tuned for further disclosures as the recovery effort progresses and more details about the new leads, the scope of recovered funds, and the mechanism for bounty payouts become available.
Coinbase Global has unveiled a mortgage structure with Better Home & Finance that would let qualified borrowers pledge digital assets held in Coinbase accounts to fund the down payment on a standard conforming mortgage backed by Fannie Mae. In the arrangement, borrowers would secure a separate loan—backed by their crypto holdings, such as Bitcoin or USDC—to cover the down payment, while the primary mortgage remains a conventional Fannie Mae–backed loan. Better will originate and service the mortgages.
Coinbase describes the model as enabling buyers to keep exposure to digital assets while using a crypto-backed loan to cover the down payment. In effect, the down payment is funded by a separate crypto-collateral loan, while the main loan stays tied to traditional mortgage underwriting. If the rollout proves scalable, the approach could widen crypto’s role in U.S. housing finance beyond qualifying assets to a direct funding mechanism for home purchases.
The development arrives amid broader regulatory signals about integrating crypto into mortgage frameworks. In June, the U.S. Federal Housing Finance Agency directed Fannie Mae and Freddie Mac to prepare proposals recognizing cryptocurrency as an asset in mortgage risk assessments without requiring conversion to dollars. The momentum also aligns with a string of underwriting innovations from lenders such as Newrez and Rate, which have begun incorporating crypto holdings into mortgage processes.
Key takeaways
- A crypto-backed down payment option pairs a standard conforming mortgage with a separate loan secured by digital assets to fund the down payment.
- The primary mortgage remains Fannie Mae–backed; crypto exposure is retained via the down payment loan, not through liquidation of assets.
- Regulators are signaling openness to counting crypto assets in mortgage risk assessments, potentially paving the way for broader crypto integration in housing finance.
- Lenders like Newrez and Rate have already integrated crypto into underwriting, although down payments and closing costs may still require cash in some programs.
- Borrowers face constraints such as locked collateral and market-volatility considerations that do not automatically trigger margin calls, according to Coinbase.
A new path for crypto in housing finance
Under the Coinbase–Better structure, a borrower would take out a standard conforming mortgage, while a separate loan secured by crypto holdings funds the down payment. The crypto collateral can include assets such as Bitcoin or stablecoins like USDC, but borrowers would not be allowed to trade the pledged assets while they are locked as collateral. Coinbase notes that price swings do not trigger margin calls as long as the borrower keeps making mortgage payments and the loan terms remain unchanged after activation. This approach, if widely adopted, would embed crypto more deeply into the mechanics of home financing rather than merely serving as an underwriting asset.
Better will handle the origination and servicing of the primary mortgage, while the crypto-backed down-payment loan would be a separate obligation. For investors and borrowers, this structure introduces a new dynamic: crypto assets remain a part of the balance sheet and potential wealth-building narrative, but introduce added debt and liquidity considerations tied to market volatility.
Regulatory signals and industry momentum
The initiative comes amid a broadening discourse on crypto’s place in mortgage risk assessment and underwriting. The Federal Housing Finance Agency’s directive to Fannie Mae and Freddie Mac in June reflects a push to formalize crypto as an asset category that could influence risk metrics without forcing conversion to dollars. The development sits alongside other industry moves toward crypto-inclusive underwriting, with lenders such as Newrez and Rate having publicly signaled their willingness to recognize crypto holdings in certain underwriting contexts.
Newrez, in January, said it would allow borrowers to use Bitcoin, Ether, crypto ETFs, and stablecoins as qualifying assets in underwriting, without requiring liquidation. In February, Rate launched its RateFi program, which allows verified crypto holdings to count toward reserves and, in some cases, income. However, even in RateFi, borrowers typically must convert crypto into cash for down payments and closing costs, illustrating that the integration is gradual and selective rather than a wholesale replacement of cash for home purchases.
Voices from the policy-adjacent arena
Beyond the mechanics, the transition toward crypto in housing finance has drawn commentary from policymakers and industry observers. Former Ohio representative Tim Ryan, a member of Coinbase’s advisory council who has focused on housing affordability, framed mortgage financing as a practical use case for crypto. He argued that digital assets could unlock wealth for early investors and help address a major barrier to homeownership—the down payment—if the industry moves into the housing sector in a meaningful way.
Affordability remains a central concern for U.S. homebuyers, with persistent inventory constraints and elevated mortgage rates keeping activity constrained even as average home prices have eased from their 2022 peaks. The federal data context underscores the potential appeal of crypto-linked financing to buyers who hold digital assets and seek alternative paths to accumulating a down payment.
As the crypto–mortgage conversation evolves, investors and borrowers will be watching closely for how collateral liquidity, asset valuation, and regulatory alignment interact in real-world deployments. The Coinbase–Better program represents a concrete step in testing crypto as a financing tool within a conventional housing market framework, but it also highlights the importance of clear risk management, valuation standards, and consumer protection as more lenders experiment with crypto-enabled home purchases.
Readers should keep an eye on regulator guidance and lender rollouts in the coming months, which will indicate whether crypto-backed down payments move from a pilot concept to a deployable regional or national option.

Key Highlights
- Waymo’s autonomous vehicles have logged 170.7 million miles in rider-only mode, achieving approximately 10 times fewer serious accidents than human-operated vehicles
- Morgan Stanley maintains its Buy recommendation on GOOGL with a $330 target, highlighting Waymo’s accelerated expansion timeline
- Evercore ISI sustains its Outperform stance with a $400 price objective following survey data revealing Google’s search market share rose from 70% to 75% between August 2025 and March 2026
- ChatGPT experienced a decline in search market presence from 13% to 11% during the identical timeframe; 52% of generative AI users reported increased Google search activity
- The tech giant has declined approximately 7% in 2026 and sits roughly 17% below its $349 peak from February, though nearly 90% of Wall Street analysts maintain Buy ratings
Alphabet (GOOGL) shares retreated 2% during Thursday’s early session to $285.27, caught in broader market turbulence. The S&P 500 declined 0.8% while the Dow Jones fell 0.4%, as oil prices surged over 4%.
The selloff occurred even as the company received encouraging assessments from two prominent Wall Street firms — Morgan Stanley and Evercore ISI — highlighting strength in both its autonomous driving division and core search business.
Brian Nowak, analyst at Morgan Stanley, maintained his Buy recommendation alongside a $330 price objective, noting that “Waymo continues to scale faster than expected…leading with safety.” The autonomous vehicle unit’s latest metrics, covering operations through December 2025, reveal 170.7 million miles driven without human supervision.
These results exceeded Morgan Stanley’s internal projections.
The safety metrics remain impressive. Waymo documented approximately a tenfold reduction in serious collisions and a fivefold decrease in injury-producing accidents when compared to human-driven vehicles.
Waymo’s service currently spans 10 American metropolitan areas. Nowak anticipates the rollout of 15 additional cities throughout this year, coupled with vehicle fleet expansion in markets already operational. Financial analysts generally project robo-taxi operations will at least double annually over the coming years.
Alphabet is committing substantial capital to support this expansion trajectory. The corporation is expected to allocate over $170 billion toward new infrastructure in 2026 — a significant jump from $91 billion in 2025 — per FactSet estimates. This represents considerable capital deployment, even for a technology giant of this scale.
Google’s Search Dominance Remains Intact
Regarding search operations, Evercore ISI confirmed its Outperform assessment and $400 price objective after publishing findings from its eighth consecutive quarterly proprietary search behavior study.
The research demonstrated Google’s search market penetration expanding from 70% to 75% during the August 2025 through March 2026 period. Simultaneously, ChatGPT’s search presence contracted from 13% to 11%.
Evercore reported no meaningful shift in Google’s portion of commercial-intent queries — activities such as purchasing apparel or reserving travel — across the previous two years.
The investment firm increased conviction in its above-consensus Google Search revenue expansion forecast of 14%-plus for 2026, exceeding Wall Street’s 13% consensus. The outlook incorporates anticipated high-single-digit advancement in both paid click volume and cost-per-click metrics.
One advertiser documented conversion rates that doubled — jumping from 7% in Q1 2025 to 14% in Q1 2026. Advertising expenditure patterns remained generally stable or showed acceleration on a year-over-year basis entering Q1, although Evercore noted some hesitation developing within the past 10 days.
Current Stock Position
GOOGL has fallen approximately 7% year-to-date and trades roughly 17% beneath its 52-week peak of $349, reached in February. The majority of the 2026 decline has materialized following the onset of the Iran conflict.
Notwithstanding the downturn, close to 90% of equity analysts tracking the stock assign it a Buy rating — substantially above the standard 55%–60% Buy-rating percentage for S&P 500 constituents. The consensus analyst price target hovers around $380, elevated from approximately $335 at 2026’s beginning.
Alphabet’s revenue expanded 15% during the trailing twelve months, with analysts projecting 17% growth for fiscal 2026. The equity currently carries a P/E ratio of 26.91 alongside a PEG ratio of 0.77.


The New York Stock Exchange (NYSE) is focused on integrating blockchain technology into existing market infrastructure rather than replacing it, according to chief product officer Jon Herrick.
The exchange is “striving for interoperability” and “building on top of what exists,” as it explores how tokenized assets could function within current systems, Herrick said.
That approach reflects a broader stance on market evolution. “You have to be mindful of the inherent good things of the market that has developed up to now … it’s this balance of both things,” he said on stage at the Digital Asset Summit in New York on Thursday, referring to the need to preserve elements like regulation, clearing systems and investor protections.
Rather than framing blockchain as a replacement for traditional finance, Herrick described a model where both systems merge. “It really isn’t about one side being more right than the other … [they] should, I think, in time, come together.”
His comments come as exchanges, asset managers and banks test tokenization, which allows assets like stocks and funds to be represented on blockchain systems. Advocates argue the model could enable faster settlement, round-the-clock trading and broader global access to markets.
The NYSE is exploring some of those uses, including real-time or near real-time settlement and extended trading hours. The Intercontinental Exchange (ICE), NYSE’s parent, earlier this month made a strategic investment in crypto exchange OKX. ICE will license OKX’s spot crypto prices for crypto futures products, while OKX will offer ICE futures and tokenized equities to its customers in the U.S.
Still, Herrick cautioned that existing systems offer efficiencies that may not be easily replaced. Centralized clearing, for example, helps reduce risk by netting transactions across market participants.
Nevertheless, over time, the distinction between traditional and tokenized assets may fade. “Maybe 10 years from now, whether [a] security is tokenized or not shouldn’t matter,” he said.
For now, the exchange’s strategy suggests a slower, more incremental path forward, introducing blockchain technology gradually into the existing financial system rather than reshaping it overnight.


Canton price is grinding around $0.14 as Visa’s move to become a super validator sharpens the network’s positioning as an institutional, real‑world‑asset settlement chain.
Summary
- Canton is trading around $0.14 today, with a market cap in the $5.2–$5.6 billion range and daily volume near $10–$37 million.
- The token has gained roughly 1–3% over the last 24 hours but remains about 29% below its all-time high from early February 2026.
- Visa’s move to become a super validator on Canton has sharpened the market’s focus on the network’s institutional, real‑world‑asset positioning.
Canton (CC), the native asset of the Canton Network, is changing hands near $0.14 today after a modest intraday rise that keeps the enterprise‑focused chain in the upper tier of real‑world‑asset and institutional L1 tokens by market size. CoinMarketCap lists the live Canton price at $0.140988, with a 24‑hour trading volume of $14,401,836 and a market capitalization of $5.25 billion, based on a circulating supply of roughly 37.28 billion CC. Dropstab’s live feed shows a similar picture, quoting Canton at approximately $0.1463, up 3.20% on the day, with $10.78 million in 24‑hour volume and a $5.56 billion market cap. EmergingGrowth, another market‑data aggregator, records Canton at $0.14 with a $5.24 billion market cap and 24‑hour volume of $36.84 million, highlighting that most sources now cluster CC’s valuation in the low‑teens cents with multi‑billion‑dollar capitalization.
Price performance has been firm but not euphoric. CoinMarketCap’s stats show a 24‑hour range between $0.1368 and $0.1467 and note that Canton is still 29.11% below its all‑time high of $0.1943, set on February 3, 2026, while trading more than 133% above its all‑time low of $0.05895 from December 6, 2025. On a longer horizon, Dropstab reports that the CC/USD pair is up 3.21% over 24 hours but down 14.65% over one month, even as it has gained 40.68% in three months, a profile consistent with a token that ran into early‑year strength, corrected, and is now stabilizing. Cryptoast’s euro‑ and dollar‑denominated dashboard echoes those dynamics, placing Canton’s price at $0.144581, up 2.01% on the day, with 24‑hour volume of $12.3 million and a market cap of $5.5 billion.
By design, Canton Network is a permissioned, privacy‑preserving blockchain for regulated financial institutions, positioned squarely in the real‑world‑asset and institutional infrastructure category rather than retail DeFi or meme speculation. Yahoo Finance’s Canton USD overview and eToro’s live CC market page both underline its function as a settlement and tokenization layer geared toward banks, asset managers and payment firms. eToro quotes the Canton price at $0.14343, showing a 4.55% move over 24 hours, with a market capitalization of $5.33 billion and an all‑time high of $0.19517. Crypto.com’s price widget offers similar figures, listing Canton Network at $0.1421, up 0.48% on the day, with 24‑hour trading volume of $15.12 million and noting that CC is currently about 4% below its seven‑day high.
The key driver behind Canton’s recent visibility has been Visa’s decision to join the network as a super validator. Yahoo Finance reports that Visa will serve as a super validator on the Canton Network, joining a cohort of around 40 major financial institutions in securing and governing the chain. TechFlow adds that Visa submitted its application on March 20 and received approval on March 23, earning the highest validator weight of 10, with plans to leverage the role to support payments, settlement and treasury use cases on Canton while expanding its stablecoin‑related business. French outlet CoinAcademy similarly frames Visa’s move as a milestone in blockchain governance for institutions, emphasizing Canton’s focus on confidentiality and regulatory alignment. Phemex’s news brief confirms that Visa will engage directly in network governance and collaborate with financial institutions to extend Canton’s reach across payment and fund‑management scenarios.
Taken together, these price and news dynamics place Canton alongside other RWA and institutional L1 tokens that have seen renewed attention as banks and payment giants test tokenized assets and on‑chain settlement in early 2026. For readers following live market moves, Canton’s real‑time quote and capitalization can be tracked on the crypto.news market‑cap dashboard, where the Canton price page sits among other RWA and institutional blockchain assets, allowing direct comparison of liquidity, volatility and adoption indicators within this fast‑evolving segment.

STS Digital Introduces Structured Crypto Platform
STS Digital launched a structured products platform for digital assets, targeting institutional clients. The firm announced that Kraken joined as its first distribution partner.
The platform enables access to options-based strategies through predefined investment products. These products wrap derivatives in structured forms, enabling customers to interact with crypto markets in a controlled way. This offering indicates a transition to more advanced financial instruments in the digital assets.
🚨JUST IN: STS DIGITAL LAUNCHES STRUCTURED CRYPTO PRODUCTS WITH KRAKEN AS FIRST INTEGRATION
Crypto options firm STS Digital has launched structured products on digital assets, with @krakenfx becoming its first exchange integration for both retail and institutional traders.
The… pic.twitter.com/RvrH7lvhS9
— BSCN (@BSCNews) March 25, 2026
Kraken has integrated the platform through an API. The exchange uses it to support its Dual Investment product, which offers fixed returns on Bitcoin and Ethereum. This integration expands the exchange’s product range for eligible users.
Jeremy Dominh, head of structured products at STS Digital, stated that the platform aims to broaden institutional access. He noted that clients increasingly seek advanced strategies to manage exposure and generate returns.
Kraken Expands Derivatives Offerings
Kraken is expanding its derivatives product range using this partnership. The integration also adds structured strategies like covered calls to its offerings. These strategies provide alternatives to traditional methods like staking or lending.
Alexia Theodorou, director of derivatives at Kraken, said the collaboration supports product innovation. She added that structured strategies allow clients to pursue returns with defined payoff conditions. This approach helps users navigate volatile market conditions.
In February, STS Digital raised $30 million in a funding round led by CMT Digital. Payward also participated in the round. The firm stated that the funding would support platform expansion and institutional market access.
The platform operates under a license from the Bermuda Monetary Authority. This regulatory framework provides oversight for clients using structured crypto products.
Structured Products Gain Institutional Interest
Structured crypto products are becoming popular among financial institutions. These tools are associated with returns to underlying assets or indices. They pool derivatives into single products with preset payout arrangements.
In 2025, DBS announced tokenized structured notes on Ethereum, signaling ongoing innovation. Other companies further diversify their services related to digital assets and derivatives.
Recent developments highlight this trend. Companies such as Omnes and Apex Group plan to tokenize structured notes linked to Bitcoin hashrate. At the same time, Lombard has partnered with Bitwise Asset Management to provide Bitcoin yield solutions.
Although these products increase opportunities, they carry risks. Market volatility, liquidity constraints, and counterparty exposure remain important factors for institutions embracing more sophisticated crypto investment strategies.

Key Takeaways
- AppLovin shares tumbled approximately 9% Thursday, marking a 35% retreat from its $745 peak earlier this year.
- Bearish traders amplified concerns regarding competitive threats, intensifying downward momentum amid weakening investor sentiment.
- Between March 11-12, CEO Adam Foroughi executed 44 stock sales; days later, a board member offloaded more than 130,000 units.
- Fourth-quarter 2025 performance exceeded expectations: $1.66B revenue (surpassing forecasts), net profit surged 84% annually, yearly free cash flow reached $3.95B.
- Broader economic concerns, including recession possibilities and inflation estimates approaching 4.2%, contributed to the stock’s weakness.
AppLovin shares retreated approximately 9% during Thursday’s session, trading around the $396 level. No adverse company announcements triggered the decline. Instead, the selloff reflected mounting short-seller activity combined with widespread market jitters.
Bearish investors amplified claims questioning the sustainability of AppLovin’s competitive positioning and whether its artificial intelligence-driven advertising technology can maintain market dominance. These arguments gained momentum following a notable spike in executive stock disposals.
CEO Adam Foroughi executed 44 separate stock sales on March 11-12, with transaction prices ranging from $449 to $481 per share. Board member Eduardo Vivas subsequently sold over 130,000 units on March 16, at prices between $446 and $465. During the 90-day period ending March 26, insiders completed 155 transactions with virtually zero purchase activity to counterbalance the disposals.
This selling activity provided ammunition for bearish traders, despite strong fundamental business metrics.
Financial Performance Remains Robust
AppLovin’s fourth-quarter 2025 financial results demonstrated exceptional strength. The company posted $1.66 billion in revenue, exceeding analyst projections by 3.35%. Net profit reached $1.1 billion, representing an 84% year-over-year increase. The adjusted EBITDA margin stood at an impressive 84%.
Fourth-quarter free cash flow totaled $1.31 billion. Annual free cash flow climbed to $3.95 billion—an 89% year-over-year surge. The company deployed $2.58 billion toward repurchasing 6.4 million stock units throughout 2025.
Operating expenses declined to merely 23% of revenue in Q4, compared to 37% in the prior-year period. Such dramatic margin improvement is uncommon in the technology sector.
CEO Foroughi addressed skeptics during the Q4 earnings conference: “When I look at our internal dashboards, we are delivering the strongest operating performance in our history.”
Wall Street analysts remain predominantly optimistic. Morgan Stanley maintains an Overweight recommendation with an $800 price objective. Goldman Sachs holds a Neutral stance at $710. Among all covering analysts, 24 recommend buying, 3 suggest holding, and only 1 advises selling. The average price target stands at $648.
Economic Headwinds Compound Selling Pressure
Broader economic conditions are exacerbating investor concerns. Market participants remain anxious about escalating tensions involving Iran, climbing oil prices, and materially elevated recession probabilities according to economists.
A Thursday OECD report forecast U.S. inflation could reach 4.2% this year—substantially above the Federal Reserve’s recent 2.7% projection from the previous week.
APP has declined 35% year-to-date and fallen 38% over the trailing six-month period. The stock reached approximately $745 at its 52-week high.
For the first quarter of 2026, AppLovin provided revenue guidance of $1.745–$1.775 billion with anticipated adjusted EBITDA margins of 84%. Elevated call option trading activity indicates continued near-term price volatility is probable.


Financial compliance has always been balanced on a delicate line: regulators need sufficient visibility to keep bad actors out, but users want their financial lives kept private just to make a payment or trade. In 2025, that tension is sharper than ever. We have stricter anti-money laundering (AML) rules, broader data-protection regimes, more cross-border activity and, at the same time, better privacy-enhanced technology than we’ve ever had.
The good news is we no longer have to sacrifice privacy to ensure compliance. Zero-knowledge proofs (ZKPs) provide a solution to the so-called privacy paradox: regulators need assurance that rules are followed, but exposing full identities and transaction details creates security, legal, and data protection risks. ZKPs let us flip the model from “show me the data” to “show me a proof,” enabling firms to demonstrate compliance without revealing underlying information.
This approach is not designed to obscure regulatory oversight. Instead, it modernizes the compliance toolset so regulated firms can demonstrate compliance with their legal duties (sanctions screening checks, KYC obligations, segregation of client assets, capital checks) without transferring or exposing the underlying data. ZKPs may be better for users and, in the long term, for regulatory compliance, because proofs are verifiable and tamper-evident.
What zero knowledge actually does
A zero-knowledge proof is a cryptographically powered way of saying: “I can prove to you that I followed rule X, but I won’t show you the sensitive information usually required to prove that.” In finance, “rule X” can be very concrete: “this wallet was screened against the current sanctions list”; “this user holds a valid KYC credential from a trusted issuer”; “this exchange holds client assets 1:1 and they reconcile to liabilities”; “this transaction is below (or within) an allowed range,” and so on.
Today, we can be required by law to report large datasets to specific regulators. We comply with applicable data protection laws, but this also increases the risk of cybersecurity breaches and misuse. A ZK-based approach proves the outcome, not all the inputs. If a regulator needs to go deeper, a process can be designed for selective disclosure of particular required data (viewing keys, time-bound access, and full audit logs, granted under due process as necessary), like a permissioned regulatory portal or window.
Why this matters now
Three trends are converging.
In the EU, supervisors are making anti-money laundering (AML) controls more granular, while GDPR and other privacy regimes emphasise data minimisation and purpose limitation. These can be complementary rather than opposing each other: compliance should provide the same or better assurance with less routine exposure of personal data. This objective may be achieved by utilising privacy-preserving reporting techniques.
Second, digital identity frameworks (such as those envisaged under eIDAS 2.0) are getting closer to reality. They are built on the same building blocks as ZK: verifiable credentials, selective disclosure and cryptographic attestations. That makes it far more realistic to issue portable “I passed KYC” or “I am not sanctioned” credentials that can be proven, not re-collected, across multiple services.
Third, supervisors are exploring privacy-enhancing technologies, including proof verification models.
What a proof-based compliance stack could look like
We already have live examples. ZK-enhanced proof-of-reserves is the best-known one: an exchange proves it has the assets to meet customer liabilities without revealing individual balances. That is a zero-knowledge assurance.
You can do the same for sanctions screening. Instead of sending the full identity every time, a wallet presents a proof that it was checked against the latest list at a specific time. The regulator, or a regulated VASP on the other side, runs a verifier node to confirm the proof is valid and up to date. It is important to note that ‘verifier nodes’ are a policy proposal that operate as an oversight infrastructure for supervisors to validate proofs without collecting bulk data.
You can also do it for segregation: a custodian proves that client assets are not co-mingled with house funds via a range or sum proof, without publishing the entire ledger. You can even layer this into smart contracts: transactions don’t execute unless the proof passes. That is “programmable compliance” – rules enforced at transaction time in ‘real time’, rather than afterwards.
For regulators, the key shift is from collecting raw data to verifying cryptographic evidence. They still get assurance, auditability and traceability when there is a legal basis to unmask. But they do not have to hold or process significant amounts of personal data by default, reducing both operational and legal risk.
Answering key questions
Regulators are already beginning to embrace targeted ZK pilots, ranging from verifiable proof-of-reserves to Travel Rule compliance that validates user attributes without exposing full datasets. As these primitives mature, they naturally scale into market-integrity controls, allowing firms to demonstrate they are within concentration and exposure limits through range and sum proofs without revealing underlying positions.
Critically, ZK is not a synonym for opacity; well-architected systems utilize selective disclosure via viewing or multi-party keys. This ensures that law enforcement access is narrow, provable and subject to due process rather than remaining universal and silent.
What regulators could require
To work across borders, we need standards: standard proof types (e.g., “not on sanctions list X as of date Y”), standard credential formats and standard verifier logic that can be inspected. That is how you avoid every exchange, wallet, or bank building its own version and creating unnecessary supervisory complexity for supervisors.
Concretely, regulators may benefit from six things:
- Outcomes over data (tell me what you proved, not everything you hold);
- Least-information proofs (prove only what is necessary for this obligation);
- Programmable checks (enforced at transaction time where appropriate);
- Strong data-availability and exit mechanisms (users can always confirm their balances and withdraw);
- Verifiable verifier logic (inspections, test vectors, audit logs);
- No generalized backdoors (disclosure only under lawful, narrow, logged processes).
Binance is a global exchange that already uses ZKPs for demonstrating reserves. Our proof-of-reserves (POR) system uses a Merkle tree – a cryptographic structure that condenses many account entries into a single “fingerprint” – together with zero-knowledge proofs to demonstrate that customer assets are fully backed without revealing individual balances. With each POR update, users can confirm that their balance is included in the tree, while ZKPs ensure that the overall totals are correct and that no negative or fake balances are included. The result is independent, privacy-preserving verification of reserves that builds trust without compromising personal data.
But this is bigger than one company. If we get this right, we can make financial compliance more precise, more respectful of privacy law, and easier to supervise.
This will take collaboration. Regulators will need to develop proof standards they accept; industry will need to align on, and incorporate the proof standards, and standard-setting bodies will ensure proof standards are interoperable across borders.
What success looks like
Success is when a user can prove legitimacy without oversharing; a bank, VASP, or exchange can meet AML/Travel Rule obligations with smaller data disclosures; a regulator can run a verifier node and get real-time assurance; and bad actors can be unmasked under clear, narrow, lawful conditions.
In short, assurance with less disclosure. As cyber risk rises, privacy laws evolve, and cross-border digital finance grows, moving from routine bulk data collection to verifiable proofs is a pragmatic upgrade to supervisory practice.
References to EU privacy law in this op-ed reflect the framework as of November 2025; the Commission’s Digital Omnibus proposals remain subject to change through the ordinary legislative process.


Ethena price hovers just under $0.10 as heavy futures leverage, whale withdrawals and a long unlock schedule reshape how ENA supply moves across DeFi.
Summary
- Ethena is trading around $0.098, with daily volume above $225 million and market capitalization close to $840 million.
- Derivatives activity remains heavy, with open interest close to $952 million and futures volume over $830 million in the last 24 hours.
- Recent token unlocks and whale withdrawals from exchanges are tightening liquid supply even as DeFi yield narratives keep Ethena in focus.
Ethena (ENA), the governance token for the synthetic dollar protocol behind the USDe stablecoin, is changing hands at about $0.09831 today, with 24‑hour trading volume of $225.14 million and a market cap of $838.98 million. CoinMarketCap data show ENA’s unlocked market cap matches the headline figure at $838.98 million, while its fully diluted valuation is higher given a total and max supply of 15 billion tokens. The token’s volume‑to‑market‑cap ratio stands at 26.83%, indicating unusually brisk turnover relative to its size and pointing to active trading interest.
ENA sits at the intersection of DeFi and synthetic assets, with 8.22 billion tokens in circulation out of 15 billion total, and roughly 87.89 thousand on‑chain holders according to CoinMarketCap’s statistics page. The project is structured around USDe, a synthetic dollar instrument, and sENA, a staked token used for protocol governance and restaking‑style security, placing Ethena within the broader restaking and yield‑bearing DeFi sector rather than as a base layer or AI token. Coinbase data similarly frame ENA as part of a growing class of DeFi governance assets, with prior snapshots showing market capitalization above €2.11 billion when the token traded closer to €0.33.
On the derivatives side, CoinGlass reports Ethena trading at $0.2422 in its futures overview, with 24‑hour futures volume of $832.15 million, spot volume of $66.99 million, market capitalization of $1.93 billion, and open interest of $392.29 million at that time. Coinalyze’s aggregated open interest dashboard shows ENA open interest at approximately $952.7 million, up 7.31% over 24 hours, capturing the notional value of both coin‑ and stablecoin‑margined contracts. Together, those figures underscore a derivatives‑heavy market structure where leverage plays a central role in short‑term price action.
Whale and unlock dynamics add another layer. CoinMarketCap’s latest Ethena updates highlight a whale withdrawal of $4 million in ENA from Binance on March 24, 2026, a move interpreted as accumulation and a potential reduction in immediately sellable exchange supply. A separate analysis of token unlocks from Yahoo Finance points to a March 2 unlock of 40.63 million ENA, worth about $4.21 million at the time, representing 0.53% of released supply and allocated to the Ethena Foundation. CoinMarketCap’s token‑unlock schedule confirms monthly unlocks running until April 2027, implying a persistent supply overhang that markets must absorb over time.
Ethena’s design, centered on creating a synthetic dollar yield product that behaves more like a fixed‑income instrument, sets it alongside other DeFi protocols bridging on‑chain and traditional‑style returns. CoinMarketCap’s AI summary notes roadmap items including development of an Ethena chain using USDe as gas and expanded restaking utility for sENA, both initiatives aimed at deepening protocol usage and fee generation. In parallel, token‑unlock tracking and derivatives statistics emphasize how ENA’s near‑term price will likely continue to be driven by the interplay between unlock supply, whale positioning, and leveraged futures activity, rather than purely spot investor flows.
Kirk Cousins Could Evidently Join the Dark Side

Sony Just Put Their Best Video Processor Inside a Budget-Friendly TV: Meet the BRAVIA 3, Mark II
Award-winning fish and chip shop opens new site in Cambridgeshire town


-
 Crypto World6 days ago
NIO (NIO) Stock Plunges 6.5% as Shelf Registration Sparks Dilution Worries
-

 Fashion6 days ago
Weekend Open Thread: Adidas – Corporette.com
-
 NewsBeat1 day ago
Manchester United reach agreement with Casemiro over contract clause amid transfer speculation
-

 Politics6 days ago
Jenni Murray, Long-Serving Woman’s Hour Presenter, Dies Aged 75
-

 Crypto World5 days ago
Best Crypto to Buy Now: Strategy Just Spent $1.57 Billion on Bitcoin During Fear While Early Investors Quietly Enter Pepeto for 150x Potential
-

 Crypto World5 days ago
Bitcoin Price News: Bhutan Sells $72 Million in BTC Under Fiscal Pressure, but the Smart Money Entering Pepeto Sees What the Market Does Not
-

 Tech6 days ago
inKONBINI Lets You Spend Summer Days Behind the Register
-

 News Videos14 hours ago
Parliament publishes latest register of MPs’ financial interests
-

 Sports3 days ago
Remo Stars and Kano Pillars Strengthen Survival Hopes in NPFL
-

 Politics7 days ago
Gender equality discussions at UN face pushbacks and US resistance
-

 Business4 days ago
No Winner in March 21 Drawing as Prize Rolls to $133 Million for Next
-

 Sports3 days ago
Gary Kirsten Accuses Pakistan Cricket Board Of ‘Interference’, Mohsin Naqvi Responds
-

 Tech4 days ago
Give Your Phone a Huge (and Free) Upgrade by Switching to Another Keyboard
-

 Sports6 days ago
2026 Kentucky Derby horses, odds, futures, preview, date: Expert who nailed 12 Derby-Oaks Doubles enters picks
-

 Tech4 days ago
AI enters the chat: New Seattle dating app relies on tech to facilitate meaningful human connections
-

 Business7 days ago
DLocal: Entering 2026 At Escape Velocity
-

 Politics7 days ago
Scotland’s rejection of assisted dying is a victory for humanity
-
Business6 days ago
Columbia Sportswear enters $500 million credit agreement with JPMorgan Chase
-

 Tech5 days ago
Today’s NYT Connections Hints, Answers for March 22 #1015
-

 News Videos3 days ago
Ch 9 Financial Management Part 1 | Detailed One Shot | Class 12 Business Studies Boards 2026
You must be logged in to post a comment Login