Crypto World
BNB price holds above $700 as bulls target $725

BNB price traded near $707 on Aug. 26 after gaining nearly 13% from its Aug. 20 opening price, with technical charts showing strong momentum but growing resistance between $712 and $725.
Summary
- BNB price rose from $626.47 on Aug. 20 to about $707 on Aug. 26.
- The daily price remains above all four major moving averages shown on the chart.
- 4-hour Bollinger Bands place immediate resistance near $712.50 and support near $687.
- Analysts identified $725 and $745 as the main levels needed to extend the rally.
BNB price consolidates after its weekly breakout
According to data from crypto.news, BNB (BNB) price was trading at $706.72 on Aug. 26, up 1.77% during the current daily session. The token has gained approximately 12.8% from its Aug. 20 opening price of $626.47.
BNB reached an intraday high near $725 on Aug. 22 before buyers lost momentum. Price has since consolidated between roughly $685 and $720, suggesting traders are deciding whether the weekly surge can develop into a larger breakout.
The latest move followed a rapid expansion from the $600 area, where BNB had traded before breaking above several moving averages. Although the price has pulled back from its weekly high, it has held most of its gains and returned above the psychological $700 level.
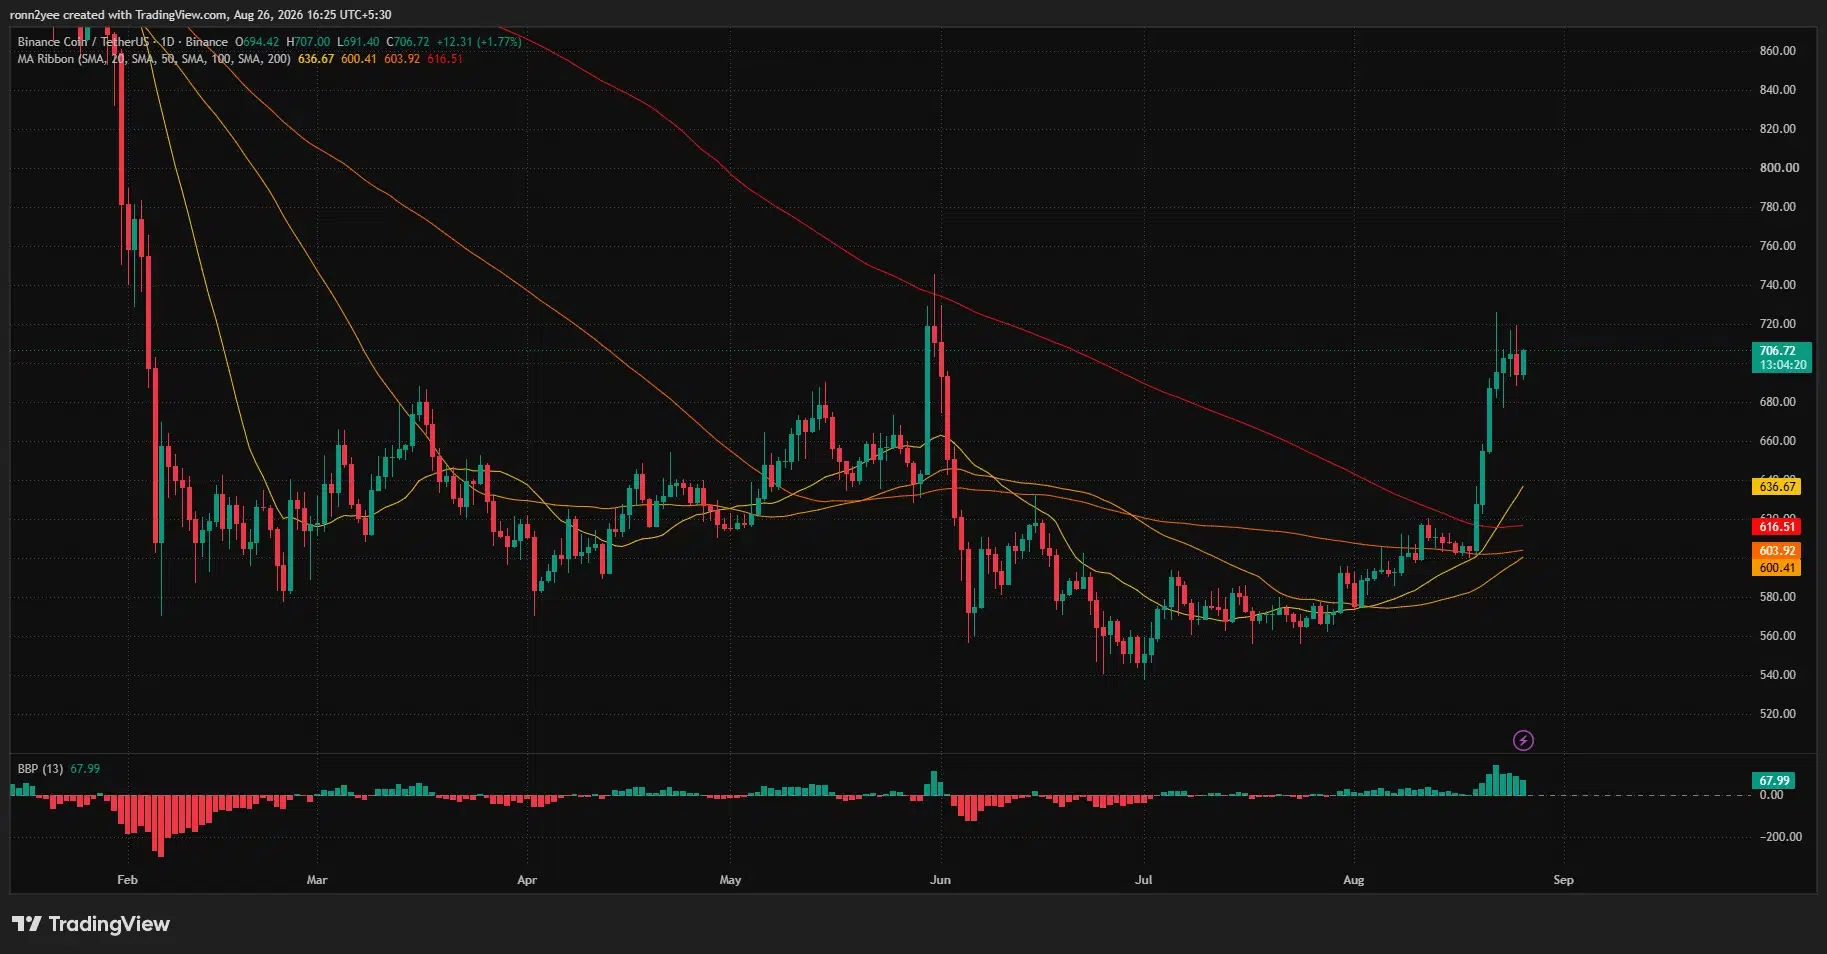

Daily momentum also remains positive. The bull-bear power indicator printed a positive reading of 67.99, although its bars have declined from their recent peak. The change suggests buyers remain in control but are no longer pushing the market with the same force seen during the initial breakout.
Moving averages support the bullish BNB structure
BNB’s daily chart shows the price trading above its 20-, 50-, 100-, and 200-day simple moving averages. The 20-day average sits at $636.67, while the other three averages are grouped between approximately $600 and $617.
The wide gap between the current price and those averages shows how quickly BNB advanced. It also leaves the token exposed to a deeper pullback if buyers cannot defend the newly established support zones.
The 200-day moving average, shown near $616.51, is particularly important because BNB had traded below it for much of the preceding decline. The break above that level changed the medium-term structure, but maintaining the bullish setup will require price to avoid a sustained return below the $600–$617 cluster.
On the 4-hour chart, BNB is trading slightly above the Bollinger Band midpoint at $699.94. The upper band stands at $712.51, while the lower band is near $687.36.
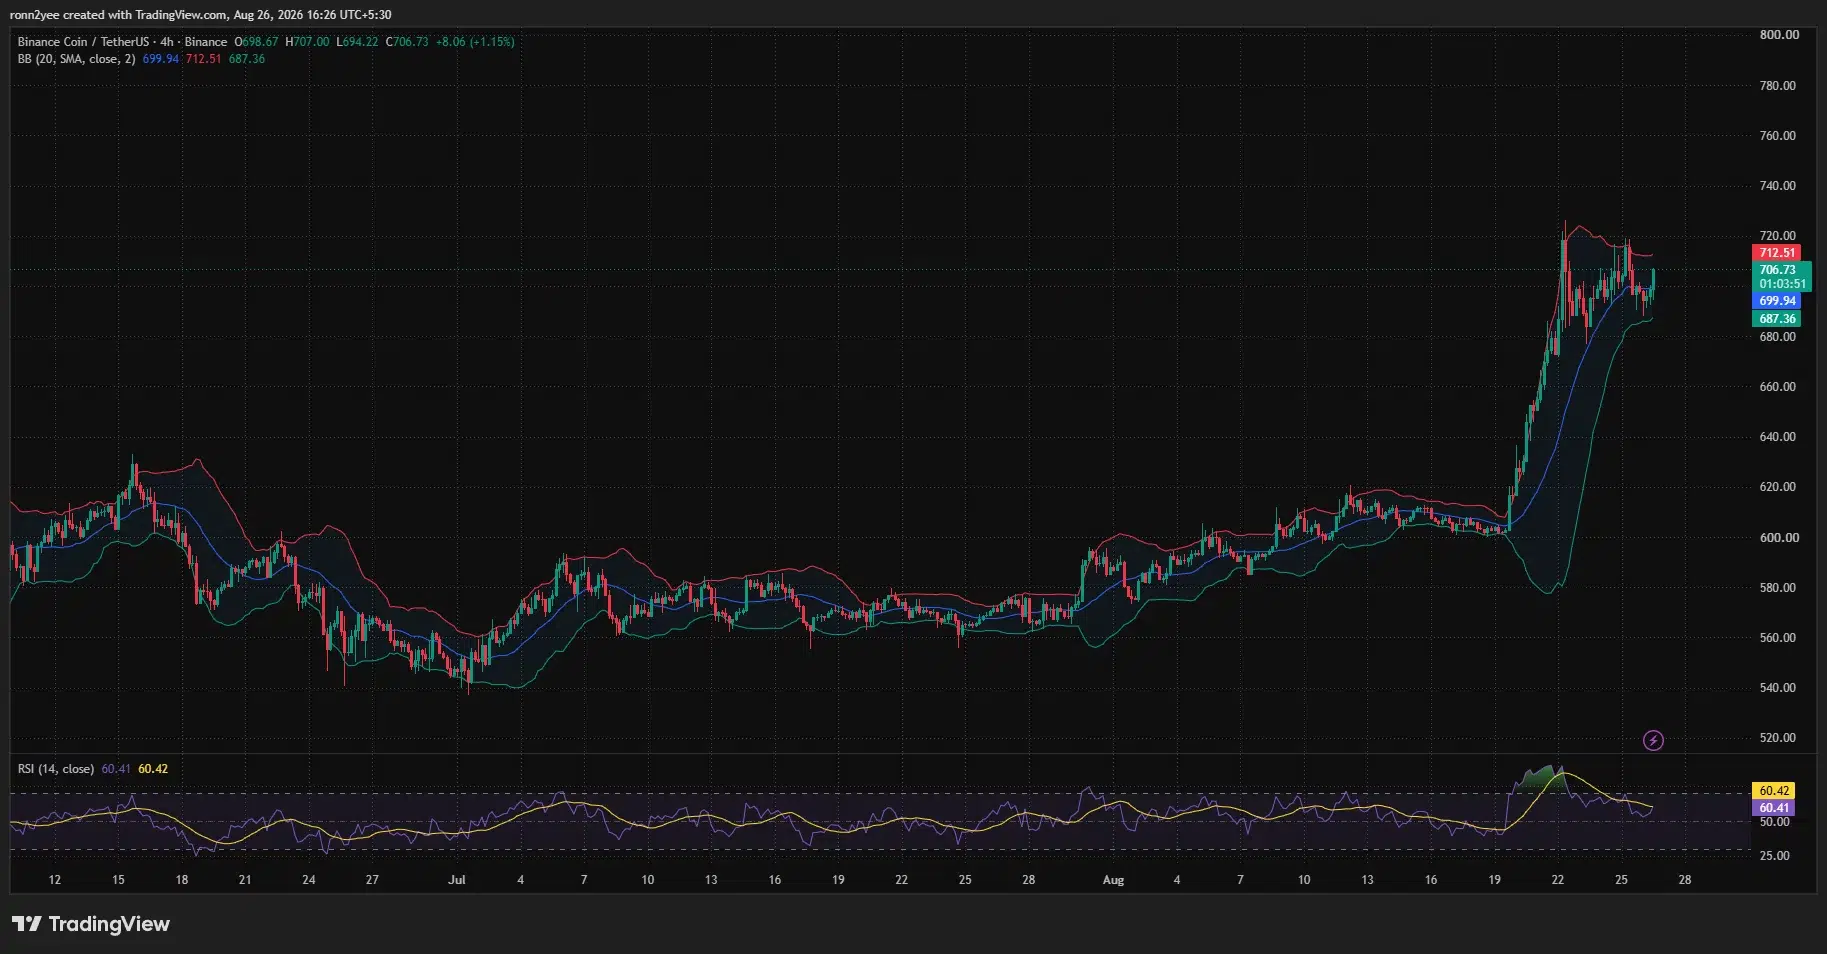
A 4-hour close above the upper band could signal another expansion toward $720–$725. Failure to hold the midpoint would raise the likelihood of a retest of $687, where the lower band overlaps with recent intraday support.
BNB’s 4-hour relative strength index has cooled to 60.41 after entering overbought territory during the initial rally. The lower reading removes some of the earlier overheating without pushing momentum into bearish territory.
Liquidation levels surround $680 and $725
CoinGlass’s three-day BNB liquidation heatmap shows concentrated leveraged positions on both sides of the current price.

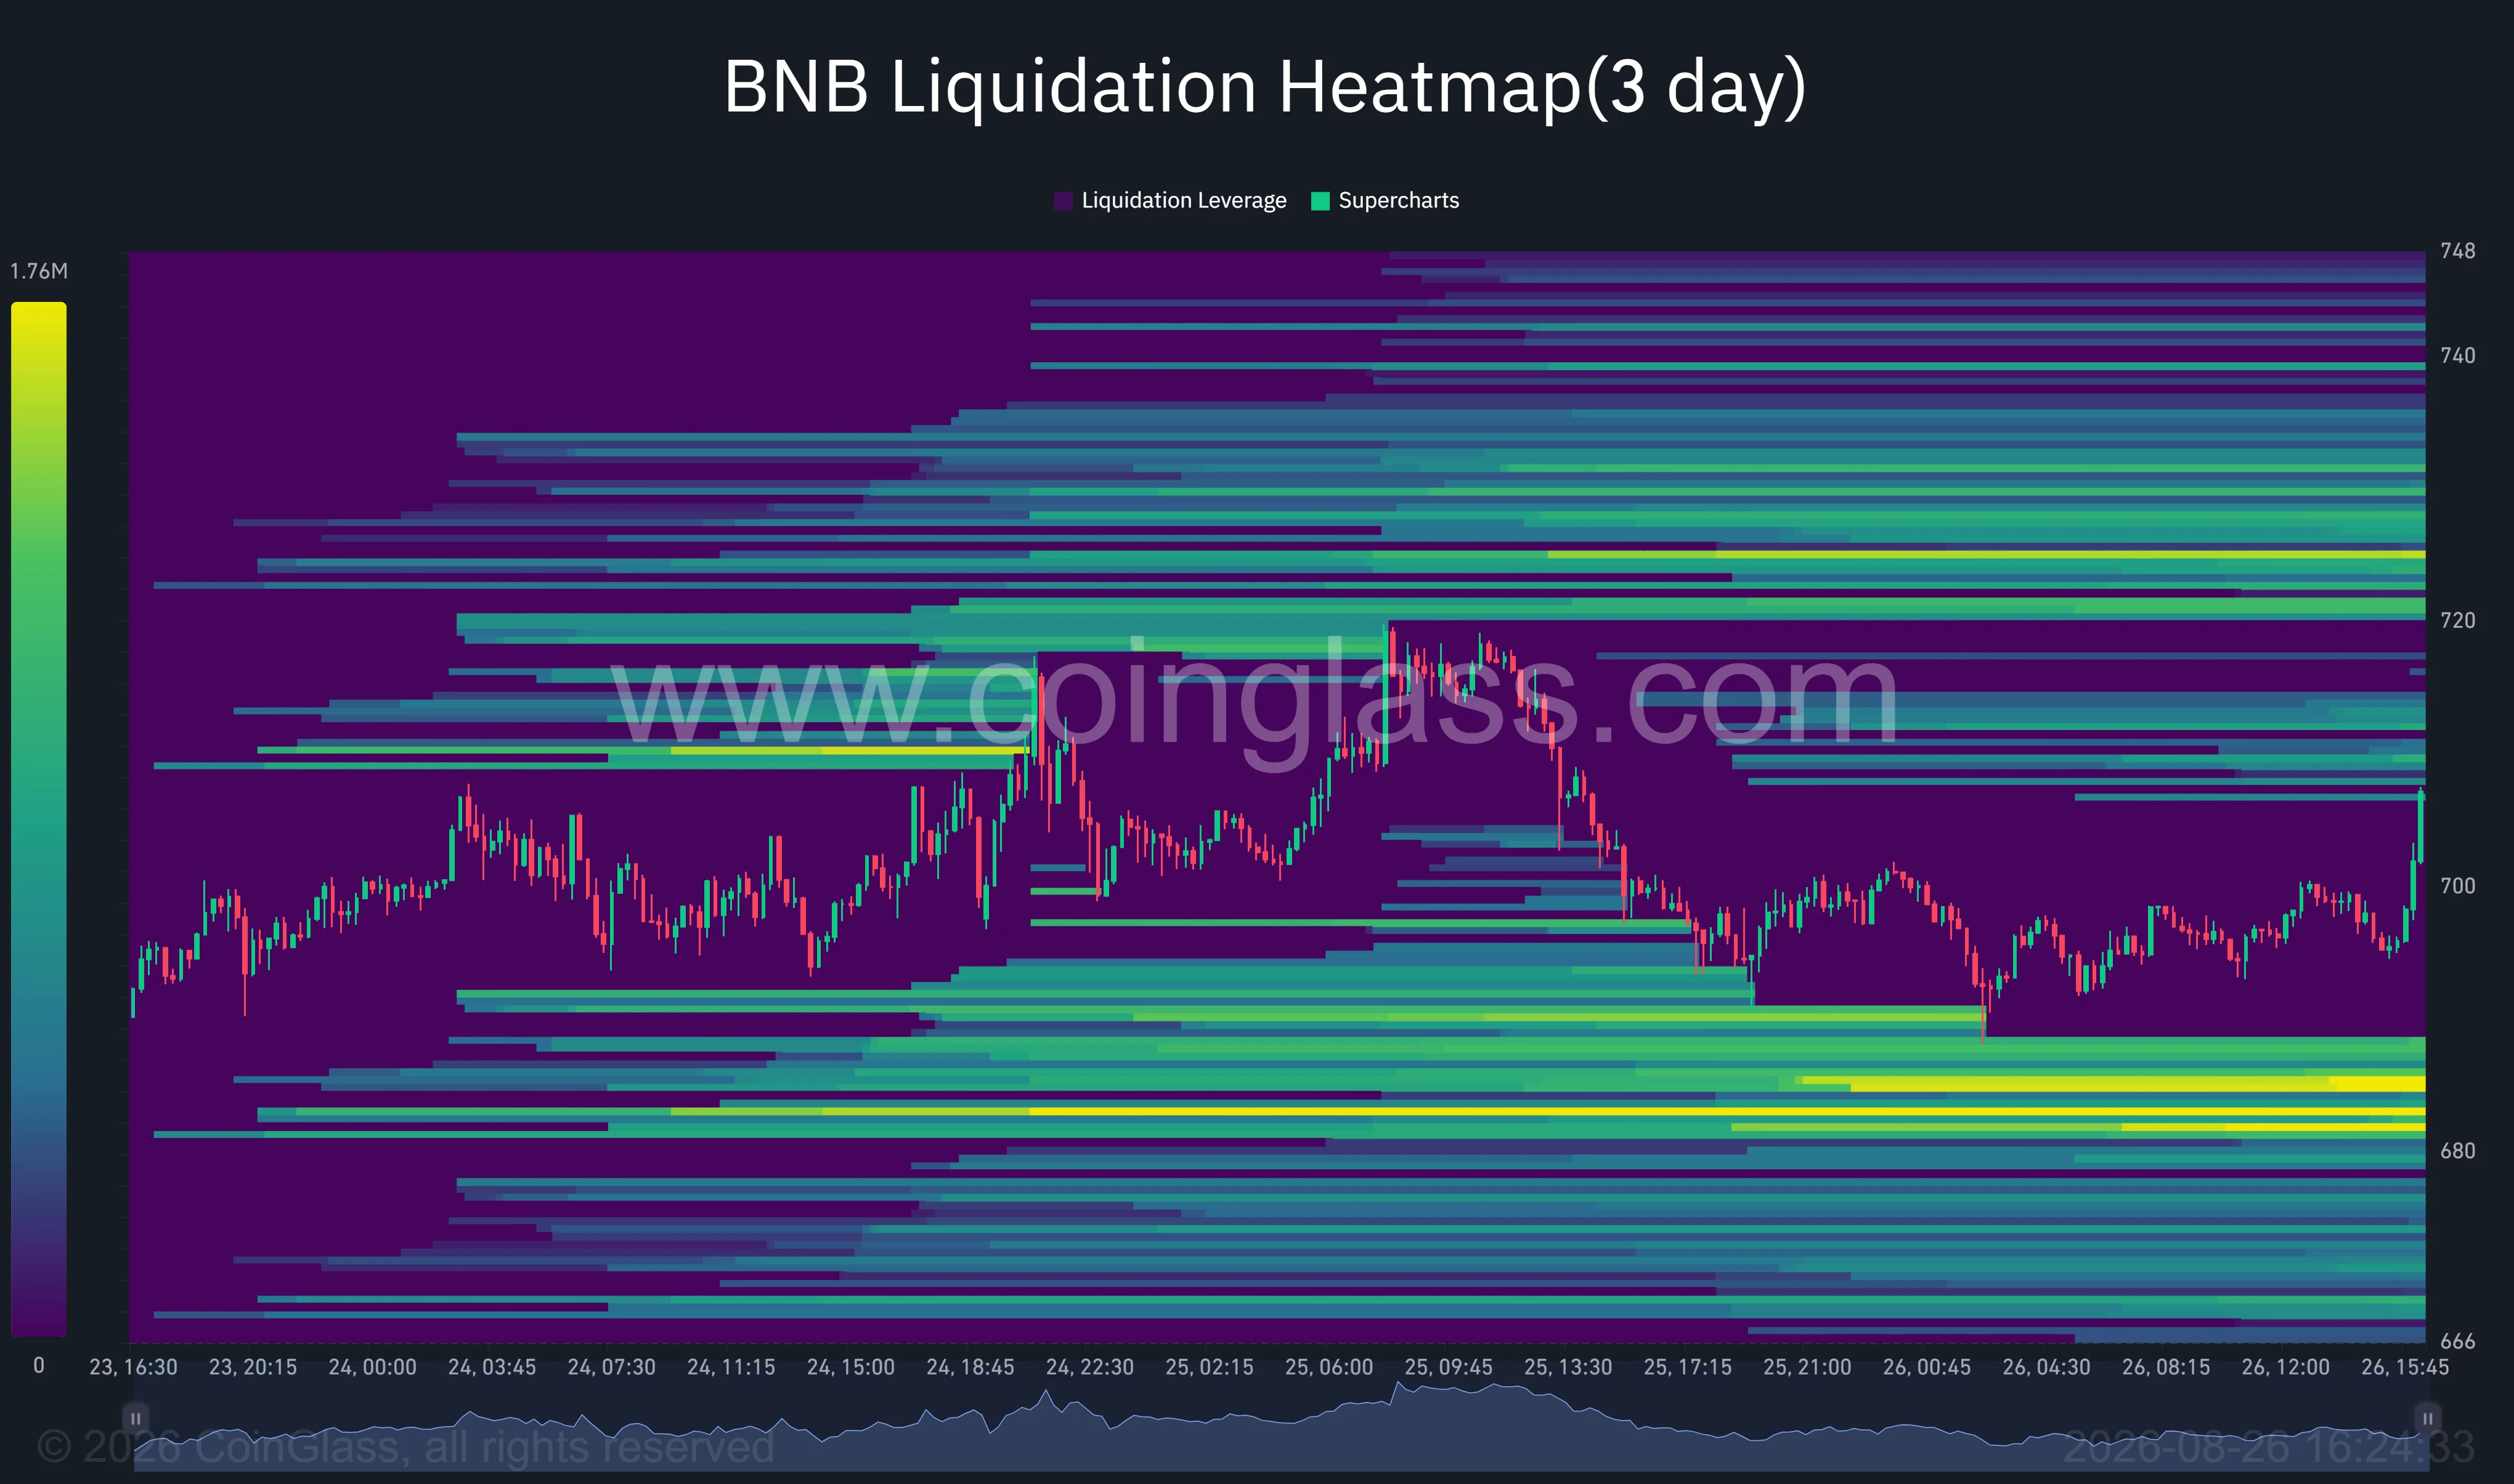
The closest major overhead liquidity appears around $724–$726, broadly matching the resistance visible on the price charts. A move into that area could force short positions to close, adding market buy orders and supporting a brief extension of the rally.
Additional liquidation bands appear between $730 and $745. However, liquidity maps identify areas where leveraged positions may be vulnerable; they do not guarantee that price will reach those levels.
Below the market, the strongest visible concentration sits around $680–$685. A loss of $695 and then $687 could draw BNB toward that cluster, potentially accelerating losses as leveraged long positions are closed.
The heatmap therefore places BNB between two competing liquidity areas. The $724–$726 zone is the nearest upside target, while the $680–$685 area represents the clearest downside risk if the consolidation breaks lower.
Analysts focus on the $725 and $745 barriers
Crypto analyst Bitcoin Professor said BNB had gained nearly 18% over the seven-day period measured in his Aug. 25 chart and identified $710–$725 as the key resistance range.
“A clean breakout above $725 could accelerate the bullish momentum,” the analyst said.
Bitcoin Professor added that short-term momentum could weaken if BNB loses the $690–$695 area. That warning aligns with the 4-hour Bollinger Band midpoint near $700 and the lower band around $687.
A separate analyst using the name Einstein said BNB had broken its descending trendline and was approaching a major breakout area.
“Weekly close above $745 = breakout confirmation,” Einstein said, identifying $960 as the first major target if that confirmation occurs.
The analyst also described $537 as the wider structural support level. However, that level sits far below the nearer support areas shown on the daily and 4-hour charts, making $687, $637, and the $600–$617 moving-average cluster more relevant during the current setup.
The forecasts represent analysts’ interpretations and do not establish that BNB will reach either $745 or $960.
BNB needs a close above $725 to extend the rally
The immediate bullish case depends on BNB holding $699–$700 and closing above the $712–$725 resistance region. A confirmed breakout would expose $745, which marks the larger resistance level identified by Einstein and overlaps with the upper section of the liquidation map.
The bearish case begins with a 4-hour close below $687. Such a move would weaken the recent consolidation and place the $680–$685 liquidity cluster at risk. Below that area, the 20-day moving average near $637 would become the next major technical reference.
For US traders, BNB remains available through some trading venues, but access varies because Binance.US operates separately from Binance’s global exchange and offers a more limited market. Traders should confirm platform availability and local restrictions before acting on the setup.
BNB’s broader structure remains bullish while price holds above the breakout area, but the declining short-term momentum and nearby resistance make the next confirmed close more important than an intraday move above $720.
Disclosure: This article does not represent investment advice. The content and materials featured on this page are for educational purposes only.
You must be logged in to post a comment Login