

Crypto World
BNB price rallies into supply, why price risks rejection at $656

BNB price approaches $656 resistance at the value area high with weak volume. A rejection here could trigger a rotation toward key support near $583.
Summary
- Key Resistance: BNB testing value area high near $656–$659.
- Volume Signal: Rally occurring on weak bullish volume, signaling exhaustion.
- Downside Target: Rejection could trigger rotation toward $583 support.
Binance (BNB) price is approaching a critical technical level as price rallies toward a major resistance zone near $656–$659. This region aligns with the value area high and a high-timeframe resistance level, making it an important inflection point that could determine the next directional move.
While the recent bounce has brought bullish momentum back into the market, the broader structure suggests that this rally may be nearing exhaustion. Technical analysis indicates that the current move began at the value area low, where buyers stepped in to defend support.
However, as price approaches the upper boundary of the value area, momentum appears to be weakening due to a noticeable lack of strong bullish volume.
BNB price Key Technical Points
- Key Resistance: BNB testing value area high near $656–$659.
- Volume Weakness: The rally toward resistance is occurring on declining bullish volume.
- Downside Target: Rejection could trigger a rotation toward $583 high-timeframe support.
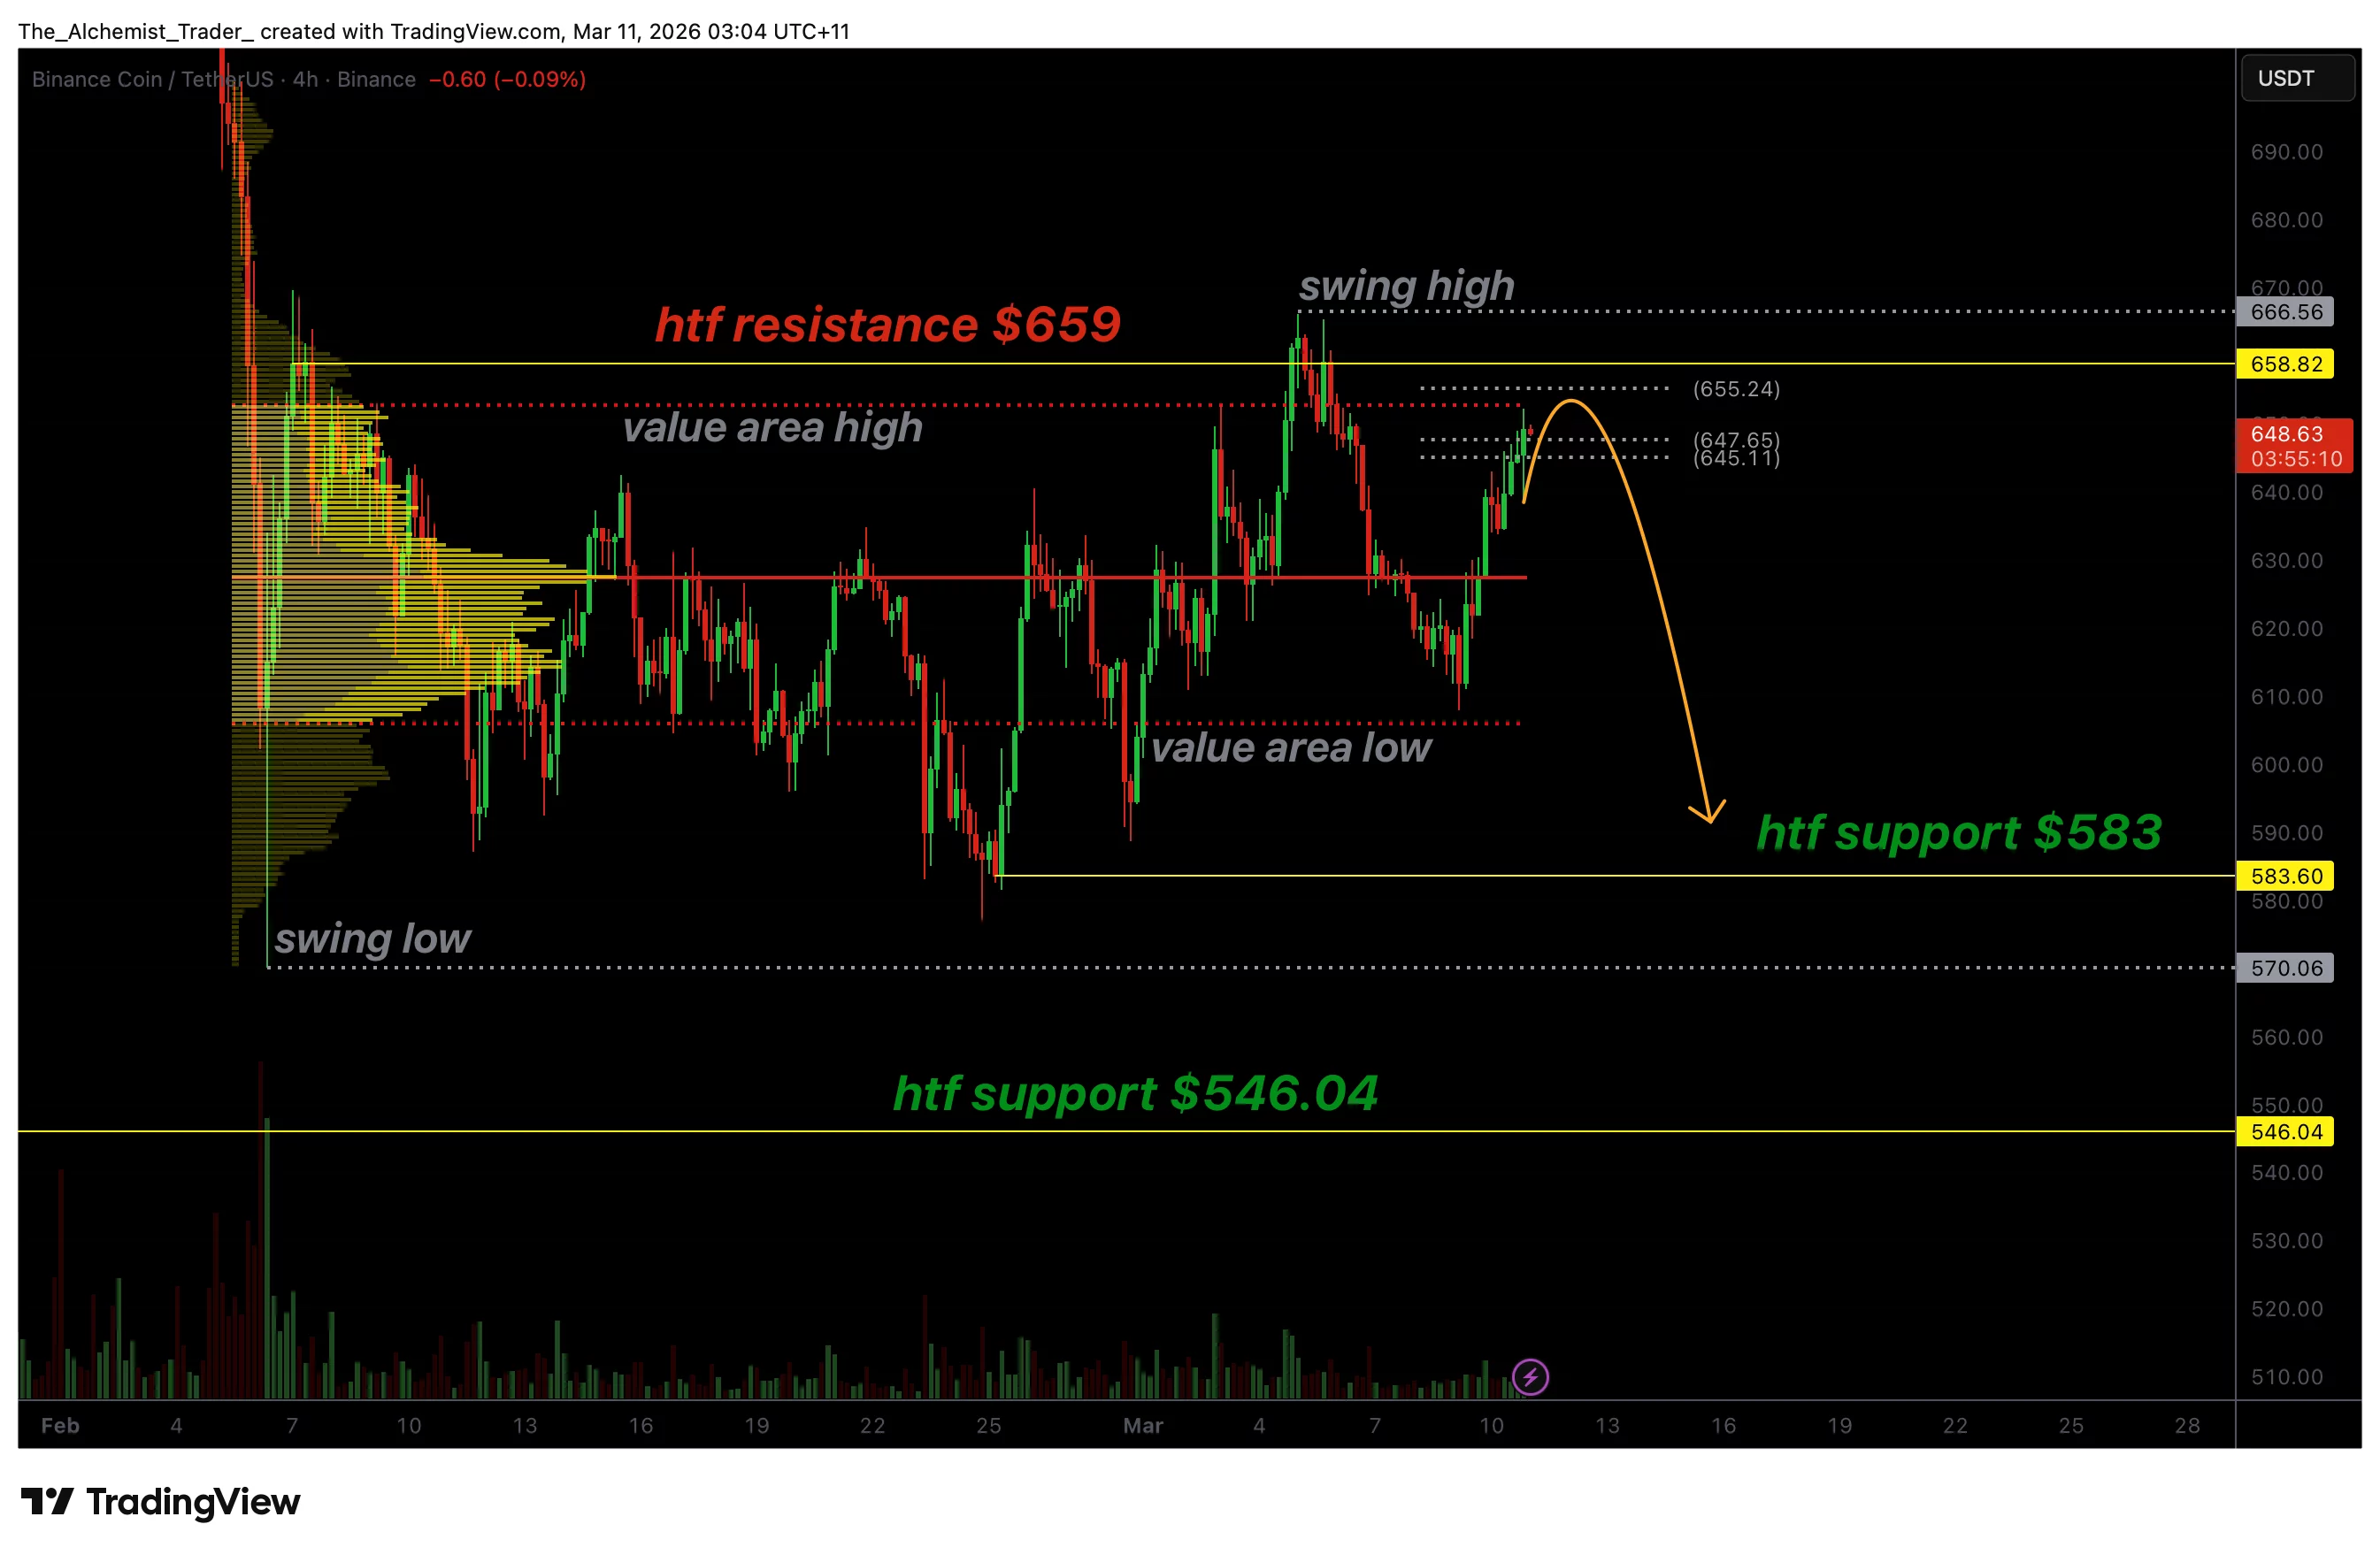
BNB’s current price action is unfolding within a technically well-defined structure where key levels continue to dictate market behavior. One notable feature on the chart is how consistently price has respected the value area high and value area low during previous rotations. These levels represent areas where the majority of trading activity has occurred, making them important zones of equilibrium between buyers and sellers.
The recent bounce from the value area low signaled that buyers were willing to step in at discounted prices. As price moved higher, it began rotating toward the opposite side of the trading range. This type of movement is consistent with typical market behavior within range-bound conditions, where price oscillates between support and resistance levels as liquidity is redistributed.
However, as BNB approaches the value area high near $656, signs of exhaustion are beginning to appear. One of the key signals supporting this view is the lack of strong bullish volume accompanying the current rally. When price moves higher without sufficient volume confirmation, it often indicates that buying momentum is weakening and that the move may struggle to sustain itself.
This comes as a U.S. federal court recently dismissed a lawsuit accusing Binance of facilitating terrorism financing, ruling that the plaintiffs failed to meet the legal requirements needed to hold the exchange liable under anti-terror laws, removing a major legal overhang for the platform.
Low-volume rallies frequently occur during corrective phases within a broader consolidation structure. In these cases, price may drift upward toward resistance but ultimately fail to break through due to the absence of strong participation from buyers. As a result, these areas often become zones where sellers regain control of the market.
From a market structure perspective, the value area high and high-timeframe resistance near $659 represent a confluence zone where supply may begin to enter the market. If sellers step in around this region, it would reinforce the idea that the current rally is losing strength and could mark the beginning of another rotational move lower.
Another important factor supporting this scenario is how previous pivots on the chart have occurred at technically significant levels. Each rotation within the range has respected the value area boundaries, suggesting that the market is continuing to operate within a structured auction environment. When these patterns repeat consistently, traders often anticipate similar behavior during future tests of these levels.
Meanwhile, Binance’s regional head has confirmed that the exchange expects to secure five additional licenses across Asia this year, signaling continued expansion despite ongoing regulatory scrutiny.
If BNB fails to break above the $656–$659 resistance zone, the market may once again rotate toward the lower boundary of the value area. In this case, the next major support level to watch would be the high-timeframe support near $583.
What to expect in the coming price action
BNB is now approaching a key resistance region where the value area high intersects with high-timeframe resistance near $656–$659. The lack of strong bullish volume suggests that the current rally may be losing momentum as price enters this supply zone. If sellers defend this level, the market could reject and rotate back toward $583 support.
However, a strong breakout above resistance with increasing volume would invalidate the bearish scenario and open the door for further upside continuation.


Stablecoins are evolving from a niche crypto trading tool into a potential layer of global financial infrastructure, according to Australian investment bank Macquarie.
While most U.S. dollar-denominated stablecoin activity, mainly in Tether’s USDT and Circle’s USDC, still comes from crypto trading, accounting for about 90% of volume, the bank said adoption is expanding across payments, remittances, treasury operations and tokenized assets, increasingly linking traditional finance with decentralized finance.
“Stablecoin adoption is making strides in cross-border remittances, but adoption as form of payment still has room to grow, presenting an attractive total addressable market (TAM) opportunity,” analysts led by Paul Golding said in the Monday note.
Regulatory progress is helping drive the shift. The analysts pointed to developments such as the U.S. GENIUS Act, Europe’s MiCA framework and emerging Asia-Pacific regulations as factors pushing stablecoins from speculative uses toward institutional settlement tools.
Read more: Stablecoin market expands, bitcoin rallies as Iran war panic cools
Stablecoins are cryptocurrencies designed to maintain a fixed value, typically pegged to the U.S. dollar, and are widely used across digital asset markets for trading, payments and transfers.
Tether’s USDT is the largest stablecoin by market value and trading volume, serving as a key source of liquidity across crypto exchanges, while Circle’s USDC is the second largest and is widely used in institutional and decentralized finance applications. Together, the tokens underpin much of the crypto market’s activity and are increasingly being explored for payments, remittances and settlement.
Stablecoin growth has been rapid. Macquarie estimates the combined market capitalization of major coins at about $312 billion as of March 2026, up roughly 50% year over year and representing about 7%–8% of the total crypto market.
Transaction activity is rising even faster. Adjusted stablecoin transfer volume reached roughly $11 trillion in 2025, the bank said, suggesting onchain dollars are becoming a meaningful economic tool both within crypto markets and in some real-world payment corridors.
Payments networks and fintech firms are beginning to integrate the technology. The report noted that Visa (V) and Mastercard (MA) now support USDC settlement, allowing card obligations to be discharged onchain.
Banks are experimenting with similar systems. Macquarie pointed to initiatives including JPMorgan’s JPMD tokenized deposit product, Citi’s Token Services and tokenized deposit pilots at HSBC as evidence that blockchain-based settlement is gaining traction among large financial institutions.
Read more: Standard Chartered says U.S. regional banks most at risk in $500 billion stablecoin shift
Crypto World
How Bitcoin ETFs Are Changing Crypto Market Structure and Supply How ETFs Reshape Crypto Markets and Bitcoin Supply Flows
Exchange-traded funds have changed how capital reaches crypto markets and how traders find prices. The arrival of spot Bitcoin ETFs opened regulated on-ramps. At the same time, a meaningful share of mined Bitcoin sits outside active markets. This report explains how ETFs alter market structure and why the effective Bitcoin float falls well short of 21 million coins.
ETFs Expand Access to Bitcoin Markets
ETFs let investors buy Bitcoin exposure through standard brokerage accounts. This structure removed custody and private-key management for many buyers. Investors then moved capital into familiar products listed on major exchanges.
Chainalysis observed that spot-ETFs drove trading volumes into the billions per day within months of launch.
Regulators and issuers created prospectuses, oversight, and audit requirements for these funds. The SEC approved multiple spot Bitcoin listings in January 2024.
SEC Chair Gary Gensler noted the agency approved the listing and trading of a number of spot Bitcoin exchange-traded products, marking a procedural turning point for market access.
ETFs Change Liquidity and Price Formation
Authorized participants now exchange ETF shares for underlying Bitcoin. This creation/redemption mechanism links ETF flows with spot markets. Market-making firms increased activity to support arbitrage and large block trades.
Major liquidity providers helped narrow spreads and improve execution quality for institutional trades.
At the same time, ETF flows influence daily price discovery. Large inflows can bid prices upward quickly. Conversely, sustained outflows can remove demand and pressure prices. Market observers now monitor ETF net flows as part of standard price analysis. Chainalysis documented large early inflows that matched high daily trading volumes.
ETFs Drive Institutional Bitcoin Adoption
Asset managers deployed regulated fund structures that appeal to pensions, endowments, and wealth managers. Major issuers launched competing ETFs. Institutions then allocated capital through those products rather than directly holding private keys. This shift created a concentrated pool of institutional demand routed into ETFs. Evidence shows certain ETFs grew to tens of billions in assets in under a year.
Wealth managers and broker-dealers scaled their offering and distribution channels. The result moved sizable blocks of Bitcoin into custodial arrangements under fund sponsors and their partners. This concentration affects how much supply remains available for active trading.
Custody Links Crypto to Traditional Finance
ETF issuers contracted regulated custodians, auditors, and clearing agents. Traditional financial infrastructure now supports large Bitcoin holdings. Institutional custodians apply governance, insurance, and reporting standards that differ from self-custody. These arrangements increase investor confidence and also reduce turnover in those holdings.
Market participants link ETF strategies to futures and options markets. Traders hedge ETF exposure via derivatives, which increases activity on exchanges such as the CME.
The cross-market linkages changed intraday flow patterns and reduced fragmentation between venues.
Why is a substantial portion of Bitcoin effectively unavailable
On-chain analysis shows a nontrivial share of mined Bitcoin never moves again. Independent research finds that between three and four million BTC likely remain permanently inaccessible.
Analysts attribute these losses to forgotten keys, discarded hardware, and unrecoverable custodial accounts. These coins still exist on the ledger, but holders cannot move them.
Some of the largest examples include early-era addresses that remain dormant. Those coins reduce the usable supply relative to the 21 million cap. As a result, market participants must base liquidity assessments on the effective float, not the theoretical total.
Long-Term Holding Shrinks Tradable Supply
Beyond permanently lost coins, many holders keep Bitcoin offline for long periods. Long-term holders now control a large portion of the circulating supply. Funds, corporate treasuries, and strategic reserves hold coins for extended horizons.
Analysts estimate U.S. spot ETFs and institutional treasuries together hold over one million BTC, which removes these coins from daily trading pools.
On-chain metrics show older UTXOs grow as new issuance slows after halving events. When holders prefer storage over trading, available liquidity declines. That scarcity amplifies price response to marginal demand.
What This Means for Bitcoin Markets
Taken together, ETF accumulation, institutional treasuries, and lost coins lower the effective supply. Analysts place the usable circulating supply below the raw mined total. Markets now respond to changes in institutional flows more than in prior cycles. This structural change raises the sensitivity of price to net inflows and outflows.
Regulatory clarity and custody standards helped mainstream ETF adoption. Those same structures increased the proportion of Bitcoin held in long-term, low-turnover accounts. The market, therefore, shows signs of maturing.
Yet price remains sensitive to large fund flows and macro events. Observers should monitor ETF flows, custody reports, and on-chain dormancy metrics to assess liquidity and risk going forward.
Key takeaways:
-
Ether price struggled as investors pulled $225 million from the spot ETFs, and Ethereum staking rewards underperformed compared to stablecoin yields.
-
Recent Ethereum network upgrades and plans for improved wallet security are positives, but fail to kickstart demand for Ether.
Ether (ETH) price has repeatedly failed to sustain levels above $2,100 over the past month, gradually eroding traders’ confidence in the altcoin. Even with a 7% rise between Monday and Tuesday, ETH derivatives metrics suggest a lack of interest in leveraged bullish positions, potentially signaling that bears remain in control.

ETH perpetual futures dipped into negative territory on Tuesday, signaling increased demand for short (bearish) positions. More importantly, this metric has remained below the neutral 6% to 12% range for the past month. Part of this investor disappointment stems from a 54% price decline over six months, even though cooling onchain activity has also played a significant role.
Weekly base layer fees on the Ethereum network averaged $2.3 million over the past month, down from an $8 million peak in early February. While 7-day transaction counts stabilized near 14 million, the current industry focus on layer-2 rollup scalability has so far failed to generate fresh demand for native Ether.

Contrary to perpetual futures markets, the ETH options risk gauge hovered near the neutral -6% to +6% range on Tuesday. Put (sell) options traded at a 7% premium relative to call (buy) instruments, suggesting confidence is slowly returning among Ether bulls. Furthermore, no competitor has yet challenged Ethereum’s $56 billion in total value locked (TVL).
Ether exchange-traded funds (ETFs) saw $225 million in net outflows between Thursday and Monday, reversing the $169 million in inflows seen on Wednesday. This metric serves as a proxy to institutional demand, which is currently held back by the 2.8% native staking reward rate. By comparison, stablecoin yields on Sky Lending (formerly MakerDAO) sat higher at 3.75%.
Weak spot ETH ETF demand and concerns with Ethereum’s roadmap
Excitement surrounding the ETF staking approval in the US, which occurred in late 2025, has not yet translated into sustainable demand. One could argue that the negative outcome was simply a result of bad luck, as the launch coincided with a broader crypto market downturn that began in early October after total market capitalization neared a $4 trillion all-time high.
Related: Was Ethereum ‘ultrasound money’ a mistake? ETH down 65% vs. BTC since pivot

ETH has underperformed the broader cryptocurrency market since October 2025, and there are no signs that a reversal is underway. Investor sentiment is also impaired by a staggering $735 million net loss from the Ethereum treasury firm Sharplink (SBET US) in 2025. The company, chaired by Ethereum co-founder Joseph Lubin, released these financial results on Monday.
The pace of native chain scalability might have contributed to Ether’s negative performance. For instance, Ethereum co-founder Vitalik Buterin said on Saturday that account abstraction, equivalent to smart accounts, will likely be shipped “within a year,” after more than a decade under development. Transactions will be able to reference each other’s data, enabling quantum-resistant wallets.
Another advantage of the upcoming Ethereum Hegota fork is paying gas fees in non-ETH tokens using special-purpose decentralized exchanges, while adding a “general-purpose public mempool” and removing “public broadcasters” in privacy platforms such as Railgun and Tornado Cash. Buterin also said that he expects “progressive decreases” of slot time and finality time in the long term.
Overall, ETH derivatives and onchain activity point to low conviction in a bullish breakout above $2,200, but at the same time, there is no indication of worsening conditions or domination from bears.
This article does not contain investment advice or recommendations. Every investment and trading move involves risk, and readers should conduct their own research when making a decision. While we strive to provide accurate and timely information, Cointelegraph does not guarantee the accuracy, completeness, or reliability of any information in this article. This article may contain forward-looking statements that are subject to risks and uncertainties. Cointelegraph will not be liable for any loss or damage arising from your reliance on this information.
Crypto World
Shiba Inu Price Prediction 2030: Nigel Farage Invests in Stack BTC While DeepSnitch AI Prepares to Outrun DOGE and SHIB With a 300x Launch Target

The institutionalization of crypto took another massive step forward this week in the United Kingdom. Reform UK party leader Nigel Farage has officially deepened his ties to the crypto sector by investing 215,000 pounds, or roughly $286,000, into Stack BTC.
Calculating a reliable Shiba Inu price prediction is nearly impossible when the asset has no real-world utility and is entirely dependent on fleeting internet hype. Smart money is completely abandoning these heavy, outdated tokens. They are putting their money in presales like DeepSnitch AI.
Discover why it’s the next crypto to 300x as the launch approaches.

Nigel Farage secures major stake in Bitcoin Treasury
This London-listed Bitcoin treasury company is chaired by former UK Chancellor Kwasi Kwarteng. Moreover, the new development represents a major bridge between traditional political influence and decentralized finance. Through his media vehicle, Thorn In The Side, Farage’s strategic investment grants him a substantial 6.31% stake in the company.
Stack BTC recently announced it raised a total of $346,000 by issuing 5.2 million new shares in a funding round that also prominently featured Blockchain.com. The involvement of Blockchain.com is critical, as they have entered a partnership to deliver institutional-grade services for Stack’s planned Bitcoin treasury operations.
What is the best crypto to buy now: Shiba Inu price prediction or DeepSnitch AI?
DeepSnitch AI: The ultimate profit edge before the March 31st deadline
You are currently in the final days of the DeepSnitch AI presale. On March 31st, the doors will permanently close, and the opportunity to buy this token at the heavily discounted price of $0.04399 will be gone forever. Immediately after the deadline hits, a strict 7-day claim window opens.
During this single week, early buyers will safely claim their purchased tokens, their massive promotional bonuses, and their staking rewards. Once that brief period closes, DeepSnitch AI officially launches on the UniSwap exchange.
With centralized exchange listings confirmed to follow shortly after, the public demand is going to be astronomical.
DeepSnitch AI has confidently smashed past the $2,000,000 funding milestone because it solves the biggest problem for everyday investors. Instead of guessing which coin to buy or relying on an uninspiring Shiba Inu price prediction, DeepSnitch AI gives you the ultimate profit edge.
It actively tracks “whales”, the massive billionaires and hedge funds moving the market, and tells you exactly what they are buying before the news even breaks. This allows you to follow the smart money and get in early. The launch is approaching, and being part of those who invested should be a top priority for many.
Shiba Inu price prediction
When evaluating the latest Shiba Inu price prediction, it becomes obvious why retail traders are abandoning the token. Despite a massive 275 billion tokens recently being moved off exchanges, the underlying momentum is entirely broken.
The token is flashing a dismal 14-Day RSI of 33.61, sitting just above the oversold territory with absolutely zero buying pressure coming from the retail sector.
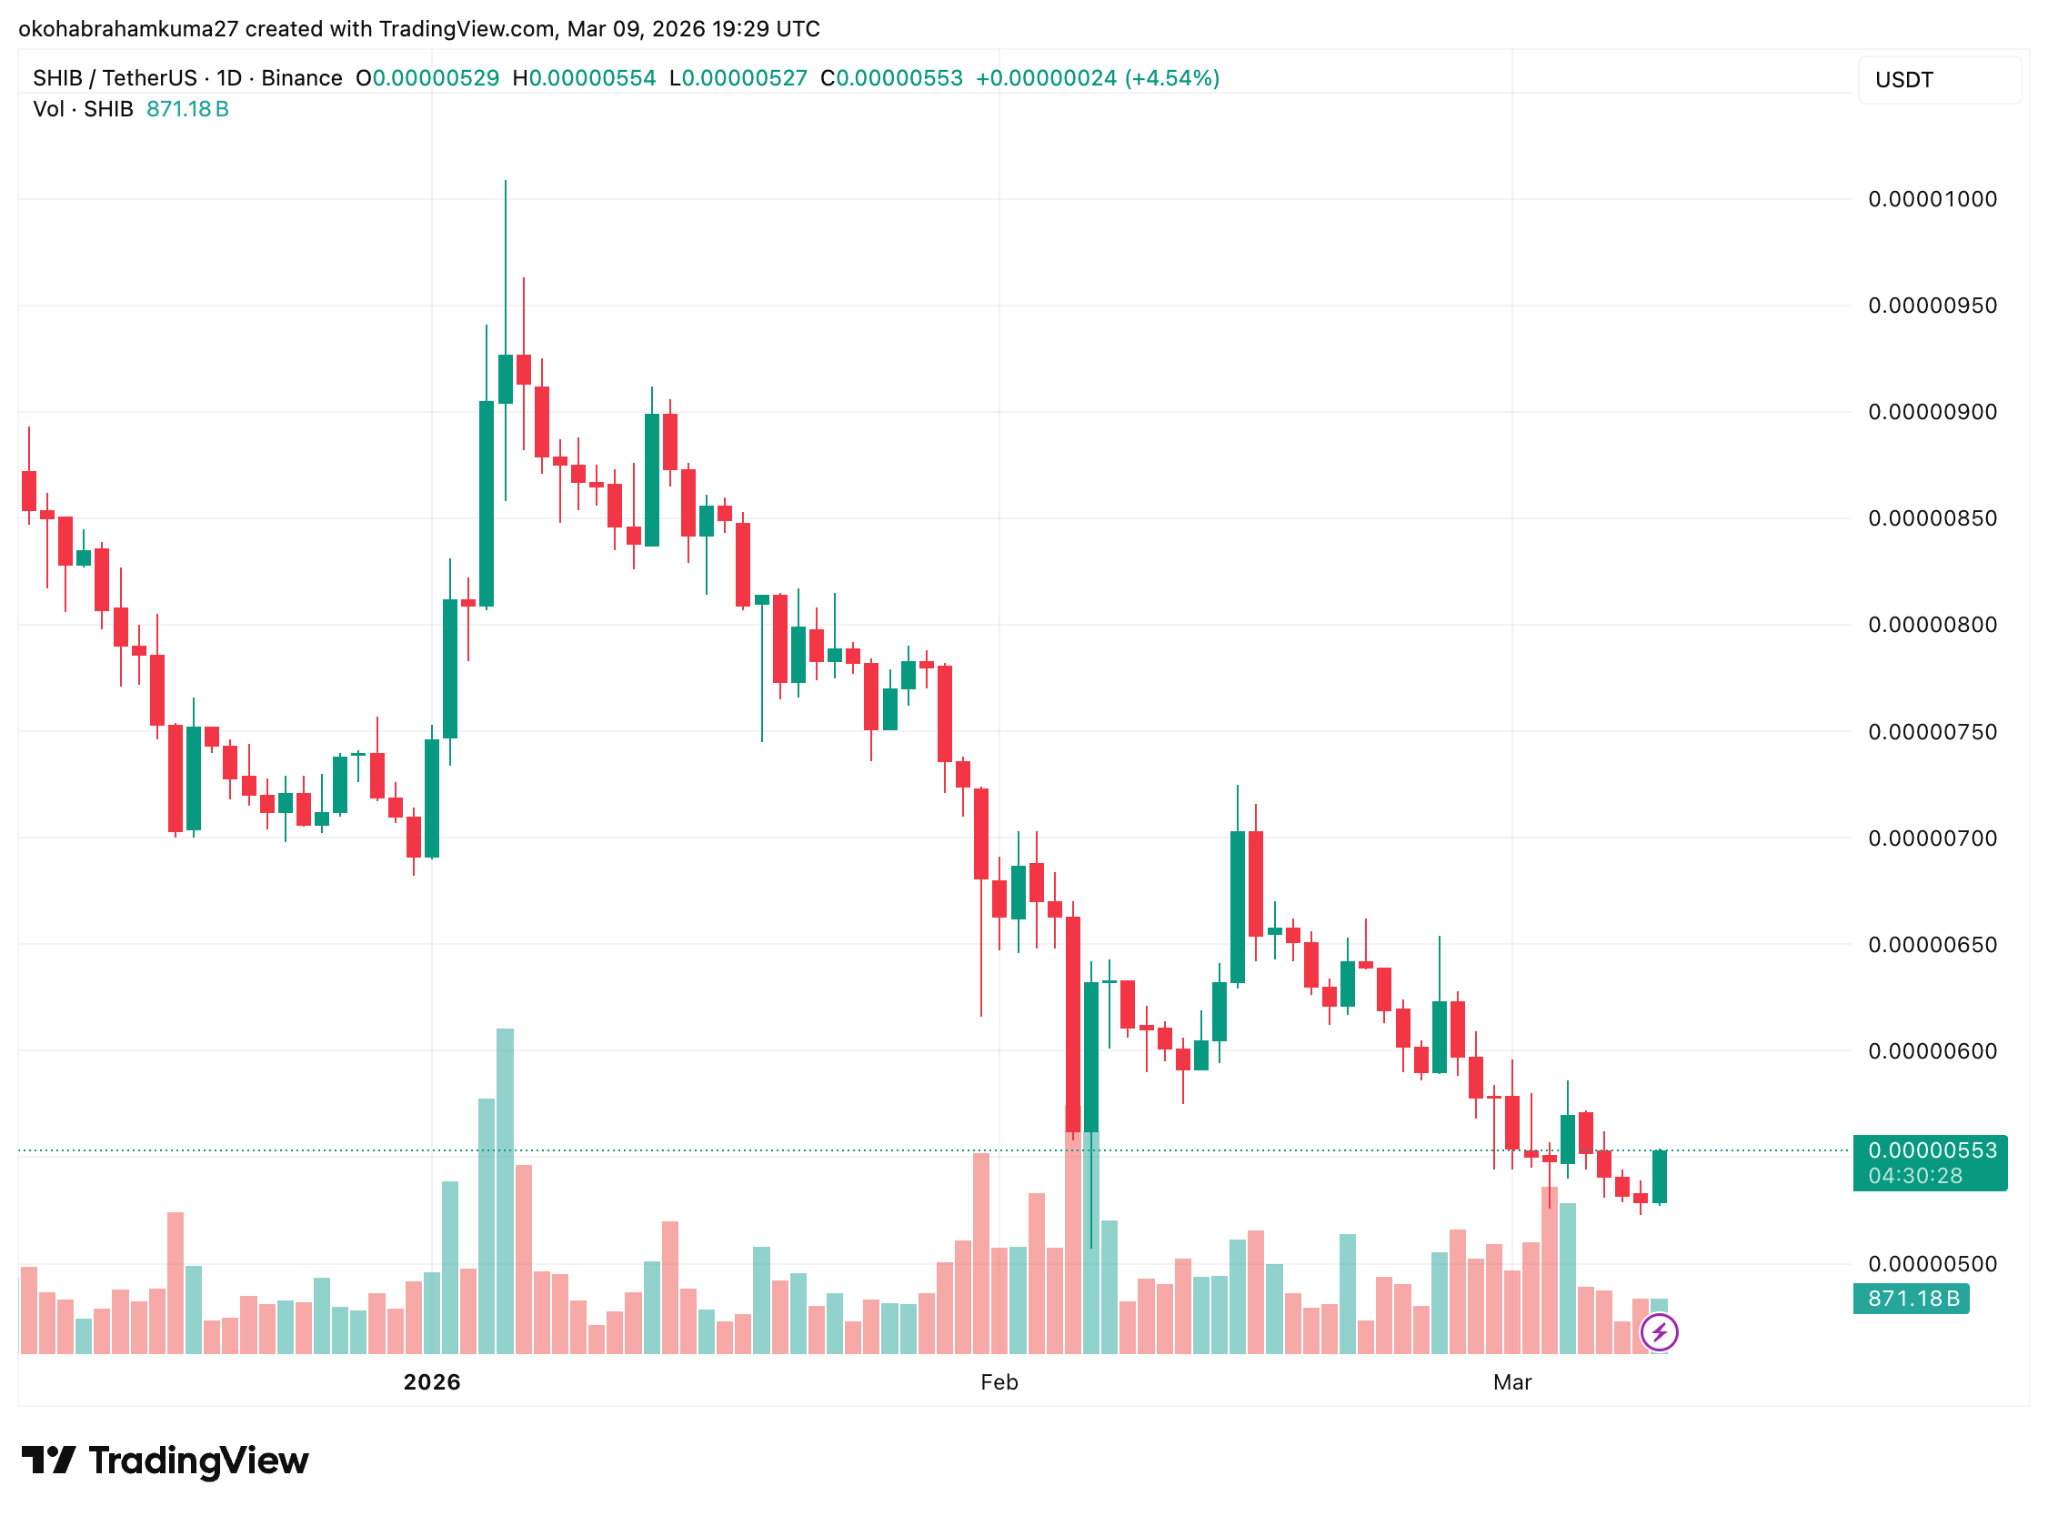
Looking at the long-term Shiba Inu forecast, the numbers are actively depressing for current holders. By the end of 2026, the token is forecasted to drop by 9%, and by 2030, the models predict a massive 58% collapse from its current rates.
Anyone hoping for a bullish SHIB future price is completely ignoring the mathematical reality of its huge market capitalization. Searching for a positive Shiba Inu price prediction is a waste of time when you could be putting your capital into a live, functioning artificial intelligence tool that actually tracks market movements for you.
Dogecoin price prediction
Just like a struggling Shiba Inu price prediction, Dogecoin offers an average outlook for investors hoping for life-changing wealth. Currently trading at $0.09088 as of March 9th, the original meme coin is suffocating under an extreme fear market rating. The asset is trapped below its 50-Day SMA of $0.1050 and is miles away from its 200-Day SMA, confirming a strong, sustained bearish trend.
While DOGE is forecasted to hit $0.1139 by the end of 2026, that represents a tiny 25% increase. A small 25% gain by the end of the year is an incredibly inefficient use of capital. DeepSnitch AI is completely positioned to outrun both DOGE and SHIB because it offers something these meme coins never will: real, daily utility that helps you avoid scams and time your trades perfectly.
The bottom line
As political heavyweights like Nigel Farage pour hundreds of thousands of dollars into Bitcoin treasuries, everyday investors must realize that the market is changing. Relying on a stagnant Shiba Inu future price is a proven way to lose money.
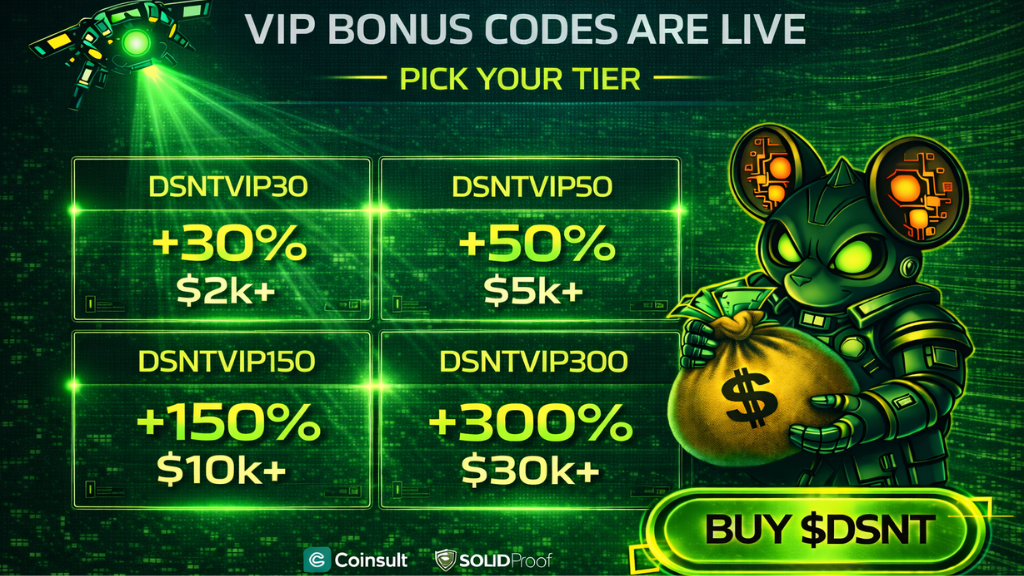
While the consensus on the Shiba Inu price prediction remains heavily bearish, DeepSnitch AI is heavily undervalued and completely primed for a 300x explosion upon its UniSwap launch. You only have a few days left to grab this whale-tracking tool before it goes public. And you can earn 30% extra tokens by using the promo code DSNTVIP30.
Visit the official DeepSnitch AI website, join Telegram, and follow on X for more updates.

FAQs
Why is the current Shiba Inu price prediction so negative across the market?
The current Shiba Inu price prediction is deeply negative because the asset has no daily utility, relying entirely on fading social media hype.
How does a bearish Shiba Inu forecast push investors toward DeepSnitch AI?
A highly bearish Shiba Inu forecast forces smart investors to realize that meme coins are dead, pushing them to rotate their funds into DeepSnitch AI.
What prevents an aggressive SHIB price target from happening in 2026?
An aggressive SHIB price target is mathematically impossible because the circulating supply of the token is far too massive.
Disclaimer: This is a Press Release provided by a third party who is responsible for the content. Please conduct your own research before taking any action based on the content.


TLDR:
- Banks warn crypto companies may act as shadow banks without full oversight.
- National charters allow crypto firms to operate across all U.S. states efficiently.
- Circle and Ripple seek federal trust charters to expand payments and custody services.
- Legal battles could determine the regulatory framework for digital financial services.
Crypto bank regulation is drawing attention as U.S. banks confront regulators over national trust charters for crypto firms.
The discussion revolves around regulatory parity and operational control in the emerging digital finance sector.
Federal Charters Expand Crypto Operations
Federal trust charters enable crypto companies to operate nationwide without separate state approvals. Circle and Ripple are among the firms seeking these licenses to scale their operations efficiently.
Such charters allow crypto companies to hold customer funds, facilitate payments, and manage settlements across all 50 states. This provides capabilities traditionally reserved for regulated banks.
Wall Street banks view these charters as creating an uneven competitive environment. By allowing crypto firms to perform bank-like activities without the same compliance framework, national charters could disrupt traditional banking models.
Banks operate under stringent rules, including capital requirements, liquidity ratios, stress tests, and consumer protection regulations.
These safeguards are designed to reduce systemic risk and protect depositors. Crypto firms could operate outside some of these rules, which raises concerns about regulatory gaps.
The potential national reach of crypto firms could accelerate the adoption of digital financial services. This expansion would allow them to compete directly with banks in custody services, payment processing, and settlement infrastructure.
Legal experts note that federal charters would formalize crypto firms’ roles in the financial system while allowing them operational flexibility not required of traditional banks. This duality lies at the center of current disputes.
Banks Raise Shadow Banking Concerns
The Bank Policy Institute, representing major U.S. banks, warns that crypto companies could act as shadow banks. Shadow banking refers to entities performing banking functions outside traditional oversight.
Historical cases, such as pre-2008 structured investment vehicles, show how lightly regulated institutions can amplify systemic risk.
Banks caution that granting federal charters without full regulatory parity could recreate similar vulnerabilities in digital finance.
Competition is another factor. Crypto firms are building payment infrastructure, issuing stablecoins, and providing asset custody. Federal charters would enable rapid scaling with fewer compliance burdens than traditional banks.
Regulators must balance innovation and stability. Allowing charters can foster blockchain development in the U.S. while providing oversight.
However, hybrid institutions operating under mixed rules could create new regulatory challenges.
Analysts and market watchers have highlighted growing attention on how national charters will reshape the relationship between crypto companies and traditional banks. The legal and regulatory outcomes will determine the future role of crypto firms in the U.S. financial system.


The U.S. Senate is finally treating stablecoins as extensions of the dollar system itself, using the GENIUS Act to pull digital dollars inside the regulatory perimeter.
Summary
- The GENIUS Act passed the Senate 68–30, requiring payment stablecoins to be fully backed by cash and short‑term Treasuries with frequent, public reserve disclosures.
- Built on the Lummis–Gillibrand blueprint, the bill splits oversight between bank regulators and states while explicitly pitching regulated stablecoins as a way to cement U.S. dollar dominance.
- Critics warn the framework could entrench Trump‑linked ventures like World Liberty Financial and cement a two‑tier regime that squeezes offshore “grey‑market” stablecoins in the name of fighting illicit finance.
The U.S. Senate is finally treating stablecoins like part of the dollar system, not a crypto side project. In June 2025, senators passed the GENIUS Act, a landmark bill to create a federal regulatory framework for dollar‑pegged stablecoins, after more than a year of bipartisan trench warfare over Trump‑linked crypto politics, illicit finance, and the future of U.S. monetary power.
What the senator‑backed stablecoin bill actually does
Reuters reports that the GENIUS Act passed the Senate 68–30, with a bloc of Democrats crossing the aisle to join most Republicans in backing rules that would require payment stablecoins to be fully backed by “liquid assets like U.S. dollars and short‑term Treasury securities,” and mandate monthly public disclosure of reserves. Mayer Brown notes that the bill builds directly on the earlier Lummis–Gillibrand Payment Stablecoin Act, which set out a comprehensive regime for dollar‑backed tokens, splitting supervisory roles between federal and state regulators and explicitly positioning regulated U.S. stablecoins as a tool to “promote U.S. dollar dominance.”
Senator Kirsten Gillibrand’s own statement is blunt: “Passing a regulatory framework for stablecoins is absolutely critical to maintaining the U.S. dollar’s dominance, promoting responsible innovation, protecting consumers and cracking down on money laundering and illicit finance.” The bill aims to “fence in” risks around reserves, custody, insolvency and privacy, while giving banks and licensed non‑banks a clear path to issue payment tokens that can move “nearly‑instantly” around the world at lower cost than legacy wires and remittance products.
Politics, risks and macro stakes
The politics are nasty because the stakes are large. Reuters and Politico detail how Democratic support briefly collapsed in May 2025 over concerns that Republican drafters had watered down safeguards on foreign stablecoins and anti‑money‑laundering, just as President Trump’s own stablecoin venture, World Liberty Financial, was tied to a $2 billion Abu Dhabi‑backed investment into Binance. Senator Elizabeth Warren attacked the bill as creating a “super highway” for corruption and warned it could open the door for tech giants like Amazon and Meta to launch their own tokens without sufficient constraints.
Behind the floor drama is a clear macro calculation. The Lummis–Gillibrand materials cite UN estimates that offshore, unregulated stablecoins were used for roughly $17 billion in illicit transactions between 2022 and 2023, ranging from drug trafficking to sanctions evasion, and argue that forcing issuers onshore under tough rules would “cripple” that channel while locking in the dollar as the base currency of a multi‑trillion‑dollar digital economy. U.S. Treasury officials have gone further in speeches and private briefings, floating scenarios where regulated stablecoins generate trillions in incremental demand for Treasuries by 2030, effectively turning crypto rails into a new distribution channel for U.S. public debt.
For crypto markets, the senator‑driven stablecoin push is both a legitimization and a constraint. On one side, a clear federal framework promises mainstream integrations with banks, payments firms and on‑chain finance – a path to scale for the same dollar tokens that today power remittances on BNB Chain and elsewhere. On the other, the combination of reserve rules, licensing and harsh penalties for offshore USD tokens is meant to squeeze the grey‑market coins that made crypto dollarization possible in the first place. The message from Washington’s most aggressive stablecoin hawks is simple: digital dollars are welcome, as long as they stay inside the regulatory perimeter and serve U.S. monetary and security interests first.
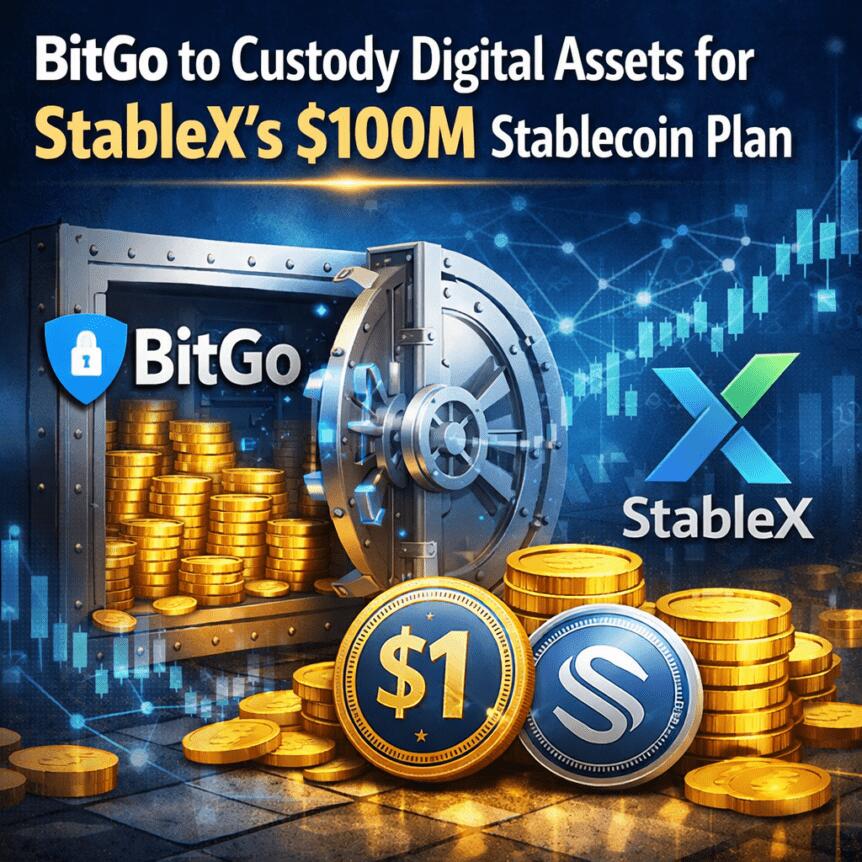
BitGo has inked a strategic arrangement to custody and execute trades for StableX Technologies’ digital asset treasury, as StableX targets up to $100 million in crypto acquisitions tied to the stablecoin sector. Under the agreement, BitGo Trust Company will act as custodian for StableX’s holdings, while BitGo’s over-the-counter liquidity desk will facilitate the company’s planned purchases. StableX (EXCHANGE: SBLX) is a Nasdaq-listed company focused on stablecoin infrastructure, and it has already begun building its digital-asset treasury, including token purchases such as FLUID (CRYPTO: FLUID) and LINK (CRYPTO: LINK) in October. The deal signals a broader shift toward institutional-grade custody and execution infrastructure for a wider set of assets beyond Bitcoin-centric treasury strategies (CRYPTO: BTC).
BitGo’s involvement marks a notable step in the maturation of digital-asset treasuries among publicly traded companies. BitGo, which trades on the NYSE under BTGO, has long highlighted its role as an infrastructure provider for institutions seeking secure custody and reliable liquidity. The partnership with StableX comes as BitGo’s leadership emphasizes expanding access to custody and execution for non-Bitcoin assets, underscoring a trend where traditional finance is increasingly engaging with the stablecoin ecosystem and related tokenized assets.
“The partnership underscores BitGo’s expanding role as the go-to infrastructure provider for a new wave of publicly traded companies building digital asset treasury strategies,”
The news follows StableX’s earlier steps to assemble a digital asset treasury. The company has publicly disclosed prior token purchases, including FLUID and LINK, signaling an intentional move toward diversification beyond fiat reserves and pure cash equivalents. The inclusion of LINK signals StableX’s interest inacles within the broader decentralized finance and oracle ecosystems, while FLUID represents exposure to niche protocol tokens that some institutions view as strategic bets within the stablecoin infrastructure space. This aligns with a growing appetite among investors to diversify treasury holdings with crypto assets that could function as liquidity rails or settlement primitives in a rapidly evolving digital economy.
BitGo’s public-market journey also colors the narrative. The company went public in January, pricing its shares at $18 and experiencing a strong first-day move before trading pressure moderated. The stock’s inception-day performance reflected investor interest in crypto infrastructure plays, and the subsequent trading session saw the stock advance and retreat in line with broader market sentiment toward fintech and crypto-enabled businesses. The partnership with StableX is thus positioned as a practical extension of BitGo’s mission to provide institutional-grade custody and liquidity solutions for a new generation of digital-asset treasuries.
In contextual terms, the deal sits within a broader ecosystem of products and products-leaning investor instruments aimed at stablecoins and their supporting infrastructure. The stablecoin universe has seen sustained capital inflows, with total market capitalization rising to substantial levels and attracting attention from asset managers eager to provide related exposure. The sector’s size and ongoing integration into traditional markets have sparked interest from investment products and ETF sponsors seeking to design indices and vehicles that capture the value chain around stablecoins, payments rails, and tokenized real-world assets. The market continues to evolve as an array of financiers and issuers explore how best to combine custody, settlement, and liquidity across these assets.
Beyond StableX’s direct momentum, the broader ETF and tokenization landscape adds another layer to the narrative. In September, Bitwise filed with the U.S. Securities and Exchange Commission to launch a Stablecoin & Tokenization ETF designed to track companies and digital assets tied to stablecoins, tokenization, and related infrastructure. The proposed ETF would follow an index comprising firms involved in stablecoin issuance, infrastructure, payments, and exchanges, alongside widely traded crypto assets such as Bitcoin (CRYPTO: BTC) and Ether (CRYPTO: ETH). This proposed vehicle sits alongside MarketVector Indexes’ benchmarks for stablecoin and tokenization infrastructure and Amplify ETFs’ own issuer products, including the Amplify Tokenization Technology ETF (TKNQ) and the Amplify Stablecoin Technology ETF (STBQ).
Market attention to stablecoins and their infrastructure has intensified as the sector’s scale expands. DefiLlama data show stablecoins collectively approaching a multi-hundred-billion-dollar market cap, underscoring why institutional players are increasingly considering products and services that enable secure custody, efficient liquidity, and reliable settlement for these tokens. The sector’s growth is mirrored in the real-world ecosystem, where large financial players and payment networks are actively exploring how to incorporate stablecoins into settlement rails, cross-border payments, and treasury management. PayPal’s PYUSD and Western Union’s USDPT are among the high-profile examples cited by market observers as signals that traditional finance is integrating digital-dollar tokens into everyday workflows. PYUSD has already seen broad usage in payments and settlement, while USDPT is anticipated to be rolled out in a Solana-based settlement network within the first half of 2026, signaling a broader push toward on-chain settlement capabilities.
In this environment, the BitGo-StableX partnership stands as a practical case study of how custody and liquidity infrastructure can underpin a growing stablecoin treasury. It illustrates how a Nasdaq-listed issuer can pursue a diversified crypto asset strategy with institutional-grade safeguards and execution capabilities, a model that could become more common as more publicly traded firms pursue dynamic crypto-treasury programmes. The emphasis on tokens beyond BTC highlights an expanding universe of crypto assets that institutions want to hold within regulated, custodial frameworks, signaling a maturing market for digital-asset treasury management and a deeper integration of crypto into mainstream corporate finance.
Why it matters
The collaboration between BitGo and StableX marks a tangible step toward legitimizing and scaling digital-asset treasuries for publicly traded entities. By combining custody with an OTC liquidity desk, the partnership aims to reduce operational risk and improve execution efficiency for treasury diversification into stablecoin infrastructure tokens and related assets. This development could accelerate demand for regulated, institutional-grade custody partners as more corporations explore crypto treasury strategies beyond Bitcoin exposure.
From a market structure standpoint, the move supports a broader trend: the emergence of investment vehicles and allocation strategies that reflect an evolving crypto economy. With ETF sponsors pursuing indices that track stablecoin issuers, infrastructure providers, and tokenization plays, the ecosystem is aligning more closely with traditional asset-management practices. The market’s attention to stablecoin infrastructure—backed by data on sector size and new tokenization benchmarks—suggests a growing appetite for vehicles that offer diversified exposure to the stablecoin ecosystem while maintaining compliance and risk controls demanded by institutional buyers.
For builders and investors, the partnership underscores the need for robust, audited custody and settlement layers as digital assets move from speculative instruments to treasury instruments and settlement primitives. The emphasis on tokens such as FLUID and LINK within StableX’s treasury demonstrates a willingness to explore specialized tokens that may offer liquidity and governance utilities in a diversified portfolio. As the market continues to grow, the compatibility of custodial services with trading desks and OTC liquidity will become a key differentiator for infrastructure providers seeking scale in a regulated environment.
What to watch next
- Whether BitGo and StableX close on further terms of the custody and trading arrangement, and the pace at which StableX deploys additional capital into its digital asset treasury.
- Any regulatory or SEC developments related to Bitwise’s Stablecoin & Tokenization ETF filing and related index design, including inclusion criteria for stablecoin issuers and infrastructure firms.
- Updates on the token purchases within StableX’s treasury, including additional positions in FLUID, LINK, or other stablecoin ecosystem assets.
- Progress on the broader ETF/benchmark landscape, including MarketVector’s benchmarks and Amplify ETFs’ TKNQ and STBQ performance and capital inflows.
Sources & verification
- BitGo and StableX strategic partnership press release detailing custody and OTC trading arrangements.
- StableX’s token purchases and treasury-building efforts disclosed in prior communications (including October token acquisitions).
- Bitwise Stablecoin & Tokenization ETF filing with the U.S. SEC and related index construction discussion.
- Amplify ETFs’ product lineup (TKNQ, STBQ) and MarketVector’s stablecoin/tokenization benchmarks.
- Market data on the size of the stablecoin market from DefiLlama and publicly cited examples such as PYUSD (PayPal) and USDPT (Western Union) in relation to stablecoin adoption.
BitGo expands custodial and trading role as StableX scales its digital asset treasury
BitGo’s institutional-grade custody and OTC liquidity capabilities position it as a critical enabler for the Series of moves in the stablecoin infrastructure space. The company’s public market presence, combined with its expanding product suite for institutional clients, provides a foundation for integrating custody with scalable execution as StableX builds its digital asset treasury. The narrative around this partnership is more than a single deal; it reflects a broader alignment between regulated custodians, publicly traded treasury strategies, and the infrastructure required to support a diversified portfolio of stablecoin assets and related tokens. While the market continues to weigh the implications of this agreement, the underlying trend remains clear: mainstream financial actors are embracing crypto-native treasury practices through credible, regulated channels.
For readers and market participants, the development signals ongoing maturation in the space. Treasuries that combine secure custody with efficient liquidity provision may become more common as more firms pursue crypto wealth management strategies that encompass a spectrum of assets—from stablecoins and tokenized assets to specialized protocol tokens. The next steps will hinge on how swiftly institutions can integrate these capabilities with risk controls, regulatory compliance, and governance considerations as they expand the scope of their digital-asset treasury programs.
For years, GuruFocus has cultivated a loyal community of value investors through its signature feature: monitoring the investment portfolios of market legends such as Warren Buffett, Charlie Munger, and other prominent fund managers. The platform marries guru portfolio surveillance with comprehensive fundamental analysis capabilities tailored specifically for adherents of value investing principles.
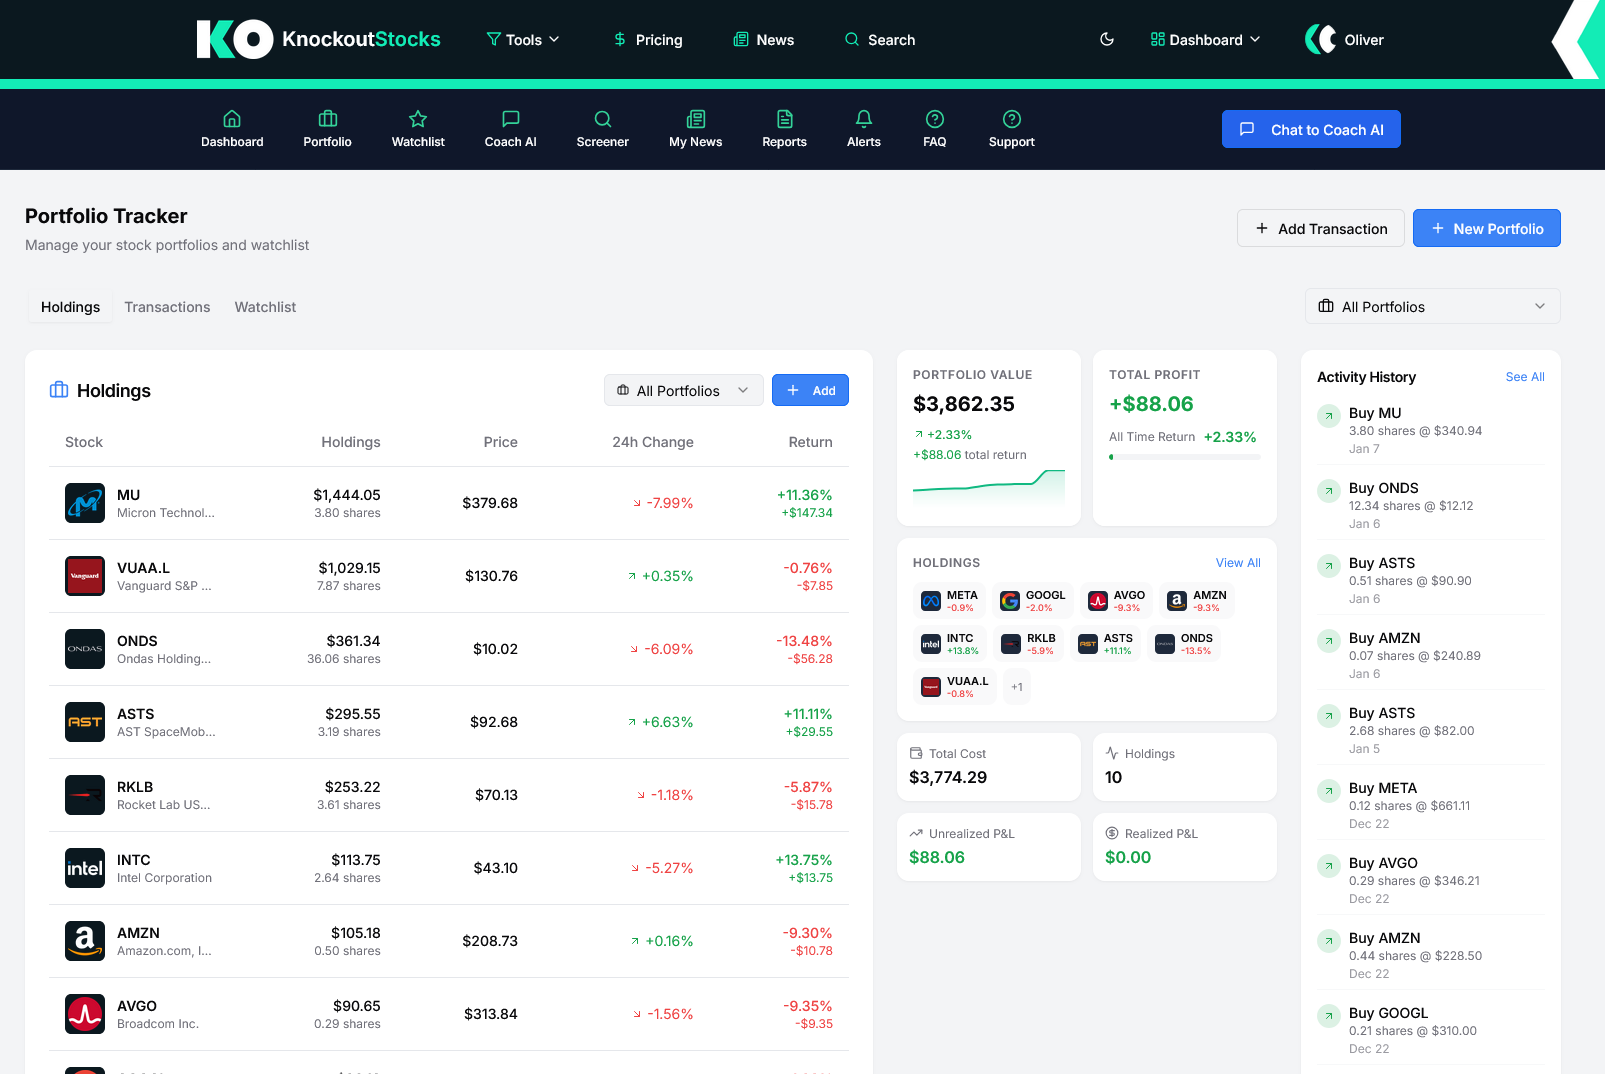
KnockoutStocks pursues a more expansive strategy. It merges AI-driven research capabilities, a unique stock evaluation system, hand-picked stock recommendations, and portfolio management tools into a unified platform designed for contemporary investors. While both platforms deliver serious research capabilities, they cater to distinctly different investment approaches and user priorities.
Platform Overview
What Is KnockoutStocks?
KnockoutStocks represents an AI-enhanced stock research solution centered on the KO Score — a proprietary evaluation metric that assigns stocks a rating between 0 and 100. This system assesses every company using five fundamental pillars: profitability, financial stability, growth trajectory, market momentum, and analyst sentiment.
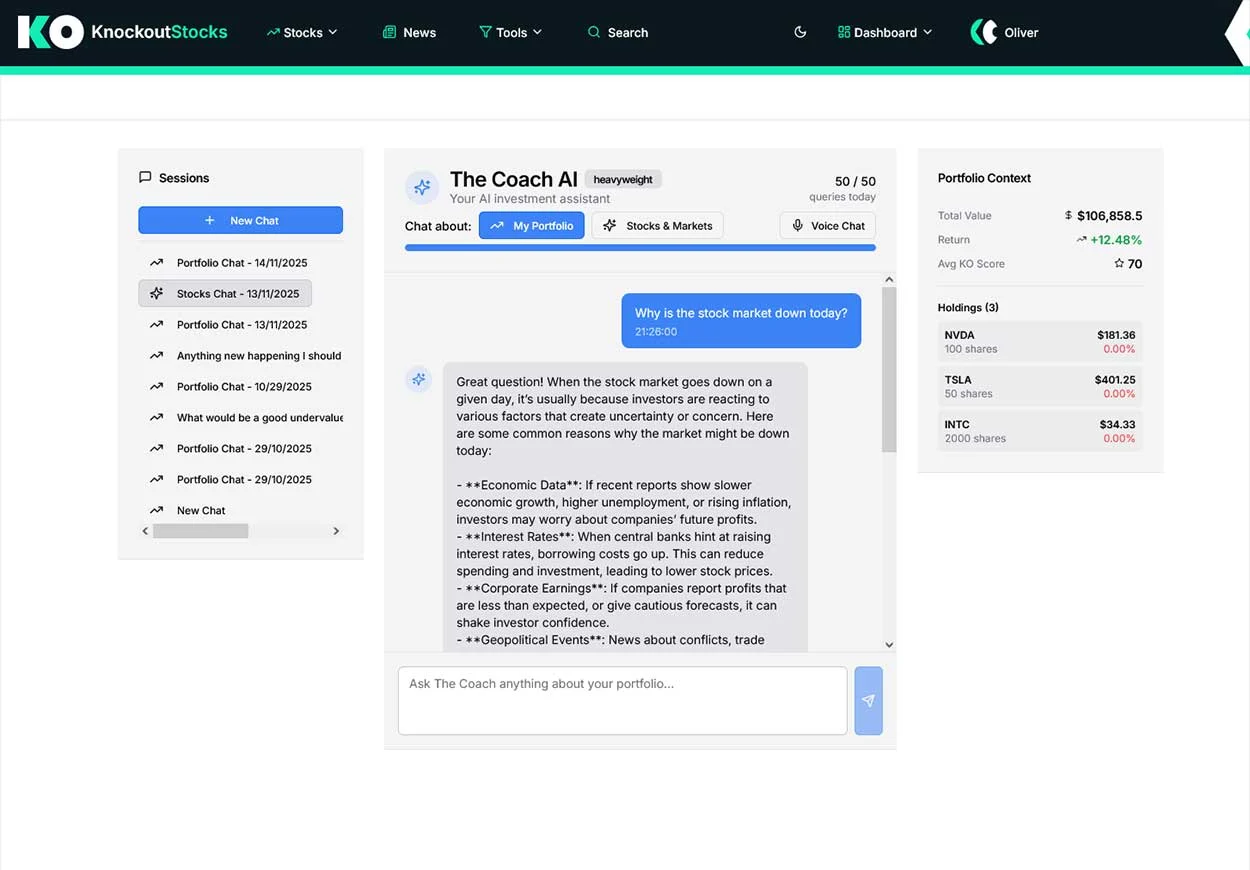
The platform features an AI-powered investment advisor, on-demand AI-generated stock analysis reports, a sophisticated stock screening tool, expertly curated investment recommendations, portfolio management functionality, and customized market intelligence. It aims to deliver investors rapid, transparent, evidence-based insights without requiring multiple tools or service subscriptions.
What Is GuruFocus?
GuruFocus is an investment research platform established in 2004. Its foundation rests on monitoring the buying and selling activities of the world’s most successful investors, combining that intelligence with thorough fundamental analysis to identify quality companies at reasonable valuations.
The platform enjoys popularity among value investors who embrace the philosophies of Warren Buffett, Benjamin Graham, and similar investing icons. It delivers guru portfolio monitoring, discounted cash flow analysis tools, financial stability ratings, and an extensive array of fundamental data resources.
Feature Comparison
Stock Research and Scoring
GuruFocus evaluates stocks through its GF Score — a ranking framework that assesses financial robustness, profitability metrics, growth potential, valuation levels, and momentum indicators. The platform also provides a GF Value projection — its proprietary fair value calculation derived from historical valuation ratios, growth forecasts, and business predictability. For value-oriented investors seeking to identify stocks trading beneath intrinsic value, these resources prove genuinely beneficial.
KnockoutStocks employs the KO Score — a unified metric ranging from 0 to 100 that synthesizes five weighted components: profitability, financial stability, growth prospects, market momentum, and analyst consensus. The KO Score emphasizes comprehensive stock quality and market positioning rather than valuation exclusively, creating a more agile and adaptable evaluation tool suitable for diverse investing philosophies — extending beyond traditional value investing.
AI Tools and Insights
KnockoutStocks integrates AI as a foundational element. The platform’s AI advisor enables users to pose questions regarding specific stocks, portfolio holdings, or market dynamics whenever needed. Premium subscription levels provide voice-enabled AI interaction and unrestricted daily query allowances.

GuruFocus lacks a dedicated AI investment advisor. While the platform has started incorporating certain AI-enhanced capabilities for condensing financial information and producing company summaries, AI functionality remains peripheral rather than central to the GuruFocus user experience. Investors seeking immediate AI-powered research assistance and coaching will discover KnockoutStocks substantially more advanced in this domain.
AI-Generated Stock Reports
KnockoutStocks produces immediate AI-powered stock analysis reports for any publicly traded company upon request. Each document encompasses company background, financial condition, critical metrics, market behavior, recent developments, and analyst perspectives — compiled within seconds.
GuruFocus creates thorough stock analysis displays featuring extensive fundamental statistics, financial chronology, and valuation measurements. While the information depth proves impressive, it appears as unprocessed data rather than a polished AI-assembled research document. Investors must interpret the data independently to form conclusions.
Stock Picks
KnockoutStocks delivers a carefully selected, high-conviction stock portfolio personally chosen by its research professionals. Every selection earns inclusion through meticulous research, sector examination, and practical investment rationale grounded in fundamental strength, sustainable competitive advantages, and long-term growth capacity.
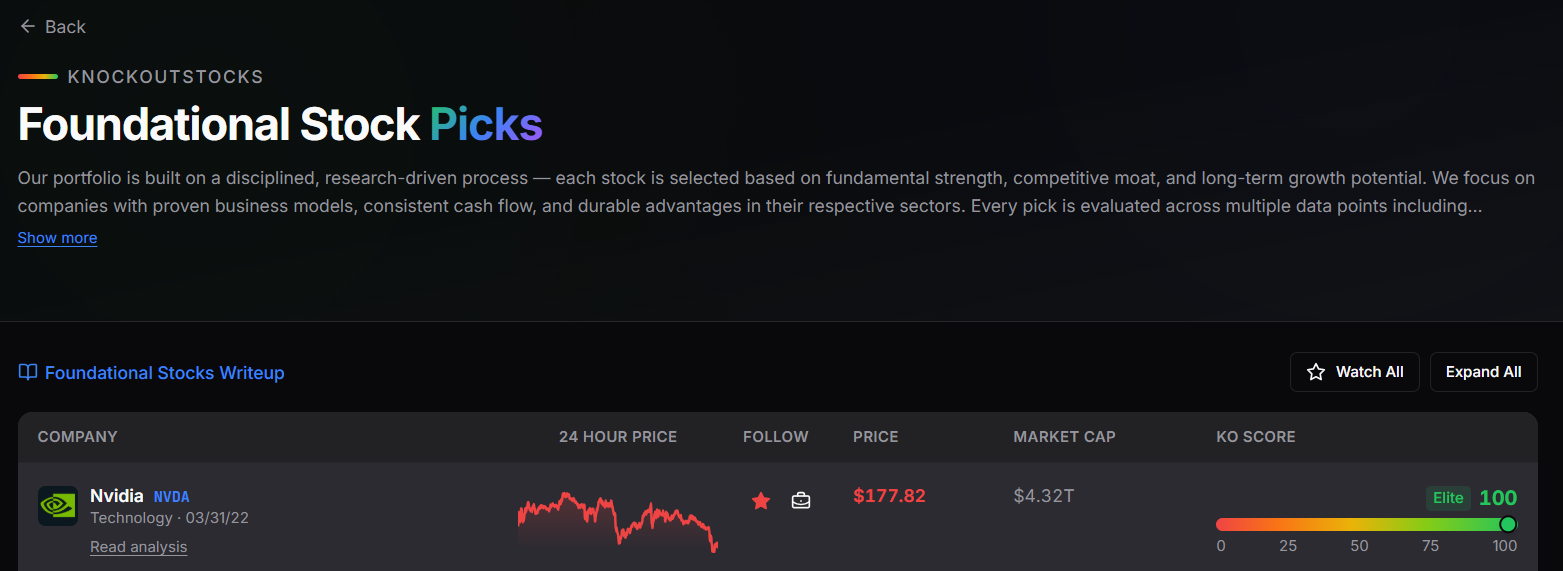
The portfolio undergoes continuous monitoring, with position adjustments occurring only when analytical evidence warrants change. Complete access to the Stock Picks section — including current holdings, performance metrics, and comprehensive justification for each position — becomes available to Middleweight and Heavyweight subscribers.
GuruFocus does not provide its own curated investment portfolio. Instead, it furnishes tools for tracking the buying and selling activities of guru investors. While this context proves valuable, it differs fundamentally from an independent, high-conviction portfolio constructed through original research with documented logic supporting every selection.
Guru Portfolio Tracking
This represents GuruFocus’s distinctive and substantial competitive edge. The platform monitors 13F regulatory filings from hundreds of elite fund managers and legendary investors, revealing precisely what they’re purchasing, divesting, and maintaining. For investors who follow Warren Buffett, Bill Ackman, or other prominent figures, accessing near-real-time portfolio activity proves genuinely valuable.
KnockoutStocks presently does not include guru or institutional portfolio surveillance. Its emphasis centers on independent stock investigation and AI-enhanced analysis rather than monitoring other investors’ activities. For value investors utilizing guru behavior as a primary research indicator, GuruFocus maintains a definitive advantage in this particular capability.
Valuation and DCF Tools
GuruFocus offers among the most exhaustive valuation instruments available to individual investors. Its discounted cash flow calculator enables users to construct intrinsic value projections using customizable assumptions. The platform also monitors price-to-GF-Value ratios, Peter Lynch charts, and numerous historical valuation multiples spanning years.
KnockoutStocks integrates valuation indicators within its KO Score through profitability and growth components but doesn’t provide independent DCF calculators or detailed historical valuation modeling capabilities. For investors whose methodology centers on computing precise intrinsic value estimates, GuruFocus extends further in this territory.
Financial Strength and Quality Metrics
GuruFocus monitors an extensive range of financial quality indicators including the Altman Z-Score, Piotroski F-Score, and Beneish M-Score. These represent established quantitative frameworks employed by sophisticated value investors to evaluate financial robustness, earnings integrity, and potential risks of financial distress or accounting manipulation.
KnockoutStocks addresses financial stability as one of five KO Score pillars, incorporating leverage ratios, balance sheet resilience, and financial soundness. While it doesn’t delve as deeply into individual quantitative models like the Piotroski or Altman scores, the KO Score delivers a quicker holistic assessment of financial quality without requiring interpretation of multiple discrete metrics.
Stock Screener
KnockoutStocks includes a sophisticated screening tool with over 20 filtering criteria spanning KO Score, market capitalization, price levels, trading volume, fundamental measurements, and technical signals. Complete screener functionality is accessible on the complimentary plan.
GuruFocus features a robust screening system with hundreds of fundamental filters encompassing GF Score, GF Value, financial strength measurements, valuation ratios, and guru ownership information. For value investors wanting to screen using particular quantitative standards, GuruFocus provides greater fundamental filtering depth. However, most advanced screening capabilities require premium membership.
Portfolio Tracking
KnockoutStocks provides comprehensive portfolio monitoring with real-time performance statistics, profit and loss documentation, and AI-enhanced portfolio evaluation. The Heavyweight subscription supports up to 100 securities per portfolio with unlimited portfolio creation and AI-generated portfolio assessments.
GuruFocus includes a portfolio monitor that overlays its GF Score, GF Value, and financial strength metrics onto user holdings. While useful for tracking fundamental quality and valuation of portfolio positions, it doesn’t deliver real-time profit and loss monitoring or AI-powered portfolio analysis matching KnockoutStocks’ sophistication.
Alerts and Updates
KnockoutStocks transmits customized daily or weekly email notifications covering watchlist activity, leading KO Score changes, earnings releases, analyst rating upgrades, and breaking news aligned with your portfolio.
GuruFocus dispatches alerts for guru transaction activity, GF Score modifications, valuation updates, and dividend announcements. For value investors monitoring guru behavior and valuation signals, these notifications are appropriately focused and authentically helpful.
Pricing
KnockoutStocks provides three subscription levels. The complimentary tier includes complete screener access, one portfolio, five watchlist securities, one AI conversation weekly, and one AI stock report weekly. The Middleweight subscription costs $19.99 monthly with 10 AI queries daily and 10 AI reports weekly. The Heavyweight subscription runs $59.99 monthly with unlimited AI access, voice-enabled coaching, PDF report generation, and CSV data exports.
GuruFocus pricing begins around $49 monthly for the Premium subscription and extends to approximately $109 monthly for the Premium Plus tier with complete feature access including unlimited DCF models and advanced screening capabilities. It ranks among the more costly retail research platforms available, reflecting its comprehensive data offering.
Pros and Cons
KnockoutStocks
Pros
- KO Score provides rapid, comprehensive quality rankings across thousands of securities
- Integrated AI advisor for on-demand stock and portfolio inquiries
- Immediate AI-generated stock reports available for any company anytime
- Expertly curated high-conviction stock portfolio with complete research documentation
- Complete screener access included in free membership
- Robust portfolio tracking with real-time information and AI interpretation
- Voice-enabled AI coach available on premium subscription
- Considerably more affordable across all membership tiers
- Customized news and alerts matching your investment holdings
Cons
- Absence of guru or institutional portfolio surveillance
- No DCF calculator or comprehensive intrinsic value modeling capabilities
- Doesn’t monitor Piotroski, Altman, or Beneish scores separately
- Emerging platform still establishing its long-term performance history
- Less concentrated on pure value investing doctrine
GuruFocus
Pros
- Industry-leading guru and institutional portfolio surveillance
- Comprehensive valuation capabilities including DCF calculators and GF Value projections
- Monitors Piotroski F-Score, Altman Z-Score, and Beneish M-Score
- Exhaustive financial history extending back numerous years
- Powerful screening system with hundreds of fundamental criteria
- Optimal platform for committed value investors
- Well-established with extensive data coverage track record
Cons
- Lacks dedicated AI investment advisor
- No on-demand AI-generated stock analysis reports
- No expertly curated high-conviction stock portfolio
- Premium pricing compared to most retail research solutions
- Platform interface can feel overwhelming due to information density
- Concentrated focus on value investing restricts broader appeal
- Portfolio tracking lacks AI-driven interpretation and real-time performance monitoring
Which Platform Is Best for Different Investors?
Use KnockoutStocks if you:
Desire a comprehensive AI-enhanced research environment encompassing stock evaluation, instant analysis reports, portfolio management, and curated stock recommendations unified in one location. KnockoutStocks functions as your complete research ecosystem regardless of investment methodology.
Value AI-powered capabilities on demand — posing questions about securities, obtaining instant reports, and analyzing your portfolio without dedicating hours to processing raw financial information.
Seek access to a meticulously researched, high-conviction stock portfolio constructed on genuine fundamentals and long-term perspective. Middleweight and Heavyweight members receive complete access including performance monitoring and comprehensive reasoning behind each selection.
Identify as a growth, momentum, or hybrid investor desiring a platform evaluating securities across multiple dimensions beyond simple valuation. The KO Score captures the complete picture.
Want a more economical research solution without compromising analytical sophistication. KnockoutStocks furnishes serious research instruments at a fraction of GuruFocus’s cost.
Use GuruFocus if you:
Identify as a dedicated value investor following Warren Buffett, Benjamin Graham, or similar legendary investors and desire to monitor their portfolio transactions in near-real-time. GuruFocus specializes specifically in this capability and executes it better than any competitor.
Depend heavily on intrinsic value calculations and want the most thorough DCF modeling and valuation instruments available to individual investors. GuruFocus penetrates deeper here than virtually any alternative platform.
Need to screen securities using specific quantitative value measurements like Piotroski F-Score, Altman Z-Score, or Beneish M-Score as components of your research methodology.
Identify as a serious long-term value investor comfortable navigating substantial volumes of financial data and wanting the most comprehensive fundamental research toolkit available.
Final Verdict
GuruFocus and KnockoutStocks both represent serious research platforms, but they’re constructed around fundamentally different investment philosophies and user requirements.
GuruFocus excels in guru portfolio surveillance, comprehensive valuation modeling, and quantitative value investing instruments. If you’re a dedicated value investor studying what legendary investors are purchasing and want the most exhaustive fundamental analysis toolkit available, GuruFocus stands as the superior specialist resource for that particular methodology.
KnockoutStocks dominates in AI functionality, accessibility, curated stock recommendations, portfolio management, and overall cost efficiency. The KO Score evaluates securities more rapidly and comprehensively than the GF Score, the AI advisor delivers immediate insights that GuruFocus cannot replicate, and the curated stock selections provide a high-conviction foundation supported by authentic research. All these advantages come at substantially lower pricing.
For value investors in 2026 seeking deep guru tracking and intrinsic value tools, GuruFocus remains a specialist option worth evaluating. But for investors wanting a more intelligent, faster, AI-powered research platform covering the complete spectrum without a steep learning curve or expensive price point — KnockoutStocks emerges as the superior platform overall.
Crypto World
DeepSnitch AI Presale Launch Date Set for March 31 as Orbital Bitcoin Mining News Fires Up the Compute Sector: RENDER and AKT Are Moving, But $DSNT Is the 2000% Moonshot

A company called Starcloud, backed by Nvidia, just told the world it is building data centers in space to mine Bitcoin using solar-powered ASICs orbiting Earth. The company already launched an Nvidia H100 into orbit in November 2025 and plans to scale across 88,000 satellites.
When institutional-grade infrastructure starts chasing Bitcoin from space, it tells every trader paying attention that the demand side of this market is not cooling down. The compute revolution is wider than most are pricing in right now, and the DeepSnitch AI presale launch date of March 31 is landing right in the middle of it.
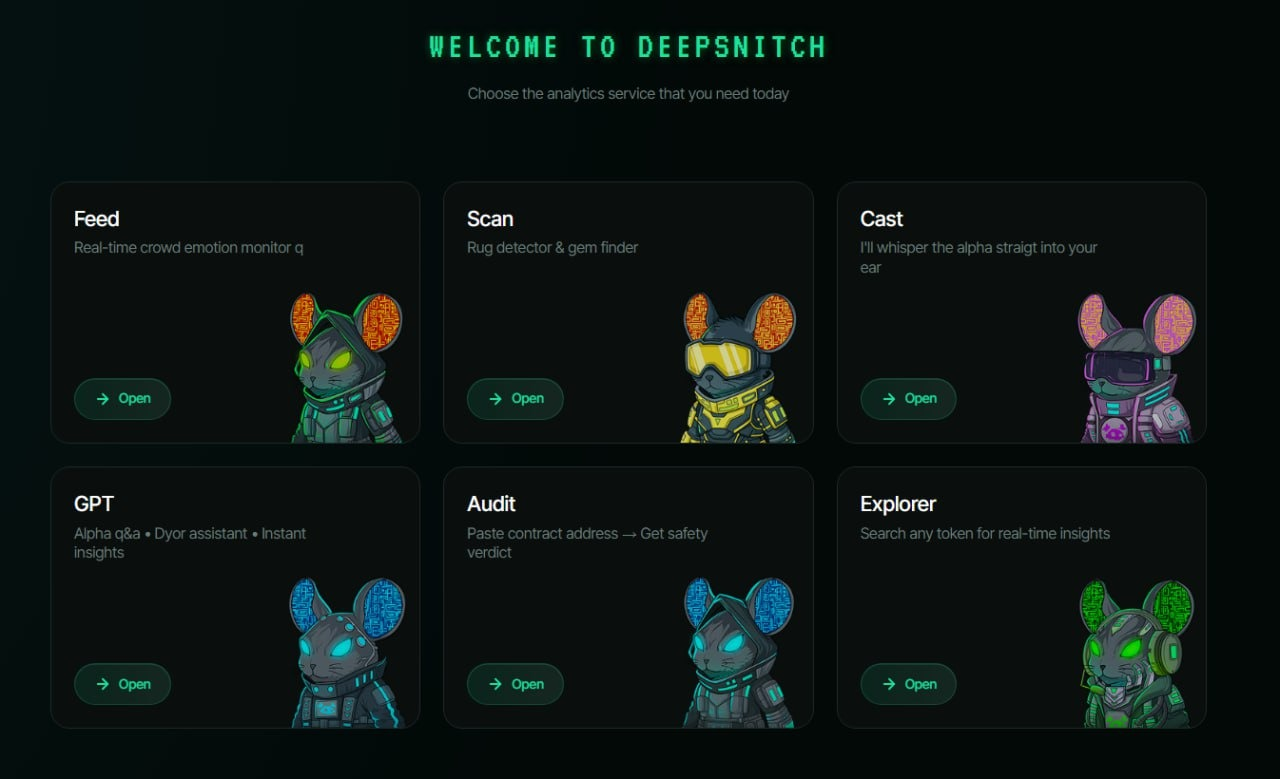
With $2M raised, 41.4M coins already staked, and 5 live AI tools running today, the DeepSnitch AI token launch is one of the most anticipated exits from presale heading into Q2.

Shocking: Bitcoin mining is moving to space
Starcloud, backed by Nvidia, just confirmed it will be the first project to mine Bitcoin from literal orbit when its second spacecraft launches later this year, and the crypto market has not fully priced this in yet.
The company already sent an Nvidia H100 into orbit in November 2025. Its data center network spanning 88,000 solar-powered satellites is engineered to make every earth-based mining operation look expensive and inefficient by comparison.
When Nvidia-backed institutional capital is deploying orbital Bitcoin mining infrastructure at this scale, the entire compute and decentralized infrastructure narrative for this cycle just got a massive fundamental catalyst underneath it.
The on-chain demand signal for compute tokens is flashing, and the traders who load the right positions before this thesis goes mainstream are the ones sitting on the fattest bags when the crowd finally catches up and starts aping in.
DeepSnitch AI token launch is the low-cap presale event that 100x hunters have been waiting for all cycle
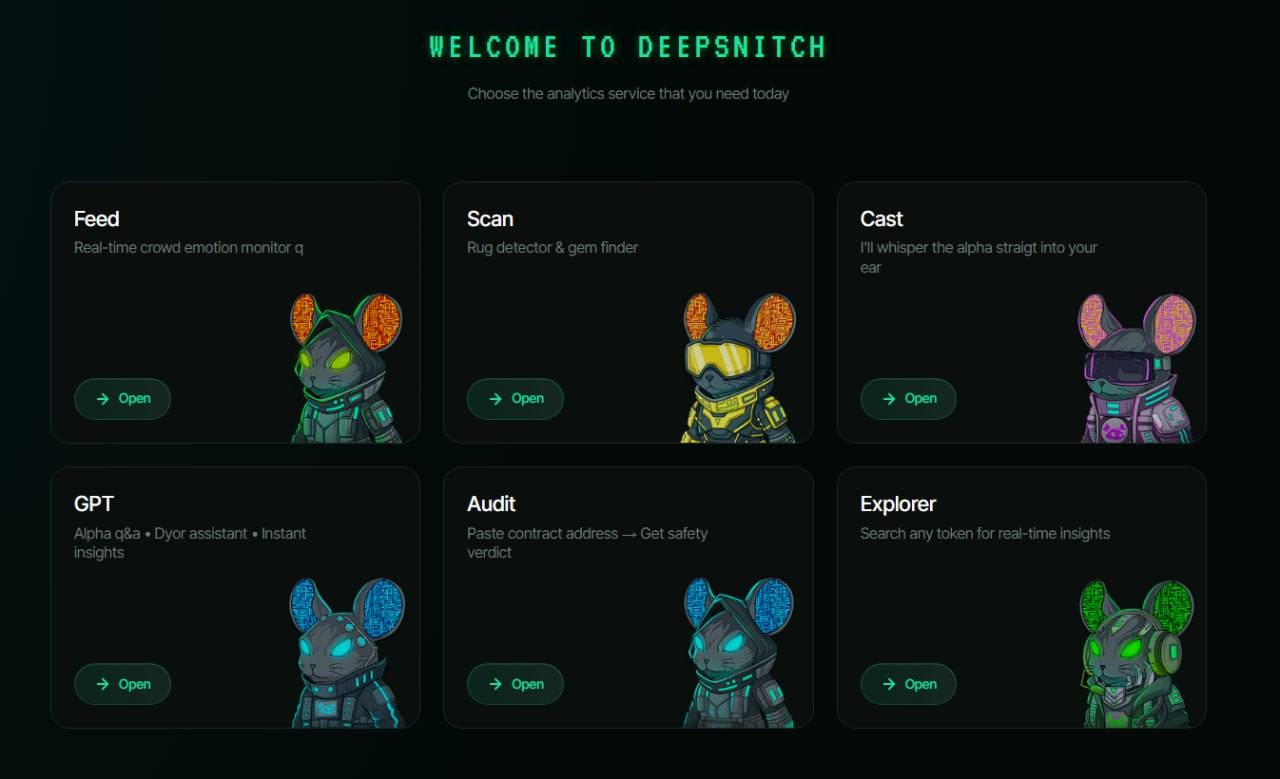
The DeepSnitch AI presale launch date is the most urgent timestamp in the current crypto cycle for traders who want ground-floor access to a working product. Every tool on the platform is live today. SnitchGPT answers your research questions in real time.
The smart contract scanner flags risky tokens before you ape in. The trend tracker surfaces momentum plays before they go viral. This is not a whitepaper project.
The DeepSnitch AI roadmap points to Uniswap listing first, followed by rumored tier-1 and tier-2 exchange listings in Q2. Each listing milestone is a fresh demand event for a token that presale buyers picked up at $0.04399.
The DeepSnitch AI presale date closes on March 31 with no extension guaranteed. Analysts projecting 100x to 500x post-listing gains are citing the same combination every time: live utility today, low entry price, and exchange listings still incoming.
The DeepSnitch AI token launch onto major exchanges is the catalyst that converts all that staked conviction into visible price action.
Traders who have been around long enough to watch low-cap tokens get listed know that the DeepSnitch AI presale launch date is the kind of entry window that closes once and never comes back at the same price.
The Deepsnitch AI roadmap is not a vague promise sitting behind a future delivery date that keeps shifting, it is a live platform with working tools that traders are opening every day and an exchange debut that is closing in fast enough to make waiting a genuinely expensive decision.
Akash Network (AKT) update for March 2026
Akash Network is essentially a decentralized alternative to AWS and Google Cloud, letting anyone with spare compute capacity lease it out to developers and AI builders in a permissionless marketplace.
The Burn-Mint Equilibrium model burns $0.85 of AKT for every dollar spent on compute, creating real deflationary pressure that tightens supply every single time the network gets used.
AKT is trading at $0.38 on March 9 with $11 million in 24-hour volume, confirming that serious money is already rotating into this narrative before the mainstream catches on
AKT hit an all-time high of $8.07, and analysts are now placing the 2026 target between $3 and $6. If the decentralized cloud narrative gets the tailwind, this cycle looks ready to deliver.
Render Network (RENDER) update for March 2026
With the Starcloud news spotlighting space-based compute demand, RENDER becomes an easy narrative trade.
The Dispersed AI subnet launched in December 2025 targets AI inference workloads specifically and already supports enterprise-grade Nvidia H100 and H200 hardware across 5,600 active GPU nodes globally.
RENDER hit an all-time high of $13.60 in March 2024 and is currently trading near $1.37 on March 9. Analysts place the 2026 range between $6 and $15 if the decentralized GPU narrative picks up with a broader market recovery.
But at a market cap already above $713 million, the parabolic entry that the DeepSnitch AI presale launch date still offers is simply not available here.
Final thoughts
RENDER and AKT are legit infrastructure holds that benefit from the space compute narrative in the news right now.
But neither of them can match the entry price or the projected upside that the DeepSnitch AI presale launch date still offers at $0.04399. The DeepSnitch AI roadmap is delivering working tools while every other presale is still writing docs.
The DeepSnitch AI token launch onto Uniswap and rumored tier-1 exchanges in Q2 is coming whether you hold $DSNT or not, and the traders are already locked in at $0.04399 with 100X to 300X post-listing projections.
The official presale website is live, and the presale window is closing fast, so get in now before the entry is gone for good. Join X and Telegram for real-time updates on the launch.
FAQs
What exactly is the DeepSnitch AI presale launch date, and why are traders treating it like a hard deadline?
The DeepSnitch AI presale launch date wraps on March 31 at $0.04399 per $DSNT. Once that window closes, the next price you see will be on Uniswap and then tier-1 exchanges. Presale pricing does not come back after listing day.
How does the DeepSnitch AI roadmap compare to what RENDER and AKT are building in the same compute space?
The DeepSnitch AI roadmap has 5 live tools already running for traders today. RENDER and AKT are building real decentralized infrastructure worth holding this cycle, but neither has a working AI surveillance toolkit that traders open every day, as $DSNT does right now.
Is the DeepSnitch AI token launch onto exchanges in Q2 the main catalyst traders should be watching?
Yes. The DeepSnitch AI token launch, hitting Uniswap first and then rumored tier-1 exchanges, is the price event most holders are positioned for. Low market cap plus fresh exchange listings is historically the setup that produces the biggest percentage moves in the shortest time. That is why the DeepSnitch AI presale launch date still has traders moving fast before March 31.
Disclaimer: This is a Press Release provided by a third party who is responsible for the content. Please conduct your own research before taking any action based on the content.


Despite exchange withdrawals, Bitcoin spot trading volume remains near multi-year lows.
Digital assets edged higher this week after US President Donald Trump indicated the war with Iran may be approaching an end, despite later adopting a more aggressive tone online. Bitcoin climbed above $71,000 briefly after surging by over 4%.
Data suggests potential accumulation as futures traders continue building short positions.
Bitcoin Supply Tightens
According to the latest analysis by Binance Research, on-chain data indicate possible spot accumulation this week, even as short positions remain high in the futures market. While a reversal has not yet been confirmed, current conditions suggest a shift may be developing.
The firm observed that roughly 29,000 BTC have been withdrawn from exchanges while Bitcoin traded in the $65,000 to $75,000 range. This contrasts with the earlier decline from $97,000 to $62,000, when rising exchange balances indicated stronger sell pressure. Over the past six months, however, the relationship between exchange balances and prices has weakened, and lower liquidity on trading venues may amplify future price movements.
At the same time, stablecoin inflows to exchanges have risen about 80% from roughly $2 billion since March. This points to renewed liquidity entering the market and suggests that capital may be actively deployed to support Bitcoin accumulation.
Despite these developments, Bitcoin spot trading volume remains near multi-year lows, amid weaker demand and thinner order books. This pattern may reflect accumulation occurring off-exchange through OTC channels, which is consistent with recently reported sharp outflows from OTC desk balances. In derivatives markets, open interest has risen about 18% since the end of February after falling below $30 billion, while funding rates remain low to negative. This means that much of the activity is driven by short positions.
Market Stress Signals Emerge
On-chain data shared by Amr Taha points to conditions that have previously appeared during periods of market stress. In a recent update, the analyst said the Binance Bitcoin derivatives market index has fallen to roughly 0.35. This level is similar to readings recorded in July and August 2024 and is lower than the 0.43 level seen in April 2025.
You may also like:
Historically, levels in this range have occurred near major market lows, which were later followed by strong price recoveries. Taha also posted a chart showing a decline in the value of Bitcoin held by short-term investors. According to the data, the market capitalization of these holdings has dropped to about $390 billion, compared with roughly $437 billion recorded on April 7, 2025.
The analyst said large declines in this metric have often preceded capitulation among short-term holders. A similar drop took place on April 8, 2025, when intense selling pushed the leading crypto asset toward $78,000 before it later surged above $108,000.
Binance Free $600 (CryptoPotato Exclusive): Use this link to register a new account and receive $600 exclusive welcome offer on Binance (full details).
LIMITED OFFER for CryptoPotato readers at Bybit: Use this link to register and open a $500 FREE position on any coin!

In Just 4 Days, Tom Felton’s R-Rated Historical Movie Is an Instant Streaming Hit

Bajaj housing finance news | Bajaj housing news | Bajaj housing latest news

Atletico Madrid 5-2 Tottenham: Spurs embarrassed in Champions League after abysmal display


-
Business4 days ago
Form 8K Entergy Mississippi LLC For: 6 March
-

 Fashion4 days ago
Weekend Open Thread: Ann Taylor
-

 News Videos1 day ago
10th Algebra | Financial Planning | Question Bank Solution | Board Exam 2026
-

 Crypto World1 day ago
Paradigm, a16z, Winklevoss Capital, Balaji Srinivasan among investors in ZODL
-

 Tech6 days ago
Bitwarden adds support for passkey login on Windows 11
-
 Sports5 days ago
499 runs and 34 sixes later, India beat England to enter T20 World Cup final | Cricket News
-

 Sports3 days ago
Three share 2-shot lead entering final round in Hong Kong
-

 Sports3 days ago
Braveheart Lakshya downs Lai in epic battle to enter All England Open final | Other Sports News
-

 Politics4 days ago
Top Mamdani aide takes progressive project to the UK
-

 Business6 hours ago
ExxonMobil seeks to move corporate registration from New Jersey to Texas
-

 Business7 days ago
Guthrie Disappearance Enters Fifth Week as Family Visits Memorial
-

 NewsBeat5 days ago
Piccadilly Circus just unveiled ‘London’s newest tourist attraction’ and it only costs 80p to enter
-

 Entertainment4 days ago
Hailey Bieber Poses For Sexy Selfies In New Luscious Lip Thirst Traps
-

 Business2 days ago
Search for Nancy Guthrie Enters 37th Day as FBI Probes Wi-Fi Jammer Theory
-
 NewsBeat21 hours ago
Pagazzi Lighting enters administration as 70 jobs lost and 11 stores close across Scotland
-

 Tech1 day ago
Despite challenges, Ireland sixth in EU for board gender diversity
-

 Crypto World6 days ago
New Crypto Mutuum Finance (MUTM) Reports V1 Protocol Progress as Roadmap Enters Phase 3
-

 Tech6 days ago
ACIP To Discuss COVID ‘Vaccine Injuries’ Next Month, Despite That Not Being In Its Purview
-
Entertainment6 days ago
Harry Styles Has ‘Struggled’ to Discuss Liam Payne’s Death
-

 Business1 day ago
Search Enters 39th Day with FBI Tip Line Developments and No Major Breakthroughs