
Crypto World
BNB price signals potential reversal, bullish divergence

BNB’s price is stabilizing at a key high-time-frame support level as bullish divergence emerges, raising the probability of a relief rally if buyers regain control.
Summary
- BNB is holding high-time-frame support with strong technical confluence.
- Bullish divergence shows momentum improving despite lower price lows.
- A volume-backed bounce could target value area high and $950 resistance.
BNB (BNB) price action is approaching a critical inflection point after an impulsive move lower that has tested major structural support. While downside momentum has dominated recent sessions, the current reaction suggests that selling pressure may be losing strength.
Price is now trading at a technically dense support region where multiple indicators are beginning to align in favor of a potential short-term reversal. Although confirmation is still required, the emergence of bullish divergence places BNB in a position where a relief rally could develop if demand returns.
BNB price key technical points
- High-time-frame support under test: Confluence of key levels creates a potential base.
- Bullish divergence forming: Momentum indicators signal weakening downside pressure.
- $950 remains key resistance: Upside targets depend on confirmation and volume.
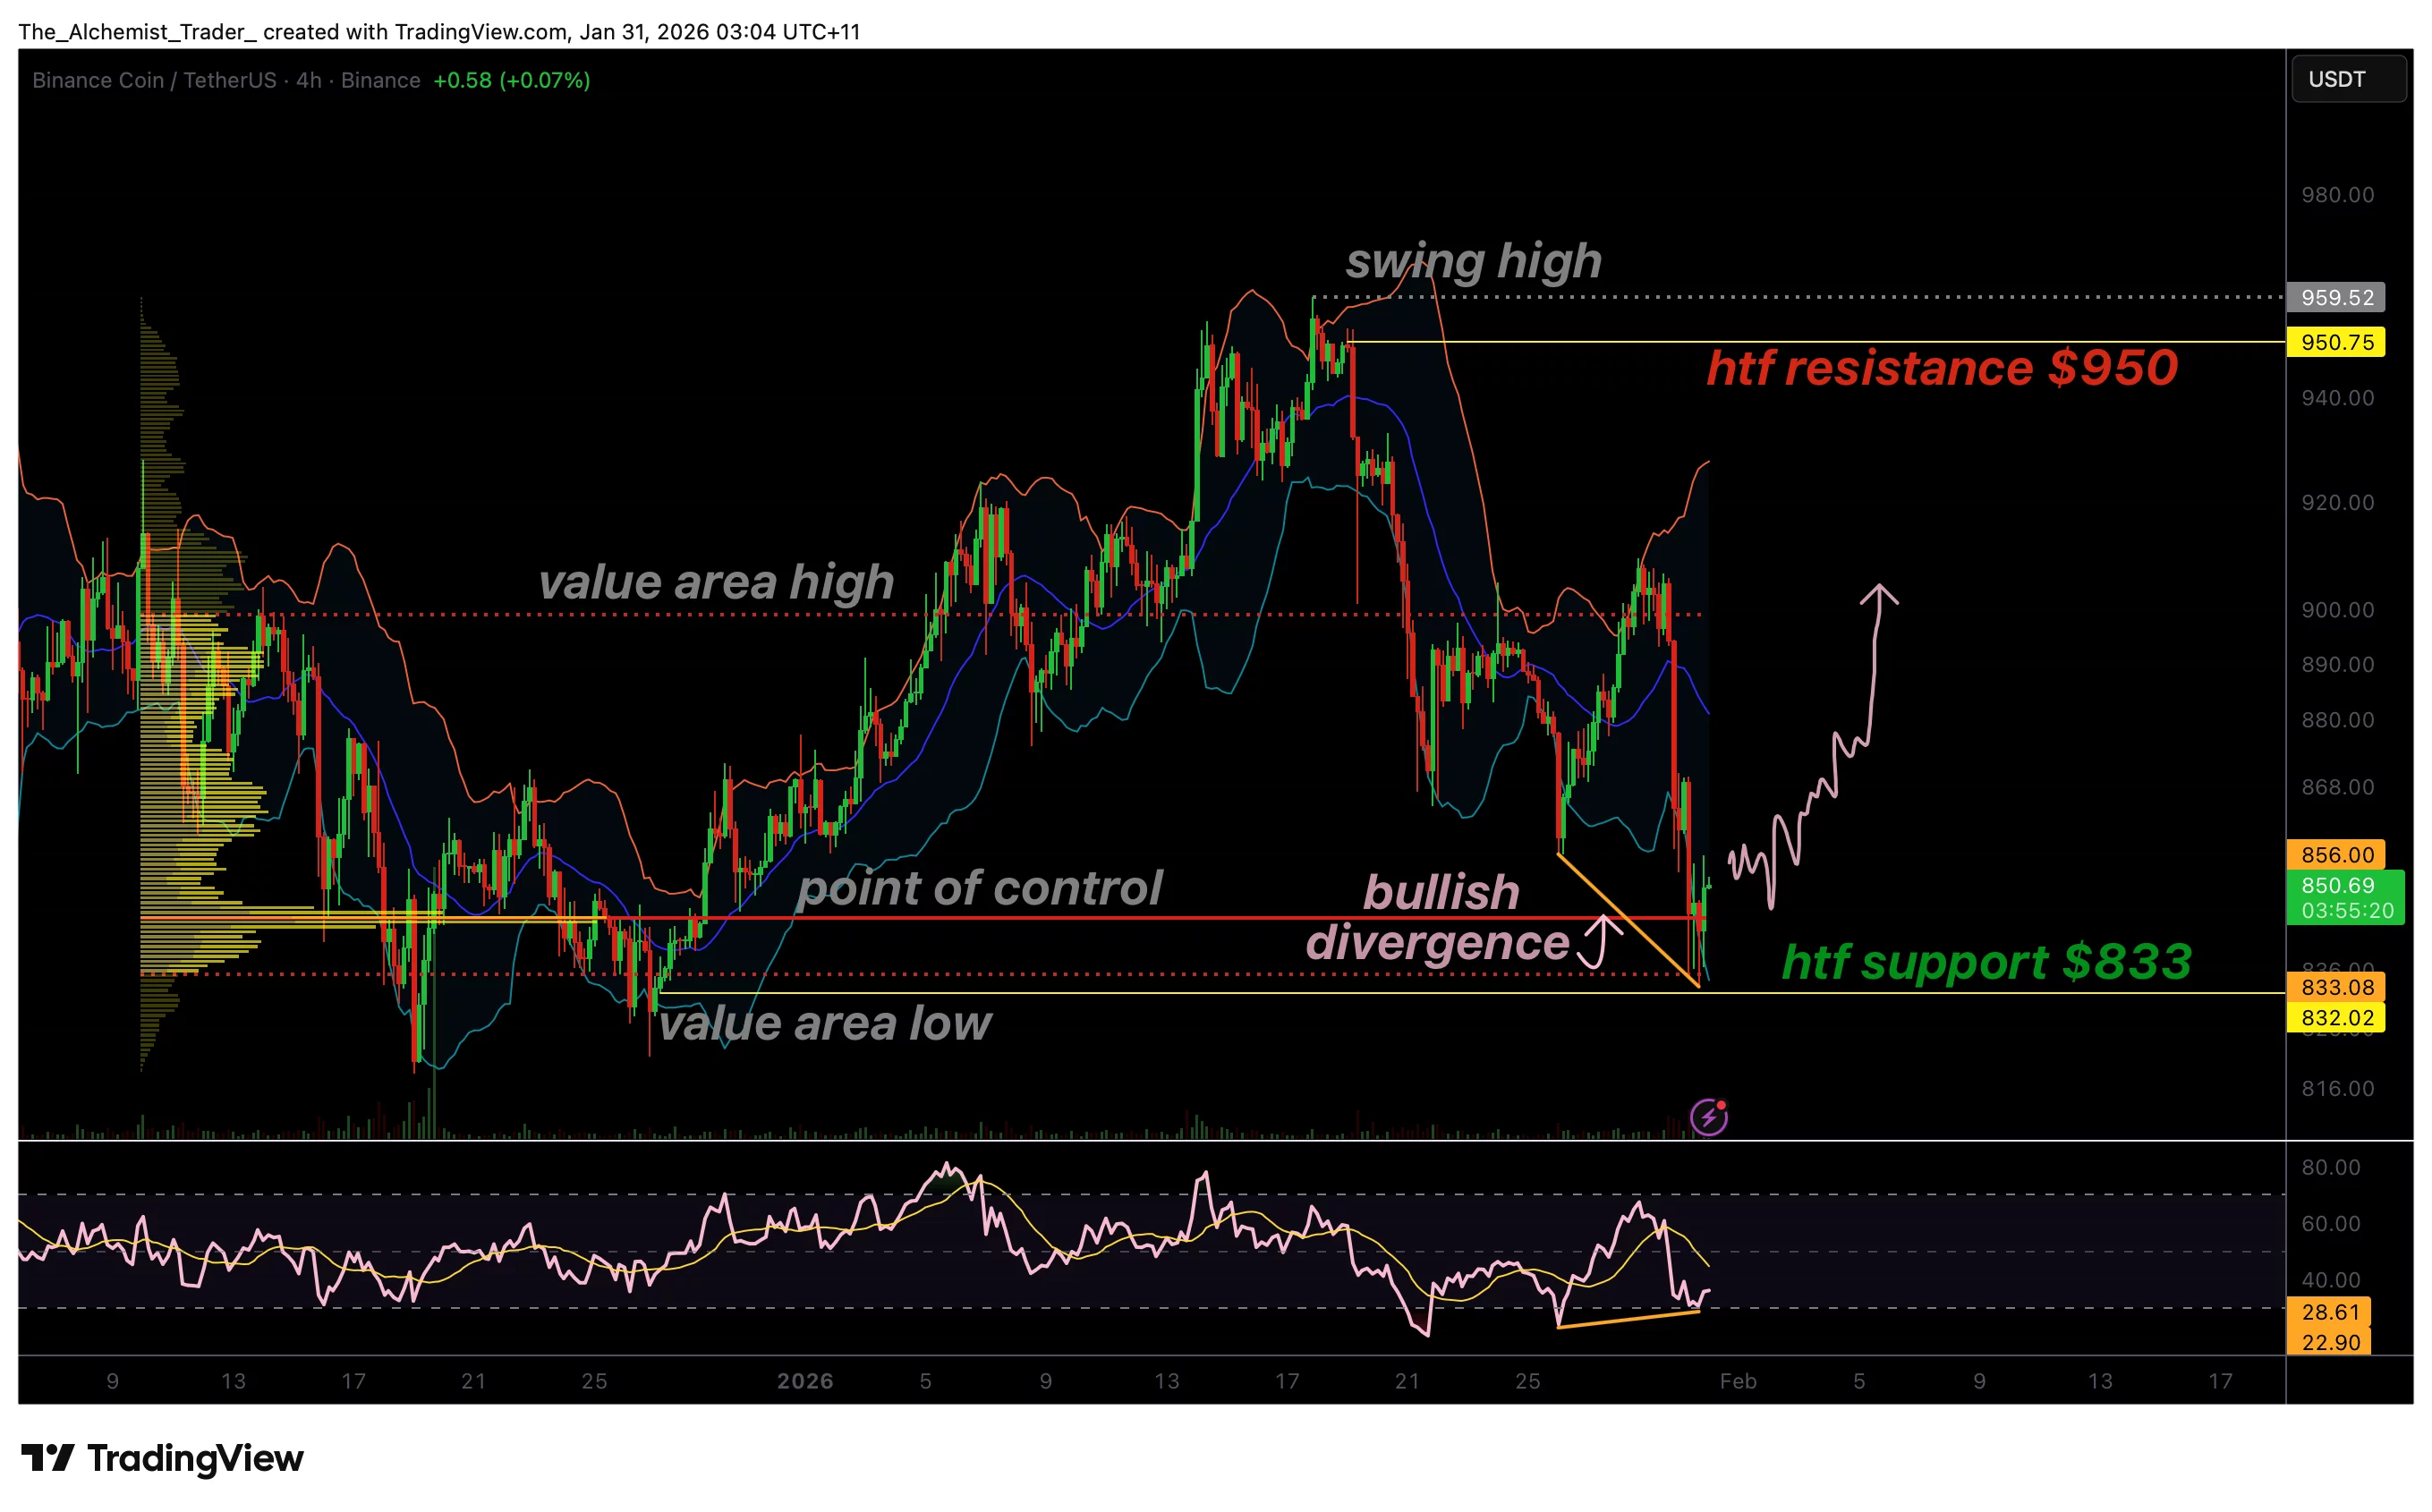
The recent decline in BNB has been sharp and impulsive, pushing price directly into a high-time-frame support zone. This region stands out due to the confluence of the point of control (POC) and the value area low, both of which often act as magnets for price during corrective phases.
Such areas frequently attract buyers looking for higher-probability entries, particularly when downside momentum begins to slow. The fact that BNB is reacting rather than slicing cleanly through support suggests that demand is beginning to absorb supply at these lower levels.
Bullish divergence adds early confirmation
One of the most notable developments is the formation of a bullish divergence on momentum indicators. While price has printed a lower low, the Relative Strength Index (RSI) has established a higher low, indicating that bearish momentum is weakening beneath the surface.
Bullish divergence does not guarantee a reversal, but it often precedes short-term relief rallies when it appears at structurally significant support. In BNB’s case, the divergence remains valid as long as price holds above the current support zone on a closing basis.
Why support holding is critical
For the bullish divergence to remain actionable, support must continue to hold. A decisive breakdown below this region would invalidate the divergence and suggest that sellers remain firmly in control. However, continued acceptance above support increases the probability that the market is forming a local bottom rather than preparing for further downside.
This balance between price and momentum places BNB at a decision point, where the next directional move will likely be decisive.
Volume will determine follow-through
While divergence signals potential, volume is required for activation. A meaningful influx of bullish volume would confirm that buyers are stepping in with conviction rather than merely slowing the decline. Without volume expansion, any bounce risks being corrective and short-lived.
If volume increases alongside upward price movement, it would strengthen the case for a relief rally and suggest that market participants are repositioning for higher prices.
Upside targets come into focus
Should bullish momentum build, the first upside objective would be a rotation back toward the value area high, where prior supply is likely to emerge. Beyond that, $950 stands out as a major high-time-frame resistance level and a natural target for any sustained recovery.
Reclaiming these levels would also mark an improvement in market structure, shifting BNB away from its recent bearish bias.
Market structure remains cautious
Despite the improving signals, BNB’s broader market structure remains fragile. Lower highs have not yet been invalidated, and a confirmed trend reversal requires more than a single divergence signal. For now, the setup favors a potential relief rally rather than a full trend change.
What to expect in the coming price action
BNB is trading at a technically significant support zone where bullish divergence is signaling waning downside momentum. As long as price holds this region, the probability favors a short-term relief rally toward the value area high and potentially $950 resistance if volume confirms. Failure to hold support would invalidate the bullish setup and reopen downside risk.
In the immediate short term, price behavior and volume around this support level will determine whether BNB transitions into a reversal, or continues its corrective move lower.


Key Highlights
- Japanese regulators authorize SBI Ripple Asia’s XRPL Token Platform
- Platform facilitates regulated token creation under Japanese financial legislation
- Businesses gain blockchain access through streamlined API connectivity
- System operates within Japan’s prepaid payment regulatory structure
- Strategic focus includes real-world applications and international payment corridors
Following regulatory authorization from Japanese financial authorities, SBI Ripple Asia has officially introduced its XRPL Token Platform. This blockchain-based infrastructure enables organizations to issue digital tokens while maintaining full compliance with Japan’s financial regulatory framework. The development represents a significant milestone in merging distributed ledger technology with traditional payment ecosystems.
Blockchain Platform Debuts with Enterprise API Capabilities
SBI Ripple Asia has finalized its XRPL Token Platform utilizing the XRP Ledger as its foundational technology. This infrastructure provides organizations with capabilities to create and administer digital tokens through on-chain mechanisms. Enterprise clients can integrate blockchain functionality into their existing systems via application programming interfaces without disrupting end-user experiences.
The platform architecture facilitates smooth incorporation with established digital services and customer-facing applications. End users gain access to tokenized financial instruments while maintaining familiar interaction patterns. Proprietary wallet management technology embedded in the system delivers robust security protocols for digital asset custody.
Compliance with Japan’s Payment Services Act forms a core component of the XRPL Token Platform’s operational framework. Organizations can launch tokenized prepaid financial products within established regulatory boundaries. The infrastructure supports enterprise-grade scalability across diverse operational contexts.
Official Registration Unlocks Compliant Digital Payment Products
On March 26, 2026, SBI Ripple Asia obtained official registration as an authorized issuer of third-party prepaid payment instruments. This regulatory milestone empowers the XRPL Token Platform to launch compliant digital financial offerings. The company now operates as a legitimate bridge connecting blockchain innovation with supervised financial services.
This official status reinforces the legal infrastructure supporting the XRPL Token Platform within Japan’s financial sector. The authorization permits issuance of prepaid payment products underpinned by blockchain tokens. Regulatory oversight mechanisms remain fully integrated throughout the operational framework.
Through this positioning, SBI Ripple Asia establishes itself within Japan’s regulated digital asset landscape. The platform supports expanded utilization of blockchain-powered payment solutions. This framework demonstrates increasing institutional commitment toward compliant tokenization strategies.
Strategic Roadmap Emphasizes Practical Implementation and Regional Payment Networks
SBI Ripple Asia intends to implement the XRPL Token Platform across geographically focused economic areas including tourism-intensive regions. The infrastructure will connect consumer transactions with digital reward mechanisms and payment processing systems. Novel approaches to customer loyalty initiatives and transaction-based incentives become feasible through this framework.
The platform aims to enhance operational scalability and reduce transaction costs throughout collaborative business networks. Strategic partnerships with regional businesses and municipal organizations form a central component of the expansion strategy. These alliances will accelerate implementation in tangible commercial settings.
SBI Ripple Asia maintains active research initiatives focused on XRPL applications within Asian payment channels. Collaborative investigation with South Korea’s DSRV targets improvements in international money transfer systems. The XRPL Token Platform holds potential to optimize transaction speed and cost-effectiveness for Japan-South Korea payment flows.

Crypto World
Quantum threat to Bitcoin is real, but manageable, according to Wall Street broker Bernstein


Wall Street broker Bernstein said the rise of quantum computing poses a credible but manageable threat to Bitcoin and the broader crypto ecosystem, as recent breakthroughs compress timelines for potential attacks on modern cryptography.
Advances such as Google Quantum AI’s reported reduction in qubit requirements suggest the risk is no longer a distant, decade-long concern, the broker noted. Still, the firm cautioned that scaling quantum systems to the level needed to break widely used encryption remains a complex, multi-step challenge.
“Quantum should be seen as a medium to long term system upgrade cycle rather than a risk,” analysts led by Gautam Chhugani said in the Wednesday report.
Quantum computing uses the principles of quantum mechanics rather than classical physics. Instead of binary bits, it relies on qubits that can exist in multiple states at once, a property known as superposition, allowing many possibilities to be processed simultaneously.
Combined with entanglement, this enables quantum systems to solve certain problems, such as breaking encryption, far more efficiently than classical computers.
Quantum computers could eventually weaken cryptographic systems like elliptic curve encryption, which underpin crypto wallets, by solving problems beyond the reach of classical machines. However, the report said the threat spans industries from finance to defense and should be viewed as a manageable, long-term risk rather than an existential one for Bitcoin.
Exposure is concentrated in roughly 1.7 million BTC held in older, “legacy” wallets, while newer practices and protocols reduce vulnerability. Bitcoin mining, which relies on SHA-based hashing, remains effectively secure even in advanced quantum scenarios, the broker said.
Bernstein expects the crypto industry to have sufficient time, around three to five years, to transition toward post-quantum cryptography, with upgrades such as new wallet standards, reduced address reuse and key rotation already under discussion.
One recent academic paper said that attacking the Bitcoin blockchain through quantum mining would demand the energy output of a star.
Read more: Attacking bitcoin mining with a quantum computer would require the energy of a star, academics say

Bitget CEO Gracy Chen posted on X on April 7, calling Hyperliquid ‘immature, unethical, and unprofessional’ – and branded the platform an overmarketed fake crypto DEX that poses ‘FTX 2.0’ risks to users. The post landed like a grenade on Crypto Twitter, igniting one of the sharpest CEX vs DEX exchanges the industry has seen in years.
This isn’t background noise. Hyperliquid has been pulling serious volume – consistently above $1B in daily perp trades, directly cannibalising the perpetuals business of mid-tier and top-tier centralised exchanges, including Bitget.
- The accusation: Gracy Chen, Bitget CEO, publicly called Hyperliquid an ‘overmarketed’ fake DEX on April 7, warning of systemic risks comparable to FTX and describing it as an ‘offshore CEX with no KYC/AML.’
- The trigger: Hyperliquid’s small validator set unanimously delisted the JELLY memecoin perp market on March 26 and force-settled positions at $0.0095 after an attacker used a $6M short to exploit the HLP vault – exposing the platform’s centralized emergency override capability.
- The structural critique: Chen argued that Hyperliquid’s mixed vaults expose all users to collective risk from individual manipulators, and that foundation-level intervention in open markets sets a ‘dangerous precedent.’
- The volume context: Hyperliquid’s HYPE token and platform growth represent a direct threat to CEX perp revenue – making Chen’s critique land somewhere between principled concern and competitive self-interest.
- Industry split: BitMEX co-founder Arthur Hayes echoed decentralization concerns but downplayed long-term damage; Hyperliquid’s community pushed back hard, accusing Chen of conflating valid critique with CEX protectionism.
- What’s next: Hyperliquid has flagged validator expansions and HLP upgrades post-JELLY; Bitget’s Q2 2026 volume numbers will tell whether the controversy moved any market share.
Discover: The Best Crypto Exchanges for Active Traders
What Chen Actually Said and Why It Hit a Nerve With Hyperliquid
Chen’s post was direct: Hyperliquid operates like an ‘offshore CEX with no KYC/AML’ dressed in DeFi branding, and the JELLY incident proved it. Her core charge – that the decision to close the JELLY market and force-settle positions ‘sets a dangerous precedent’ – targeted the exact mechanism Hyperliquid uses to separate itself from traditional finance: on-chain, non-custodial execution with validator consensus.
Update: Bitget CEO Gracy Chen calls out Hyperliquid saying it operates more like an offshore CEX than a true DEX. — OGAudit
She pointed to the 2025 JELLY token incident where the platform closed the market and forcibly settled positions, causing major user losses.
This reignites the… pic.twitter.com/uy1zxCgLK2
 Crypto Reviews (@OGAudit) April 7, 2026
The JELLY incident on March 26 gave Chen’s critique its teeth. An attacker opened a $6M short on the newly listed JELLY memecoin perp – a token launched in January 2025 by Venmo co-founder Iqram Magdon-Ismail – then pumped the token’s on-chain price to trigger self-liquidation, threatening over $10M in losses for the HLP vault.
Hyperliquid’s validators responded by unanimously delisting the market and forcing settlement at $0.0095, shielding the vault but overriding open user positions in the process.
That intervention is the live evidence Chen is working with. Hyperliquid has built its brand – and its HYPE token valuation on the decentralization claim. Force-settling user positions via coordinated validator action isn’t what decentralized looks like. And Chen said so, loudly, with FTX in the headline.
Explore: The best pre-launch token sales with asymmetric upside potential
Why Bitget Is Really Swinging – and What Hyperliquid Crypto Has to Lose
The real story isn’t just executive-level beef. It’s volume. Hyperliquid has been consistently running $1B+ in daily perpetual volume – the core product category that CEXs, such as Bitget, depend on for fee revenue.
As centralized exchange dynamics shift and traders grow more comfortable with on-chain execution, every dollar that moves to Hyperliquid is a dollar not clearing through a CEX order book.
Chen’s timing matters. Her post came roughly two weeks after the JELLY incident gave her a concrete structural failure to point at.
That isn’t a coincidence, it’s the competitive calculus of a CEO watching market share migrate on-chain and identifying the moment the migration narrative cracks.
AP Collective founder Abhi had already detailed the $6M short self-liquidation tactic publicly; Chen amplified the structural critique to a broader audience with FTX-level stakes framing attached.
The HYPE token is also part of this. Hyperliquid’s native token had become a proxy bet on the platform’s continued volume growth and its positioning in the expanding DeFi infrastructure landscape. Attacking the platform’s decentralization credentials directly attacks the thesis behind HYPE’s valuation – and every holder in the community knows it.
Is Hyperliquid Actually Decentralized?
Hyperliquid runs on a purpose-built L1 using HyperBFT consensus, with on-chain order matching and a non-custodial settlement model via its HyperLiquidity Provider vault.
On paper, that’s meaningfully different from a CEX, no withdrawal risk, no opaque internal matching. But the validator set is small, permissioned, and operated by a tight group – and the Hyper Foundation retains emergency intervention capability that it exercised in the JELLY case without a community governance vote.
BitMEX co-founder Arthur Hayes stated the community should ‘stop pretending Hyperliquid is decentralized’ – echoing Chen’s framing from a less commercially conflicted position.
Hayes walked back the severity, later arguing that initial reactions overestimated the reputational damage and urged focus on the platform’s resilience.
But the structural question didn’t go away with his reassessment.
Discover: The Best Crypto Presales Live Right Now
The post Bitget Boss Gracy Chen Calls Hyperliquid a Fake DEX And Crypto Twitter Explodes appeared first on Cryptonews.
Crypto World
Crypto inflows slowed sharply in first quarter as investor demand weakened, says JPMorgan


Wall Street investment bank JPMorgan (JPM) said the pace of capital flowing into digital assets slowed markedly in the first quarter of 2026, with total inflows estimated at around $11 billion.
That implies an annualized run rate of roughly $44 billion, about one-third of the pace seen in 2025, according to the report published last week.
“Investor flows, either retail or institutional, have been small or even negative YTD with the bulk of the digital asset flow in Q1’26 stemming from Strategy’s (MSTR) bitcoin purchases and concentrated crypto VC funding,” wrote analysts led by Nikolaos Panigirtzoglou.
Crypto markets had a volatile and broadly negative first quarter, with prices and market value retreating sharply amid a risk-off backdrop. Total crypto market capitalization fell roughly 20% over the period, while bitcoin dropped around 23% and ether (ETH) declined more than 30%, marking one of the weakest first-quarter performances in years.
The selloff was driven by macroeconomic and geopolitical pressures, triggering liquidations and a broad pullback in risk assets, with altcoins hit even harder.
Despite the downturn, prices stabilized toward the end of the quarter, with bitcoin consolidating near the $70,000 level as ETF demand improved and some pockets of the market, such as select altcoins and onchain activity, showed resilience.
The bank’s estimate aggregates crypto fund flows, Chicago Mercantile Exchange (CME) futures positioning, venture capital fundraising and corporate treasury activity, including bitcoin purchases by firms such as Strategy.
The analysts said investor-driven flows were notably weak. Positioning in bitcoin and ether CME futures softened versus 2024 and 2025, suggesting institutional demand may have turned slightly negative year-to-date. Spot bitcoin and ether exchange-traded funds (ETFs) also saw net outflows during the quarter, concentrated in January, before a modest rebound in bitcoin ETF inflows in March.
The bank’s analysts attributed most of the quarter’s inflows to corporate treasury activity and venture funding. Strategy remained a dominant buyer, funding bitcoin purchases largely through equity issuance, while signaling continued reliance on stock and preferred issuance to finance accumulation. Other corporate holders were more defensive, with some selling bitcoin to fund buybacks.
Bitcoin miners were net sellers during the quarter, the report said, as firms sold holdings or used them as collateral to shore up liquidity, fund capital expenditures or manage liabilities. The analysts characterized the selling as driven by tighter financing conditions and balance sheet discipline rather than distress.
Crypto venture capital was a relative bright spot. Funding tracked an annualized pace above the prior two years, though activity was increasingly concentrated in fewer, larger deals led by established firms. Capital continued to rotate toward infrastructure, stablecoins, payments and tokenization, with less interest in gaming, non-fungible tokens (NFTs) and exchange-related projects, the report added.
Read more: Bitcoin holds ground as gold, silver slide on ETF outflows and liquidity strains: JPMorgan

Diplomatic Signals Revive Cheer in the Market
Authorities on both sides, as well as regional mediators, are still negotiating conditions of a temporary truce. In addition, the suggested ceasefire would open significant trade routes and take the strain off world markets. These news items favored returns in risk assets, such as cryptocurrencies and US stock futures. The US President Donald Trump spoke about the situation at a regular press conference, pointing to continuing negotiations. Moreover, he also prolonged a deadline concerning possible military intervention, which indicated the possibility of further negotiations. There was a response by market participants to these updates as de-escalation expectations rose.
The decrease in oil prices was caused by the expectation of a ceasefire, which reduced worries about supply disruption. Prices were on a downward swing, with energy markets showing improved mood. Therefore, the fall in oil prices helped the recovery of Bitcoin and the subsequent rise of the market. The surge in the value of Bitcoin to over 70,000 caused a run-up in the values of other leading digital currencies such as Ethereum, XRP, Solana and Cardano. Also, the wider crypto market saw high buying behaviour with prices rising accordingly. This collaborative action emphasised the impact of Bitcoin on the general market trend.
Due to the price explosion, there was a dramatic short sale in the derivatives market within a short time. Additionally, the volume of trading was high, indicating that more traders were involved. Statistics also revealed that there was an increase in futures open interest, meaning that more people are taking leveraged positions. The Strait of Hormuz remains a focal point of developments in the markets because of its significance in the oil supply in the world market. Also, any advancement in the negotiations can affect the energy market and financial market in the short term. This relationship continues to bind geopolitical events to crypto price changes.


South Korea’s ruling Democratic Party is reportedly preparing a draft bill that would classify stablecoins as foreign exchange payment instruments and require tokenized real-world assets (RWAs) to be backed by assets held in trust.
Citing an integrated draft of the proposed Digital Asset Basic Act, the Seoul Economic Daily reported on Wednesday that stablecoins used in cross-border transactions would be treated as “means of payment” under the Foreign Exchange Transactions Act, placing related businesses under oversight even without separate registration.
The draft bill would also require issuers of tokenized RWAs to place underlying assets in managed trusts under the Capital Markets Act.
If implemented, the changes would bring stablecoins and tokenized RWAs under existing financial rules, tightening oversight of cross-border flows and setting custody requirements for underlying assets.
Cointelegraph could not independently verify the draft provisions through a public National Assembly filing as of Wednesday.
Stablecoin draft targets cross-border use, bans interest
The Seoul Economic Daily also reported that the draft would exempt certain stablecoin payments for goods and services from foreign exchange reporting requirements within a defined scope.
The draft also reportedly bars issuers from paying interest to holders of value-stable digital assets, regardless of how the incentive is labeled. It would also require the Financial Services Commission to establish technical standards aimed at ensuring interoperability across digital asset networks, the report said.
Related: Crypto exchange Bithumb to delay IPO until after 2028: Report
The reported approach aligns with earlier concerns raised by South Korea’s central bank.
On Jan. 27, Bank of Korea Governor Lee Chang-yong warned that Korean won-denominated stablecoins could complicate capital-flow management and foreign exchange stability, adding to the debate over how domestic stablecoins should be regulated.
New draft would move tokenization into existing structures
On the RWA side, the draft would reportedly require issuers to place linked assets in managed trusts under the Capital Markets Act. The requirement would tie tokenized asset issuance to existing custody frameworks, according to the report.
According to the report, key issues like exchange ownership limits and bank-related requirements for stablecoin issuers were not included in the draft.
The omissions come amid broader disagreements over how the bill should regulate stablecoins. On Dec. 31, disagreements over stablecoin oversight and issuer requirements had delayed the Digital Asset Basic Act.
Magazine: ‘Phantom Bitcoin’ checks, Drift hack linked to North Korea: Asia Express


Pharos Network raises $44m to build institutional RWA rails across Asia and beyond, pushing its EVM Layer 1 toward a near‑$1b valuation.
Summary
- Pharos Network closes a $44 million Series A, lifting total funding to $52 million.
- Asian institutions and strategic corporates back its RWA-focused Layer 1.
- Funds will scale infrastructure in Asia and globally ahead of its public testnet.
Layer 1 blockchain Pharos Network has raised $44 million in a Series A round to build institutional-grade infrastructure for tokenized real-world assets (RWAs), bringing its total funding to $52 million after an $8 million seed round in November 2024.
The EVM-compatible chain, which targets regulated finance and large asset managers, plans to use the capital to expand RWA rails across Asia and key global markets, with a public testnet launch scheduled for May 2025.
The latest round follows a strategic deal that valued Pharos at roughly $950 million after Hong Kong–listed GCL New Energy subscribed about $24.7 million in equity.
Backers in the fresh raise include Asian private equity funds, renewable energy firms listed in Hong Kong, regulated financial institutions from the city, a subsidiary of Japan’s Sumitomo Corporation, crypto-native investor SNZ Holding, oracle provider Chainlink, and trading firm Flow Traders, underscoring the project’s bid to sit at the junction of traditional finance and DeFi.
Pharos positions itself as “a high‑throughput, EVM‑compatible Layer‑1 blockchain built to connect TradFi, DeFi, and real‑world assets,” aiming to “bridge over $50 trillion in RWAs and cross‑chain capital into a modular, on‑chain economy at internet scale,” as the team describes in its technical materials.
Pharos has spent the past year stitching together an institutional RWA stack that goes beyond this funding round. In February, it launched the RealFi Alliance with partners including Chainlink and Centrifuge to “standardize the development of RWA infrastructure for institutional players” and close what it calls the “trust gap” around onchain asset data. The network has also announced a partnership with Centrifuge to distribute tokenized U.S. Treasuries and AAA-rated credit products onchain, positioning Pharos as a liquidity and distribution layer for assets such as JTRSY and JAAA.
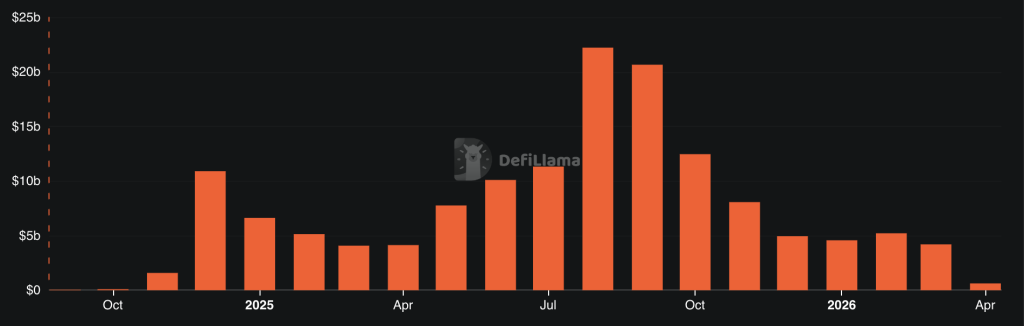
The raise lands as tokenized real-world assets accelerate, with sector reports projecting RWA outstanding to approach $60 billion in 2026 amid growing interest from banks and asset managers. In March alone, crypto startups secured more than $4.28 billion across 129 funding rounds, signaling that capital is still flowing aggressively into infrastructure plays despite volatile token markets. Against that backdrop, Pharos’ near‑$1 billion valuation and $52 million war chest place it among the more heavily funded RWA‑focused Layer 1s, as it races to convert institutional interest into actual onchain issuance and secondary liquidity.
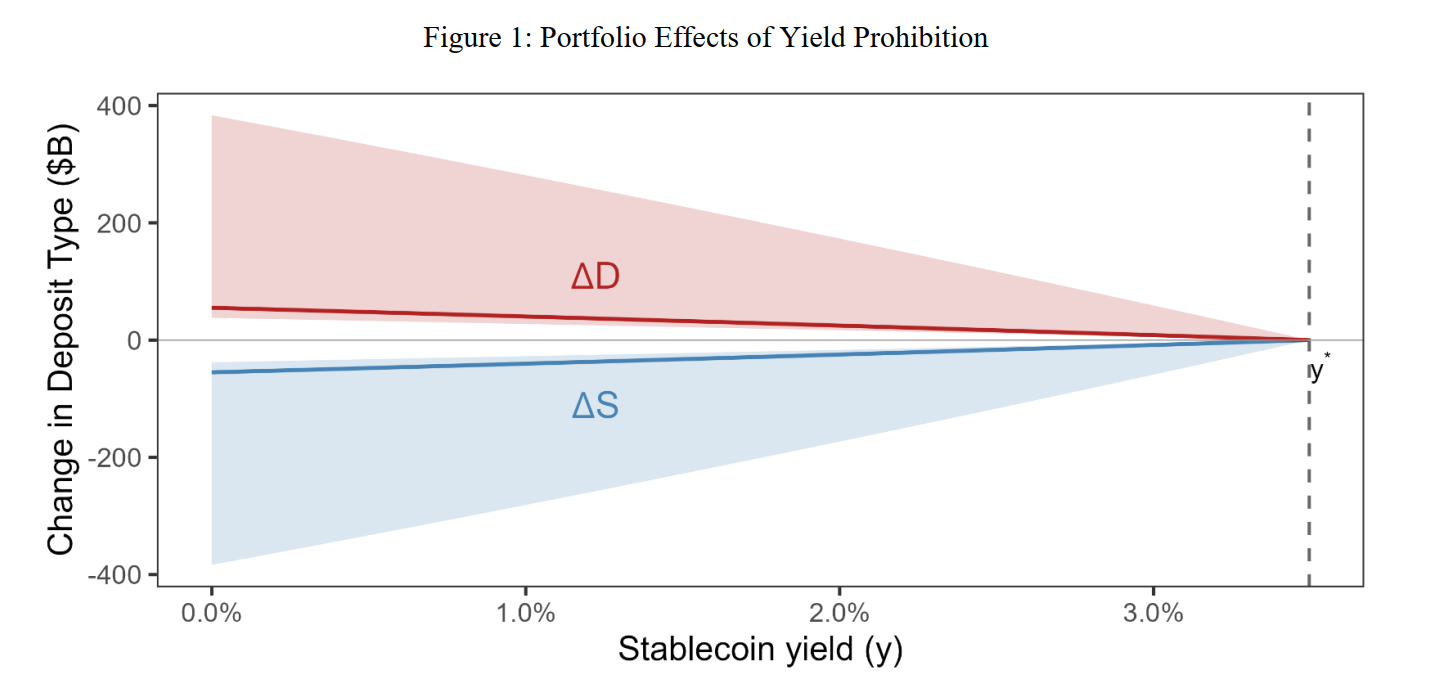
A White House report found that banning yield on stablecoins would have a marginal impact on bank lending while creating clear economic downsides.
According to the Council of Economic Advisers, a three-member agency within the Executive Office of the President tasked to offer the president economic advice, moving funds from stablecoins back into bank deposits would not translate into significant new lending. Under its baseline scenario, total bank lending would increase by about $2.1 billion, roughly 0.02% of the $12 trillion loan market.
The report, published Wednesday, says that community banks would see even smaller gains. Lending at these institutions would increase by roughly $500 million, or about 0.026%.
The findings come amid an ongoing clash between banks and the crypto industry over stablecoin yields. Banking organizations, including the Independent Community Bankers of America, have warned that stablecoin yields could significantly reduce bank lending, while crypto groups have rejected the claim.
Related: CLARITY Act 2026 odds ‘extremely low’ if not passed before April: Exec
Stablecoin lending ban could cost $800 million per year
However, banning stablecoin rewards could carry a greater cost. The report estimates a net welfare loss of around $800 million per year, mainly because users would lose access to yield on stablecoins. The cost-benefit ratio is about 6.6, meaning the economic costs would far exceed any gains in lending.
“Producing lending effects in the hundreds of billions requires simultaneously assuming the stablecoin share sextuples, all reserves shift into segregated deposits, and the Federal Reserve abandons its ample-reserves framework,” the report concludes.

In July 2025, President Donald Trump signed the GENIUS Act into law. The law prohibits stablecoin issuers from paying interest or yield to holders, but third-party platforms (like exchanges) can still offer yield on stablecoins. The proposed Digital Asset Market Clarity Act could close that gap by clarifying whether yield should be restricted across the board or allowed under certain conditions.
Related: Crypto investor sentiment will rise once CLARITY Act is passed: Bessent
CLARITY Act nearing Senate markup hearing
The US House of Representatives passed the CLARITY Act on July 17, 2025. In January, Senate Banking Committee Chair Tim Scott delayed a planned markup, which has yet to be rescheduled.
Last week, Coinbase chief legal officer Paul Grewal said the CLARITY Act could be nearing a markup hearing in the US Senate Banking Committee, with lawmakers close to agreement on key provisions. He noted that progress hinges on resolving disagreements over stablecoin yield.
Magazine: Bitcoin may take 7 years to upgrade to post-quantum — BIP-360 co-author

South Korea’s financial watchdog is tightening the rules around withdrawal-delay exemptions offered by crypto exchanges, after data showed that scam-linked accounts granted exemptions were responsible for a large share of voice-phishing losses. The Financial Services Commission (FSC), in coordination with the Financial Supervisory Service (FSS) and the Digital Asset eXchange Alliance (DAXA), unveiled a unified framework designed to standardize when users may bypass withdrawal delays.
Previously, exchanges could apply their own criteria for exemptions with no clear minimum standard, creating openings for bad actors to move funds quickly if a user met basic thresholds such as account age or trading history. The new regime aims to close those gaps by imposing consistent, objective criteria for eligibility and by bolstering ongoing oversight of exemption recipients.
Key takeaways
- Between June and September 2025, accounts granted withdrawal-delay exemptions accounted for 59% of fraudulent accounts and 75.5% of related losses on crypto exchanges in South Korea, according to the FSC.
- The revised framework requires exchanges to assess specific factors, including trading frequency, account history, and deposit/withdrawal amounts, before granting an exemption from withdrawal delays.
- Simulations cited by the FSC project a sharp reduction in eligible exemption recipients—roughly 1% of users—once the new rules are in place, though the regulator did not provide a baseline for comparison.
- In addition to standardizing criteria, the FSC will bolster ongoing monitoring of exemption recipients, including source-of-funds verification and detection of suspicious withdrawal activity.
Unified rules aim to curb misuse of withdrawal-delay exemptions
The FSCsaid the move is part of a broader effort to tighten control over how withdrawal-delay exemptions are used, especially in cases tied to voice-phishing scams. By centralizing the criteria in concert with the FSS and DAXA, the regulator intends to eliminate the previous practice of exchanges applying disparate, non-standard thresholds that could be exploited by criminals.
Under the new guidance, exchanges must apply uniform thresholds and objective evidence when evaluating exemption requests, rather than relying on opaque internal criteria. The objective measures highlighted by the authorities include a user’s trading activity, the history of the account, and typical deposit and withdrawal patterns. The objective aim is to prevent rapid transfers that often accompany phished accounts and other social-engineering frauds.
Fraud data underlines the risk
Data cited by the FSC illuminate why regulators consider withdrawal-delay exemptions a critical control point. The agency reported that the period from June to September 2025 saw a disproportionate share of fraud tied to exemptions. Specifically, accounts with exemptions comprised 59% of fraudulent accounts and 75.5% of related exchange losses. That concentration suggests that the exemptions, if left unstandardized, can amplify the impact of scams on users and on exchange balance sheets.
The figures also underscore the risk that a relatively small subset of users—those granted exemptions—could drive outsized losses if their activity escapes robust monitoring. By codifying eligibility criteria and enhancing oversight, the FSC and its partners aim to make it harder for illicit actors to exploit the exemption framework without detection.
Regulatory momentum and broader safeguards
The withdrawal-delay framework is part of a wider tightening of Korea’s crypto regulatory regime, which has accelerated amid recent incidents and exposure of control gaps. In a related move, the FSC ordered exchanges to reconcile internal ledgers with actual asset holdings at five-minute intervals following an inspection tied to a payout error at Bithumb. The aim is to close gaps in risk management and ensure that reported holdings reflect real, verifiable assets on hand.
Additional steps have been announced as part of a broader licensing and oversight push. On Jan. 29, South Korea expanded crypto-licensing scrutiny to cover not only exchanges but also major shareholders, signaling a more comprehensive approach to market integrity and compliance across the sector. These regulatory actions collectively reflect a deliberate shift toward tighter scrutiny as the domestic market seeks to curb misuse and strengthen ring-fenced protections for investors and users.
In this context, the FSC emphasized that it will continue reviewing the rule set to identify new circumvention methods and to adjust the framework as needed. The agency signaled willingness to iterate policy in response to evolving fraud tactics, with the objective of preserving legitimate access to crypto services while raising the bar for security and compliance.
Stakeholders should also watch how exchanges implement the new criteria in practice. While the rule changes aim to reduce the number of users eligible for withdrawal-delay exemptions, they may also affect users who rely on legitimate, time-sensitive access to funds. Balancing fraud prevention with user usability will be a key test as the regime rolls out across the market.
For readers tracking regulatory developments, the convergence of standardization efforts with enhanced surveillance signals a durable shift in South Korea’s crypto governance. The question now is how quickly exchanges can translate the policy into operational changes—especially regarding real-time monitoring, source-of-funds verification, and the ongoing audits of exemption recipients—and what this implies for the pace of legitimate deposits, withdrawals, and broader market liquidity in the months ahead.

The debate around centralized and decentralized exchanges has always generated more heat than clarity. CEX defenders point to DEX failures and declare the experiment incomplete. Proponents of self-custody treat centralized platforms as institutions to be dismantled. Both camps miss what actually matters: where the risk lives, and who agreed to carry it.
That is the real distinction between a CEX and a DEX. Not the technology, not the product surface, not the fee structure. It is a contract about responsibility.
The Trade-Off CEX Users Accept
When a user deposits on a centralized exchange, they are outsourcing operational complexity. The exchange handles custody, execution, fiat onboarding, and cross-chain access. You can deposit and withdraw through virtually any chain. Fiat flows in and out without requiring wallet management or on-chain knowledge. The friction inherent to crypto infrastructure largely disappears.
But the more significant transfer is less visible. By using a CEX, the user is also handing over accountability, and in doing so, gaining a kind of institutional caregiver. If a liquidation cascade wipes out positions and questions arise about how the platform performed, the exchange can choose to step in with bonuses, fee rebates, or direct compensation.
We have done this at Phemex, even during periods when the platform was operating at full capacity, when the pressure was highest and the easiest thing would have been to do nothing. That decision exists because there is a business that can make it, a team that can be held accountable, a relationship between platform and trader that goes beyond code.
Exchanges like Binance and Bitunix went down during those same events. We did not. On a centralized exchange, the user’s experience is something the business is personally invested in managing well.
That relationship does not exist on a DEX, by design. Rules are encoded and cannot be negotiated, adjusted for exceptional circumstances, or appealed to a support team. If you deposit to the wrong chain, the funds are gone. If a liquidation cascade hits and the protocol executes against you, no one will step in. The code ran. That is the final answer. There is no one to call, and that is exactly what the protocol’s users agreed to when they connected their wallet.
The Scope DEXs Unlock
The same conditions that remove the safety net also remove the intermediary, and for many users that is the point.
DEXs meaningfully expand what is possible in crypto. Liquidity provision, governance participation, and fee generation are all accessible to anyone willing to engage with the mechanics, not just to market makers or institutions.
A user who is not a trader can still participate in how markets function by providing liquidity to a pool. Someone holding an asset long-term can earn yield without trusting a third party with custody. When the tokenomics are structured well, users do not just trade on a protocol, they own part of it.
The counterweight is full responsibility. You manage your own wallet, you verify the chain before every transaction, and you accept the fixed parameters of the protocol regardless of whether those parameters favor you in a given situation. DEXs do not make exceptions, and that predictability is genuinely valuable.
But it demands a level of technical awareness and risk tolerance that is not realistic for every user in the market. Not all traders have traded on a DEX, and many have no interest in doing so because they simply do not want the burden of managing all of that themselves. That is a legitimate position, not a failure of ambition.
In my view, DEXs are a net positive for the ecosystem because they broaden the scope of what is possible by a lot. But users need to enter that environment with a clear understanding of what they are signing up for.
Where Centralized Exchanges Broke the Contract
Centralized exchanges have lost significant credibility over the past two years. FTX was the inflection point, but what came after made clear it was not an isolated failure. The pattern that emerged, platforms operating with backdoor arrangements, extracting value from users, managing reserves in ways that contradicted their public statements, damaged the confidence of retail participants in ways that have not fully recovered.
I have watched the sentiment shift in real time. Two or three years ago, the message of crypto was clear: alternative infrastructure, more freedom, more transparency, against institutions that resisted all of it. The adversary was traditional finance, the banks, the suits. That message has changed. What I see now is users against crypto scammers, honest participants against extractive ones. The adversary is no longer external. Platforms like Binance, which is now navigating a serious PR crisis of its own making, have become the entrenched incumbents that users are pushing back against. The very thing crypto was built to challenge, opaque institutions that operate in their own interest, has emerged inside the industry.
This is the responsibility that falls on those of us running centralized exchanges. The users who deposit on our platforms are making a specific bet: that the caregiver model is worth the trade-off, that handing over custody and self-sovereignty is worth the protection and the managed experience they get in return. When platforms violate that implicit agreement, they do not just hurt themselves. They push users toward self-custody and decentralized protocols, and given what some of those platforms did, that response is completely rational. The leaders of this industry failed to hold that trust. That is simply true.
The DEX market share relative to CEXs has grown month over month throughout 2025. Users are not moving to DEXs because on-chain execution suddenly became easier. They are moving because they stopped trusting the people running centralized platforms.
The Honest Framework
Neither model is inherently superior, and anyone telling you otherwise is trying to sell you something.
The question worth asking is much simpler: what kind of relationship does this user actually want with their trading environment? Someone who wants cross-chain deposits, fiat access, and a platform that takes responsibility when things go wrong will be better served on a centralized exchange like Phemex.
Someone who wants direct protocol interaction, self-custody, and participation in the underlying economics will be better served on a DEX, provided they understand the technical responsibility that comes with it.
These are different users making different choices about where risk should sit. The industry owes both of them honesty about the terms of that choice. Centralized exchanges cannot promise security while operating without transparency. Decentralized platforms cannot promise freedom while downplaying the responsibility users absorb in exchange.
What the next cycle requires from both sides is straightforward: say clearly what you are, deliver on it, and stop pretending the other model does not exist or does not serve a real purpose.
At Phemex, that is the standard we hold ourselves to. Not because it makes for a useful message. Because it is the only version of this business worth running.
The post CEXs and DEXs Are Not Competitors. They Are Different Contracts. appeared first on BeInCrypto.
Doha Diamond League, where Neeraj Chopra breached 90m mark, postponed this year – here’s why | More sports News
easyJet urges passengers to be prepared to wait during EES checks

Gopuff adds private label


-

 NewsBeat6 days ago
Steven Gerrard disagrees with Gary Neville over ‘shock’ Chelsea and Arsenal claim | Football
-

 Business6 days ago
No Jackpot Winner and $194 Million Prize Rolls Over
-

 Fashion5 days ago
Weekend Open Thread: Spanx – Corporette.com
-

 Crypto World7 days ago
Gold Price Prediction: Worst Month in 17 Years fo Save Haven Rock
-

 Business4 days ago
Expert Picks for Every Need
-

 Business3 days ago
Three Gulf funds agree to back Paramount’s $81 billion takeover of Warner, WSJ reports
-

 Sports4 days ago
India men’s 4x400m and mixed 4x100m relay teams register big progress | Other Sports News
-

 Business6 days ago
Login and Checkout Issues Spark Merchant Frustration
-

 Tech17 hours ago
How Long Can You Drive With Expired Registration? What Florida Law Says
-
Business3 days ago
No Jackpot Winner, Prize to Climb to $231 Million
-

 Tech6 days ago
Commonwealth Fusion Systems leans on magnets for near-term revenue
-

 Fashion2 days ago
Massimo Dutti Offers Inspiration for Your Summer Mood Board
-

 Crypto World7 days ago
Ripple rolls out enterprise crypto treasury platform for corporates
-

 Tech7 days ago
Drawing Tablet Controls Laser In Real-Time
-
Politics5 days ago
Wings Over Scotland | The quality of mercy
-

 Crypto World7 days ago
Why It’s Partnering, Not Issuing
-

 Fashion21 hours ago
Let’s Discuss: DEI in 2026
-
 Sports7 days ago
Steal Gary Woodland’s subtle power move for longer drives
-
 Tech7 days ago
Battery Tester Outperforms Cheaper Options
-

 Business4 days ago
Akebia Therapeutics, Inc. (AKBA) Discusses Pipeline Progress and Strategic Focus on Kidney Disease Treatments at R&D Day – Slideshow
You must be logged in to post a comment Login