

Crypto World
BTC Price Focus Turns To $67,000 Despite Iran Risk-Asset Pressures

Bitcoin (BTC) starts the last full week of July holding key support while macro clouds continue to gather.
Key points:
- Bitcoin preserves its 200-week trend line at the weekly close, leading to short-term BTC price targets of up to $67,000.
- US-Iran war rhetoric ramps up, with oil prices hitting five-week highs ahead of a week of corporate earnings reports.
- Bitcoin spot demand retreats from its early-July uptick despite ETF inflows.
- Bitcoin’s Puell Multiple heads higher, but analysts are wary of calling a “generational low.”
- Crypto market sentiment hits highest levels since the start of June.
Trader sees “further relief” for Bitcoin bulls
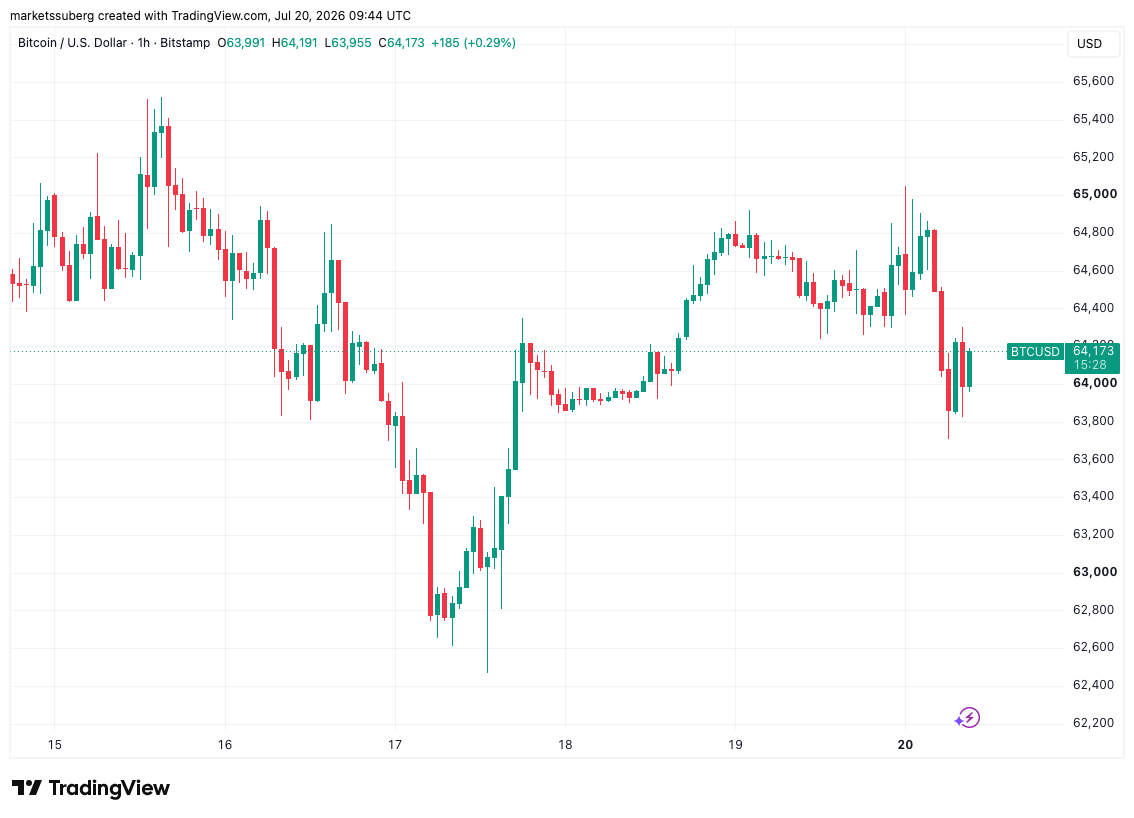
In a familiar move, Bitcoin saw sell-side pressure soon after the weekly close going into Monday morning, with local lows reaching $63,700, data from TradingView confirms.
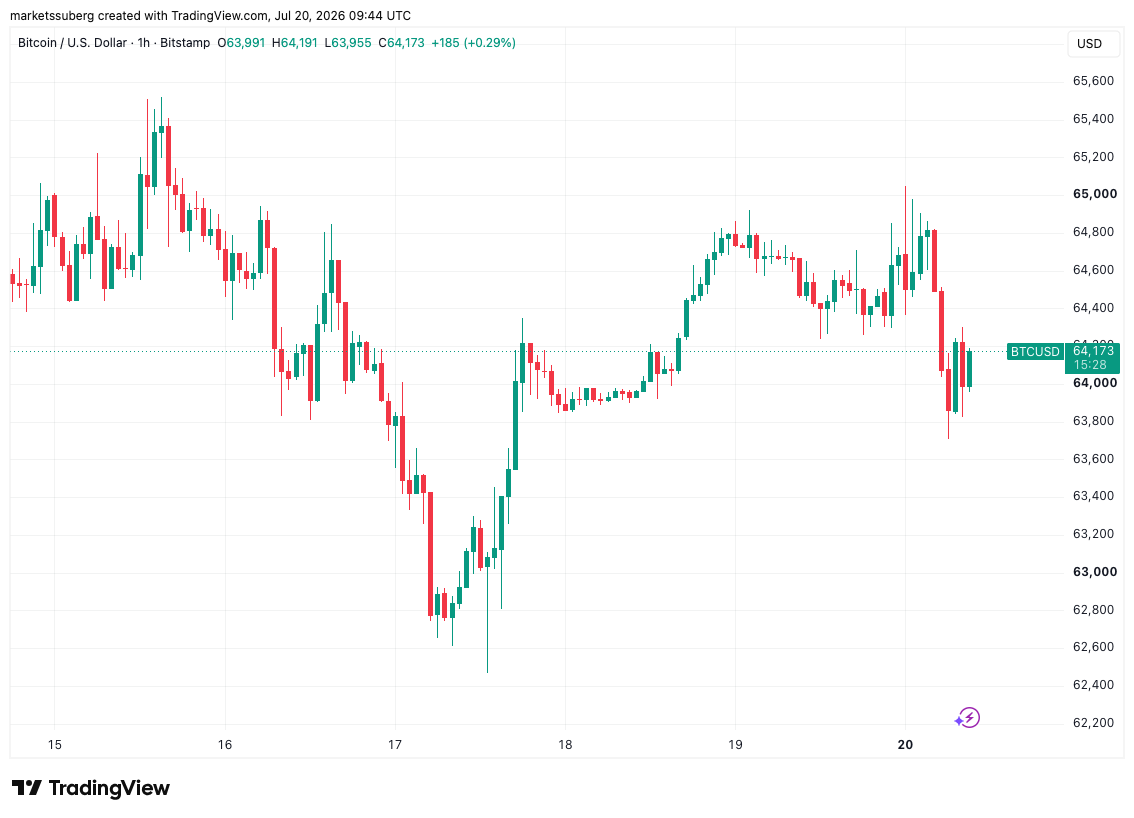
BTC/USD one-hour chart. Source: Cointelegraph/TradingView
Despite this, traders are becoming increasingly optimistic on shorter time frames as range lows continue to hold.
“Wouldn’t surprise me if we see some further relief this week – towards 65-67k,” trader Jelle predicted in his latest analysis posted Monday morning on X.
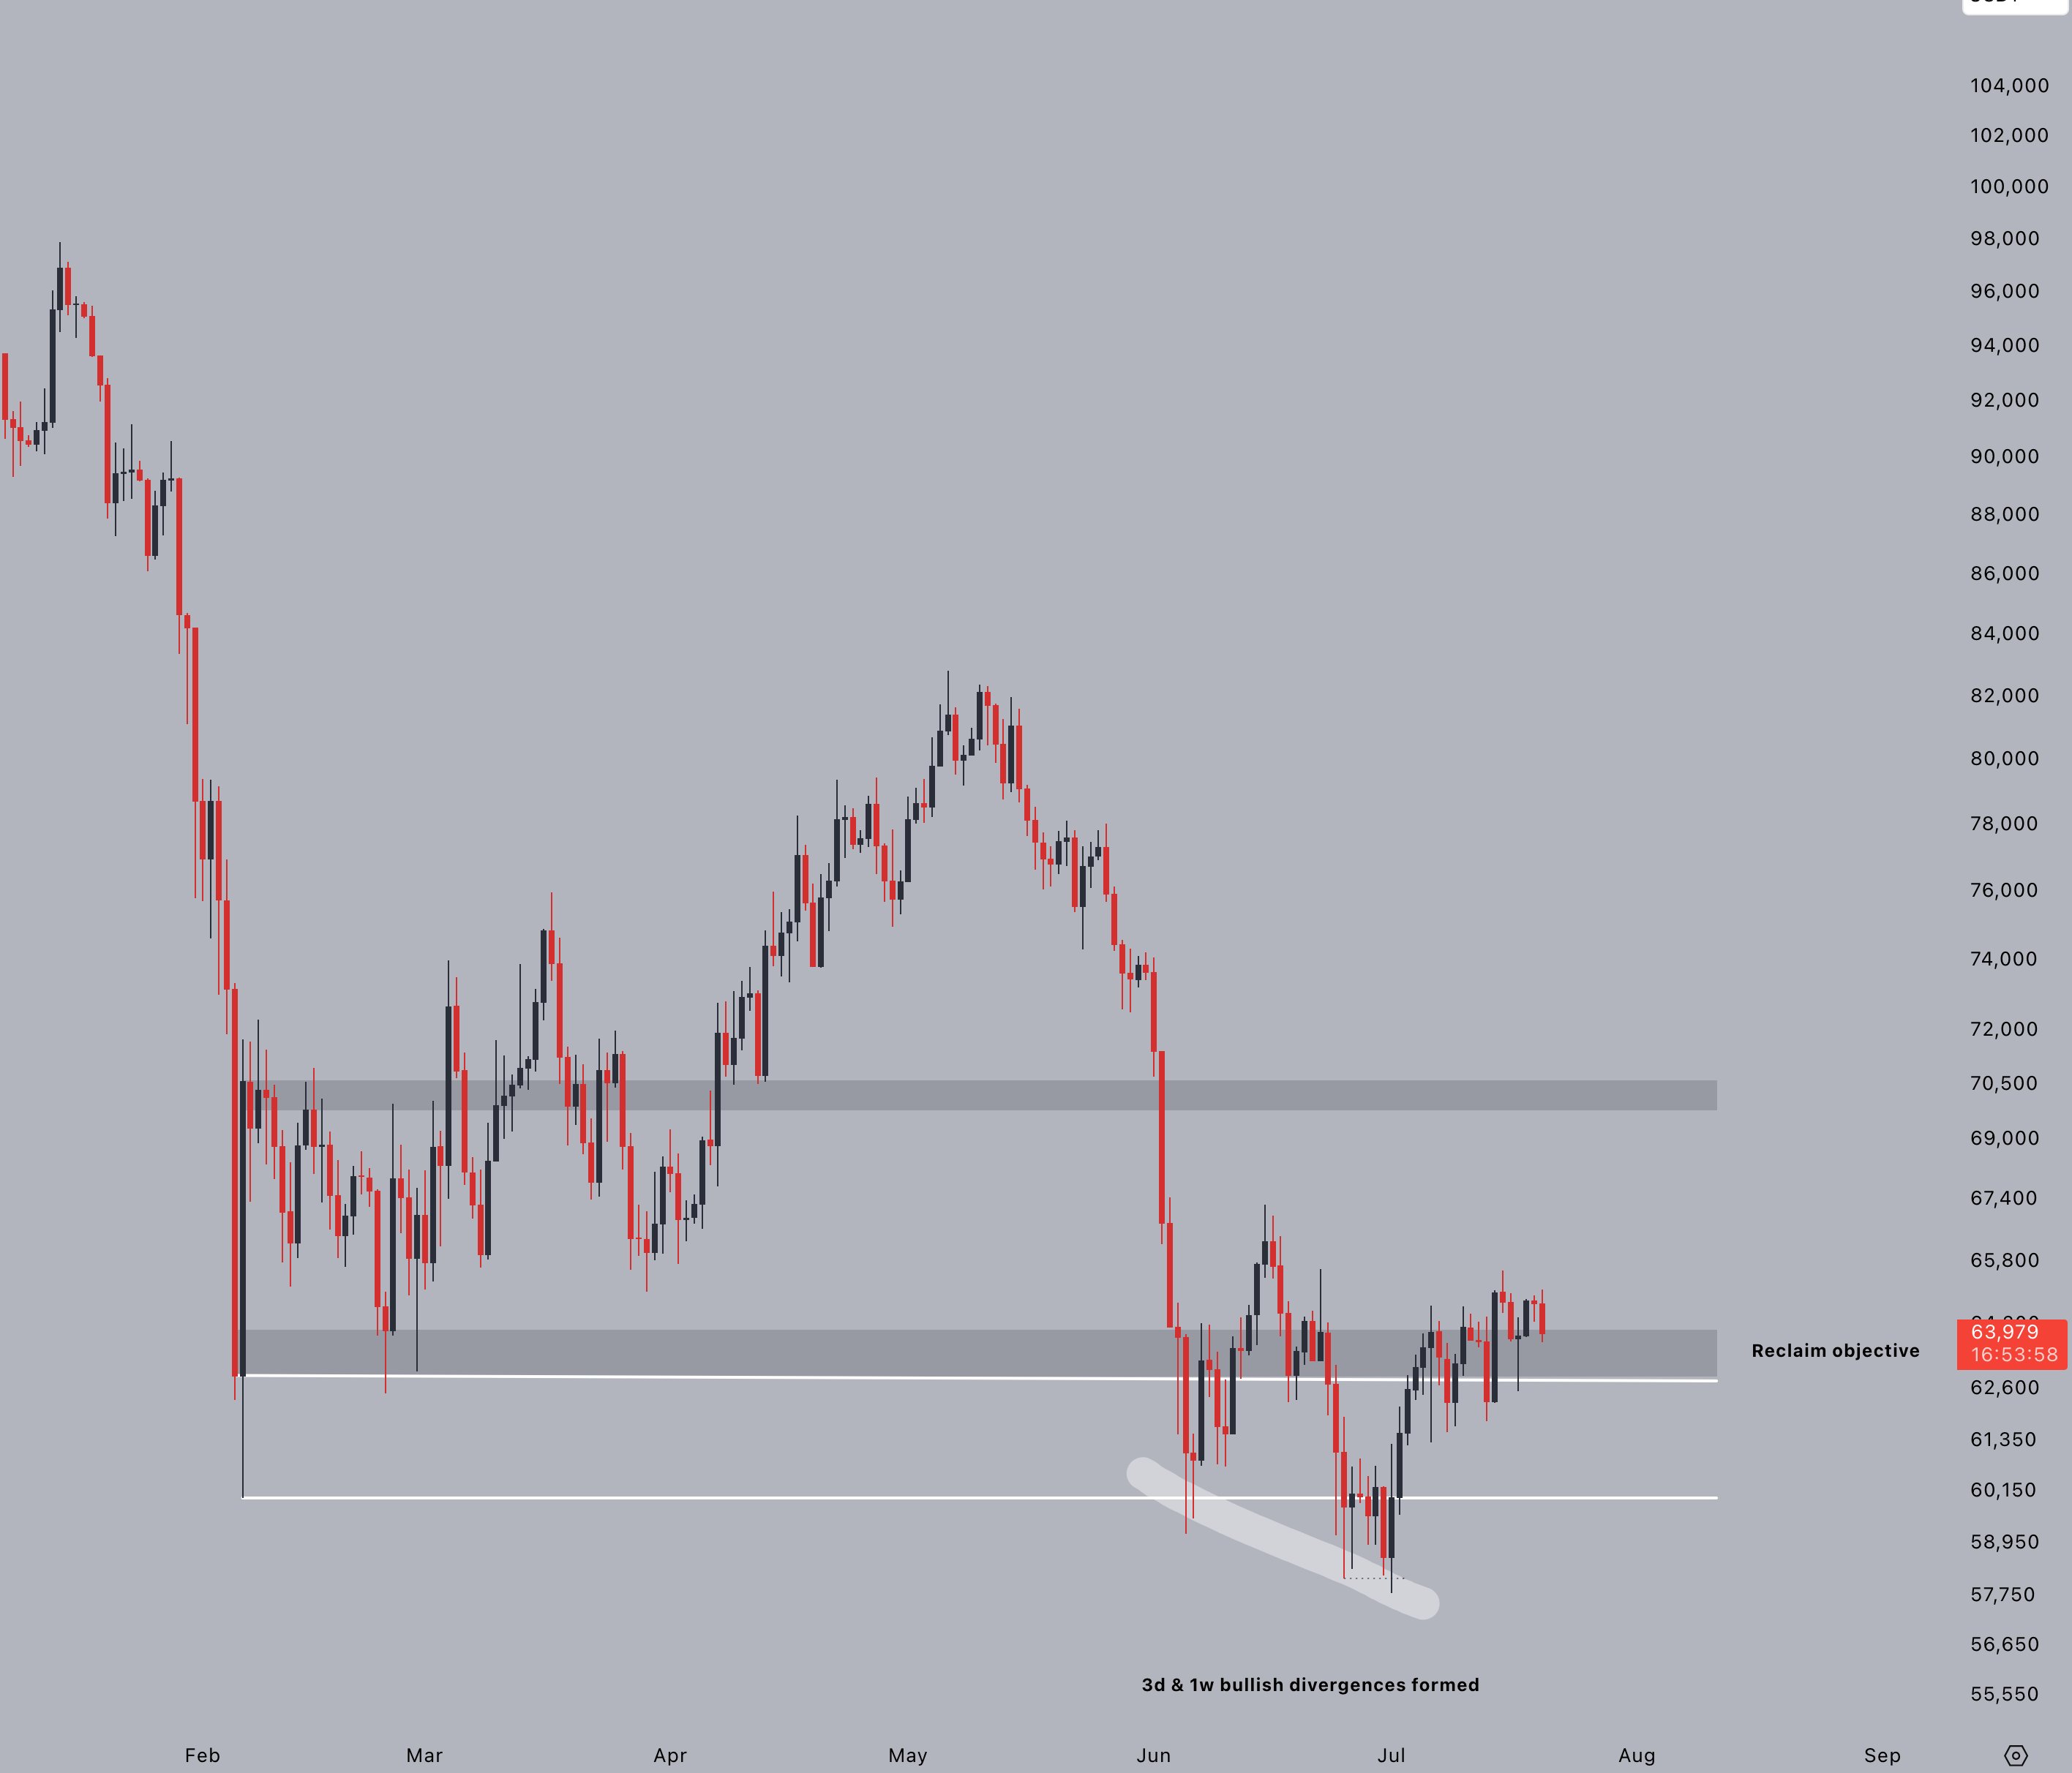
BTC/USD one-day chart. Source: Jelle/X
Trader Daan Crypto Trades noted that BTC/USD had sealed its third consecutive weekly close above the 200-week simple moving average (SMA), currently at $63,322.
“To really get this interesting you want to see a strong push higher now to retrace that last leg down and get back above the Weekly 200EMA,” he told X followers, referring to the 200-week exponential moving average (EMA) at $68,521.
“Until then, we’re just caught in this $60K choppy price range.”
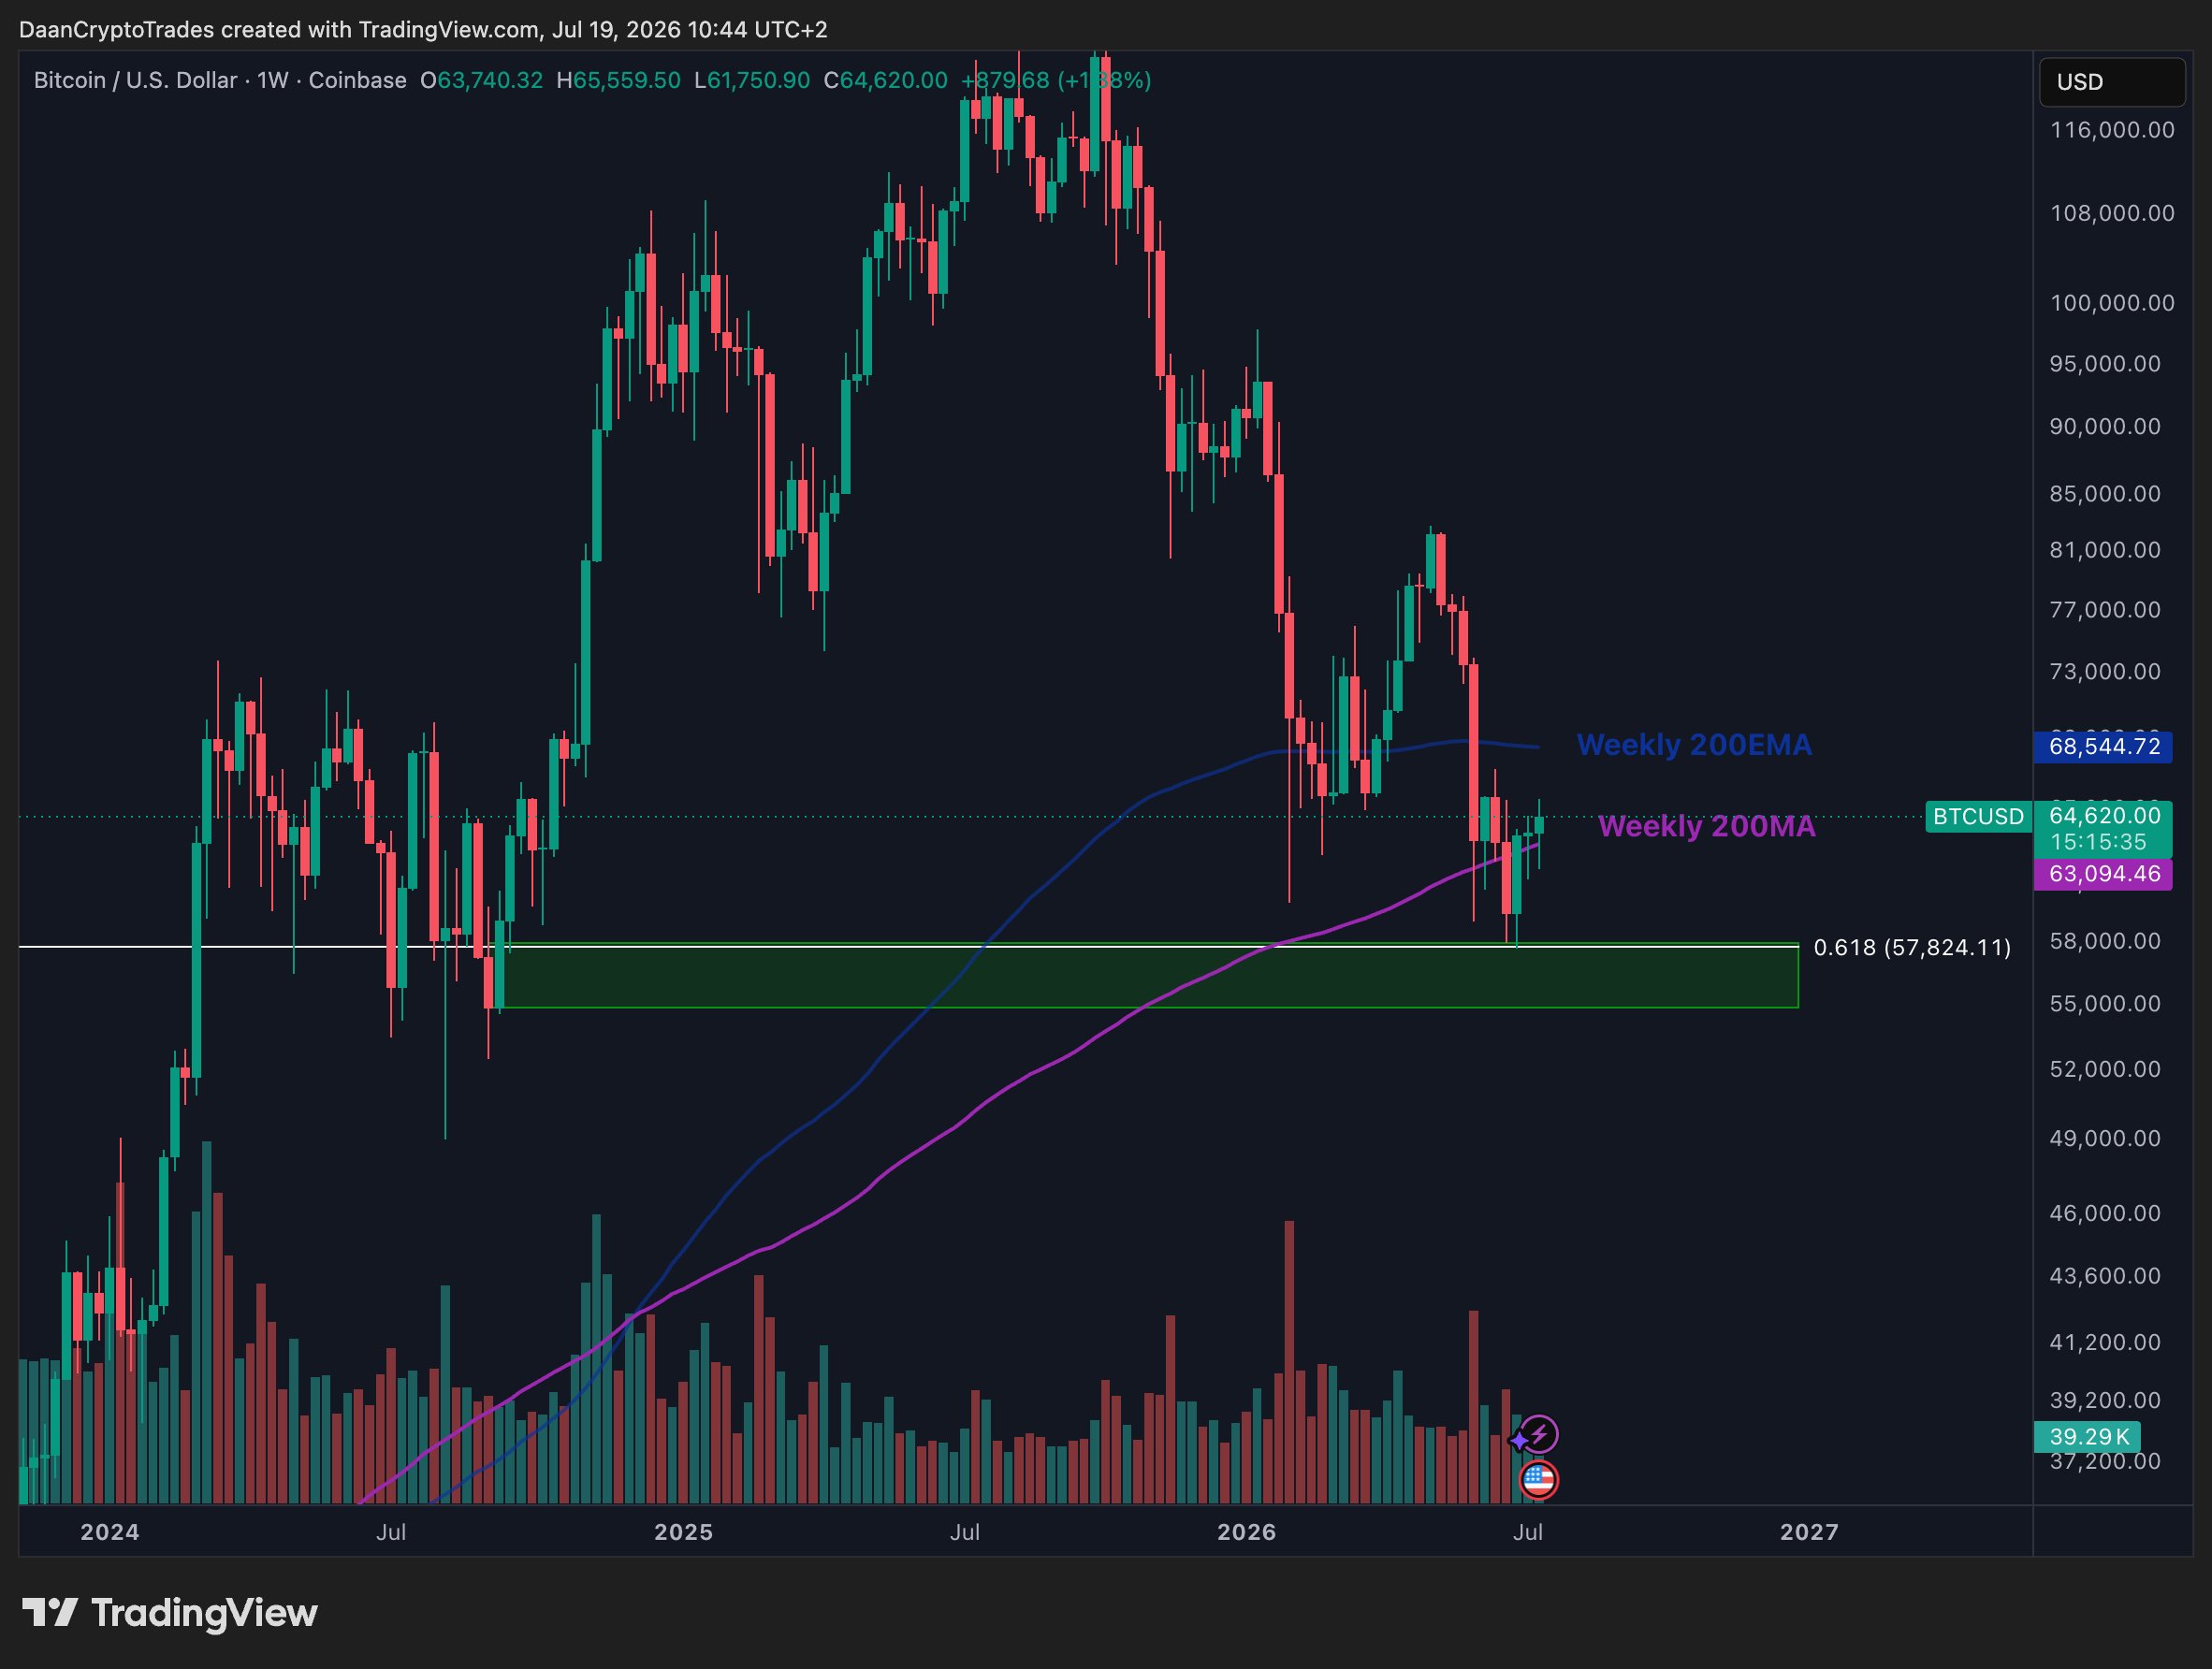
BTC/USD one-week chart. Source: Daan Crypto Trades/X
Others doubled down on bullish conviction, with trader Roman again flagging multiple bullish divergences across BTC price metrics, including the relative strength index (RSI), a classic leading indicator.
Contrasting the optimism was seasonality, with BTC price cycle history demanding another year of bear-market moves.
“Bitcoin is more than halfway through its second year in the current BTC Four Year Cycle. 2025 proved to be the year of the $BTC Bull Market peak. And 2026 has proven itself to be the year of the Bitcoin Bear Market,” trader and analyst Rekt Capital summarized.
“2027 will be the Bottoming Out year to precede an entirely brand new future Bitcoin Bull Market.”
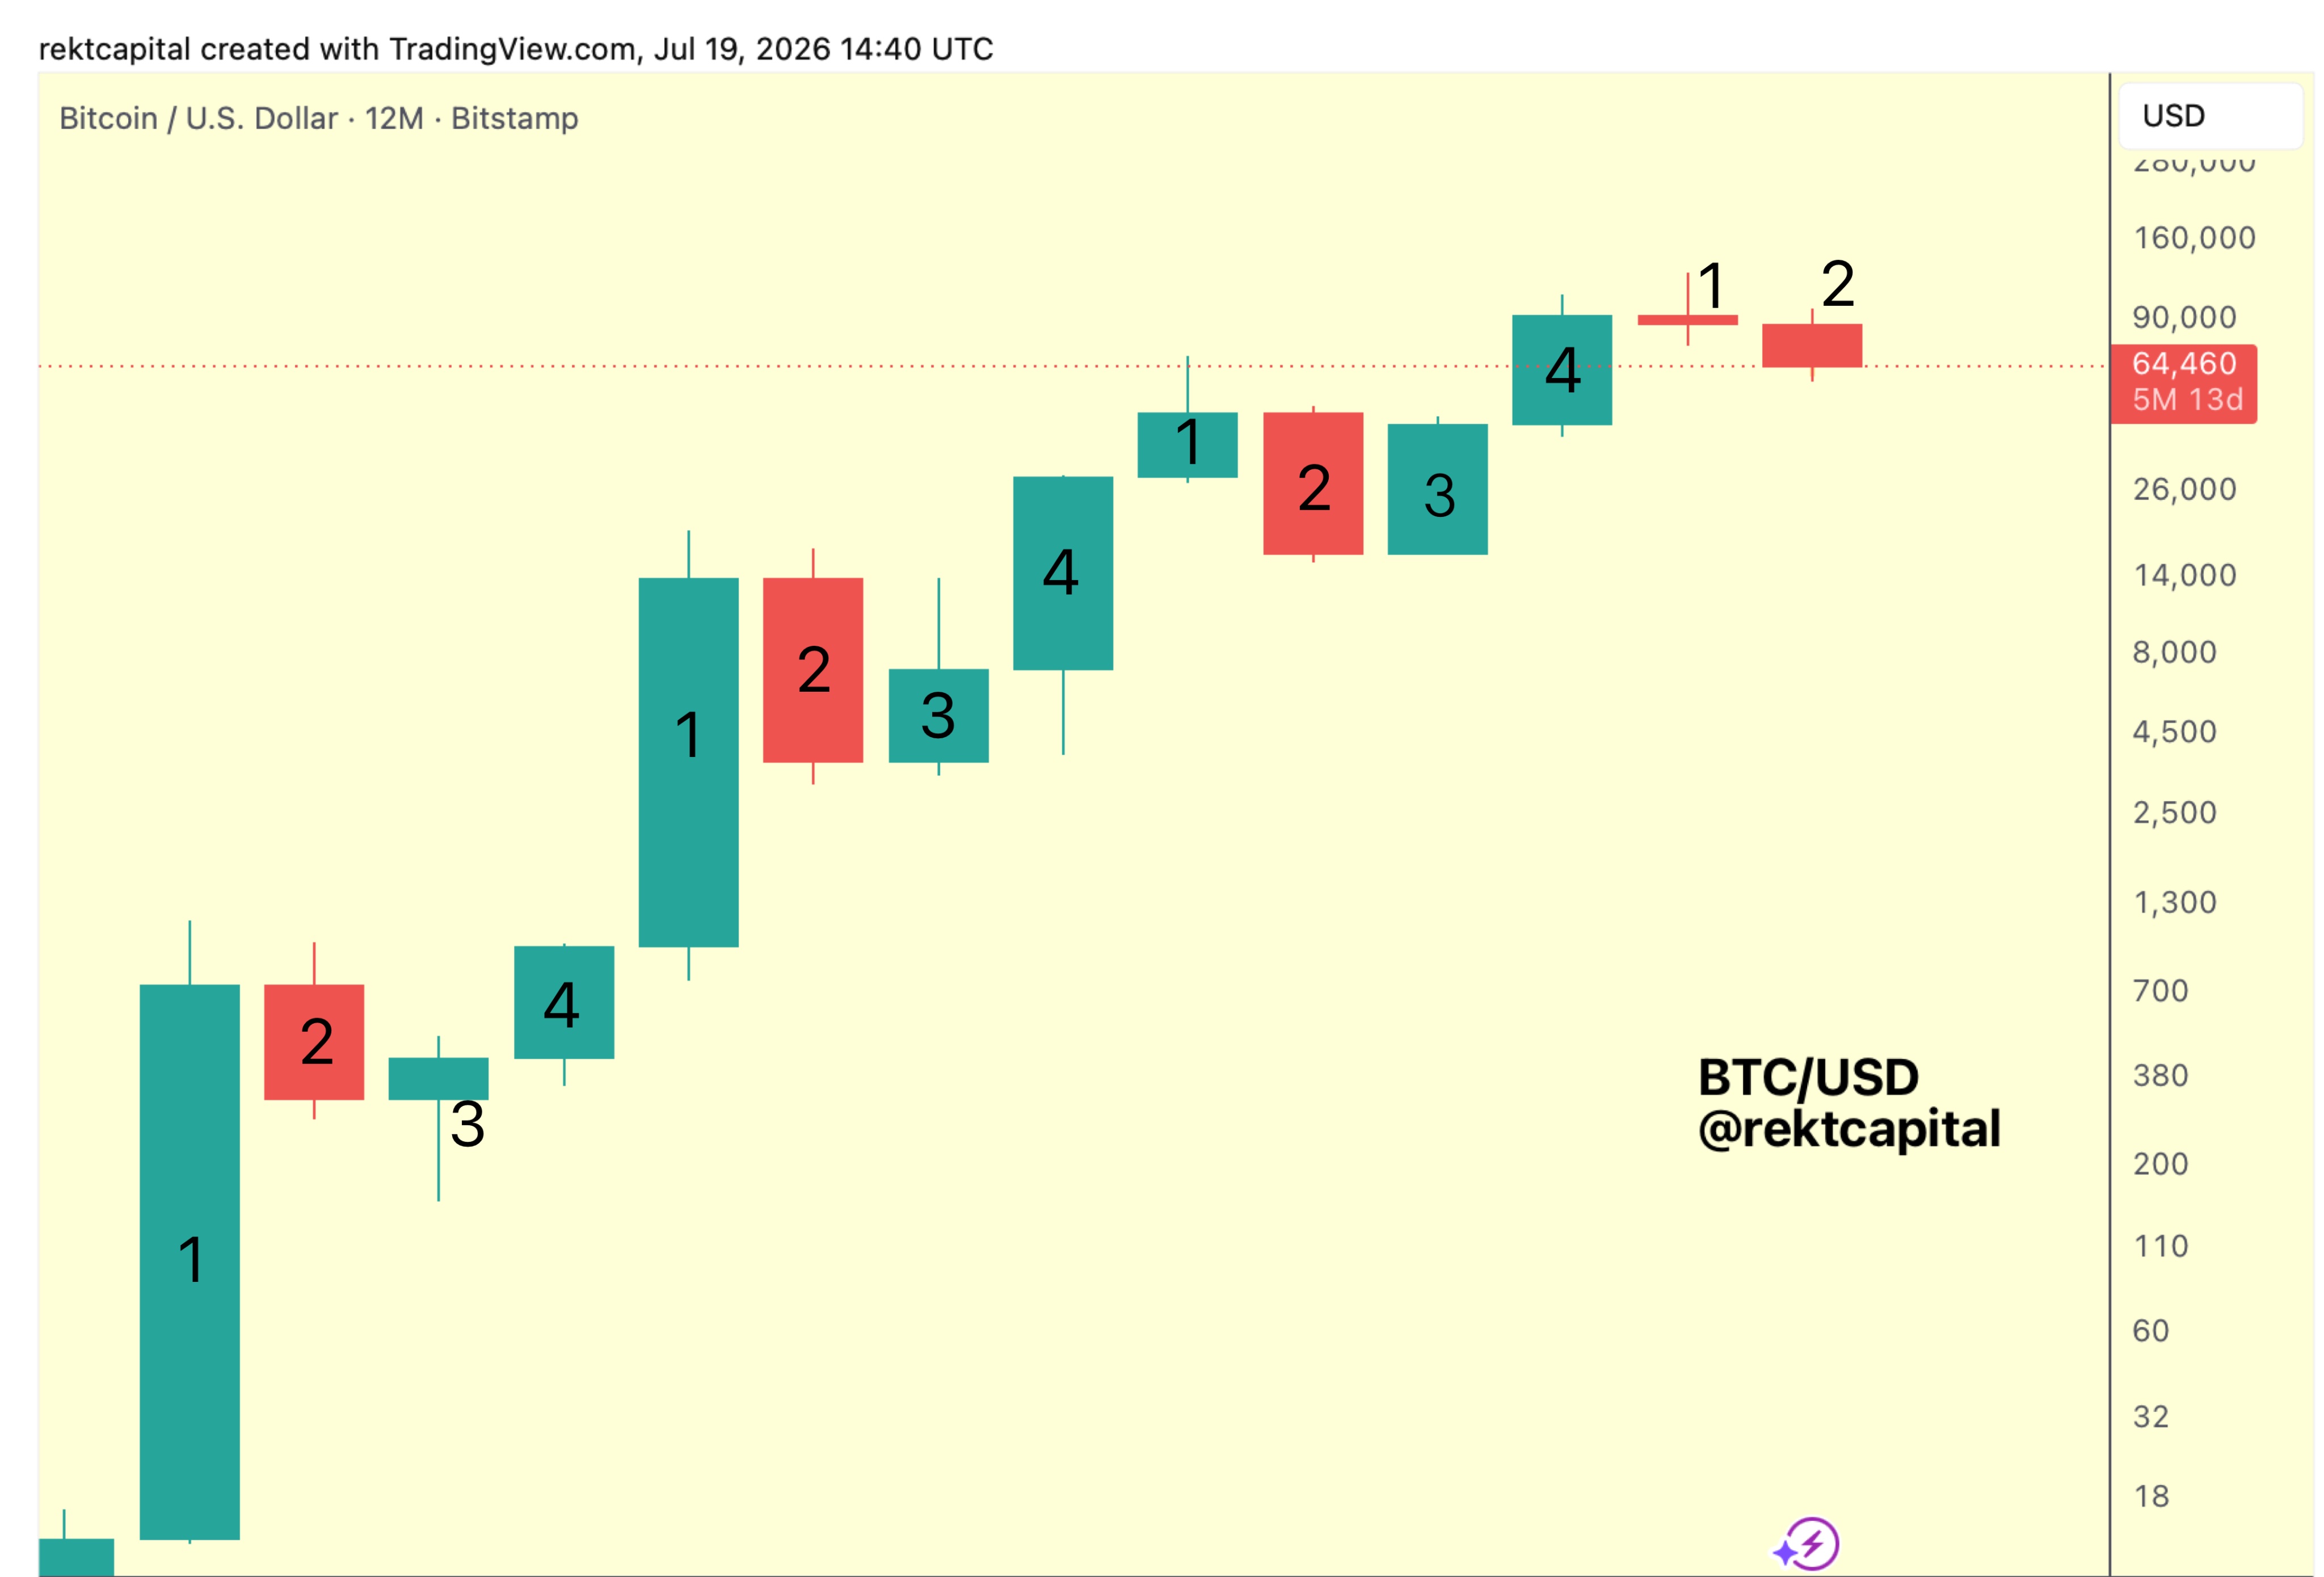
BTC/USD 12-month chart. Source: Rekt Capital/X
As Cointelegraph reported, Rekt Capital now calculates the current bear market to be just over 70% complete.
Iran worries send oil prices higher
Geopolitical risk is top of the agenda for risk-asset traders this week as the US-Iran war escalates once again.
Iran’s foreign minister warned of potentially “unresolvable” nuclear disputes while US President Donald Trump called on lawmakers to add Iran to a sanctions bill that was initially directed at Russia.
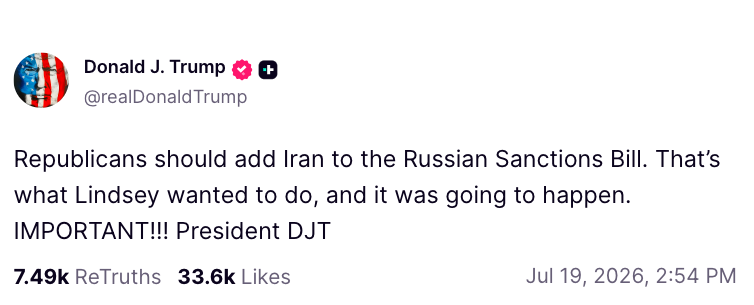
Source: Truth Social
Oil futures surged at the weekly open, with WTI crude at five-week highs above $80 per barrel and Brent crude topping $90.
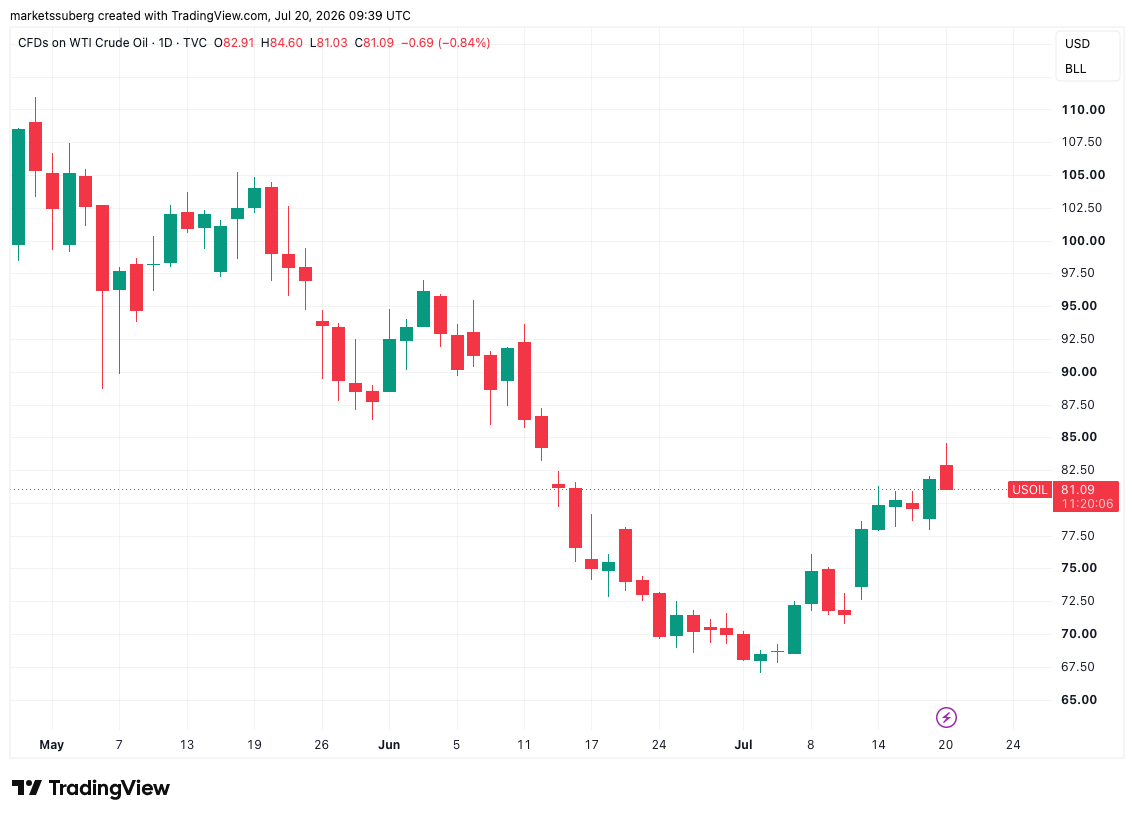
CFDs on US WTI crude oil one-day chart. Source: Cointelegraph/TradingView
As Cointelegraph reported, the return of the conflict saw the swift closure of the Strait of Hormuz, a key global oil route, that was briefly cleared for traffic as part of the now-failed US-Iran peace deal.
The latest Iran events provide volatile backdrop to the week’s macro outlook, which focuses on major corporate earnings as tech stocks face new headwinds.
In the coming days, Tesla, Alphabet and Intel will all report, providing a potential short-term volatility catalyst across risk assets.
“Earnings season is officially in full-swing,” trader resource The Kobeissi Letter summarized in a thread on X.
Following last week’s lower-than-expected US inflation data, meanwhile, Trump was buoyant, calling the numbers “great news.”
“As Investment pours into our Country, Factory Construction surges, Manufacturing Jobs rise, and Prices fall, there is so much to be proud of — The Golden Age of America is here!” he wrote in a post on Truth Social.
Markets remained conservative on policy changes from the Federal Reserve, with the latest data from CME Group’s FedWatch Tool showing consensus for a 0.25% interest-rate hike in September.
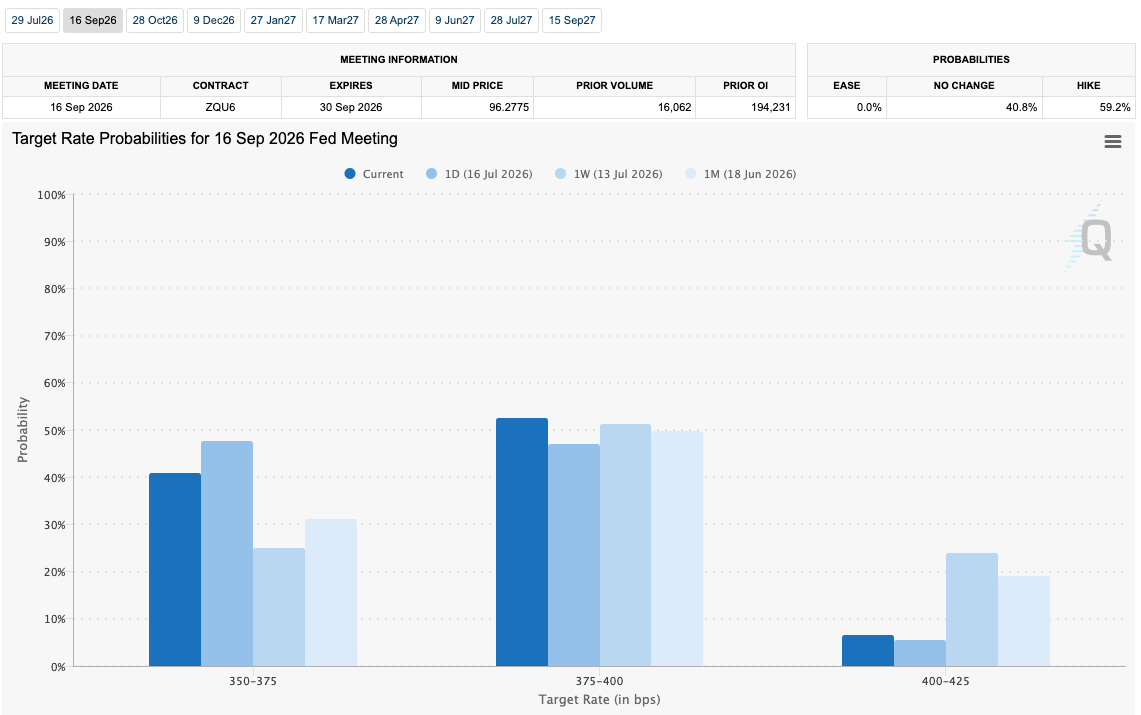
Fed target-rate probabilities for September FOMC meeting (screenshot).
Source: CME Group
Bitcoin spot demand returns lower
Lackluster spot-market demand remains a key stumbling block on the road to bull-market recovery, research says.
In a blog post on Monday, onchain analytics platform CryptoQuant revealed that a modest supply increase at the start of July had already dissipated.
“Bitcoin’s 30-day Spot Demand recovered sharply to around -80K BTC in early July but has since deteriorated again to nearly -170K BTC,” contributor ScenarioX wrote.
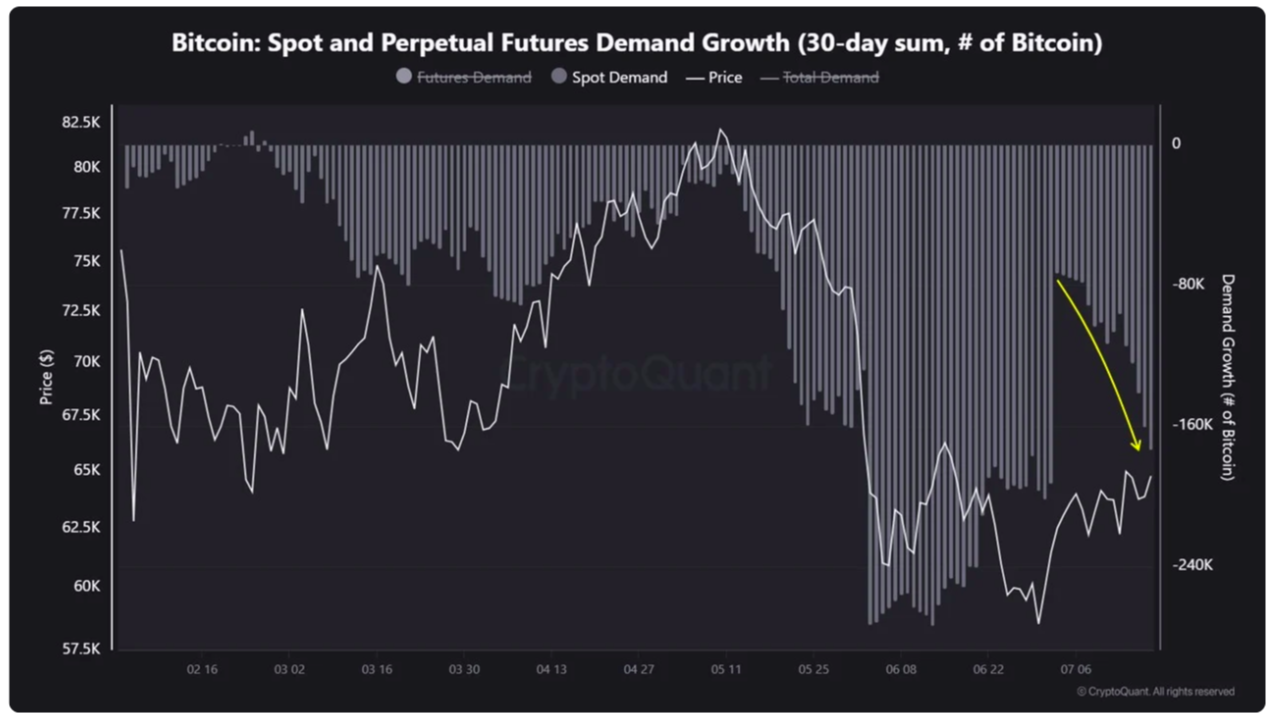
Bitcoin demand data (screenshot). Source: CryptoQuant
Earlier, Cointelegraph reported on spot demand staying negative while recovering significantly on a rolling 30-day basis as BTC/USD hit $64,000. At the same time, futures markets saw a more pronounced influx of interest.
This was reflected in net flows to the US spot Bitcoin exchange-traded funds (ETFs), which were positive for four out of five days last week, per data from UK-based investment manager, Farside Investors.
“Despite this significant decline in spot demand, Bitcoin’s price has remained relatively stable, mainly due to easing short-term selling pressure and short covering in the derivatives market,’ ScenarioX said.
“However, derivatives demand remains insufficient to support a sustainable uptrend on its own. This leaves the market in a structurally fragile state, where renewed spot selling could trigger a sharp downside move.”
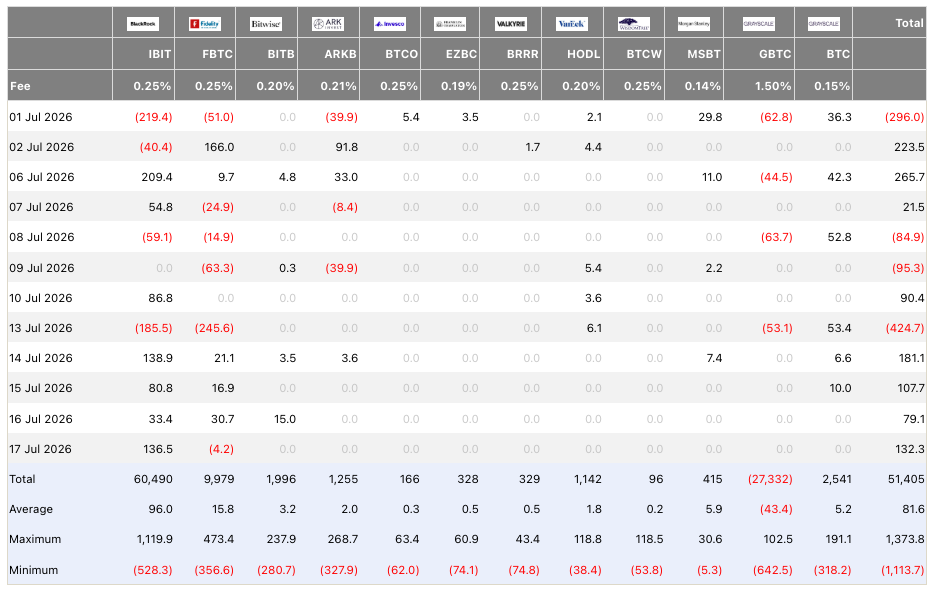
US spot Bitcoin ETF netflows (screenshot). Source: Farside Investors
CryptoQuant suggested that the market could still continue to gain “for a while” before futures demand was exhausted.
“However, the rally without meaningful spot demand is likely to end in a significant long liquidation event,” ScenarioX warned.
Puell Multiple lows fail to convince
A classic BTC price metric is showing signs of a reversal this month, but CryptoQuant warns that it is too early to talk of a “generational low.”
The Puell Multiple, which measures the USD value of newly issued BTC each day relative to its 365-day moving average, continues to head higher after seeing macro lows in early June.
“A low reading means miner income is well below normal,” CryptoQuant contributor TheChessOnChain explained in a blog post.
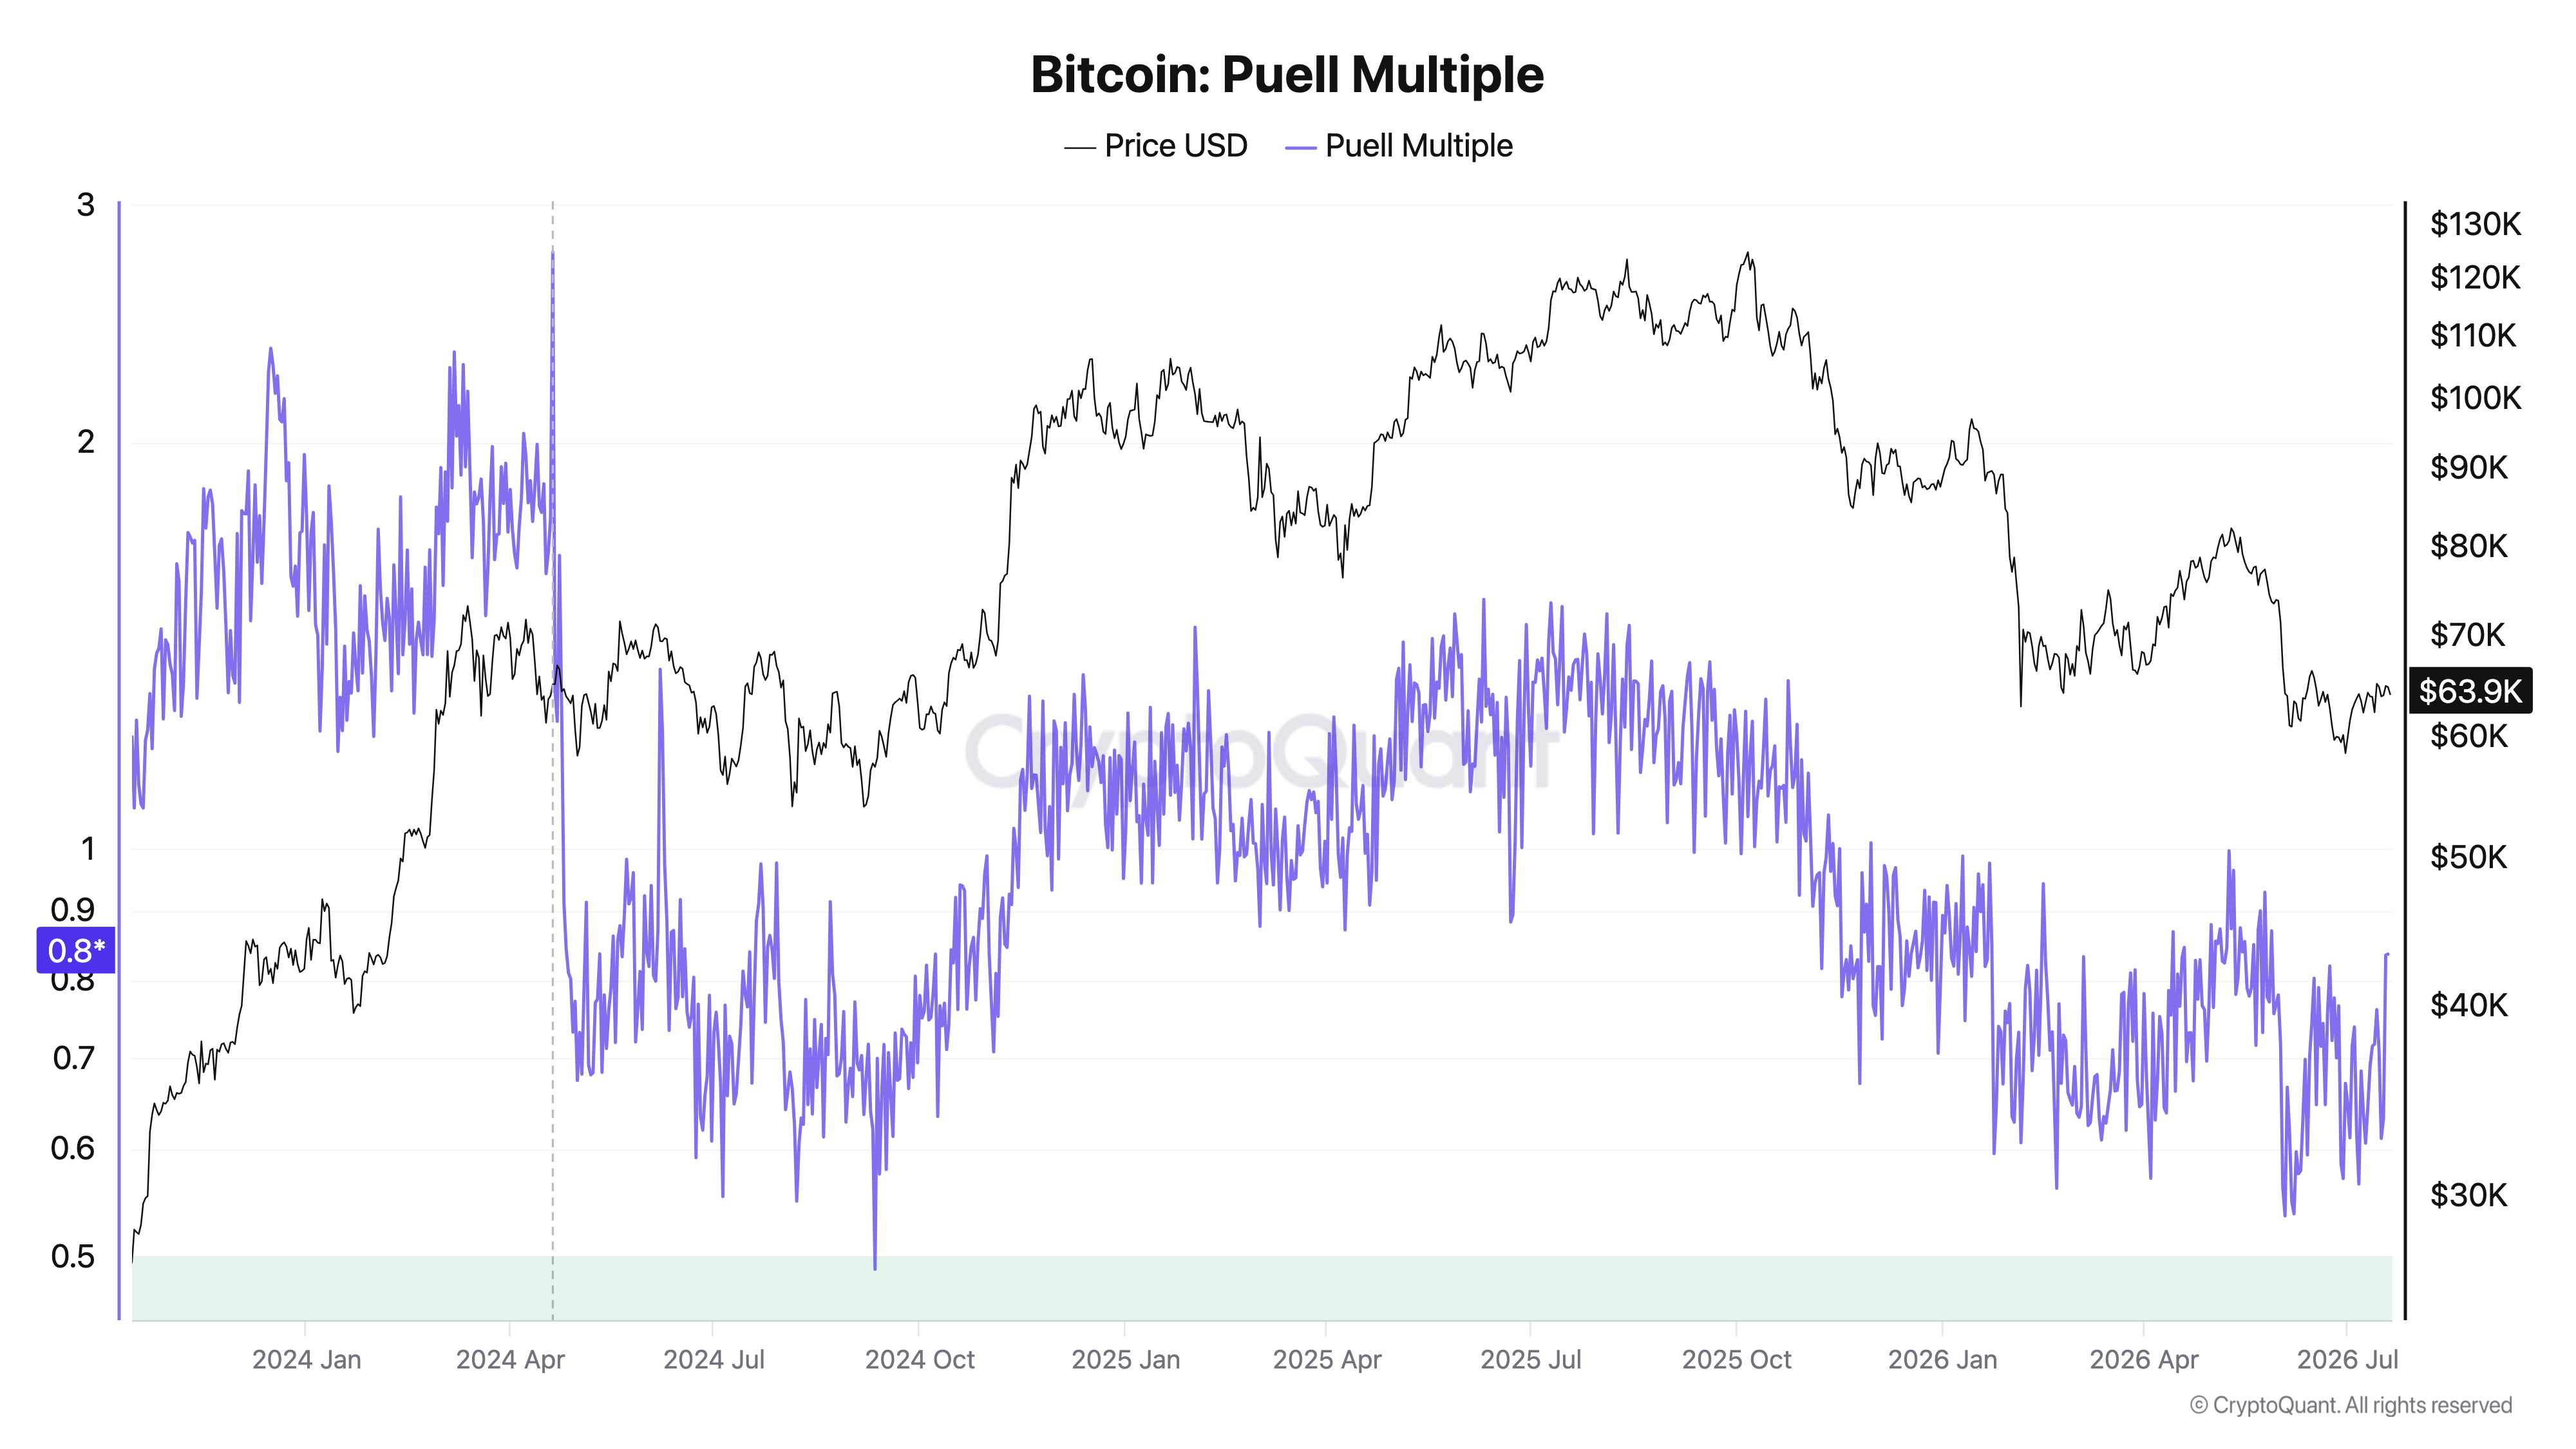
Bitcoin Puell Multiple. Source: CryptoQuant
Puell in turn reflects on Bitcoin miners’ financial stability, and June’s 0.87 reading was the lowest since September 2024. Zooming out, however, each BTC price cycle has delivered higher lows for Puell, potentially boosting that latter reading’s chances of forming the next floor.
“These bottoms are getting shallower, and the four-year supply cut (the halving) is not the cause: the metric scales both sides of its ratio, so cutting new supply cancels out. The real driver: price falls less each cycle (down 83% in 2018, 77% in 2022, less since), so miner income never sinks as deep,” TheChessOnChain said.
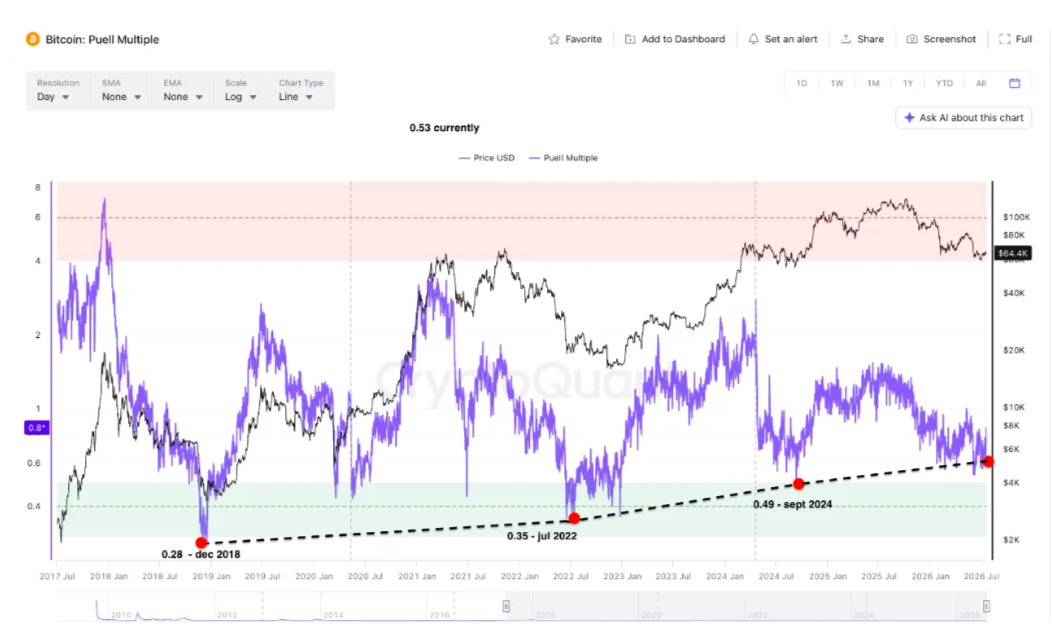
Bitcoin Puell Multiple data (screenshot). Source: CryptoQuant
While Puell lows do not strictly correspond to BTC price bear-market bottoms, TheChessOnChain suggests that waiting for new lower readings — including the metric’s classic deep value territory — may be a flawed strategy.
“The 2024 and 2026 lows came with price still high, so they are Puell lows, not price bottoms. Waiting for the classic sub-0.5 zone, where miners sell at a loss, may mean waiting for a level that no longer prints,” they said.
“Today reads as easing miner pressure, not a generational low. It turns decisive only if it holds beneath recent lows for weeks.”
Crypto sentiment gauge nears two-month high
Despite macro headwinds brewing over the weekend, crypto market sentiment continues to post a steady recovery.
Related: Bitcoin bottom countdown nears 50 days after BTC supply in loss passed 50%
The latest readings of the Crypto Fear & Greed Index show panic slowly dissipating among the broader investor base.
On Monday, the gauge measured 29/100 — still within its “fear” bracket but at its highest levels since the start of June. For much of the intervening period, crypto was gripped by “extreme fear.”
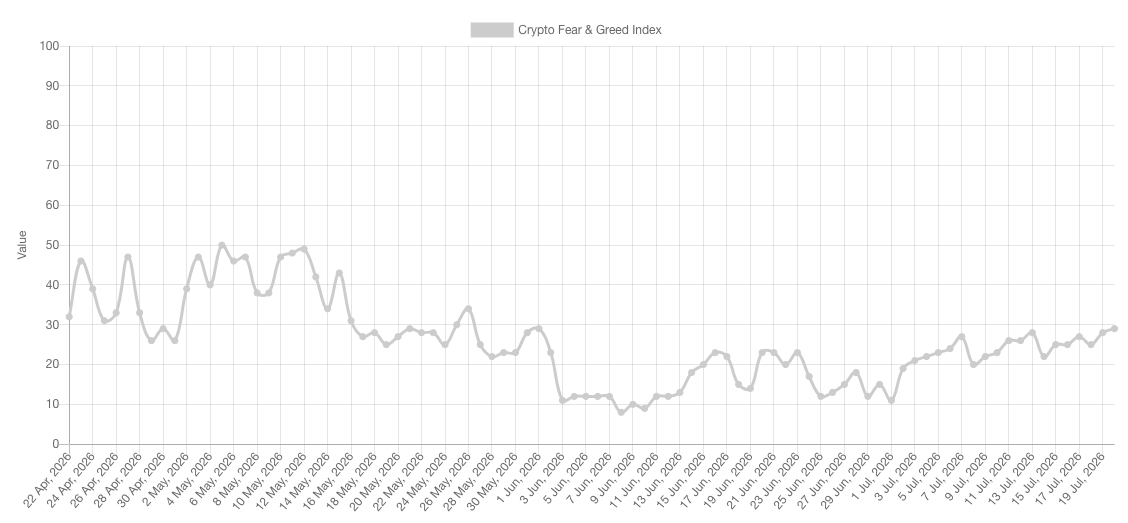
Crypto Fear & Greed Index (screenshot). Source: Alternative.me
In commentary on the rebound last week, research platform Santiment underscored its timing with the return of ETF inflows.
“After a long outflow stretch throughout May and June, this shift signals ETF demand is back and confidence in crypto is starting to pick up again,” it wrote on X.
Santiment argued that “encouraging” US inflation data had helped boost risk appetite, while “crypto policy optimism added another reason for sidelined buyers to re-enter.”

Crypto World
Reserve Transparency Built Through Continuous Operation: Matrixdock Marks Two Years of Independent Verification
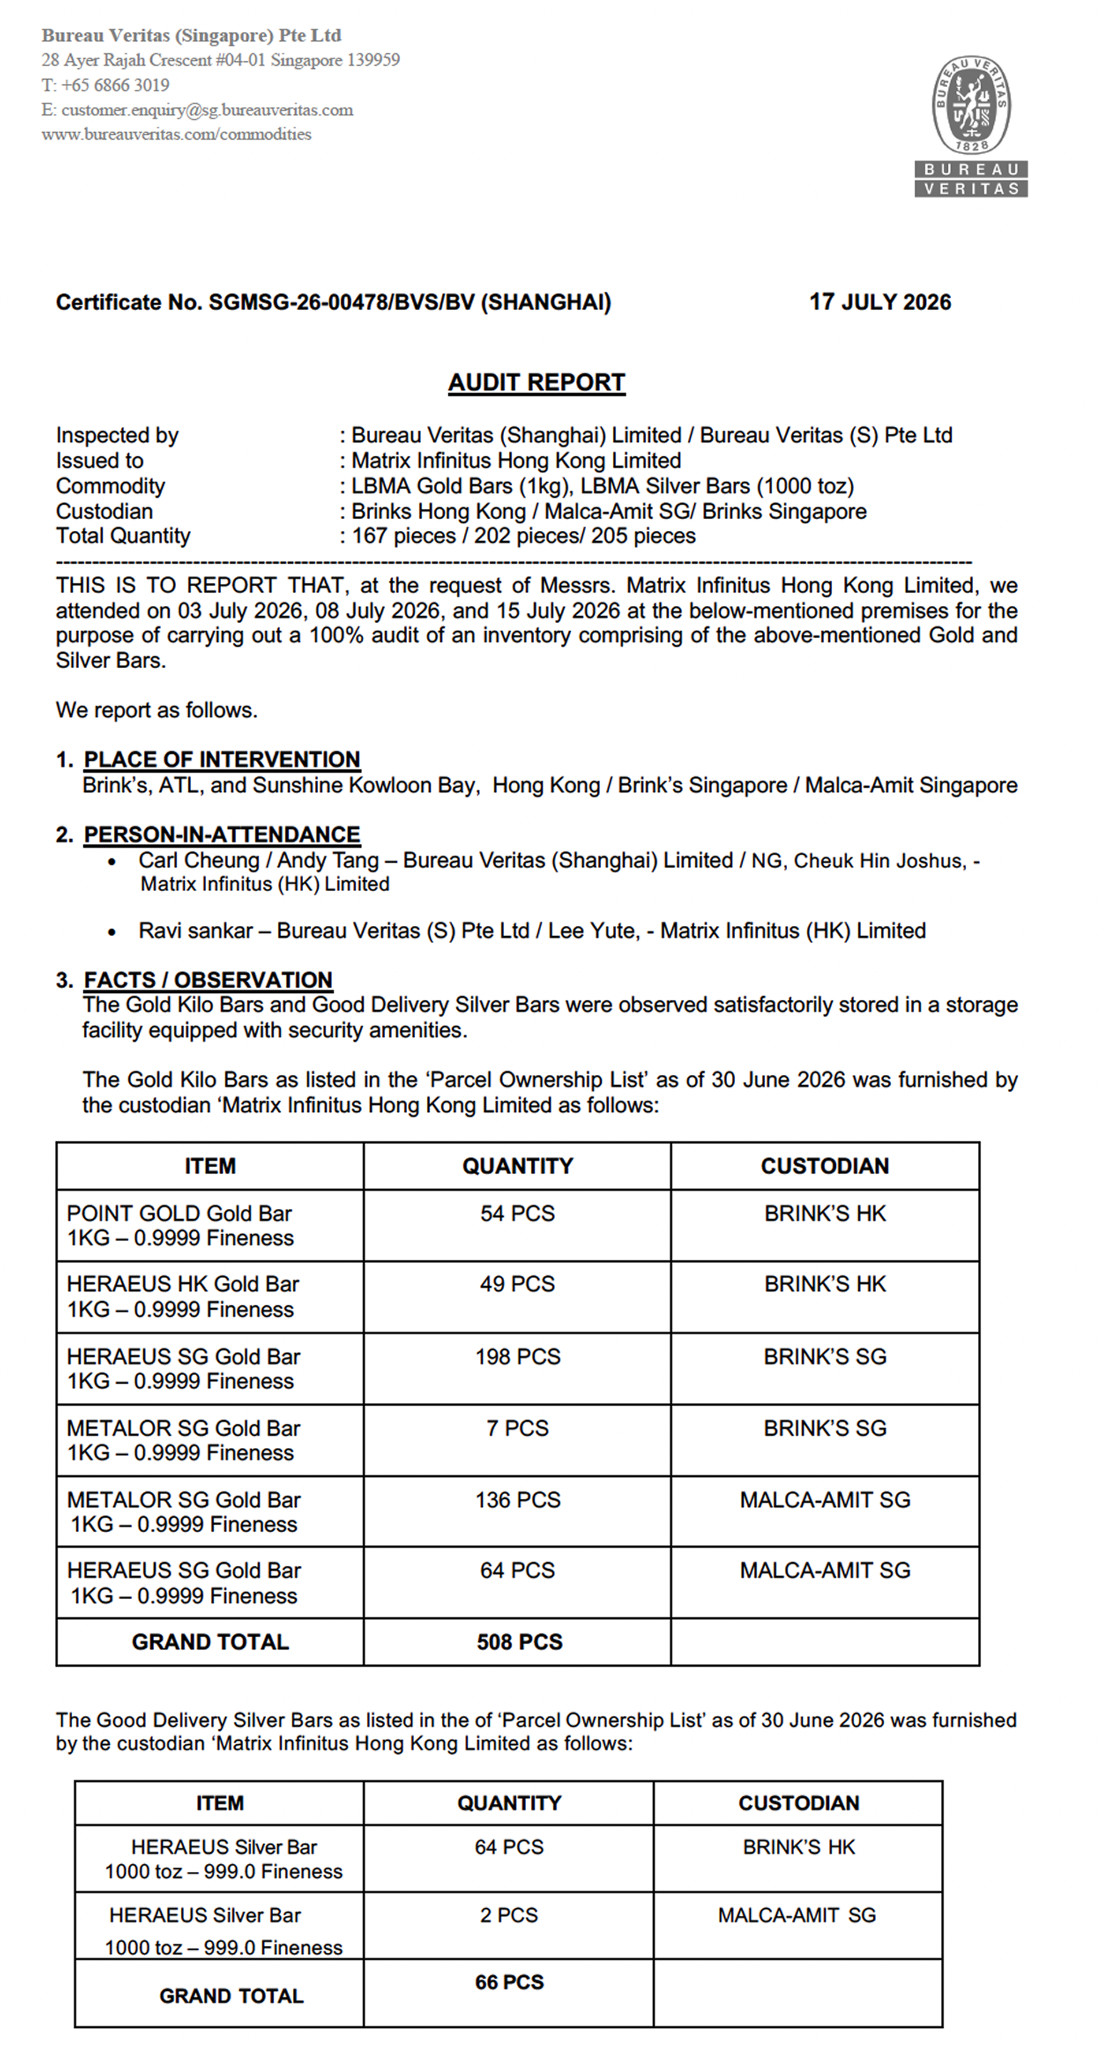
If tokenized reserve assets are going to serve as collateral and support lending, treasury management, and settlement across on-chain finance, their backing must remain continuously verifiable.
Today, Matrixdock has completed its fourth consecutive semi-annual independent reserve audit with Bureau Veritas. For the first time, the audit extends beyond Matrixdock’s tokenized gold product (XAUm) to include its tokenized silver product (XAGm). More than another audit milestone, this reflects Matrixdock’s broader commitment: building reserve assets that institutions, ecosystem partners, and builders can use with confidence.
Two Years of Continuous Verification. One Operating Standard.
By completing two years of reserve audits with the same independent auditor, Matrixdock has established a consistent verification process. That continuity gives Bureau Veritas a deeper understanding of Matrixdock’s reserve structure and positions them to better identify inconsistencies should they arise. Recurring audits are a form of proof: a verification process that operates consistently over time.
As tokenized assets become increasingly integrated into financial infrastructure, long-term trust is built through continuous operation.
The Reserve Transparency Stack
Reserve transparency at Matrixdock is built in layers of verification that together give holders ongoing visibility into the assets backing each token. Matrixdock calls this the Reserve Transparency Stack.
Independent Verification: Inside the July Audit
Bureau Veritas physically verified the underlying precious metal reserves, confirming that reserve holdings remain consistent with Matrixdock’s records.
As in previous audit cycles, the inspection was conducted bar by bar covering 574 gold and silver bars from LBMA-accredited refiners across three institutional vault facilities:
- Malca-Amit Singapore (conducted on 3 July 2026)
- Brink’s Hong Kong (conducted on 8 July 2026)
- Brink’s Singapore (conducted on 15 July 2026)
Each bar was individually weighed and measured. 26 gold bars have been added since the H2 2025 audit, and 66 silver bars are included for the first time this cycle.

Gold (XAUm)
- Total gold audited: 508 bars
- Equivalent weight: 16331.184 troy ounces
- XAUm circulating supply: 16331.179 tokens
- EVM chains (Dune): 11242.657 tokens
- Sui network (Suiscan): 2677.413 tokens
- Solana network (Solscan): 1575.248 tokens
- Stellar network (Stellar expert): 771.552 tokens
- Approximate market value: USD $66.09 million, based on gold at $4,046.86 per troy ounce
Silver (XAGm) – new to this audit
- Total silver audited: 66 bars
- Equivalent weight: 65,934.000 troy ounces
- XAGm circulating supply: 65998.551 tokens
- Ethereum network (Etherscan): 33004.219 tokens
- Sui network (Suiscan): 32990 tokens
- Current ozPerToken value: 0.999021918
- Approximate market value: USD $4.04 million, based on silver at $61.24 per troy ounce
Each bar was reconciled against the relevant vault records with no discrepancies identified. As of the audit date, XAUm reserves were consistent with the circulating token supply, and XAGm reserves were consistent with the circulating token supply when applying the applicable ozPerToken value.
Ongoing Transparency
A semi-annual reserve audit is one layer of verification. Between audits, holders can check monthly reserve asset statements, on-chain proof-of-reserves for the precious metals products, and the Gold Allocation Lookup tool, which maps specific gold bars to tokens so holders can verify the backing directly. Together, these provide a running record rather than periodic snapshots.
Building the Reserve Layer requires continuous improvement. Looking ahead, Matrixdock is evaluating opportunities to work with global third-party service providers that could strengthen asset-level verification for off-chain reserves while preserving client-level privacy.
Continuous Transparency as the Reserve Layer Discipline
Reserve transparency is the foundation that makes reserve assets trusted enough to participate confidently across on-chain finance.
When reserve backing can be verified at any time, a reserve asset can move deeper into on-chain finance: held in treasuries, integrated into financial applications, and used as collateral in lending markets. By reducing uncertainty around backing, verification expands what a reserve asset can do. That is why reserve transparency is a product feature at Matrixdock.
This is the work of building the Reserve Layer for on-chain finance. As tokenized assets evolve from simple representations into financial infrastructure, their quality will be defined by how well their backing holds up to verification, cycle after cycle. The fourth consecutive semi-annual reserve audit reflects Matrixdock’s long-term commitment to building the Reserve Layer.
Read the full Bureau Veritas audit report here.
The post Reserve Transparency Built Through Continuous Operation: Matrixdock Marks Two Years of Independent Verification appeared first on BeInCrypto.

Bitcoin mining stocks jumped Monday as Hut 8 and IREN announced large-scale moves into AI infrastructure and cloud services, renewing investor interest in the sector’s ongoing pivot away from pure mining economics.
According to the early trading data cited in the report, shares of IREN, Cipher Digital, CleanSpark, Hut 8 and MARA Holdings each rose at least 11% on Monday. The catalyst came from two major announcements: Hut 8’s disclosure of a 15-year, $9.8 billion lease for its AI data center campus and IREN’s filing detailing $2.8 billion in cloud services contracts with AI developers (as stated in IREN’s SEC disclosure, https://www.sec.gov/Archives/edgar/data/1878848/000114036126028871/ef20078253_ex99-1.htm).
Key takeaways
- Hut 8’s $9.8 billion, 15-year AI campus lease and IREN’s $2.8 billion cloud contract disclosure helped drive broad gains across mining-related stocks.
- IREN expects its AI cloud business to exceed $4 billion in annual recurring revenue by the end of 2026.
- The rally tracked improvements in broader tech sentiment, including gains in Nasdaq and the Philadelphia Semiconductor Index.
- Industry momentum remains complicated by funding needs and investor scrutiny around insider selling.
AI infrastructure deals spark a sector-wide rerating
The Monday move wasn’t isolated to a single name. The report ties the rally to two specific, capital-intensive developments that place miners closer to demand centers tied to AI computing: large data center capacity and contracted cloud services.
Hut 8’s planned AI data center expansion is anchored by a long-term lease for a campus that, if executed as described, would materially increase its ability to host high-performance workloads. IREN’s SEC filing, meanwhile, highlights cloud services contracts with AI developers totaling $2.8 billion—an important distinction because it points not just to infrastructure buildout, but to service demand lined up in advance.
These developments build on the broader theme that has defined the sector over the past year: miners increasingly market themselves as energy and compute providers for AI-era workloads, not only as facilitators of bitcoin production. The report also notes that these companies began as bitcoin miners before accelerating that pivot as mining profitability faced sustained pressure.
Financial outlook and the AI infrastructure index
IREN’s disclosure included a forward-looking revenue target for its AI cloud unit. The report states that IREN expects the business to generate more than $4 billion in annual recurring revenue by the end of 2026. While such targets are inherently dependent on execution, contracting, and customer adoption, recurring revenue projections are typically more attractive to investors than purely speculative growth narratives—particularly for companies spending heavily to expand computing capacity.
The rally also showed up in a sector indicator maintained by The Energy Mag. The report references the TEM AI Infrastructure Growth Index, which tracks 20 companies spanning bitcoin mining, “neocloud,” and AI infrastructure. It rose 1.4% on Monday and is up more than 12% over the past week, suggesting that market optimism extended beyond a handful of headlines into a broader “AI infrastructure” trade.
Broader tech markets lift semiconductors and risk appetite
Mining stocks did not rise in a vacuum. The report links the move to a wider rebound in technology-related equities, noting that the Nasdaq Composite Index added 0.9% by midday. It also points to strength in the Philadelphia Semiconductor Index, which climbed 2% after having entered a technical bear market the prior week.
For investors positioning for AI growth, semiconductor demand is often viewed as a key upstream signal. The report defines a technical bear market as a decline of 20% or more from a recent high, underscoring that semiconductors were already in a stress phase before the bounce. Monday’s rebound in chip-related equities may have helped create a more favorable risk environment for companies perceived as beneficiaries of AI buildouts.
Volatility, funding gaps, and insider-selling scrutiny
Despite Monday’s positive reaction, the report emphasizes that the mining-to-AI transition remains a source of volatility. It highlights that bitcoin mining stocks have moved sharply this year as companies struggle with a weaker mining environment while trying to finance expensive AI and cloud initiatives.
According to the report’s reference to Blocksbridge Consulting, the AI pivot has driven a “re-rating” across the sector—but the change in narrative has also increased scrutiny, particularly around insider stock sales. The report points to a Blocksbridge-linked analysis in a Miner Weekly newsletter that flagged insider sales at TeraWulf, Riot Platforms, Core Scientific and Cipher Mining. The transactions were described as being executed under prearranged trading plans, but the concern among investors is essentially strategic: whether enthusiasm for AI growth has pushed share prices to levels that make executive selling look opportunistic.
On top of market optics, funding needs remain a central unresolved issue. The report cites Blocksbridge’s estimate that the industry will require another $50 billion to realize its AI ambitions, with IREN described as facing the largest funding gap at roughly $21.1 billion. That estimate frames the rally’s biggest tension: investors may be buying into AI-related growth claims, but companies still face the practical question of how quickly and efficiently they can raise capital and convert planned capacity into contracted revenue.
As the sector digests today’s announcements and broader tech sentiment, investors will likely focus on two things next: whether miners can translate AI infrastructure spending into durable, contracted recurring revenue, and whether scrutiny over insider selling and financing timelines intensifies as expectations rise.
Bitcoin returned above $65,000 on Tuesday as a rebound in Asian technology stocks restored some risk appetite after last week’s semiconductor selloff.
Summary
- Bitcoin reclaimed $65,000 as Asian chip stocks rebounded and broader risk appetite strengthened across markets.
- U.S. spot Bitcoin ETFs extended inflows to five sessions, adding fresh institutional support for prices.
- MACD and RSI readings improved, while $70,000 remains BTC’s next major technical resistance level ahead.
At the time of writing, crypto.news price data showed BTC trading around $65,245, up 1.23% over 24 hours and 5.02% over seven days. Trading volume stood near $32.18 billion.
The broader crypto market also moved higher. Crypto.news showed Ethereum near $1,901, XRP around $1.11, Solana at $77.73, BNB near $571 and Hyperliquid around $62.49. Dogecoin traded near $0.073. The gains followed a sharp reversal across Asian equity markets, where South Korea’s Kospi rose 4.7%, Japan’s Nikkei gained 2.8% and Taiwan’s Taiex climbed 3.6%.
Bitcoin recovers as Asian chip stocks reverse losses
The Bitcoin rebound followed the same part of the market that drove last week’s decline. Semiconductor and artificial intelligence stocks had sold off sharply as investors questioned high valuations and reacted to new competition from China’s AI sector. Bitcoin fell below $64,000 as the technology selloff spread across global risk assets.
Buyers returned to many of those stocks on Tuesday. Samsung Electronics, SK Hynix and Taiwan Semiconductor recovered alongside broader Asian benchmarks. BTC moved with the improved market mood and briefly reached its highest level in roughly two weeks. The move continued a recovery from the June low area near $58,000 to $60,000.
Oil also offered some support to risk markets. Brent crude fell about 1% toward $88 after reports that mediators had proposed a 10-day ceasefire between the U.S. and Iran. Fighting remains active and no agreement has been confirmed, but the pullback in oil eased some pressure from the previous two sessions.
Five-day ETF inflow streak supports recovery
U.S.-listed spot Bitcoin ETFs have also turned positive after a difficult stretch of withdrawals. According to SoSoValue data, the funds attracted $226.9 million on Monday, extending net inflows to five consecutive sessions and bringing the total across the streak to about $727.3 million.
The return of ETF demand follows heavy selling earlier in the summer. More than $4 billion left U.S. spot Bitcoin ETFs during June, while a 13-session outflow streak between May and early June removed roughly $4.37 billion. The recent shift therefore marks a clear change from the sustained redemptions that weighed on the market.
Institutional flows have not been the only source of accumulation. Large Bitcoin wallets accumulated about 270,000 BTC worth roughly $16.7 billion during a period when ETFs were recording heavy withdrawals. That divergence placed more attention on whether renewed ETF buying could add another source of demand during the recovery.
Bitcoin indicators improve as $70,000 becomes next test
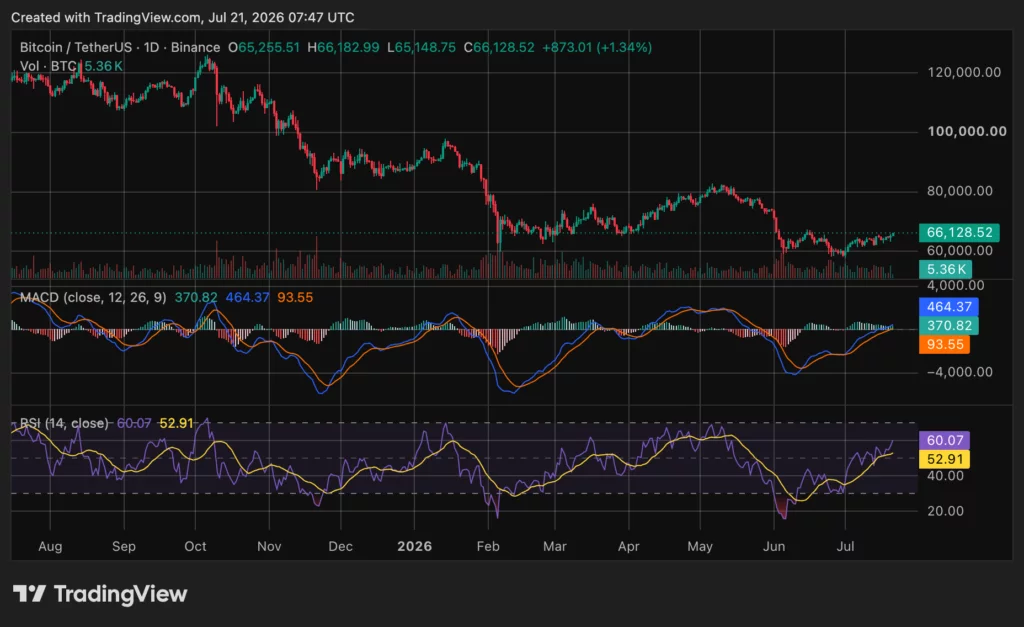
Bitcoin’s daily chart shows stronger short-term momentum after the recovery from its June lows. The chart data supplied with the market update places the MACD line near 464.37, above the signal line at about 93.55, while the histogram remains positive around 370.82. That structure shows that buying momentum has strengthened from the previous downside phase.
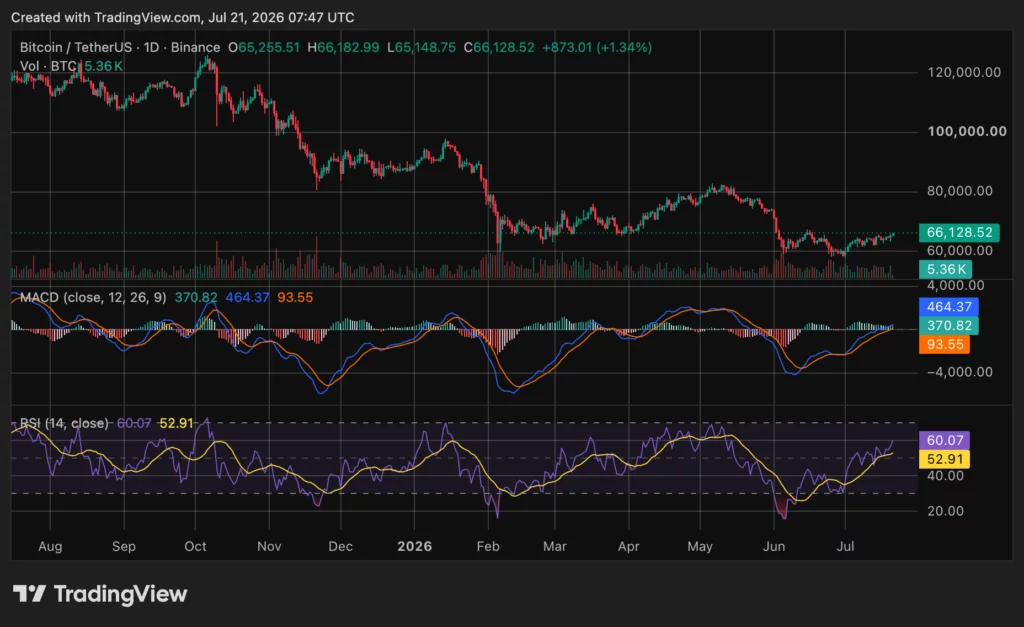
The RSI also supports the short-term recovery. It stands near 60.07, above its moving average around 52.91 and above the neutral 50 mark. However, the indicator remains below traditional overbought levels. Holding above $65,000 would keep the current recovery structure intact, while the $70,000 area represents the next closely watched test for buyers.
Onchain data offers another view of BTC’s position within its broader market cycle. According to crypto market intelligence platform Alphractal, its four-year standardized MVRV model identifies readings below a Z-score of -1 as periods of severe historical undervaluation and potentially stronger windows for dollar-cost averaging. The firm argues that MVRV can help investors measure where Bitcoin’s market value sits relative to the prices at which coins last moved onchain.
That metric does not provide a short-term price forecast, and historical patterns do not guarantee future returns. However, it adds another data point as BTC attempts to rebuild momentum after falling sharply from its 2025 record above $126,000. Crypto.news currently places BTC about 48% below that peak.
Disclosure: This article does not represent investment advice. The content and materials featured on this page are for educational purposes only.

Ethereum’s price has joined the overall market rally on Tuesday, climbing above $1,900 for the second time in the past week. Naturally, analysts have rushed to offer their insight on why they believe the token will keep surging to new local (and all-time) highs.
Meanwhile, the former CEO of BitMEX has doubled down on his recent bullish behavior toward Ethereum with a fresh purchase.
Hayes Buys Again
Data shared by Lookonchain showed earlier today that wallets linked to the famous crypto personality spent over $2.5 million to acquire 1,332.5 ETH. This is Hayes’ second multi-million-dollar Ethereum accumulation made in the past week. As reported on July 16, he bought 1,293 ETH for the same amount when the asset’s price traded above $1,900 for the first time in months.
Interestingly, that purchase came shortly after he had sold over $10 million worth of the largest altcoin at prices of just under $1,700. As such, he continues to acquire more ETH tokens when the asset rallies, but tends to dispose of them once it corrects.
Arthur Hayes(@CryptoHayes) bought another 1,332.5 $ETH($2.53M) 3 hours ago.https://t.co/gau6egd7Vmhttps://t.co/iKDlaSftbq pic.twitter.com/YKgXPCVe2Z
— Lookonchain (@lookonchain) July 20, 2026
Separately, Lookonchain added that Ethereum whales have gone on a substantial accumulation spree as well. This one purchased roughly $13.5 million worth of the asset. Another one spent $20 million to buy 10,501 ETH, and this one withdrew 12,800 ETH from Binance.
Major ETH Price Calls
As mentioned above, the second-largest cryptocurrency has jumped past $1,900, and analysts were quick to point out its potential. KALEO believes ETH will rise toward $2,300 within the next month, but it might dump even harder in September toward new multi-year lows of $1,200.
Crypto Patel noted that ETH is “trading where long-term wealth is often built.” The analyst pointed out the $1,200-$1,800 range as the accumulation zone, and outlined some massive targets between $10,000 and $20,000 for ETH during the next bull cycle.
Merlijn The Trader outlined a similar development from 2017 that drove the asset toward new highs at the time. He added that those who had given up on ETH are “about to learn why the last holders won in 2017.” His analysis focuses mostly on ETH’s movements against BTC, noting that a surge past 0.029 would solidify the setup, but a dump below 0.026 would invalidate it.
EVERYONE WHO GAVE UP ON ETHEREUM THIS CYCLE IS ABOUT TO LEARN WHY THE LAST HOLDERS WON IN 2017.
2015–2018: accumulation, then a multi-year falling wedge. The breakout went vertical to 0.14.
2018–2025: the same two phases, stretched over 8 years. Accumulation bowl. Then the… pic.twitter.com/BSi769Y0jl
— Merlijn The Trader (@MerlijnTrader) July 20, 2026
The post Arthur Hayes Buys More ETH as Analysts Eye $2.3K and Beyond appeared first on CryptoPotato.


US spot Bitcoin ETFs recorded $227 million in inflows as BTC climbed above $65,000, extending their longest winning streak since early May.

A chart analyst is warning that XRP’s recent bounce may be giving traders false confidence and has argued that the token is still in a long-term downtrend despite recovering from its recent lows.
His view challenges a growing group of traders calling for a breakout, with the next few weeks likely to determine whether the world’s sixth-largest cryptocurrency can build a stronger base or slip below $1.
Weekly Chart Still Points to Resistance
In a series of posts on X, XRP watcher ChartNerd said that traders should continue respecting the asset’s long-term trend rather than assuming a small recovery has changed the market structure.
He pointed out that bears have been in control since a 20-week and 50-week exponential moving average (EMA) death cross formed in January 2026. Further, he argued that a relief in May that stalled at the 20-week EMA before XRP fell from about $1.35 to near $1.00 confirmed that the moving average is still acting as resistance.
According to him, even if XRP rallies toward $1.29 or as high as $1.60, people should treat those levels as heavy resistance unless the price can move above them convincingly. The analyst added that in case the Ripple token hits $1.60 in late July or early August, it would strengthen the case that the recent move near $1.00 marked a local bottom.
However, if the asset doesn’t reach the 20-week EMA around $1.29 or gets rejected there, then “the drop below $1 could come sooner than expected.”
ChartNerd also pushed back against claims circulating on social media that XRP has already broken out of its downtrend dating back to July 2025. Responding to a bullish post from pseudonymous analyst Bird, who suggested that an explosive candle was due at any moment, he wrote that XRP was still inside its wedge pattern and below descending resistance.
He was equally dismissive of traders celebrating the asset’s latest move up and sarcastically questioned whether such a modest rise meant that XRP was now heading “vertical to $100 before EOY.” In another post, the market watcher argued that many of the accounts calling for a breakout today had made almost the same predictions when the token was trading around $2.40 in January, before the price eventually dropped to $1.00.
Mixed Signals Continue for XRP
XRP was trading at around $1.13 at the time of writing, up nearly 4% in the last 24 hours. It has also gained almost 6% over the past week but is still about 2% lower than where it was a month ago.
According to data from CoinGecko, the coin’s latest trading range has been between $1.08 and $1.14, showing that the price has yet to break decisively in either direction.
ChartNerd believes the charts are telling a simple story, which is that until XRP breaks above resistance levels that have contained the market for months, any rally should be looked at with caution rather than treated as confirmation that the downtrend has ended.
Still, there are quite a few beating the bullish drum, including EGRAG CRYPTO, who recently claimed that the asset could eventually move toward a $1 trillion market cap if historical patterns repeat. However, such a move would need much stronger market conditions and far greater investor demand than exists currently.
The post Relief Rally or Bull Trap? Why This Analyst Says XRP Is Heading Below $1 appeared first on CryptoPotato.


Anton Bukov, who co-founded decentralized exchange aggregator 1inch and, by his own account, led its protocol architecture and security, said the company fired him in late November and that he is now building a new infrastructure startup called Second Tier. 1inch disputes that he was fired. Bukov… Read the full story at The Defiant

Key takeaways
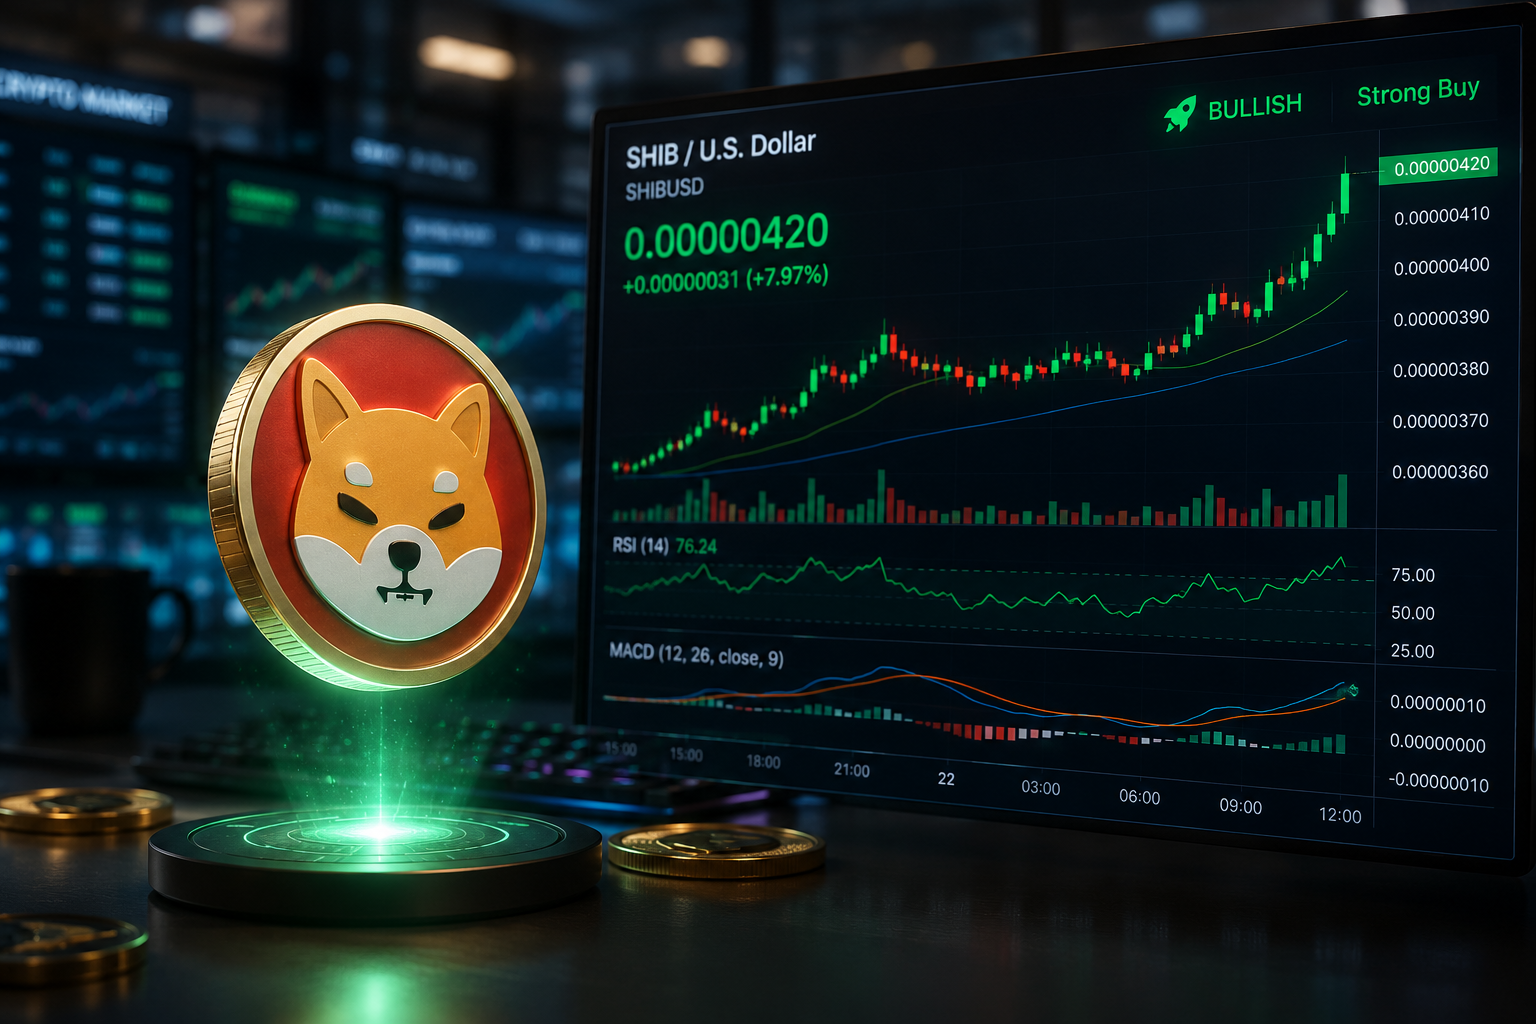
- Shiba Inu (SHIB) trades above $0.0000042 after breaking above a key descending trendline.
- Five consecutive days of exchange outflows suggest investors are moving SHIB into private wallets, reducing selling pressure.
- Derivatives data remains bullish, with positive funding rates and a long-to-short ratio favoring buyers.
Shiba Inu (SHIB) extended its recovery on Tuesday, trading above $0.0000042 after breaking above a long-standing descending trendline. Improving on-chain activity and strengthening derivatives data suggest bullish momentum is building, potentially setting the stage for further upside.
Exchange outflows point to reduced selling pressure
On-chain data from CryptoQuant indicates investors have been steadily moving SHIB off centralized exchanges, a trend often viewed as a positive signal for prices.
The platform’s exchange netflow data recorded five consecutive days of net outflows beginning on July 17, showing that more SHIB tokens are leaving exchanges than being deposited.
This pattern typically suggests investors are transferring tokens into private wallets for longer-term holding rather than preparing to sell, reducing immediate selling pressure in the market.
The continued decline in exchange balances could support SHIB’s ongoing recovery if buying demand remains steady.
Market positioning in the derivatives sector also points to improving confidence among traders.
According to CoinGlass, SHIB’s long-to-short ratio stood at 1.02 on Tuesday, indicating a slight preference for long positions over shorts and reflecting growing optimism that prices could continue moving higher.
Sentiment is further supported by funding rates. SHIB’s perpetual futures funding rate turned positive on July 17 and remained in bullish territory at 0.0103% on Tuesday.
Positive funding rates indicate that traders holding long positions are paying those with short positions, a sign that bullish bets currently outweigh bearish ones.
The combination of positive funding rates and a favorable long-to-short ratio suggests traders are increasingly positioning for additional gains.
Shiba Inu price outlook: Bulls target higher resistance
From a technical perspective, SHIB has improved its near-term outlook after breaking above a descending trendline that had capped price action since mid-May.
The breakout places the meme coin in a stronger position to extend its recovery if buying momentum continues.
The next major resistance lies around $0.0000045. A decisive close above this level could pave the way for a move toward the 50-day Exponential Moving Average (EMA), which is also positioned near $0.0000045.
Momentum indicators have also turned more constructive. The Relative Strength Index (RSI) has climbed to 54 and is moving towards the 60 level, signaling that bearish momentum is fading.

Meanwhile, the Moving Average Convergence Divergence (MACD) has produced a bullish crossover, with expanding green histogram bars reinforcing the improving technical outlook.
However, if the current recovery loses momentum and sellers regain control, SHIB could retreat toward its yearly low near $0.0000040, where buyers may attempt to defend the broader uptrend.
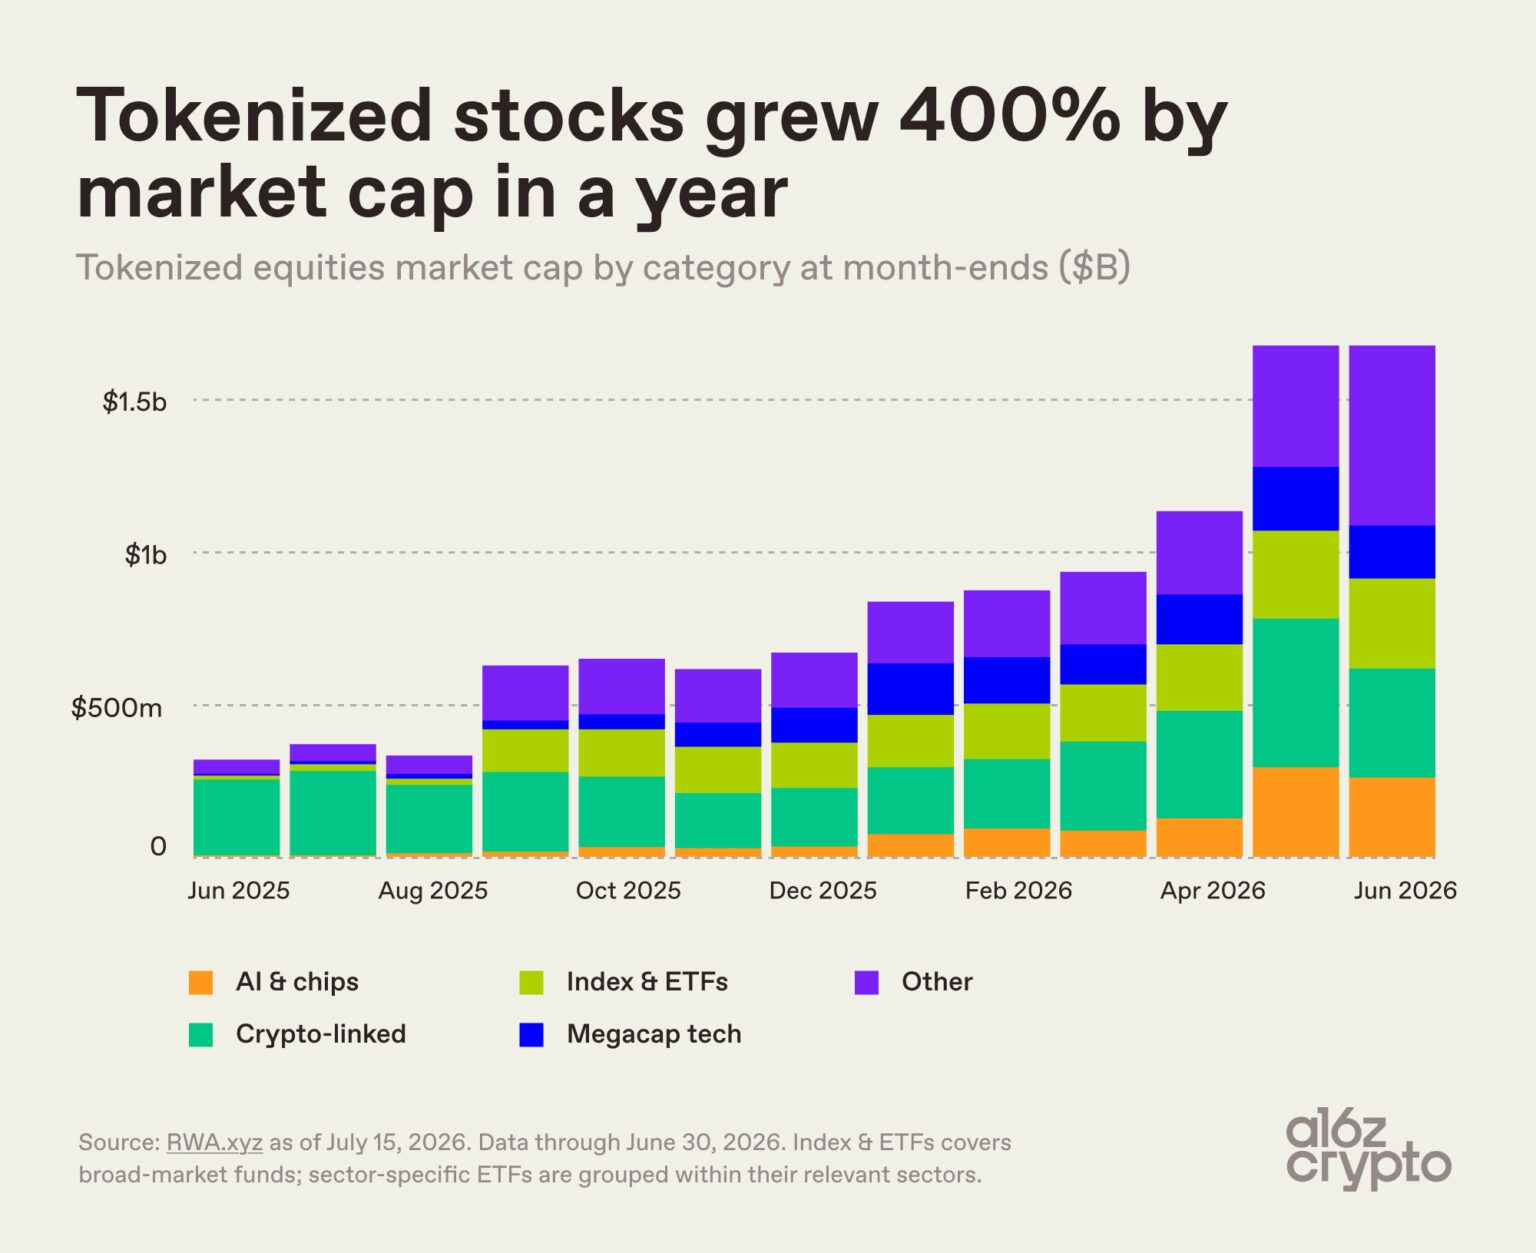
Tokenized stocks are no longer mostly a crypto trade. The crypto sector once dominated, but they now hold a shrinking share as artificial intelligence (AI) and chip stocks grow fastest.
The shift shows tokenization maturing beyond its origins. The market has now broadened to include semiconductor and memory makers tied to the AI boom.
Tokenized Stocks Market Grew 5x in a Year
Tokenized stocks reached $1.7 billion in market value by the end of June. That figure stood at just $329 million a year earlier, according to a16zcrypto data. The category has grown roughly fivefold over the past 12 months.
“This makes tokenized stocks one of the fastest-growing categories of tokenized assets,” the firm said.
Most of that growth came from new issuance, not price gains. More than half of the market sits in assets that were not on-chain a year ago. Real demand, therefore, is driving the expansion.
Follow us on X to get the latest news as it happens

The composition has also changed sharply. Crypto-linked products fell from 79% of market cap to 21%. Traditional equities absorbed the difference.
“They have lost the top spot to the “other” category — a long tail of hundreds of smaller listings — that now makes up 35% of the market, up from 15% a year earlier,” a16zcrypto noted.
Micron and SanDisk Top the Chip Tokens
The report highlighted that AI and chip stocks were the fastest-growing segment. They climbed from 0.3% of the tokenized stock market to 15.5% in one year.

Across major issuers, tokenized Micron’s (MU) combined market cap is about $120 million, and tokenized SanDisk’s (SNDK) is about $102 million. Both exceed the tokenized Nvidia (NVDA), with a combined market cap near $85 million, according to CoinGecko data.
The lineup leans toward memory and storage over compute. That pattern suggests traders want exposure across the AI hardware stack, not just the GPU makers.
The data marks a clear break from tokenization’s crypto-native roots. Whether traditional equities continue to gain share may hinge on continued issuance.
Subscribe to our YouTube channel to watch leaders and journalists provide expert insights
The post Tokenized Crypto Stocks Fell to 21% Share as Chip Names Climbed appeared first on BeInCrypto.
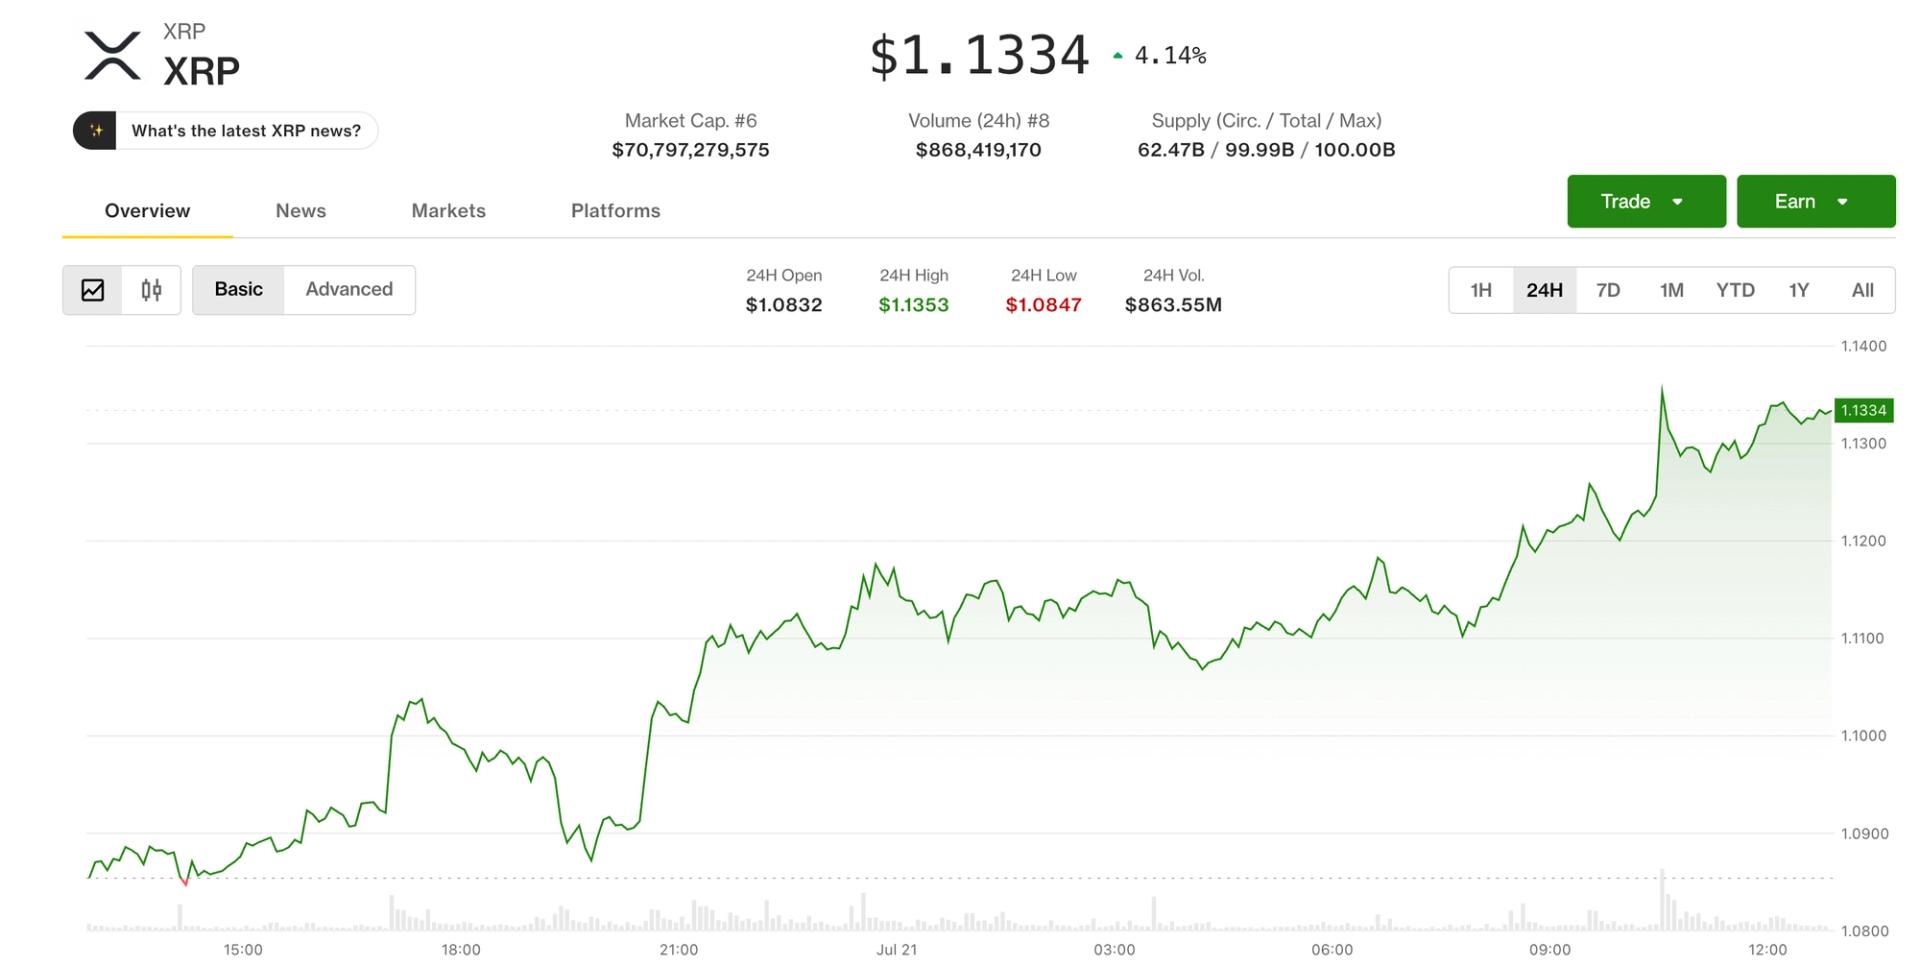
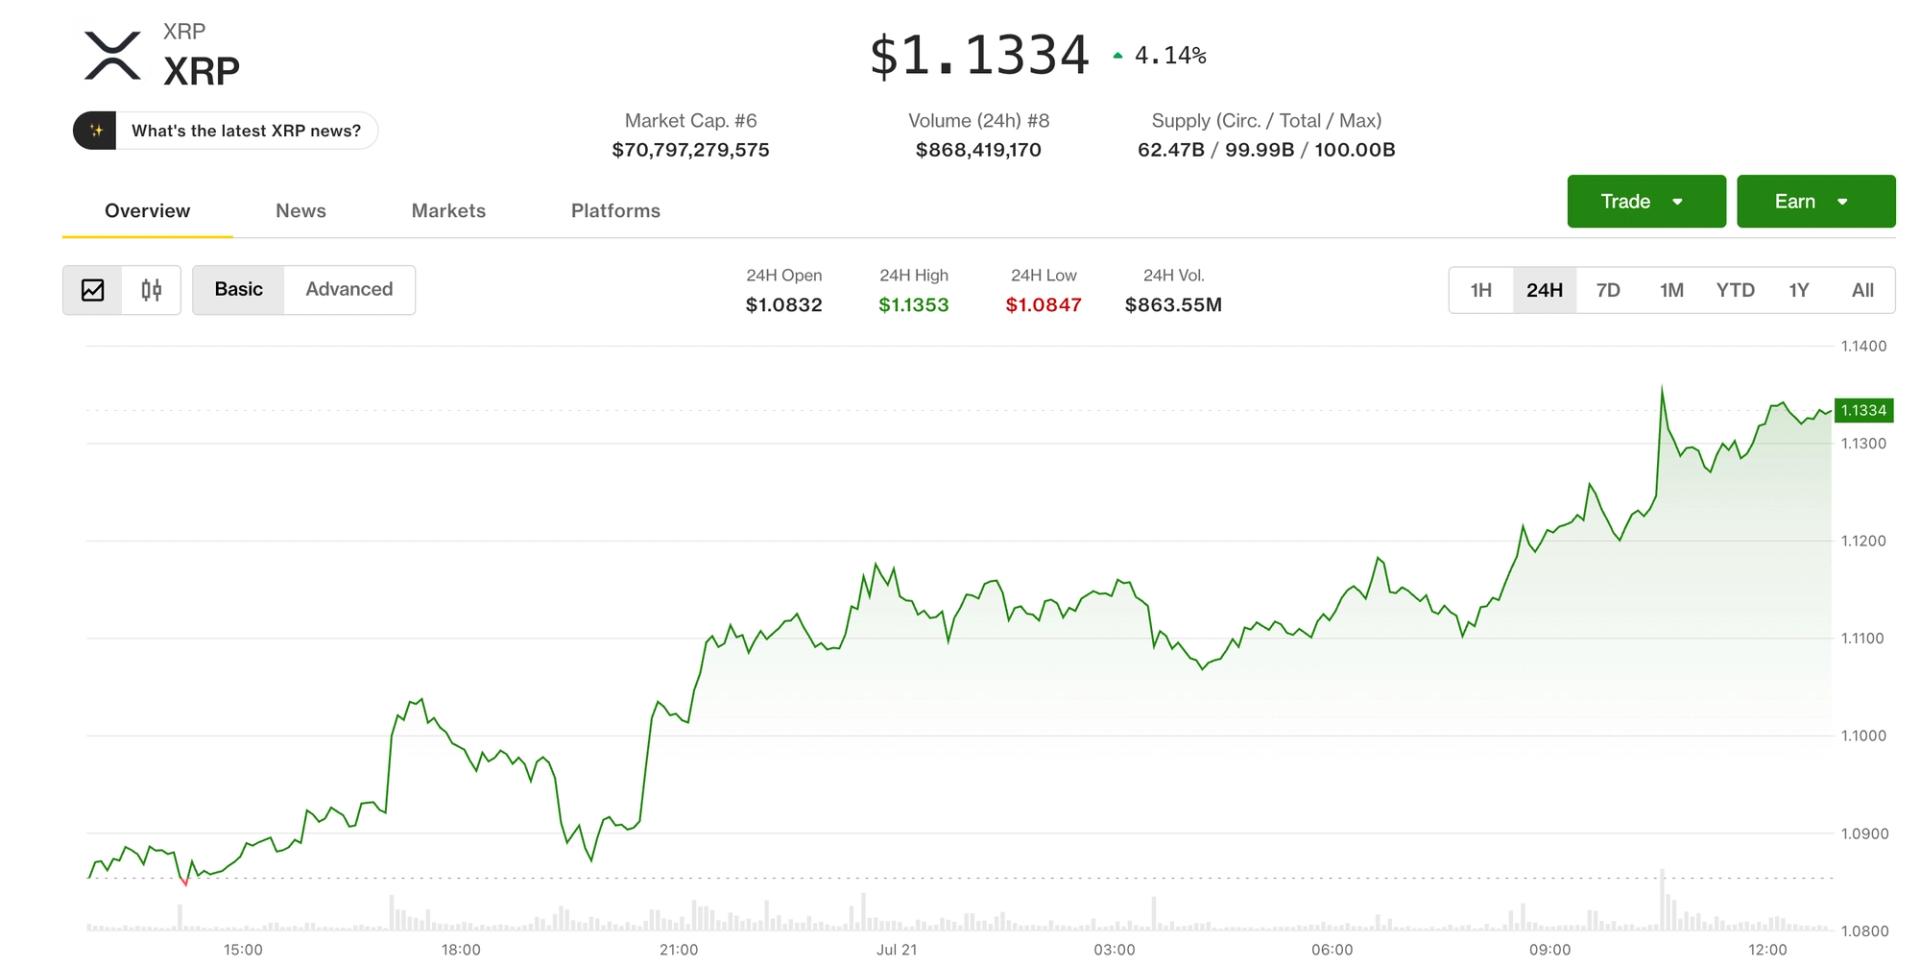
• Volume increased during the breakout attempt, with CoinGecko showing 24-hour trading volume of about $1.27 billion.
• XRP held above the $1.08-$1.10 area through the session, keeping the short-term recovery structure intact.
Technical Analysis
• The key short-term level is $1.13. A sustained break above it would confirm the triangle breakout watched by traders and bring $1.35 into focus.
• The hourly structure has tightened into a symmetrical triangle, with price compressing between lower highs and higher lows before the latest push higher.
• The daily chart remains more cautious. XRP is still trading inside a descending channel, with the 100-day and 200-day moving averages above price and sloping lower.
• The $1.24-$1.28 area remains the bigger resistance zone because it lines up with the channel’s upper boundary and major moving averages.
• Support remains strongest around $1.02-$1.06, where buyers have repeatedly stepped in over recent weeks.
What traders should watch
• $1.13 is the immediate breakout level. Holding above it would strengthen the short-term bullish setup.
• $1.14 is the next nearby level after marking the top of the latest 24-hour range.
• $1.24-$1.28 is the major resistance zone that XRP needs to clear before the daily chart turns meaningfully stronger.
• $1.02-$1.06 remains the key demand zone. Losing it would expose $0.88-$0.92.

Finance Ministry Asked RBI and SEBI to Regulate Crypto

Reserve Transparency Built Through Continuous Operation: Matrixdock Marks Two Years of Independent Verification
Nick Clegg’s former special advisor – when he was Lib Dem leader and Deputy Prime Minister – is charged with sexually assaulting a woman


-
 NewsBeat5 days ago
London Mayor Sadiq Khan handed a peerage by Keir Starmer alongside 15 other Labour figures… just days before the PM leaves No10
-

 Fashion4 days ago
Weekend Open Thread – Corporette.com
-

 Politics3 days ago
The House | The City of London can help the new chancellor deliver growth in every postcode
-

 Politics6 days ago
Young campaigners urge incoming PM to act on outdoor junk food ads
-

 Crypto World5 days ago
CFTC blocks Kalshi from unwinding Michigan trades after court order
-
 Crypto World4 days ago
Two July Windows Left: The CLARITY Act’s Senate Fight and What Failure Means
-
 Crypto World3 days ago
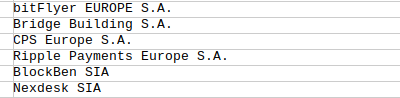
Ripple Payments Joins MiCA With 14 Firms, Does It Mean Anything For XRP?
-

 Business5 days ago
Nvidia Stock Slips After Big Tuesday Rally as Huang Confirms Vera Rubin Chip Is Now in Production Today
-

 Politics2 days ago
Democrats look to World Cup watch parties to register thousands of voters
-
 Entertainment6 days ago
Disney’s Most Ambitious Failed Star Wars Attraction Is Coming to SDCC
-

 Crypto World3 days ago
Ripple wins EU-wide access as ESMA adds it to MiCA register
-

 Crypto World4 days ago
Injective Submits SEC Transfer-Agent Registration to Onchain Ownership Records
-

 Business5 days ago
Palantir Shares Rise After Expanded Nvidia Partnership and Fresh Analyst Upgrades Ahead of Earnings Day
-
 Tech8 hours ago
Sail Virtually Aboard The “Itanic” With IA-64 Emulator
-
 Tech5 hours ago
Turtle Beach Command Series KB7 review: a nifty screen-equipped gaming keyboard
-

 Tech7 days ago
Dark Secrets Emerge When Jailbreaking LLMs
-

 News Videos7 days ago
XRP BOMBSHELL… XRP OMBOARDED FOR TRANSACTIONS!!!
-

 NewsBeat4 days ago
Registration is now open for March for Men with Kev 2026
-

 NewsBeat21 hours ago
Unregistered fitter used Gas Safe logo on business flyers
-
 Sports5 days ago
New Cornerback Enters Vikings Trade Rumor Mill
You must be logged in to post a comment Login