
Crypto World
BTC sitting just below an ‘air pocket’ above $72,000

Bitcoin’s “air pocket” is once again coming into focus as the largest cryptocurrency by market capitalization rose on Wednesday to just below $72,000.
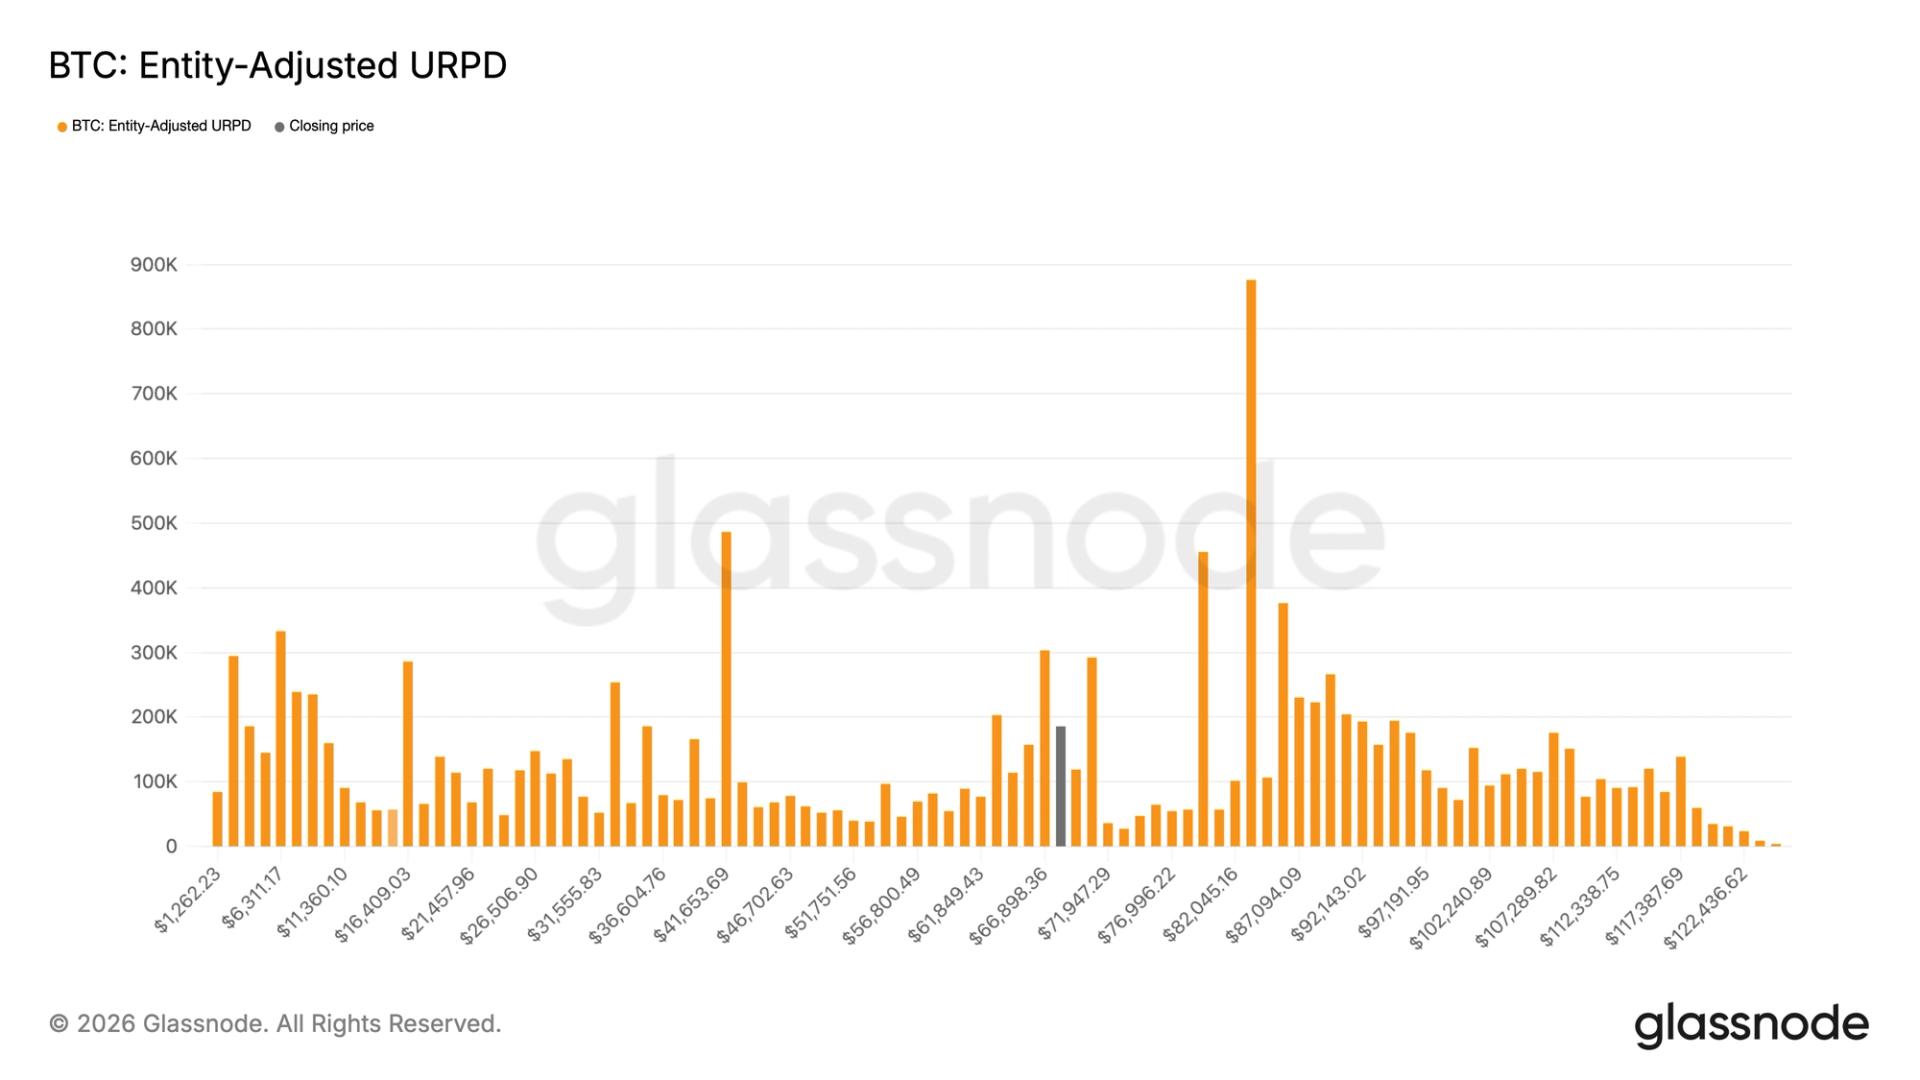
The air pocket refers to a thin area of supply between $72,000 and $80,000, where relatively few coins last changed hands, according to data from Glassnode.
Roughly just 1% of the circulating bitcoin supply sits within this range. Because so few holders established positions there, the market may encounter limited resistance if prices begin moving through the zone. In practical terms, that means if bitcoin pushes decisively above $72,000, the move toward $80,000 could occur relatively quickly.
Historically, bitcoin has spent very little time trading in $72,000 to $80,000 region. One instance came in November 2024, when prices surged rapidly after Donald Trump’s U.S. presidential election victory, quickly moving through the range without forming much trading volume.
A second example occurred earlier this year, when bitcoin fell from around $80,000 to $70,000 at the end of January, before sliding further to roughly $60,000 by Feb. 6, a decline that unfolded over just a few days.
The supply dynamics are visible through Glassnode’s Realized Price Distribution (URPD) metric. URPD shows the price levels at which the current set of unspent transaction outputs were last moved, effectively mapping where existing bitcoin holders acquired their coins.
CoinDesk Research notes that during bitcoin’s recent consolidation between $60,000 and $70,000, more than 400,000 BTC were accumulated, showing strong support below current levels.

Bitcoin (BTC) rose back above $71,000 during the early Asian trading hours on Wednesday after Trump’s administration offered a 15-point plan to Iran to end the war, sparking short-term optimism across risk assets.
Key takeaways:
-
Bitcoin bounces 4% to $71,500 after President Trump sent Iran a 15-point proposal aimed at ending the war.
-
Bitcoin faces stiff resistance above $72,000.
Bitcoin jumps 4% on ceasefire hopes
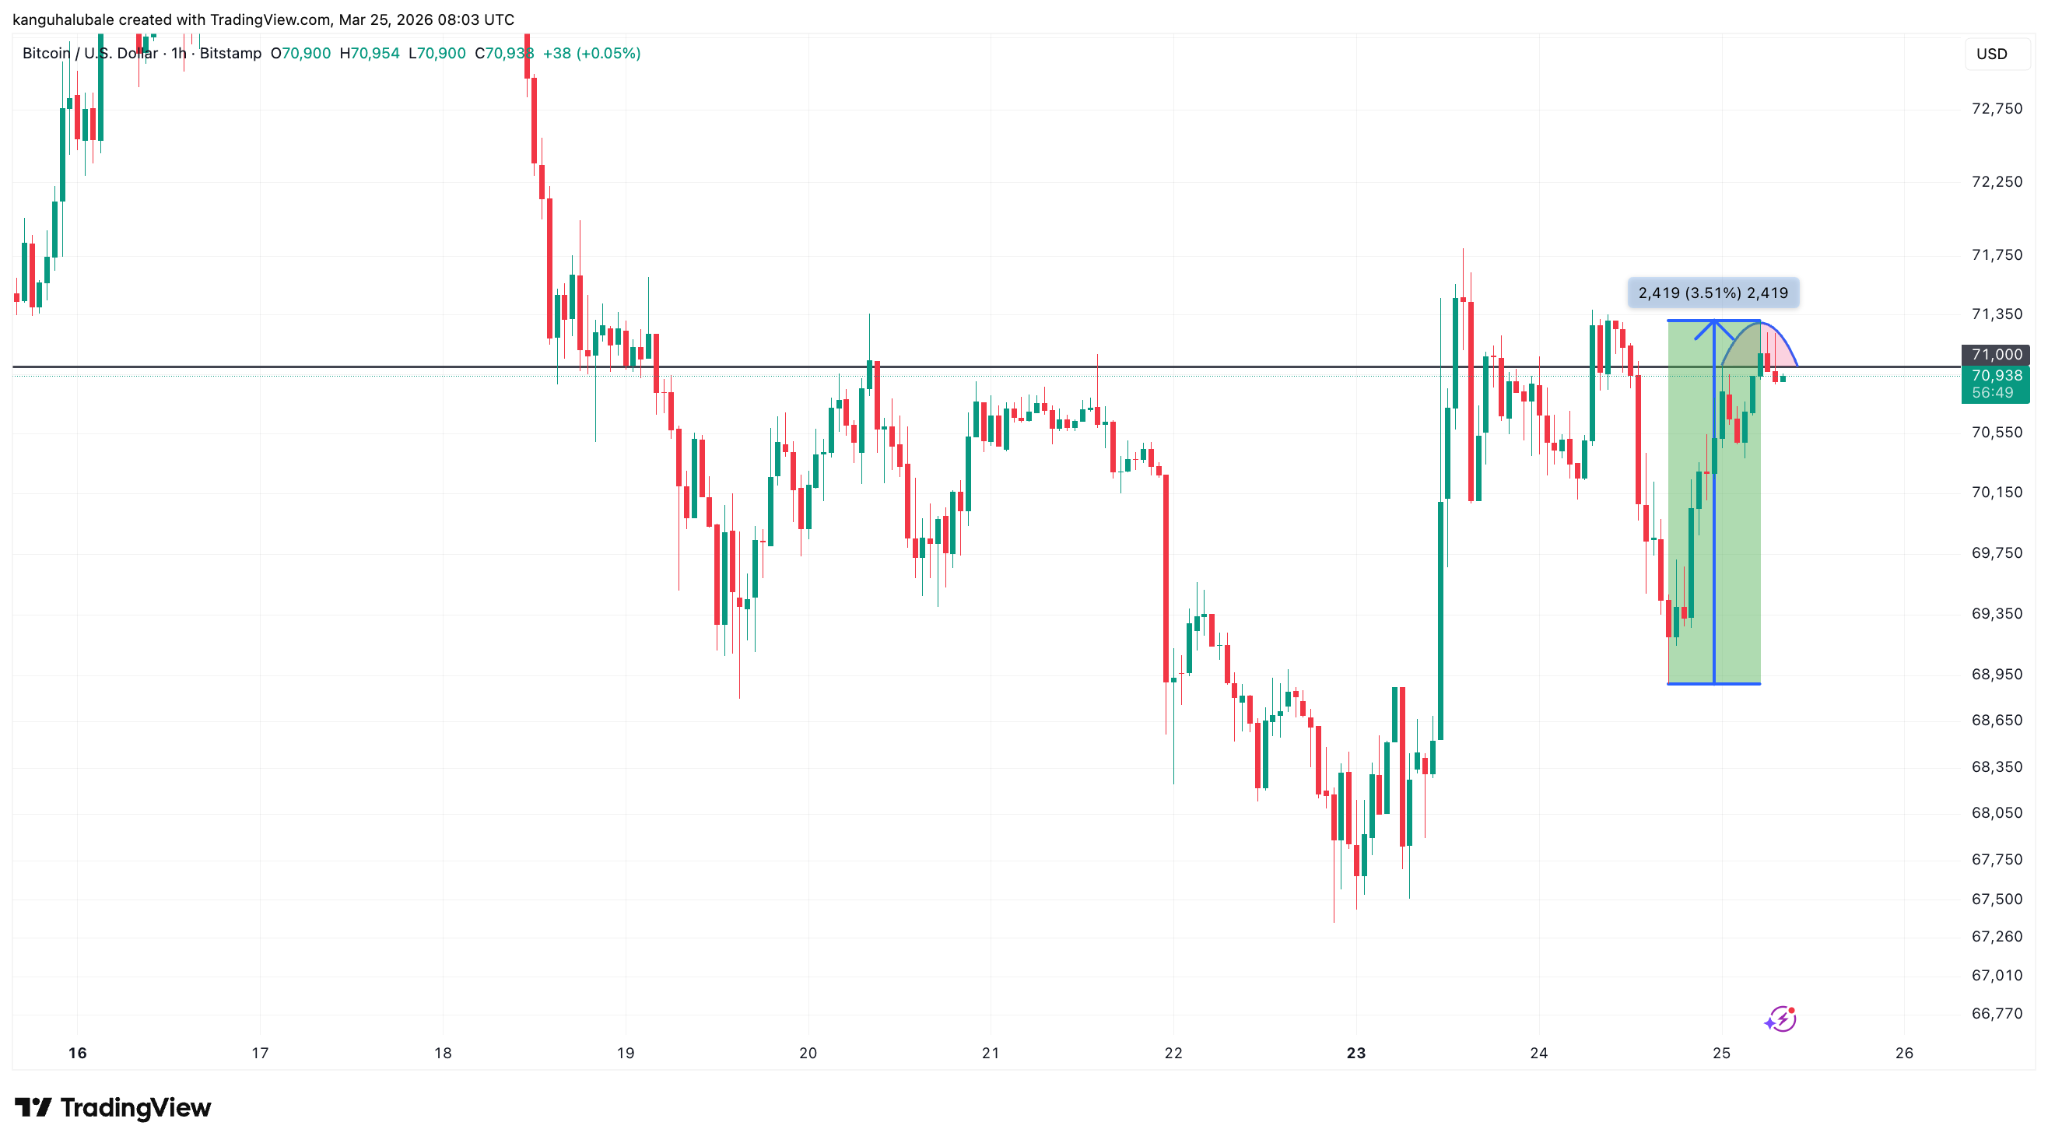
Data from TradingView showed BTC price rose as much as 4% to an intraday high of $71,300 from Tuesday’s low of $68,890, recouping all the losses incurred the day prior.

The price reacted to news that the US, through the primary intermediary Field Marshal Syed Asim Munir (Pakistan’s Chief of Army Staff), has sent Iran a 15-point plan aimed at ending the war.
The key elements of the plan include: a temporary ceasefire with calls on Iran to dismantle or severely limit its nuclear program, suspend its ballistic-missile work, and the full reopening of the Strait of Hormuz for safe maritime traffic.

Meanwhile, Iran continues to deny any ongoing talks as Trump delayed his self-imposed deadline for Tehran to reopen the Strait of Hormuz.
Following the news, WTI crude oil dropped 5.75% to $87 per barrel, while Brent crude shed 6% to trade at $98.

Gold extended yesterday’s gains, now up 2.53% on the day to trade at $4,561 at the time of writing.
This move eases inflation fears tied to disrupted shipping through the Strait of Hormuz, positively impacting risk assets, including Bitcoin.
Analysts noted the swift repricing, with Coinlore saying that Bitcoin is now acting as a “real-time sentiment instrument for global risk.”
CryptoQuant analyst Axel Adler Jr said that BTC will “likely remain headline-driven” until the US and Iran send a “public de-escalation signal.”
Bitcoin price faces “rough times ahead”
Despite the rebound, BTC’s upside appears to be capped at $72,000, where the 50-day exponential moving average (EMA) and the upper trend line of a symmetrical triangle converge.
A break above $72,000 would confirm a bullish breakout from the triangle, toward the measured target at $92,400, 30% above the current price.

Glassnode’s cost-basis distribution heatmap reveals concentrated supply and resistance between $72,000 and $74,000, where investors acquired roughly 380,000 BTC over the last 30 days. This indicates that sellers could aggressively defend this zone.

On the downside, a dense accumulation cluster sits around $65,000, where investors previously acquired 160,000 BTC.
This level coincides with the lower trend line of the symmetrical triangle, which, if lost, could trigger the next leg lower toward the bearish target of the triangle at $52,500.
Meanwhile, Capriole Investment’s Bitcoin Macro index has dropped to -1.37, levels seen at the depth of previous bear cycles.
The chart below shows that the metric historically spends a year at or below these valuations before recovering.
“Bitcoin Macro index is in the value zone,” Capriole Investments founder Charles Edwards said in an X post on Wednesday, adding:
“In all prior instances, price went lower into deeper value first before recovering, suggesting we may have more rough times ahead first.”

As Cointelegraph reported, traders warn of a second bear flag breakdown that could clear the path for another sell-off below $50,000.
This article does not contain investment advice or recommendations. Every investment and trading move involves risk, and readers should conduct their own research when making a decision. While we strive to provide accurate and timely information, Cointelegraph does not guarantee the accuracy, completeness, or reliability of any information in this article. This article may contain forward-looking statements that are subject to risks and uncertainties. Cointelegraph will not be liable for any loss or damage arising from your reliance on this information.


The Commodity Futures Trading Commission (CFTC) authorized a specialized Innovation Task Force on Tuesday to overhaul CFTC crypto regulatory frameworks for crypto, artificial intelligence, and prediction markets.
This initiative marks the first concrete step by Chair Michael Selig to transition U.S. derivatives oversight from an enforcement-based regime to a structured compliance pathway for decentralized protocols.
The move explicitly targets the regulatory gray zones that have pushed the majority of derivatives volume offshore.
- Task Force Scope: The new unit will develop specific regulatory approaches for three distinct verticals: crypto assets, AI integration, and prediction markets.
- Leadership: Michael Passalacqua, a former Simpson Thacher attorney, leads the effort as senior adviser to the Chair.
- Market Goal: The initiative aims to create a direct channel for “builders” to negotiate compliance frameworks rather than waiting for subpoenas.
The Mandate: From Litigation to Rulemaking
The strategy is a pivot away from the regulation-by-enforcement tactics that defined the previous administration. Michael Passalacqua, appointed in January, will direct the task force to work alongside the Innovation Advisory Committee. The objective is to define how code-based intermediaries can function within the Commodity Exchange Act.
“The idea behind our innovation advisory task force is really to create a space where innovators and builders can come in and talk to the staff,” Selig told attendees at the Digital Asset Summit in New York.
He was specific about the targets: “It’s not just crypto,” it’s going to be prediction markets, crypto, and AI. We think these three verticals are really important.”
This follows the precedent set by the joint CFTC-SEC interpretation regarding asset classification. The task force is expected to operationalize those high-level definitions into clearing and settlement rules. This creates the necessary legal ground for platforms like EDX Markets to launch perpetual futures without the looming threat of reclassification.
The inclusion of prediction markets is particularly notable. While venues like Kalshi have fought expensive court battles to list event contracts, the new task force suggests a move toward a generalized framework for event derivatives. This would standardize the rules for hedging political or economic outcomes, removing the case-by-case approval bottleneck.
The Liquidity Bifurcation: Onshore vs. Offshore
The market is already split.
US institutional capital is trapped in inefficient spot structures while price discovery happens on high-velocity offshore perpetuals. Hyperliquid’s record-breaking open interest proves traders prefer the capital efficiency of decentralized derivatives over rigid legacy infrastructure.
That volume exists with or without US approval.
The CFTC’s challenge is simple. Capture it or lose it permanently.
The task force adapts the definition of a Futures Commission Merchant to include smart contract code. Protocols register directly. Massive DeFi volume comes under US surveillance and the liquidity stays onshore.
Or the CFTC enforces bank-like capital requirements on software developers. Innovation gets banned. US builders geofence their own products. Asia captures the upside.
The global pressure is real. Circle is already pushing the EU to ease thresholds for its own market frameworks. The US is not competing against a slow-moving bureaucracy anymore. It is competing against jurisdictions actively writing code-compatible laws right now.
The technology is ready. The regulator is finally catching up.
Discover: The 14 Best Cryptos to Buy Now
The post CFTC Chief Launches Innovation Task Force Targeting Crypto Derivatives Framework appeared first on Cryptonews.
XRP (XRP) traded near $1.4 on March 25 as the token moved in a narrow range and stayed close to recent support.
Summary
- XRP traded near $1.4 as whale wallets added 40 million tokens during continued market consolidation.
- March turned into XRP ETFs first net outflow month after strong inflows since their debut.
- Ripple advanced its RLUSD trade pilot in Singapore while XRP stayed pinned near support levels.
XRP traded at $1.42 at press time, with a 24-hour trading volume of $2.1 billion. The token was up slightly on the day but remained down almost 7% over the past week. Its market capitalization stood at about $87.2 billion, based on a circulating supply of 61 billion XRP.
The token moved in line with the broader crypto market, with no major XRP-specific event driving price in the session. XRP stayed near $1.41 as buyers and sellers failed to take control, leaving the asset compressed between support and resistance.
Onchain data showed whale wallets added about 40 million XRP over the past week. The buying came during a consolidation phase and suggested that some large holders were accumulating while the market remained uncertain.
At the same time, some analysts warned that XRP could still move lower before any trend reversal takes shape. Crypto analyst Casi said,
“After over a month of rejection at resistance, it’s far more likely XRP needs lower support ($1.09 / $0.87) before any real trend shift happens.”
The analyst said XRP is trading within an ABC sub-wave inside a larger Wave 2 structure, with Wave 3 possibly bringing deeper losses before a recovery attempt begins.
XRP ETF flows turn negative in March
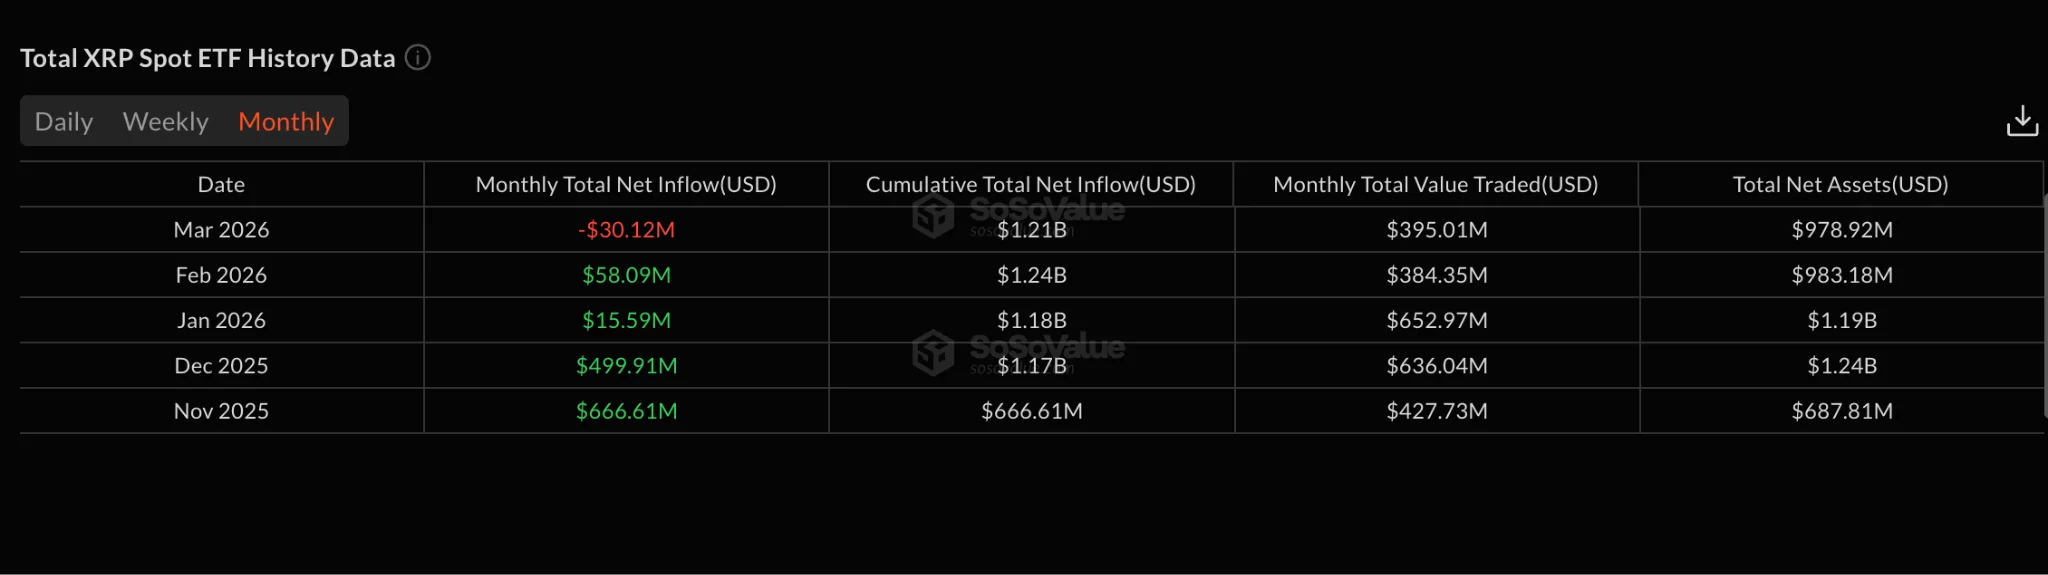
March 2026 became XRP’s first net outflow month since spot ETFs launched in late 2025, based on SoSoValue data. XRP spot ETFs recorded net outflows of $30.12 million during the month, reversing the strong pace seen after launch.

The monthly trend showed a sharp slowdown in demand. XRP ETFs posted $666 million in net inflows in November 2025, followed by $499 million in December. January dropped to $15 million, while February recovered to $58 million before March turned negative. The products had also gone 35 straight trading days without an outflow before that streak ended.
Elsewhere, while XRP price stayed under pressure, Ripple continued to push its payments business forward. As previously reported, the company said it is working with supply chain finance firm Unloq to test a trade finance model on the XRP Ledger through BLOOM, a sandbox run by the Monetary Authority of Singapore.
Disclosure: This article does not represent investment advice. The content and materials featured on this page are for educational purposes only.

European Central Bank Executive Board member Piero Cipollone said on Tuesday that the ECB expects by this summer to announce the European standards it will use for a potential digital euro, a step aimed at helping payment providers and merchants prepare their systems ahead of any issuance decision.
Cipollone told European Union lawmakers that, once those standards are announced, the ECB will work with market participants so they can begin embedding them into payment terminals and other solutions as soon as possible.
Cipollone said finalizing the rulebook would let new terminals and payment apps ship with the necessary rails already embedded, giving European companies a head start once EU legislation is in place, which the ECB expects to happen in 2026.
The ECB’s digital euro pilot, for which it opened a call for licensed payment service providers earlier in March, will run for 12 months from the second half of 2027, Cipollone said, testing person-to-person and point-of-sale payments in a controlled environment as part of plans to be technically ready for a possible issuance around 2029 if lawmakers sign off on the legal framework.

ECB says costs should be weighed
Earlier ECB analysis estimated that a digital euro could cost EU banks 4-6 billion euros over four years, an amount the central bank described as roughly 3% of their annual information technology maintenance budget, Reuters reported in February. Cipollone told lawmakers those costs should be weighed against the long-term benefits of keeping more merchant fees and scaling European payment schemes.
Cipollone reiterated that the digital euro is conceived as a public payments infrastructure that private intermediaries such as banks and payment service providers would use to offer wallets and services, rather than a direct-to-consumer product from the ECB.
He said the goal is to provide pan-European rails that reduce dependence on international card schemes, with co-badged cards and bank wallets able to switch between domestic schemes and the digital euro across the euro area.
Related: How euro stablecoins could address EU’s dollar concerns
Cipollone said the digital euro is meant to complement cash and bank deposits rather than replace them and highlighted that accessibility features, such as voice commands and large-font displays, are being built into the reference app design from the outset to ensure inclusivity.
He also said that the ECB wants central bank money to remain the “anchor” for future wholesale markets, pointing to its Pontes project, which tests settling tokenized securities in central bank money across different distributed ledger technology platforms, and its Appia roadmap for a tokenized European financial ecosystem.
In a separate speech on Monday, he outlined how tokenized central bank money could serve as the settlement asset for stablecoins and tokenized deposits.
Magazine: Bitcoin’s ‘biggest bull catalyst’ would be Saylor’s liquidation — Santiment founder
Crypto World
United Parcel Service (UPS) Stock: $100M Taiwan Facility Targets Semiconductor Logistics

Key Highlights
- United Parcel Service inaugurated a $100 million distribution facility in Taoyuan, Taiwan — marking its biggest Asia Pacific investment
- The facility sits adjacent to Taiwan’s primary international airport, optimized for technology-related shipments
- Approximately 80% of cargo flowing through the center consists of high-technology products
- Applied Materials (AMAT) has designated this location as its primary Asian distribution point
- The company is exploring potential flight operations to Kaohsiung, near TSMC’s emerging manufacturing complex
United Parcel Service (UPS) has inaugurated a state-of-the-art $100 million distribution facility in Taoyuan, Taiwan, representing the company’s most significant infrastructure investment across the Asia Pacific region. This strategic facility aims to support surging requirements from technology manufacturers, especially within Taiwan’s globally dominant semiconductor sector.
United Parcel Service, Inc., UPS
Positioned strategically adjacent to Taiwan’s busiest international airport, the Taoyuan location offers optimal access for time-sensitive, high-value technology shipments. According to Lauren Zhao, who leads UPS Asia Pacific Supply Chain Solutions and Freight Forwarding operations, approximately 80% of cargo processed through this facility falls within the high-technology category.
Applied Materials (AMAT), America’s leading semiconductor equipment manufacturer, has selected this facility to serve as its central Asian distribution hub. Shares of AMAT climbed 3.37% following the announcement.
“Taiwan’s semiconductor sector stands unrivaled globally in terms of technological advancement,” Zhao stated during the facility’s opening ceremony. She emphasized that manufacturing capabilities associated with this industry represent areas where Taiwan maintains worldwide leadership.
TSMC, recognized as the planet’s leading contract chipmaker, serves as a primary catalyst for regional logistics demand. The company’s processors are integral to AI infrastructure development occurring across the globe, establishing Taiwan as an indispensable link in international supply networks.
Southern Taiwan Expansion Under Review
Sam Hung, who directs UPS operations across Japan, South Korea, and Taiwan, revealed that the logistics provider is evaluating flight service expansion to Kaohsiung in Taiwan’s southern region. This potential expansion hinges on demonstrated client requirements.
Kaohsiung hosts TSMC’s ongoing construction of a substantial new manufacturing facility, forming part of an expanding semiconductor industrial zone in Taiwan’s southern territory. Should this industrial cluster develop as anticipated, UPS may find compelling business justification for establishing operations there.
The substantial $100 million capital commitment demonstrates the extent to which logistics infrastructure is being developed to support Taiwan’s chip manufacturing ecosystem. With TSMC functioning as the nexus of AI hardware supply chains, rapid movement of equipment and materials has emerged as a strategic imperative for companies like Applied Materials.
Strategic Partnership with Applied Materials
Applied Materials selecting the Taoyuan center as its Asian operational headquarters provides UPS with a foundational client deeply embedded in chip production. AMAT produces the sophisticated machinery that fabricates semiconductors — meaning its logistics requirements directly correlate with semiconductor manufacturing timelines.
The UPS installation enables both organizations to react more rapidly to fluctuations in chip production requirements throughout the region. Such responsiveness proves critical when equipment delivery delays can potentially halt entire fabrication operations.
Currently, UPS maintains operations exclusively through Taoyuan airport within Taiwan. The Kaohsiung service expansion remains under active evaluation as of March 25, 2026.

By Omkar Godbole (All times ET unless indicated otherwise)
Bitcoin and the broader crypto market are holding firm alongside U.S. stock futures as oil prices, bond yields and the Dollar Index ease on signs that ceasefire talks between the U.S. and Iran could begin as early as Thursday.
Still, nothing is confirmed, and it may be too soon to position for a full return to normalcy, according to some observers.
“We are not geopolitical experts, but we would have thought Iran would have maximum leverage of high energy prices going into any negotiation,” analysts at ING said. “Thus, it is probably too early to expect any big drop in energy prices or a much softer dollar this week.”
Skepticism remains on the Iranian side as well. According to Axios, officials have told Pakistan, Egypt and Turkey that recent U.S. military movements have deepened suspicions that Trump’s peace proposal may be just a ruse.
Macro conditions are also turning less supportive. The U.S. money market curve has now priced out any Fed easing this year, a sharp shift from earlier expectations of at least two 25-basis-point cuts, which were seen as a key bullish catalyst for BTC and other risk assets.
On the crypto front, the news flow hasn’t helped either. Circle Internet’s (CRCL) stock slid Tuesday after a leaked draft of the Clarity Act suggested limits on paying interest on idle stablecoin balances. Meanwhile, Arkham Intelligence reported that Bhutan may be selling roughly $30 million worth of BTC, with the government still holding 4,453 coins valued at about $315.9 million.
Despite these headwinds, bitcoin continues to hold above $70,000, with dips proving short-lived. A market that refuses to fall on negative news often signals underlying strength, potentially setting the stage for a larger move higher. Dynamics of bitcoin’s impending options expiry on Friday point to a potential for a bounce to $75,000. Stay alert!
Read more: For analysis of today’s activity in altcoins and derivatives, see Crypto Markets Today
What to Watch
For a more comprehensive list of events this week, see CoinDesk’s “Crypto Week Ahead“.
- Crypto
- Macro
- March 25, 8:30 a.m.: U.S. Import Prices MoM for February est. 0.2% (Prev. 0.2%); Export Prices MoM (Prev. 0.6%)
- Earnings (Estimates based on FactSet data)
Token Events
For a more comprehensive list of events this week, see CoinDesk’s “Crypto Week Ahead“.
- Governance votes & calls
- Unlocks
- March 25: Humanity (H) to unlock 4.19% of its circulating supply worth $10.1 million.
- Token Launches
Conferences
For a more comprehensive list of events this week, see CoinDesk’s “Crypto Week Ahead“.
Market Movements
- BTC is up 2.21% from 4 p.m. ET Tuesday at $71,509.33 (24hrs: +0.68%)
- ETH is up 2.99% at $2,184.78 (24hrs: +1.43%)
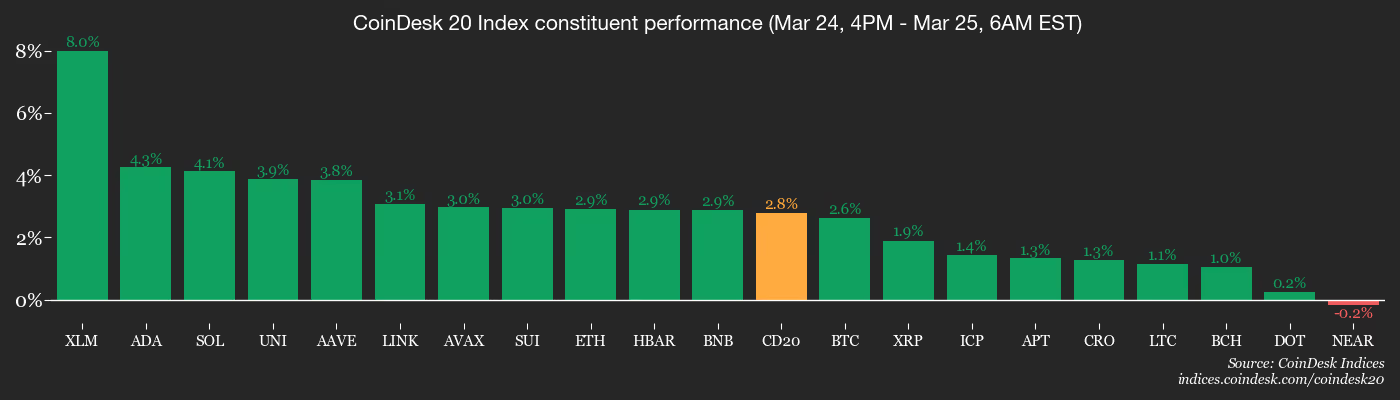
- CoinDesk 20 is up 2.73% at 2,065.01 (24hrs: +0.93%)
- Ether CESR Composite Staking Rate is down 7 bps at 2.74%
- BTC funding rate is at 0.0005% (0.4960% annualized) on Binance

- DXY is down 0.15% at 99.29
- Gold futures are up 3.13% at $4,536.90
- Silver futures are up 4.38% at $72.31
- Nikkei 225 closed up 2.87% at 53,749.62
- Hang Seng closed up 1.09% at 25,335.95
- FTSE 100 is up 0.85% at 10,049.44
- Euro Stoxx 50 is up 1.39% at 5,658.96
- DJIA closed on Tuesday down 0.18% at 46,124.06
- S&P 500 closed down 0.37% at 6,556.37
- Nasdaq Composite closed down 0.84% at 21,761.89
- S&P/TSX Composite closed up 0.18% at 31,941.59
- S&P Latin America 40 closed up 0.43% at 3,480.97
- U.S. 10-Year Treasury rate is up 6 bps at 4.39%
- E-mini S&P 500 futures are up 0.68% at 6,651.25
- E-mini Nasdaq-100 futures are up 0.86% at 24,422.75
- E-mini Dow Jones Industrial Average futures are up 0.67% at 46,727.00
Bitcoin Stats
- BTC Dominance: 58.97% (0.16%)
- Ether-bitcoin ratio: 0.03055 (-0.04%)
- Hashrate (seven-day moving average): 977 EH/s
- Hashprice (spot): $33.72
- Total fees: 2.5 BTC / $175,777
- CME Futures Open Interest: 116,345 BTC
- BTC priced in gold: 15.7 oz.
- BTC vs gold market cap: 4.77%
Technical Analysis

- The chart shows daily swings in the bitcoin-gold ratio since July last year.
- The ratio has bounced 23% this month, signaling bitcoin’s outperformance relative to gold.
- However, the broader bitcoin bear market is still intact and the ratio had yet to top the trendline representing the slide since August 2025.
Crypto Equities
- Coinbase Global (COIN): closed on Tuesday at $181.04 (-9.76%), +2.94% at $186.36 in pre-market
- MARA Holdings (MARA): closed at $8.25 (-7.41%), +3.52% at $8.54
- Riot Platforms (RIOT): closed at $14.33 (-0.28%), +2.72% at $14.72
- Core Scientific (CORZ): closed at $16.85 (+1.63%), +2.43% at $17.26
- CleanSpark (CLSK): closed at $9.58 (-4.01%), +2.61% at $9.83
- Exodus Movement, Inc. (EXOD): closed at $7.20 (-11.33%), +6.39% at $7.66
- CoinShares Bitcoin Mining ETF (WGMI): closed at $38.87 (-1.35%)
- Circle Internet Group (CRCL): closed at $101.17 (-20.11%), +3.04% at $104.25
- Bullish (BLSH): closed at $37.37 (-5.51%), +1.61% at $37.97
Crypto Treasury Companies
- Strategy (MSTR): closed at $136.25 (-1.41%), +2.97% at $140.29
- Sharplink (SBET): closed at $7.17 (-4.53%), +3.63% at $7.43
- Galaxy Digital (GLXY): closed at $21.30 (-1.84%), +2.58% at $21.85
- Strive Asset Management, LLC (ASST): closed at $9.93 (-4.89%), +2.01% at $10.13
- Upexi (UPXI): closed at $1.11 (-5.13%), +2.70% at $1.14
- Lite Strategy (LITS): closed at $1.20 (+1.69%)
ETF Flows
Spot BTC ETFs
- Daily net flows: -$66.6 million
- Cumulative net flows: $56.31 billion
- Total BTC holdings ~1.29 million
Spot ETH ETFs
- Daily net flows: -$40.7 million
- Cumulative net flows: $11.7 billion
- Total ETH holdings ~5.79 million
Source: Farside Investors
While You Were Sleeping

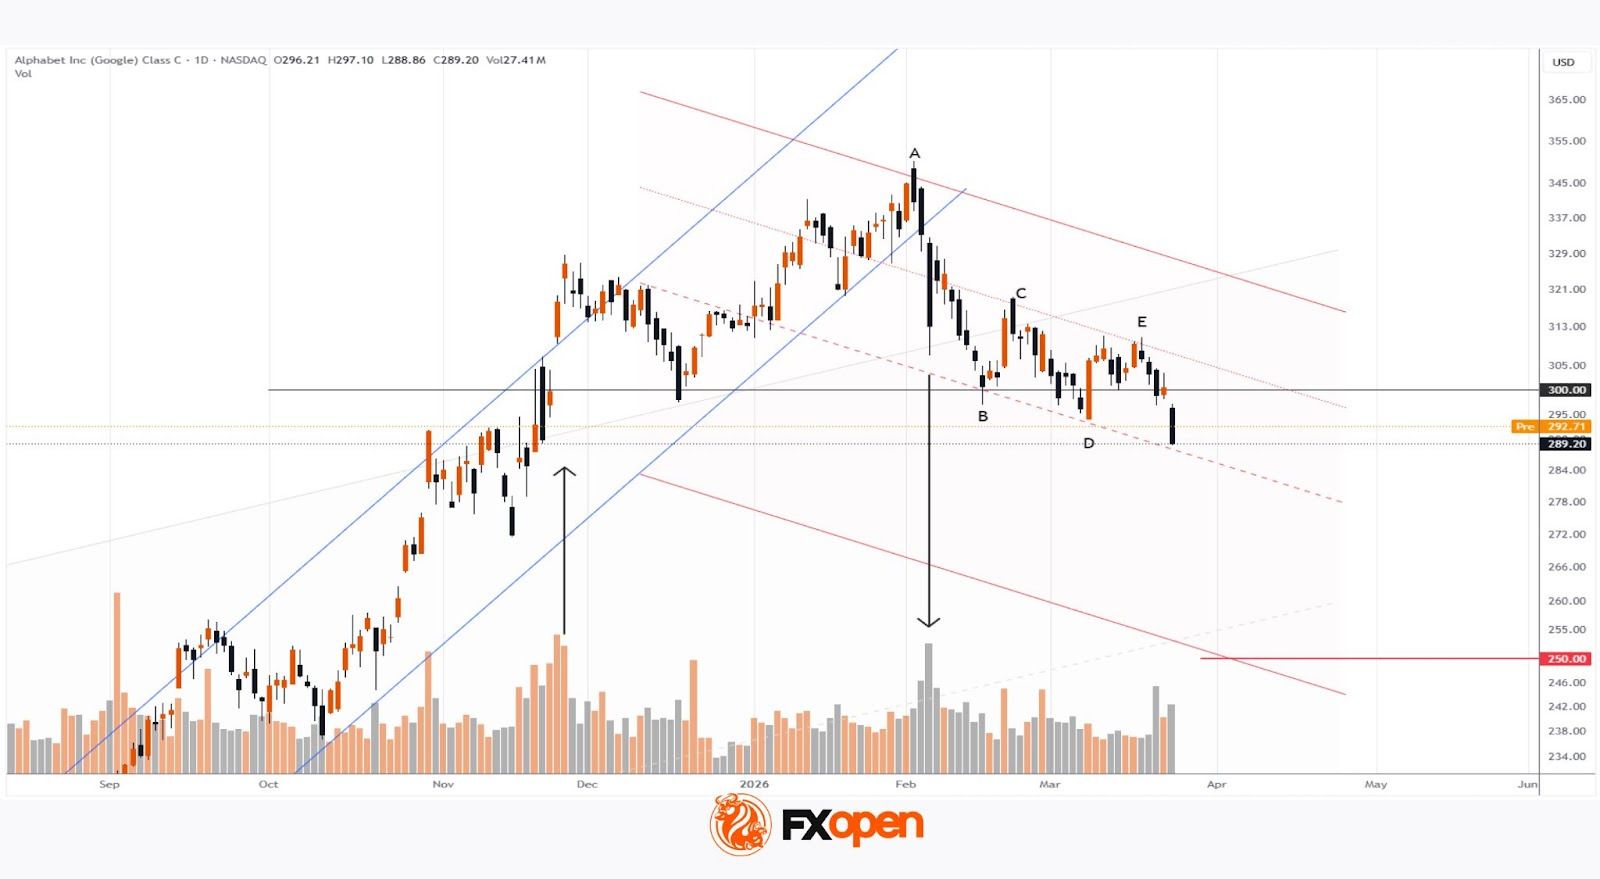
As the chart shows, Alphabet (GOOGL) shares have dropped to their lowest level of 2026, with trading closing well below the psychological $300 per share mark.
Why Have Alphabet (GOOGL) Shares Declined?
The bearish move is driven by a combination of factors, including:
→ Escalating geopolitical tensions. With the prospect of a prolonged US conflict with Iran becoming more relevant, market participants may be reducing exposure to risk assets, favouring stability instead. Technology stocks are particularly vulnerable in such an environment.
→ In March, it was reported that Alphabet plans to allocate $175–185 billion to AI infrastructure this year. These expenditures could weigh on profit margins, while a quick return on investment is far from guaranteed.
In addition, media reports point to pressure from antitrust regulators, downward revisions to price targets by analysts, and share sales by GOOGL executives. Meanwhile, the chart and volume analysis highlight a significant shift in market sentiment.
Technical Analysis of GOOGL Shares
Note the price behaviour during periods of exceptionally high trading volumes. The arrows indicate:
→ A move above the $300 psychological level accompanied by a bullish gap — a sign of emotional buying momentum that gradually faded.
→ A sharp decline in February on very high volumes, suggesting that bears attempted to seize control. The formation of lower highs and lower lows confirms their success.
Yesterday, GOOGL opened with a bearish gap and closed at the low of a wide candle — a clear sign that sellers are strengthening their grip.
Bulls need to regain control quickly; otherwise, if bearish dominance persists:
→ Alphabet (GOOGL) shares may continue to decline within the red descending channel;
→ The $300 level could act as psychological resistance during any recovery attempts;
→ A move towards the $250 level cannot be ruled out.
Buy and sell stocks of the world’s biggest publicly-listed companies with CFDs on FXOpen’s trading platform. Open your FXOpen account now or learn more about trading share CFDs with FXOpen.
This article represents the opinion of the Companies operating under the FXOpen brand only. It is not to be construed as an offer, solicitation, or recommendation with respect to products and services provided by the Companies operating under the FXOpen brand, nor is it to be considered financial advice.
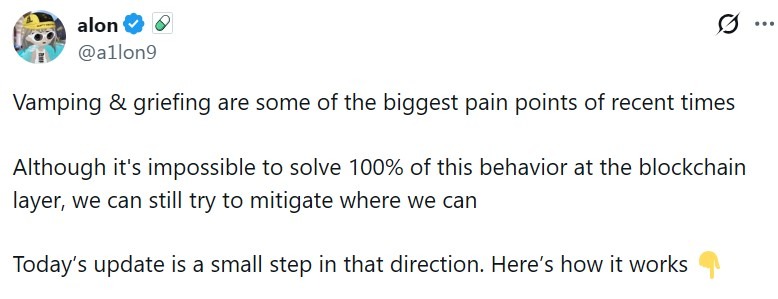
Memecoin launchpad Pump.fun introduced a new restriction on creator fee settings, limiting token deployers to a single post-launch change in how fees are distributed on the platform.
In a post on X, Pump.fun co-founder Alon Cohen said the update aims to reduce “griefing” — where creators alter fee recipients after a token gains traction — and other forms of manipulation tied to fee redirection, where token creators can alter who receives fees after a coin gains traction.
Under the change, each token will have one opportunity to redirect creator fees to a different wallet, after which the configuration becomes permanently locked.
Pump.fun’s latest update follows a broader overhaul announced in January, when the platform acknowledged that its creator-fee model had skewed incentives by disproportionately rewarding token deployers over traders.

Pump.fun’s broader attempts to shift incentives to traders
On Jan. 10, the platform introduced changes like multi-wallet distribution and post-launch controls, aiming to improve transparency and better align rewards with trading activity.
On Feb. 17, Pump.fun introduced “Cashback Coins,” requiring creators to choose at launch whether fees go to themselves or are redirected to traders, with that high-level model locked in once selected.
The change aimed to rebalance the distribution of rewards between token deployers and traders. However, while the overall fee model was fixed at launch, creators or coin admins could still adjust the specific wallets receiving those fees and how they were distributed after a token went live.
Related: ‘Hawk Tuah’ girl Haliey Welch says memecoin implosion ‘traumatized’ her
This meant that even if the model didn’t change, the underlying recipients could, creating potential trust issues for traders. The latest update narrows that flexibility by allowing only a single post-launch change to fee recipients, after which the configuration is permanently locked.
Early community reactions suggest the change may do little to address broader trading dynamics on the platform. X user gake said the change might not help much, while another user, tom, described it as a “drop in the bucket” that shows the team is at least acknowledging the issue.
Pump.fun activity drops as fees and volume fall year over year
Pump.fun’s shift in its incentive structure comes as its fees have declined from their peak. DefiLlama data shows that in January 2026, the platform recorded $31.8 million in fees, down about 75% from $148 million in January 2025, its best-performing month to date.
In February 2026, the platform recorded $25 million in revenue, down 66% from nearly $75 million in February 2025.

The platform’s trading volume has followed a similar pattern. According to DefiLlama, Pump.fun recorded monthly volume of over $11.6 billion in January 2025, which fell to about $2.1 billion in January 2026, a decline of roughly 81%.
In February 2026, monthly volume totaled about $1.91 billion, down 68% from $6.1 billion in February 2025.
Magazine: Animoca teams up with Ava Labs, Shrapnel on Steam: Web3 Gamer


Bhutan transferred more Bitcoin from a state-linked wallet on Wednesday, continuing a series of March outflows tied to its sovereign holdings.
Summary
- Bhutan moved 519.7 BTC on Wednesday, marking its third large sovereign wallet transfer this month.
- Arkham data showed Bhutan still held 4,453 BTC after the latest state-linked outflow this month.
- Bhutan continues expanding mining and reserve plans while trimming Bitcoin holdings through repeated March transfers.
Meanwhile, the latest move came as the country kept building its broader Bitcoin strategy through mining, infrastructure, and reserve planning. Arkham data showed that a Bhutan government-linked wallet moved about 519.7 BTC on Wednesday. The amount was worth about $36.7 million at the time of transfer. The funds went to two separate wallets.
Onchain Lens said one of the recipient wallets was linked to trading firm QCP Capital. The transfer added to market attention around Bhutan’s Bitcoin activity, as traders and analysts tracked movements from the country’s known sovereign wallet.
The latest transaction marked the third large Bitcoin move from the Bhutan-tagged wallet in March. It followed a $72 million transfer spread across six transactions in the 24 hours before March 18. The wallet also moved $11.8 million on March 9.
This recent pattern stood out against February activity. During that month, Bhutan moved just over 284 BTC. Arkham data showed the wallet still held 4,453 BTC worth around $315 million after the latest transfer. That total was down from more than 13,000 BTC recorded in October 2024.
As of March 12, Bhutan ranked as the fifth-largest country by Bitcoin holdings, based on an Arkham report. It trailed the United States government, the United Kingdom government, El Salvador, and the United Arab Emirates Royal Group.
The ranking kept Bhutan in focus because of its early and direct involvement in Bitcoin mining. Unlike many governments that acquired Bitcoin through seizures or law enforcement actions, Bhutan built part of its position through mining activity tied to state-backed operations.
Bitcoin strategy supports mining and development plans
Bhutan began adopting Bitcoin mining in 2019. Since then, it has developed mining operations powered by hydroelectric energy from its glacial river systems. The country has used its natural energy resources to support low-cost power generation for mining.
In May 2023, Bhutan’s sovereign wealth fund, Druk Holding and Investments, announced a $500 million partnership with Bitdeer to expand Bitcoin mining capacity. The strategy later expanded beyond mining. In December 2025, Bhutan said it would use part of its Bitcoin holdings to support construction in the Gelephu Mindfulness City.
That plan formed part of the country’s wider Bitcoin Development Pledge. On Jan. 8, 2026, Gelephu Mindfulness City also announced plans for a strategic crypto reserve that would include Bitcoin, Ether, and BNB. The latest wallet transfer came as Bhutan continued balancing asset movements with longer-term digital asset plans.
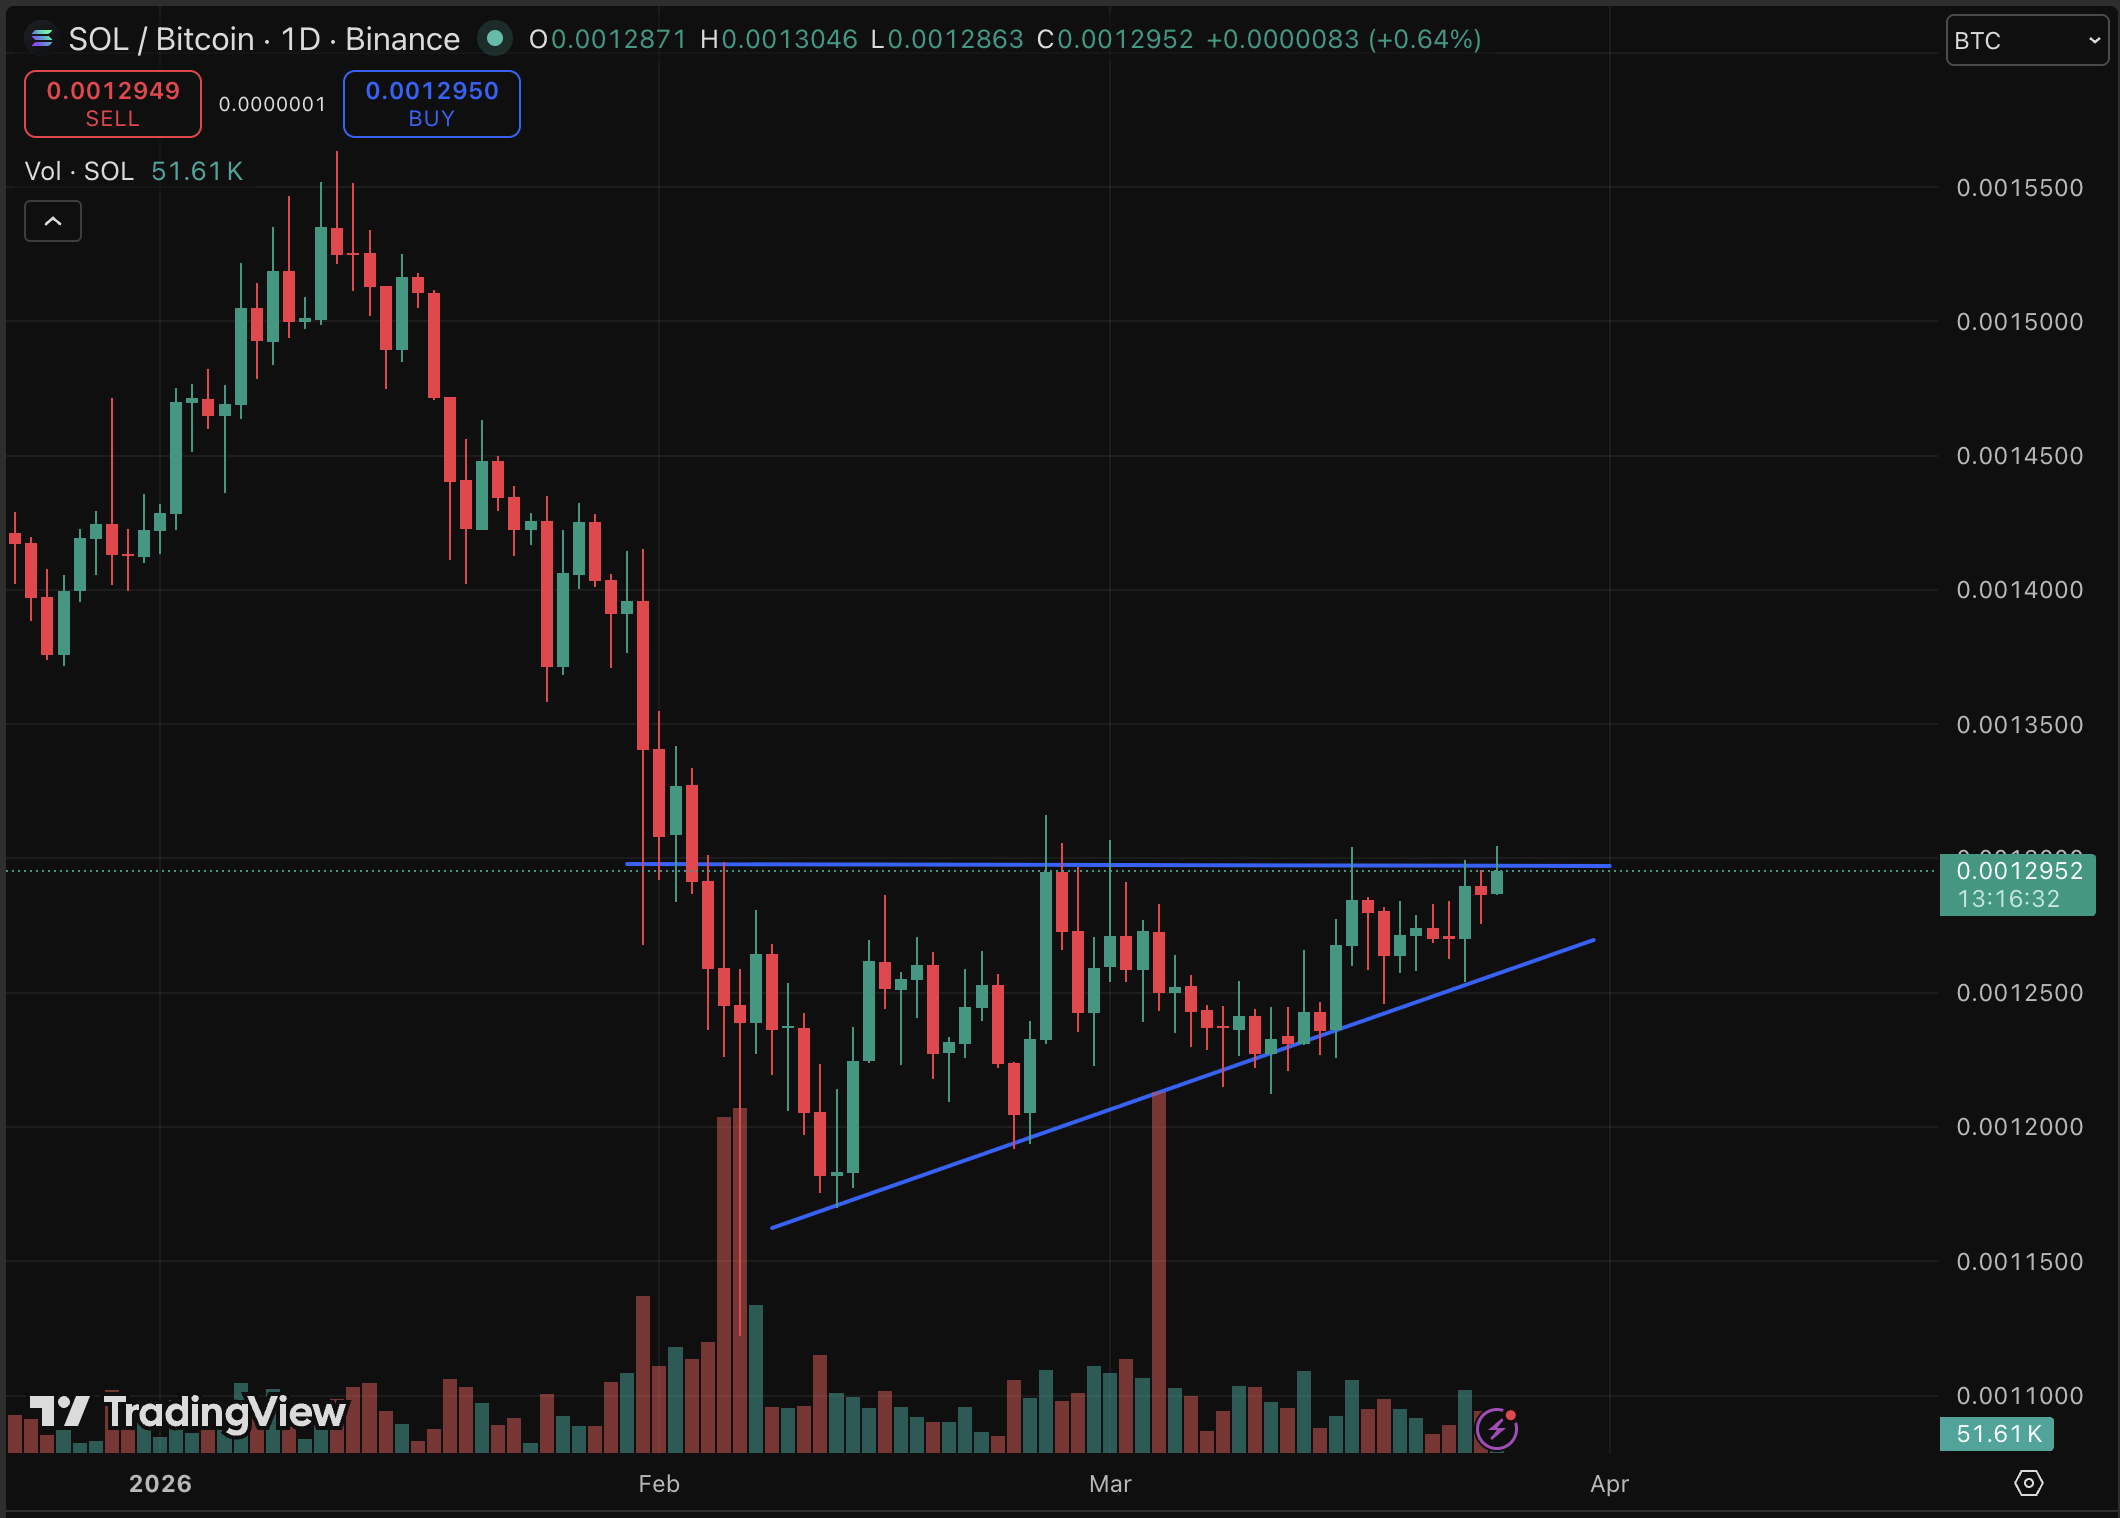
Solana price is fighting to hold crucial ground, currently trading between $90 and $ 93 as traders watch for a definitive directional move and a bullish prediction. Despite a sharp contraction in DEX volumes, technical structures against Bitcoin are flashing potential outperformance signals.
There is a tightening wedge pattern on the SOL/BTC pair, with the asset pushing against horizontal resistance while respecting a rising trendline. This setup, often a precursor to volatility, coincides with the anticipated Alpenglow consensus upgrade targeting sub-second finality. The market now faces a binary decision point: reclaim $100 or surrender the $80 psychological floor.

As liquidity rotates across the meme coin sector, Solana’s ability to maintain its position as the premier casino chain is under scrutiny due to contracting on-chain activity.
Discover: The best pre-launch token sales
Solana Price Prediction: Can SOL Reclaim $100 Before Month End?
The technical landscape for Solana remains precarious yet opportunistic. Currently hovering near $91, SOL faces immediate resistance at the Bollinger upper band of $92. A confirmed close above this level exposes the next targets at $98, effectively invalidating the bearish pressure accumulating since the January peak of $148.
Conversely, the downside carries significant risk; a head-and-shoulders pattern is also identified at 4 hours chart, and it suggests a breakdown below the $80 critical support could trigger a slide toward $59.

Momentum indicators offer little clarity, with the RSI oscillating between 51 and 55, a classic neutral consolidation signal. However, the SOL/BTC pairing tells a different story. A breakout attempt from a multi-month ascending triangle, suggesting capital may rotate back into Solana’s ecosystem if Bitcoin stabilizes above $72k.
Discover: The best crypto to diversify your portfolio with
Bitcoin Hyper Targets Early Mover Upside as Solana Tests Key Levels
While Solana battles strictly defined resistance levels with limited immediate upside, smart money is increasingly hunting for infrastructure plays with higher aggressive growth potential. The market’s appetite for speed is shifting toward the Bitcoin ecosystem itself.
Why settle for Solana’s volatility when you can access similar speeds on the world’s most secure blockchain?
From a humble beginning… — Bitcoin Hyper (@BTC_Hyper2) March 23, 2026
To Hyper Scale. 
 https://t.co/VNG0P4GuDo pic.twitter.com/TTkNzelKN3
Enter Bitcoin Hyper ($HYPER), the first-ever Bitcoin Layer 2 utilizing the Solana Virtual Machine (SVM). This project aims to solve Bitcoin’s notorious latency issues by delivering sub-second transaction speeds directly on the Bitcoin network, effectively bringing Solana’s programmability to Bitcoin’s security.
The presale data reflects massive institutional interest, with more than $32 million raised from early backers. Priced at just $0.0136, $HYPER offers a low-entry alternative and a 36% APY staking rewards.
With features like a Decentralized Canonical Bridge and significant staking APY, it targets the liquidity trapped in the BTC ecosystem.
Research the Bitcoin Hyper Presale
Disclaimer: This article is not financial advice. Cryptocurrency markets are highly volatile. Always do your own research (DYOR) before investing.
The post Solana Price Prediction: Is SOL Done? Will Memecoin Season Back to Solana? appeared first on Cryptonews.

7 Steps to Achieve Financial Freedom | Brian Tracy
How to watch The Pitt in UK and episode release schedule for hit medical drama

At Close of Business podcast March 25 2026


-
 Crypto World5 days ago
NIO (NIO) Stock Plunges 6.5% as Shelf Registration Sparks Dilution Worries
-

 Fashion5 days ago
Weekend Open Thread: Adidas – Corporette.com
-

 Politics5 days ago
Jenni Murray, Long-Serving Woman’s Hour Presenter, Dies Aged 75
-

 Crypto World4 days ago
Best Crypto to Buy Now: Strategy Just Spent $1.57 Billion on Bitcoin During Fear While Early Investors Quietly Enter Pepeto for 150x Potential
-

 News Videos7 days ago
RBA board divided on rate cut, unusually buoyant share market | Finance Report | ABC NEWS
-

 Crypto World4 days ago
Bitcoin Price News: Bhutan Sells $72 Million in BTC Under Fiscal Pressure, but the Smart Money Entering Pepeto Sees What the Market Does Not
-
 NewsBeat3 hours ago
Manchester United reach agreement with Casemiro over contract clause amid transfer speculation
-

 Tech5 days ago
inKONBINI Lets You Spend Summer Days Behind the Register
-

 Crypto World7 days ago
Canada’s FINTRAC revokes registrations of 23 crypto MSBs in AML crackdown
-

 Sports2 days ago
Remo Stars and Kano Pillars Strengthen Survival Hopes in NPFL
-
 NewsBeat7 days ago
Residents in North Lanarkshire reminded to register to vote in Scottish Parliament Election
-

 News Videos7 days ago
PARLIAMENT OF MALAWI – PAC MEETING WITH REGISTRAR OF FINANCIAL ON AMARYLLIS HOTEL – INQUIRY LIVE
-

 Politics6 days ago
Gender equality discussions at UN face pushbacks and US resistance
-

 Business3 days ago
No Winner in March 21 Drawing as Prize Rolls to $133 Million for Next
-

 Business7 days ago
Who Was Alex Pretti? 5 Key Facts About the ICU Nurse Killed by Federal Agents in Minneapolis
-

 Sports2 days ago
Gary Kirsten Accuses Pakistan Cricket Board Of ‘Interference’, Mohsin Naqvi Responds
-

 Tech3 days ago
Give Your Phone a Huge (and Free) Upgrade by Switching to Another Keyboard
-

 Tech7 days ago
Inventec’s bizarre VeilBook laptop hides its touchpad under a sliding keyboard just to give cooling fans a little breathing room
-

 Sports5 days ago
2026 Kentucky Derby horses, odds, futures, preview, date: Expert who nailed 12 Derby-Oaks Doubles enters picks
-
Sports6 days ago
Vikings Free Agency Enters Phase 2 with Key Questions
You must be logged in to post a comment Login