
Crypto World
But On-Chain Data Tells a Different Story

Just before the complete exit, Yi predicted ETH would reach $10,000, and BTC would surpass $200,000.
Trend Research, the trading firm led by Liquid Capital founder Jack Yi, has fully exited its Ethereum positions, closing out what was once Asia’s largest ETH long, according to on-chain monitoring platform Arkham.
At its peak, Trend Research held approximately $2.1 billion in leveraged Ethereum long positions, accumulated by borrowing stablecoins against ETH collateral.
Bullish Tweets, Brutal Exit
Arkham data revealed that the firm closed its final ETH position on Sunday. The exit resulted in a total realized loss of roughly $869 million. Interestingly, the complete exit followed several days of position reductions as Ether’s price declined toward the $1,750 level, which triggered stress across leveraged positions in the market.
Notably, Yi had publicly reiterated his bullish outlook just days before the firm fully exited its ETH exposure. In a post on X published four days prior to the final exit, Yi said Trend Research remained “bullish on the next major bull market,” and even predicted that ETH would go beyond $10,000 and Bitcoin above $200,000. He described the firm as having made “partial adjustments to manage risk.”
Yi also addressed broader market conditions in the post, and spoke about the lack of liquidity and alleged platform-driven manipulation. Despite these concerns, he maintained that the long-term trajectory of the crypto industry remained intact. He further asserted that current prices represented an attractive entry point for spot positions when viewed on a multi-year horizon, while acknowledging that extreme volatility has historically forced many bullish traders out of positions before subsequent rebounds.
Accumulation Trend During Market Stress
Amidst the market turmoil, Ethereum “accumulating addresses” – defined as wallets with no history of outflows, balances of at least 100 ETH, and no association with exchanges, miners, or smart contracts – currently hold 27 million ETH, according to CryptoQuant’s analysis. This figure represents approximately 23% of Ether’s circulating supply.
CryptoQuant also found that the altcoin has traded below the realized price of these accumulating addresses only twice in its history. The first time was when the market hit a low in 2025, while the second has been unfolding since January 2026. This means that accumulating addresses have continued to add to positions despite recent price declines and the forced unwinding of leveraged trades
You may also like:
SECRET PARTNERSHIP BONUS for CryptoPotato readers: Use this link to register and unlock $1,500 in exclusive BingX Exchange rewards (limited time offer).


Bitcoin (BTC) rose back to around $71,000 on March 25 after falling below $69,000 a day earlier, as traders reacted to fresh uncertainty linked to the Middle East conflict.
Summary
- Bitcoin rebounded to $71,000 after renewed conflict reports pushed prices below $69,000, unsettling broader markets.
- XLM and HYPE outperformed major tokens, while Ethereum, BNB, XRP, and Solana recorded smaller gains.
- SIREN rebounded above $2 after a sharp plunge, extending volatility and drawing fresh community scrutiny.
The recovery added to a mixed market session in which most large-cap altcoins posted limited daily moves. The broader crypto market also moved higher. Total market capitalization added about $20 billion in one day and approached $2.53 trillion, while Bitcoin’s market share held near 56.5%.
Bitcoin faced pressure over the past week after it failed to hold the $76,000 level. The pullback pushed the asset down to $69,000 last Thursday, with market sentiment turning cautious after the Federal Reserve kept interest rates unchanged and geopolitical tension increased.
The asset later bounced to $71,000 over the weekend, but another wave of selling followed after Donald Trump made statements about Iran. Bitcoin then fell back to $69,000 on Tuesday before recovering again to around $71,000 at press time.
The latest price swings came as traders responded to reports tied to the Middle East conflict. Trump said he would “pause all military actions against Iran’s power plants” and claimed both sides had reached a “deal.”
Iranian officials rejected those claims, which added more uncertainty to the market. Bitcoin briefly moved higher after Trump’s remarks, then lost momentum after the denial and the release of more disputed reports from the war front.
Altcoins Post Mixed Daily Performance
Most major altcoins traded in a narrow range during the session. Ethereum moved close to $2,200 after a small daily gain, while BNB neared $650. XRP held the $1.40 support level, and Solana climbed back above $90.
Among the larger-cap assets, Stellar posted one of the strongest gains. XLM rose about 8% to $0.18, while HYPE advanced more than 6% and traded above $40.
SIREN remained one of the most active tokens in the market. The AI-linked asset had surged to a record high of $3.65 after several triple-digit moves, then dropped by more than 70% before rebounding again.
At press time, SIREN traded near $2.20 after gaining more than 100% in one day. The move came as community members continued to question the token’s purpose and wallet concentration.
Disclosure: This article does not represent investment advice. The content and materials featured on this page are for educational purposes only.


Aave Labs plans to use idle liquidity in its lending system to generate extra yield as it moves closer to its V4 upgrade.
Summary
- Aave V4 will redeploy idle liquidity into approved strategies while keeping depositor access unchanged throughout.
- Roughly $6 billion in stablecoin deposits sits unused and may now generate extra yield onchain.
- The Aave DAO moved V4 closer to launch as governance tensions and contributor exits continued.
According to a blog post, the firm said the new Reinvestment Module will deploy unused funds into low-risk strategies while keeping assets available for withdrawals and borrowing. The update comes as Aave also moves through governance changes tied to the V4 rollout.
Aave Labs said a large share of capital on the protocol sits unused at any given time. Out of about $20 billion in stablecoin deposits, roughly $6 billion remains idle to support instant withdrawals and loan demand.
The firm said V4 will address that gap through a new Reinvestment Module. The module will monitor unused liquidity and direct part of it into approved strategies that can generate added returns without locking user funds.
Under the V4 design, a central liquidity hub will collect supplied assets and route them across lending markets, also called spokes. Each spoke will operate with its own rules, use cases, and risk settings.
When excess liquidity builds up, the Reinvestment Module will allocate capital into strategies approved through governance. These may include short-term Treasuries, money markets, and delta-neutral trades. When borrowing demand rises again, the module will pull capital back and rebalance automatically.
Furthermore, Aave Labs said the system will be configured for each asset separately. Stablecoins, ether, and other supported assets may follow different strategies, limits, and activation settings based on the asset profile.
For users, the change is meant to stay in the background. Depositors will still be able to access funds without lockups, while idle reserves may earn added yield. Aave said,
“The module also makes Aave more useful to institutions and protocol integrators by increasing yields and adding strategy flexibility.”
V4 advances as governance changes continue
The firm said historical data suggest the approach could improve returns. Based on Aave’s estimates, reinvesting excess stablecoin liquidity at rates close to SOFR would have raised average yields from about 4% to 4.9%.
At the same time, the Aave DAO has advanced a request-for-comment proposal tied to V4 deployment. The upgrade now moves closer to launch as several long-time contributors, including BGD Labs and the Aave Chan Initiative, prepare to step back.
These exits came during a governance dispute and broader changes pushed by founder Stani Kulechov to speed up the V4 path and tighten DAO control over resources.
Opinion by: Xin Yan, co-founder and CEO of Sign.
Financial exclusion remains one of the most persistent challenges for national governments. World Bank data highlights how more than 1.3 billion adults remain unbanked, without access to a financial account. These people rely on cash, creating a ‘cash-digital divide’, which excludes them from the formal economy.
To bridge the divide, governments need to promote CBDCs actively. As a trusted, risk-free alternative to physical cash, CBDCs are ideal instruments for the financially excluded demographic. With a seamless entry point to the financial ecosystem, mass adoption of CBDCs is a vital catalyst and a foundational pillar for achieving universal financial inclusion.
Wider access to financial institutions is key to stimulating a country’s growth. As more people invest and participate in the formal economy, the total capital base will expand, leading to greater financial stability. Further, bringing people within the formal economy ensures the benefits of policy rate changes reach the masses, bolsters regulatory oversight and prevents fraud.
Most people within the low-income demographic depend on cash payments because cash is easy to use, accepted everywhere, does not incur transaction charges and functions as a trusted medium of exchange.
The infrastructure needed to handle cash creates a gap between the unbanked population and the formal economy.
Financial inclusion as government policy
Establishing physical touchpoints to manage, store and handle cash at remote locations is resource-intensive. That’s why most service providers back out of offering cash-dependent financial services due to the high operational expenses.
Cash transactions also don’t leave a digital record, leading to an information vacuum for financial service providers. Consequently, institutions club the entire unbanked population as a high-risk group, denying access to insurance and credit markets.
Related: US lawmakers warn temporary CBDC ban isn’t enough, demand ‘permanent’ block
The lack of access to affordable digital payments and the absence of transaction history erode financial well-being and hinder a country’s economic growth. In this scenario, widespread access to formal financial services becomes an important government agenda.
Some central banks consider financial inclusion to be a key component of their mandate and adopt policies to ensure universal access to the formal economy. To this end, some central banks have considered issuing CBDCs to fast-track the process of developing an inclusive financial ecosystem.
CBDCs can accelerate financial inclusion
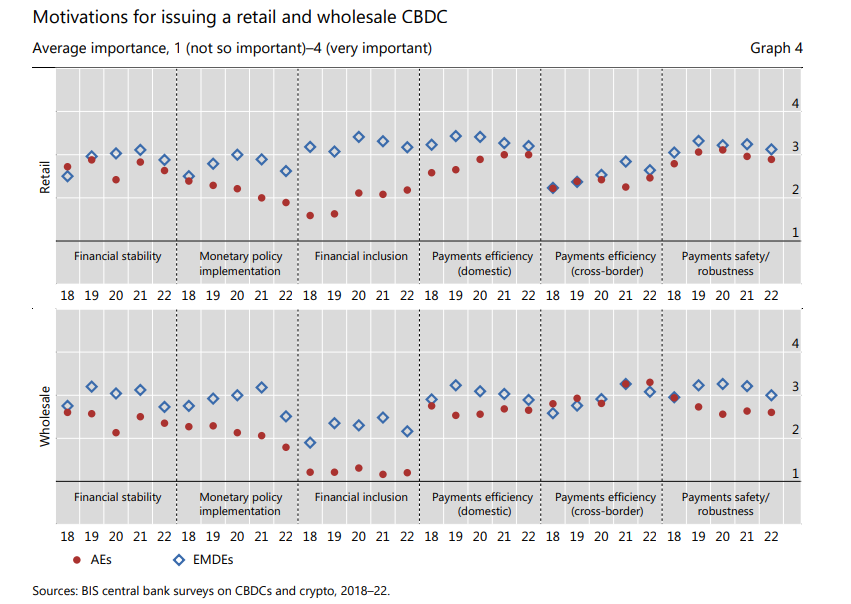
According to a 2023 study by Kosse and Mattei referenced by the IMF, about 60% of emerging and low-income countries consider financial inclusion to be one of the top three motivations for issuing a CBDC. The high confidence in CBDC stems from its properties to become the ideal bridge to the formal economy for the unbanked demographic.

CBDCs can operate via a two-tier distribution model. This model allows both commercial banks and non-banking entities to reach the financially excluded demographic. Besides expanding the financial ecosystem’s reach, non-banking intermediaries lower the high overhead costs of legacy branch-based banking.
As a significant portion of the unbanked population doesn’t have stable internet or mobile connectivity, offline transaction support is necessary. Experts have noted how CBDCs are being designed to support robust offline capabilities. Exploring high-potential technologies for short-range communication ensures resilient CBDC payments in remote areas where there is limited connectivity.
As a public-sector digital infrastructure, CBDCs are designed to prioritize public welfare over commercial profit. Stripping away the bloated overhead of legacy intermediary layers, CBDCs enable a highly optimized cost structure.
Instead of burdensome charges, users benefit from marginalized transaction costs that are de minimis, ensuring the network remains both accessible to the unbanked and economically resilient for the sovereign issuer.
Moreover, the underbanked population is more likely to trust CBDCs as a digital alternative to cash because they are aided by a credible institution. Unlike the liquidity constraints of private financial entities, CBDCs will always remain a direct liability of the central bank, making them somewhat safe.
Most importantly, CBDCs provide a portal for the financially excluded population to participate in the formal economy. It happens through the smooth exchange of transaction data between CBDCs and the broader financial services industry.
CBDCs can support privacy-preserving data sharing, allowing users to voluntarily share their transaction history to build credit scores to access savings, credit, and insurance services.
In the absence of formal credit history, lenders can use CBDC transaction data as a legitimate source to evaluate financial behavior and creditworthiness. Service providers would therefore be able to measure a customer’s risk profile and verify identity to offer credit and other financial products.
Toward CBDC mass adoption
CBDC usage is subject to digital literacy, electricity infrastructure, and access to hardware. Data shows that nations have already made enormous progress on all these fronts.
The 2025 Global Findex Database from the World Bank Group has reported that 86% of adults now own a mobile phone. Also, 79% of adults now have a bank account, and 61% are making digital payments across low and middle-income economies.

The report interestingly states that “despite high mobile phone ownership and growth in account ownership, 1.3 billion people still lack financial accounts.” This group of people have phones, personal ID, and SIM cards, which are necessary for a digitally enabled account.
Yet, they remain financially excluded from the formal economy.
In this situation, CBDCs remain one of the primary products that can offer safe, affordable, and convenient financial services to consumers.
Central banks and national governments must adopt a holistic approach and use CBDCs to help the financially inexperienced demographic integrate with the formal economy.
Opinion by: Xin Yan, co-founder and CEO of Sign.
This opinion article presents the author’s expert view, and it may not reflect the views of Cointelegraph.com. This content has undergone editorial review to ensure clarity and relevance. Cointelegraph remains committed to transparent reporting and upholding the highest standards of journalism. Readers are encouraged to conduct their own research before taking any actions related to the company.
TLDR:
- XRP’s combined spot and perpetual CVD on Binance recovered by $315M between March 23 and March 25.
- Binance open interest held between $185M and $192M, showing buying returned without added leverage pressure.
- XRP’s Estimated Leverage Ratio dropped to 0.134 on Binance, marking the lowest reading recorded since 2024.
- Multi-exchange OI delta averaged -$14M daily from March 18–22, preceding the two-day CVD rebound on Binance.
XRP is showing renewed buying activity on Binance, with key derivatives and spot metrics improving over a two-day window.
Between March 23 and March 25, combined spot and perpetual cumulative volume delta recovered by $315 million.
At the same time, the estimated leverage ratio dropped to its lowest point since 2024. These developments suggest a shift in market structure that traders are closely watching.
Binance CVD Recovers Across Spot and Perpetual Markets
XRP’s perpetual CVD on Binance moved from -$2.12 billion to -$1.88 billion between March 23 and March 25. That represents a net improvement of roughly $240 million within just two days. Alongside this, spot CVD climbed from -$202 million to -$127 million over the same period.
The spot CVD improvement added another $75 million to the overall recovery. Together, these two figures account for the $315 million combined rebound seen across both markets. This kind of recovery across both segments tends to reflect broader participation from buyers.
What adds weight to this move is how open interest behaved during the same window. Binance open interest stayed within a narrow band of $185 million to $192 million throughout this period. That range shows buying pressure picked up without a notable rise in leverage.
As analyst Amr Taha noted, the broader derivatives market had already gone through a cooling phase before this rebound appeared.
On the Multi Exchange Open Interest Delta chart, negative readings dominated from March 18 to March 22, averaging around -$14 million daily. The CVD recovery therefore followed a multi-day period of reduced activity.
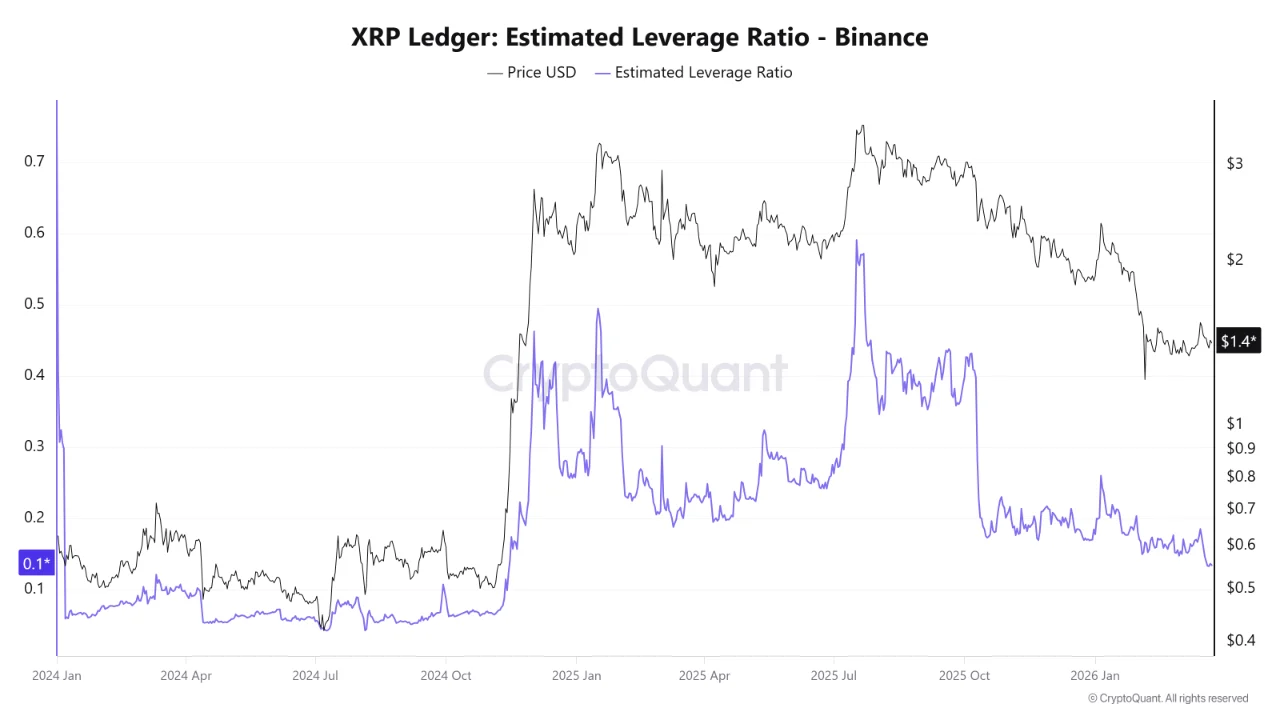
XRP Leverage Ratio Drops to Levels Not Seen Since 2024
The Estimated Leverage Ratio for XRP on Binance recently fell to approximately 0.134, coinciding with XRP trading near $1.41.
According to analyst Arab Chain, this marks the lowest reading since 2024. It reflects a clear change in how traders are positioning themselves in the derivatives market.
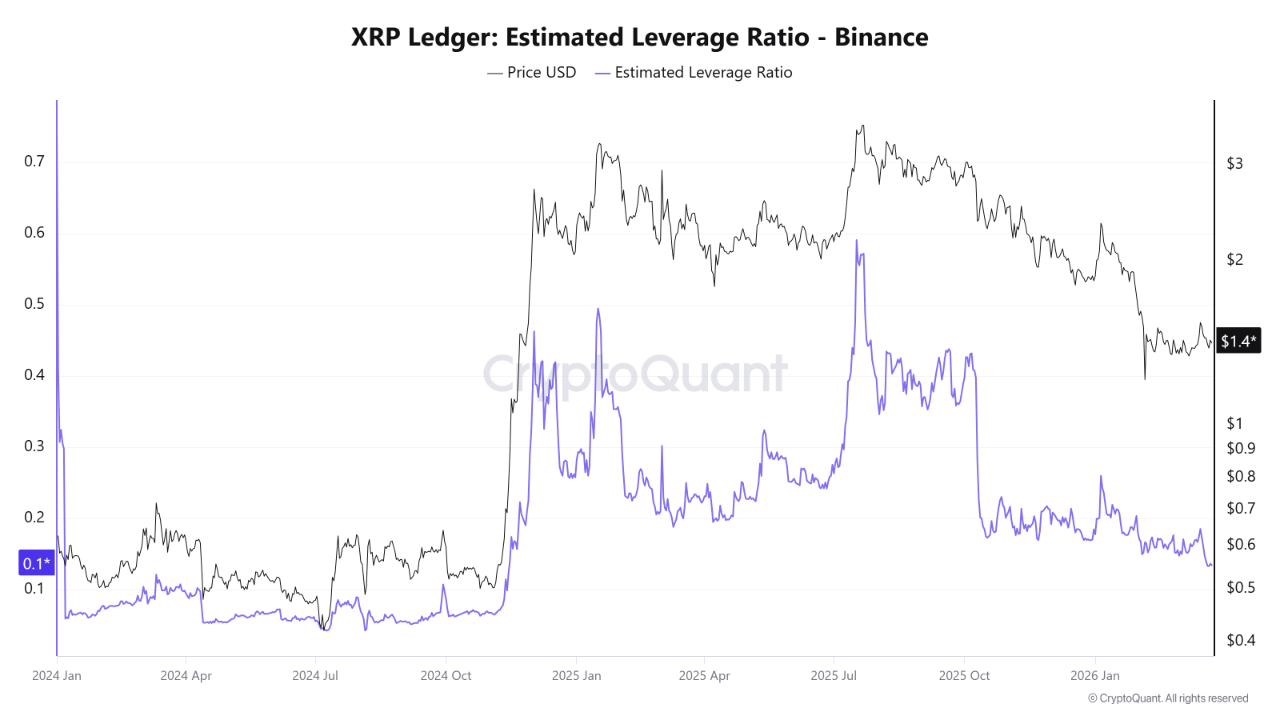
Source: Cryptoquant
During 2025, the ELR climbed above 0.50 at several points, which aligned with periods of heightened price swings.
Starting in early 2026, the ratio began a steady decline before reaching its current level. The drop points to an ongoing deleveraging phase across the market.
Lower leverage generally reduces the risk of large-scale liquidations. Liquidation events often cause sudden price swings and short-term volatility. A reduction in open leverage therefore tends to stabilize price action over time.
The decline in leverage also appears to coincide with a price drop from higher levels seen in recent months. This pattern often reflects a rebalancing phase, where over-leveraged positions are unwound. Historically, such phases have preceded stronger and more sustained price movements.


TLDR:
- Startale Group raised $63M in Series A funding, with SBI Group contributing $50M to the round.
- Sony Innovation Fund led the $13M first close in January 2026, linking entertainment to blockchain growth.
- Startale and SBI co-developed JPYSC, the first trust bank-backed Japanese yen stablecoin, in 2025.
- The Startale SuperApp will offer tokenized assets, stablecoins, and onchain tools in one platform.
Startale Group has completed a $63 million Series A funding round, drawing major backing from two of Japan’s most recognized corporate names.
The round includes a $50 million investment from SBI Group and a $13 million first close from Sony Innovation Fund in January 2026.
The capital will go toward building onchain infrastructure covering Ethereum Layer 2 networks, stablecoin issuance, and tokenized securities across Asia and beyond.
SBI Group Deepens Its Commitment to Onchain Finance
SBI Group’s $50 million contribution marks a major step in its ongoing partnership with Startale. The two companies had already collaborated on Strium, a Layer 1 blockchain built for tokenized securities and RWA trading.
They also co-developed JPYSC, the first trust bank-backed Japanese yen stablecoin, through a joint venture announced in August 2025.
SBI Group Chairman Yoshitaka Kitao spoke directly about the investment’s direction. “Startale Group possesses extensive expertise in the field of on-chain integration and offers capabilities that complement those of the SBI Group,” Kitao said. He added that the partnership is expected to drive a vertical integration strategy across digital finance.
CEO Sota Watanabe also weighed in on what the round represents. “The close of our $63M Series A reflects the strong conviction our partners have in the vision we are building,” Watanabe said. He further noted that tokenized Japanese equities and JPY stablecoin adoption will be a core focus this year.
With this funding in place, Startale will now scale Strium further and expand JPYSC alongside USDSC. These stablecoins are designed to support fiat-to-crypto integration and enable onchain dividends and yield distribution for retail and institutional users alike.
Consumer and Institutional Layers Come Together Through the Startale App
Beyond institutional finance, Startale is also building out its consumer-facing product. The Startale App is being developed into a SuperApp that will run on Soneium, Sony’s blockchain ecosystem. It will offer users one-stop access to tokenized assets, stablecoins, and onchain experiences.
The app will combine asset management, Mini Apps, payments, and social features into a single interface. The goal is to remove complexity from blockchain interactions for everyday users. This positions Startale to serve both retail consumers and large financial institutions from the same platform.
Sony Innovation Fund’s involvement adds an entertainment and consumer dimension to Startale’s strategy. This pairing with SBI’s financial reach creates a broad foundation across two high-growth sectors. Together, the two partnerships cover both ends of the onchain adoption curve.
Startale plans to use the funding to grow its team, extend its infrastructure stack, and deepen adoption across Asia. The company sees vertical integration — from blockchain rails to consumer apps — as the key to long-term growth in the onchain economy.

Google has set a 2029 deadline for migrating its services to post-quantum cryptography (PQC), signaling a shift from warnings to concrete action as quantum threats edge closer to reality. The tech giant argued that rapid progress in quantum hardware and quantum error correction, along with revised estimates of when quantum machines could break today’s encryption, heightens the urgency to act sooner rather than later.
In a statement, Google underscored that PQC migration is essential for secure user authentication across its products. “Quantum computers will pose a significant threat to current cryptographic standards, and specifically to encryption and digital signatures,” the company said. This marks the first explicit timeline from Google to deploy PQC across its product stack, a move that could set a new industry tempo for post-quantum readiness.
“It’s our responsibility to lead by example and share an ambitious timeline. By doing this, we hope to provide the clarity and urgency needed to accelerate digital transitions not only for Google, but also across the industry.”
Google’s declared timeline comes as the company advances Willow, its quantum processor, which has a reported capacity of 105 qubits, placing it among the more capable publicly discussed quantum chips today.
Key takeaways
- Google sets a 2029 target to migrate its services to PQC, signaling a rare explicit industry timeline for post-quantum readiness.
- The move stresses the urgency of PQC ahead of theoretical “Q-Day” milestones, supported by newer estimates and faster hardware progress.
- Willow’s 105-qubit profile reinforces Google’s positioning in the quantum race and underscores the feasibility of scaling PQC deployment alongside hardware advances.
- Broader crypto networks are advancing their own post-quantum preparations, including Ethereum’s protocol-level PQC work and Solana’s quantum-resistant vault experiments.
Industry momentum: PQC upgrades beyond Google
The effort to harden crypto networks against quantum threats is gathering pace across layers and protocols. The Ethereum Foundation launched a dedicated Post-Quantum Ethereum resource hub this week, focusing on protecting the blockchain from future quantum-enabled attacks and safeguarding the billions of dollars stored on the network. The plan envisions implementing quantum-resistant solutions at the protocol layer by 2029, with execution-layer adjustments to follow as needed.
In parallel, Solana developers rolled out a quantum-resistant vault in January 2025 aimed at shielding user funds from quantum threats. The approach relies on a hash-based signature scheme that generates new keys with each transaction, adding a layer of forward security for vault-held assets. It’s important to note that this feature is not a network-wide security upgrade; users must opt into the Winternitz vault system to access the enhanced protection.
These efforts reflect a broader trend toward embedding quantum resilience into core cryptographic routines, even as practical deployment remains uneven across ecosystems. Some projects, particularly in the Bitcoin camp, emphasize a more cautious stance about the immediacy of quantum risk.
Bitcoin’s divided perspectives on post-quantum risk
Within the Bitcoin ecosystem, opinion remains split on how urgently to pursue post-quantum safeguards. Blockstream CEO Adam Back has argued that quantum risks are widely overstated and that no immediate action is required for decades. By contrast, researchers and developers have proposed concrete steps to mitigate potential vulnerabilities. For example, Bitcoin Improvement Proposal 360 (BIP-360) advocates a new Pay-to-Merkle-Root output type designed to shield addresses from short-exposure quantum attacks. However, implementing such changes could take years; one prominent advocate suggested a seven-year horizon for broad adoption.
Beyond Bitcoin-specific proposals, the industry continues to weigh the practicality and timeline of universal PQC adoption. Some critics argue that even robust post-quantum schemes must contend with issues such as interoperability, standardization, and the long-term security of existing keys before a wholesale migration can be deemed safe. For now, multi-year upgrades and phased rollouts appear to be the path of least resistance as developers test and validate new cryptographic primitives.
For readers seeking deeper context, several related analyses look at the state of quantum-resistant cryptography, including examinations of the viability of quantum-secure signatures and the practical challenges of deploying them at scale. Notably, a number of articles raise questions about whether quantum-secure cryptography will perform as hoped in real-world conditions and what the timing of widespread deployment will truly look like.
Looking ahead, the pace of PQC adoption will likely hinge on a confluence of hardware progress, standardization milestones, and the willingness of large platforms to commit to comprehensive migrations. Google’s new timeline creates a powerful signal to the ecosystem: with major players articulating concrete deadlines, the pressure to move from theory to action could accelerate efforts across wallets, exchanges, and networks alike.
Related discussions emphasize the need for transparent roadmaps and verification as quantum-ready primitives are tested in practice. The crypto community will be watching closely how large platforms translate ambitious timelines into tangible, verifiable security upgrades that survive real-world operational pressures.
In sum, the industry appears to be moving from speculative risk assessments toward programmatic PQC work streams. The next 12–24 months may reveal how quickly cross-project alignment can emerge around standards, interoperability, and the practical deployment of quantum-resistant cryptography across web, cloud, and blockchain systems.
Readers should stay tuned to how major players translate these timelines into interoperable security upgrades, and whether regulatory and standard-setting bodies accelerate guidance that helps unify the path to post-quantum readiness.
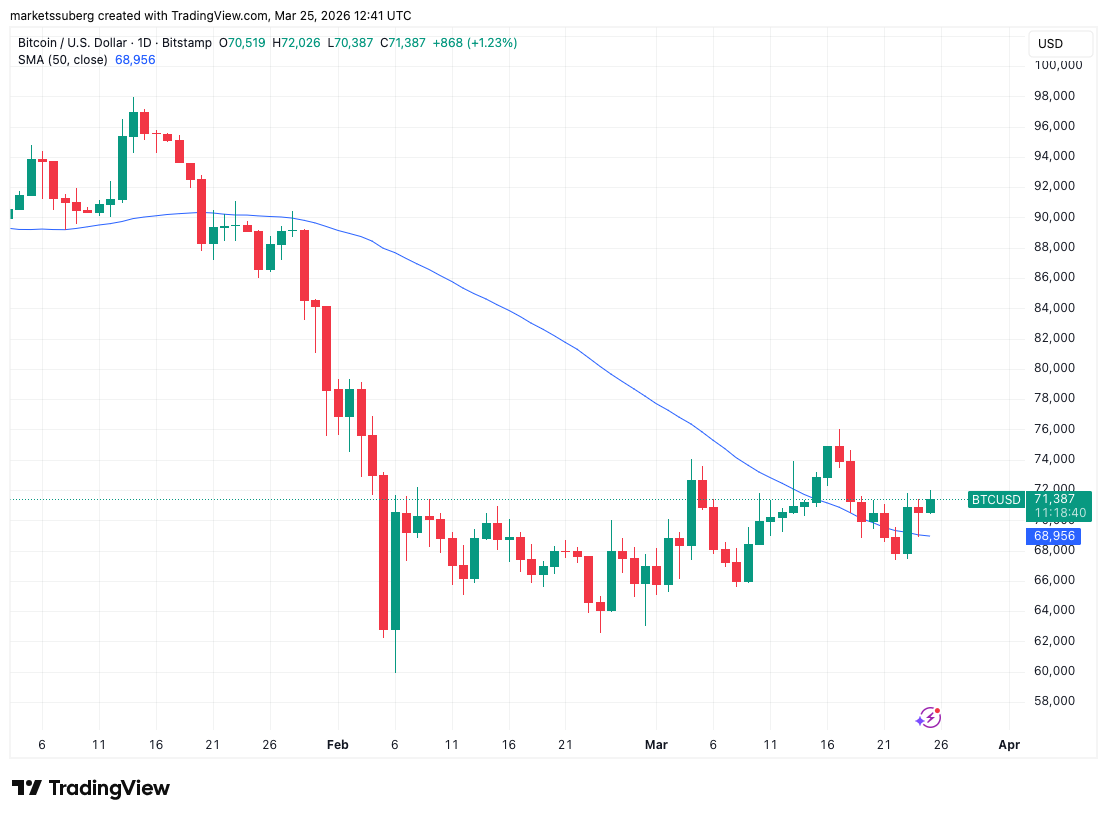
Bitcoin traders agreed that BTC price action needed to retake $72,000 to open up the odds of further upside as gold and US stocks gained.
Bitcoin (BTC) returned to $72,000 on Wednesday as gold continued its rebound from four-month lows.
Key points:
-
Bitcoin price performs a support retest of its 50-day moving average before hitting $72,000.
-
Seller interest makes the area above the day’s high of key importance going forward.
-
Gold and US stocks combine with crypto to seek further relief.
Bitcoin traders: BTC price needs to clear $72,000
Data from TradingView showed BTC price gains of around 2% on the day, following a retest of its 50-day simple moving average (SMA).
This trend line, previously a key resistance obstacle, looked set to remain as new low-time frame support.

Commenting, Keith Alan, cofounder of trading resource Material Indicators, tied emerging BTC price strength to hopes of dialogue between Iran and the US amid the ongoing war.
The market, he wrote on X, “seems to like the idea” of negotiations, reflected in increasing Bitcoin whale buying activity.
“Would like to see a rally to $78k, but we’re starting to see ask liquidity stack just below $72k where there seems to be a bit of profit taking,” he added.

Data from CoinGlass showed a wall of ask liquidity appearing above $72,000 into the Wall Street open. Previously, news events sparked liquidity hunts both above and below spot price.

“Looks like bulls have found some juice again,” trader Jelle continued, anticipating “more sideways chop” for BTC price action.
Trader Daan Crypto Trades joined Alan in expressing confusion over the reliability of reports that US-Iran diplomacy was underway.
“The one thing I care about is price action, and Bitcoin has still remained pretty strong throughout all this mess. This $72K resistance area is one that has been pretty common for BTC to test but it still has not been able to sustain above that area for long,” he told X followers.
“Bulls need to get that level cleared and remain there if this wants to have legs and go test the $80Ks again.”

Gold rebound continues after $4,100 slump
US stocks and gold followed crypto higher in a relief bounce on the day, with the latter reclaiming the $4,500 mark after a trip to its lowest levels since late November 2025.
Related: Bitcoin value ‘off the chart’ as BTC price metric hits record lows in 2026

“Gold bounces upwards after taking the liquidity beneath the wick. Classic price action,” crypto trader Michaël Van de Poppe responded on X while analyzing the XAU/USD daily chart.
“I think that we’ll slowly see the volatility wind down in Gold as it has established a range. Upper side of the range is $5,000-5,100. The lower end of the range is $4,000-4,200.”

Last month, Van de Poppe eyed early signs of a transition from gold to Bitcoin products from institutional investors.
This article does not contain investment advice or recommendations. Every investment and trading move involves risk, and readers should conduct their own research when making a decision. While we strive to provide accurate and timely information, Cointelegraph does not guarantee the accuracy, completeness, or reliability of any information in this article. This article may contain forward-looking statements that are subject to risks and uncertainties. Cointelegraph will not be liable for any loss or damage arising from your reliance on this information.


Crypto derivatives firm STS Digital said on Wednesday it had launched a structured products platform for digital assets, with Kraken as its first distribution partner.
STS Digital said the platform allows clients to access options-based strategies packaged into predefined payoff structures. Kraken has integrated the platform via an API and is using it to power its Dual Investment product, which offers eligible clients fixed returns on Bitcoin (BTC) and Ether (ETH).
The launch reflects a broader trend of firms packaging derivatives into structured products that can offer yield or downside protection in crypto markets.
Jeremy Dominh, head of structured products at STS Digital, said the launch aims to expand institutional access to more complex digital asset investment strategies.
Kraken expands derivatives offering with structured products
Alexia Theodorou, Kraken’s director of derivatives, said the partnership expands the exchange’s derivatives offering to include structured strategies such as covered calls. She said the products offer an alternative way for clients to generate returns beyond staking or lending.
“This collaboration reflects our commitment to offering flexible, innovative products that help clients engage with digital assets in more sophisticated ways,” she said.
On Feb. 26, STS Digital raised $30 million in a strategic funding round led by CMT Digital, with participation from Payward, the parent company of Kraken. The company said the funding would support expansion of its crypto options trading platform and institutional market access.
How structured crypto products work
DBS, which launched tokenized structured notes on Ethereum in 2025, defines structured products as financial instruments whose performance or value is linked to an underlying asset, product or index. In simple terms, they package derivatives into a single product offering predefined payouts based on how the underlying asset performs.
According to STS Digital, the platform offers structured investment strategies, including options-based products aimed at generating yield and managing exposure to digital assets.
Related: Ripple joins Singapore sandbox to test RLUSD in trade finance
STS said the platform operates under a Bermuda Monetary Authority license, placing it within a regulated framework for clients.
While the platform is regulated, structured products can be complex and may carry risks tied to volatility, liquidity and counterparty exposure, particularly in less mature markets such as crypto.
Companies expand crypto investment offerings for institutions
The launch comes as firms expand efforts to introduce more complex crypto investment products, including tokenized notes, yield structures and other derivatives-linked offerings.
On Tuesday, Omnes and Apex Group announced plans to tokenize the Omnes Mining Note (OMN), an institutional-grade structured note linked to Bitcoin hashrate. The note gives direct economic exposure to new Bitcoin production for institutional investors.
On the same day, Lombard, which builds Bitcoin-based lending infrastructure, announced that it will team up with Bitwise Asset Management to offer Bitcoin yield and lending to institutional custody.
Magazine: Banks want to run Vietnam’s crypto exchanges, Boyaa’s $70M BTC plan: Asia Express
TLDR:
- Bittensor has gained 140% in six weeks, with 105% of those gains recorded since March 8th alone
- Social dominance for $TAO hit 1.99%, marking a new one-year high and sitting 144% above its daily average
- Retail sentiment shows only 1.5 positive comments per negative one, suggesting no signs of a forming top yet
- Targon (SN4) trades at 3.6x revenue against a $10.5M ARR, well below the typical 8–15x SaaS industry benchmark
Bittensor ($TAO) has posted a price increase of 140% over six weeks, with 105% of those gains recorded since March 8th alone.
The token now sits at 26th by market capitalization. Analyst platforms Santiment and LunarCrush have each published separate findings on the rally.
Both reports point to rising social activity, though they approach the data from different angles.
Retail Sentiment Remains Cautious Despite Price Surge
Santiment flagged that social volume across X, Reddit, Telegram, and other platforms has reached its second-highest level on record for Bittensor.
The only period that exceeded it was the activity surrounding the token’s $529 price top on November 1st. That prior peak was driven largely by FOMO, making the current comparison worth noting.
Despite the strong price movement, the sentiment breakdown tells a more measured story. Santiment recorded only 1.5 positive comments for every 1.0 negative comment at this time.
That ratio is notably low for a token in the middle of a major rally, and it sets this surge apart from other altcoin pumps seen in recent cycles.
The absence of greedy optimism from retail traders is generally viewed as a healthy sign for a rally. When crowds pile in with excessive enthusiasm, it tends to mark a forming top. The current data does not show that pattern, which suggests the move may have room to continue.
Santiment also positioned Bittensor within the broader AI narrative driving capital rotation in the market. The token is described as a live marketplace for machine intelligence, where models compete and earn based on performance. This effectively turns AI output into a tradable commodity with measurable results.
The subnet architecture further sets Bittensor apart, according to Santiment’s framing. Hundreds of specialized AI markets operate independently across use cases like LLM training, compute, and prediction, yet remain economically tied to TAO. That structure creates real competition rather than a single centralized model driving all activity.
Engagement Data and Fundamentals Paint a Different Picture From November
LunarCrush approached the rally through social engagement metrics, reporting a 112% rise in $TAO engagements over the past 30 days.
In a single 24-hour window, the platform recorded 3.86 million engagements against a daily average of 1.56 million. That figure is approximately 2.5 times the baseline level of activity.
Social dominance for $TAO reached 1.99%, sitting 144% above its daily average and marking a new one-year high.
A total of 3,228 unique creators posted about the token within a 24-hour period, up 41% week-over-week. LunarCrush noted that price and engagement are rising together for the first time since the November 2025 local top.
However, LunarCrush drew a clear contrast between then and now. The current market cap stands at $2.9 billion, compared to $4.7 billion during the November peak.
Social volume is approaching that earlier level, but price has not caught up, which some read as a potential gap still to close.
Several catalysts appear behind the current wave of attention. Jensen Huang named Bittensor on the All-In Podcast alongside Chamath Palihapitiya.
Grayscale also opened a private placement for a $TAO trust, adding a layer of institutional interest to the conversation.
On the development side, Templar (SN3) completed Covenant-72B, a 72-billion-parameter model trained across 70 or more contributors with no central computing cluster.
Targon (SN4) is generating $10.5 million in annualized recurring revenue at a 3.6 times revenue multiple, compared to the 8 to 15 times multiple typical of traditional SaaS companies.
Zcash price extends a high-volume rally as fresh ZODL funding, rising shielded usage, and a renewed privacy narrative push ZEC higher against a constructive crypto market backdrop.
Summary
- ZEC trades near $239 with rising volumes and a multi-session rally that is outpacing the broader large-cap crypto market.
- A governance shake-up created ZODL, which raised about $25m to expand Zcash’s protocol work, wallet stack, and shielded usage.
- Growing demand for privacy coins and tighter regulation have pushed Zcash into a renewed “regulatory hedge” and financial confidentiality narrative.
Zcash (ZEC) price, a privacy-focused cryptocurrency, is trading near $239 with a 24-hour gain of about 3% and a weekly advance of over 10%, putting its market capitalization around $3.95 billion and daily trading volume at approximately $485.6 million. The move has extended a multi-session rally that saw ZEC close at $221-$243 range through early March, supported by daily spot volumes regularly between $279 million and $425 million, according to historical price data. This acceleration comes as global crypto market capitalization hovers near $2.45 trillion, suggesting Zcash is outperforming many large-cap peers in a generally constructive market.
Zcash price climbs on rising volumes and renewed privacy focus
Zcash is a layer-1 privacy coin that uses zero-knowledge proofs (zk-SNARKs) to offer both transparent and shielded transactions, allowing users to choose between public and private transaction flows on the same network. In the shielded pool, sender, receiver, and amount data are encrypted while transactions remain verifiable, a design that aims to preserve fungibility by preventing coins from being “tainted” by prior history. That makes ZEC part of a small group of privacy assets, alongside names like Monero, competing for users and institutions seeking stronger financial confidentiality than fully transparent chains.
Although Zcash’s supply and on-chain activity are partially obscured by design, available market data paints a picture of renewed speculative engagement from larger traders. ZEC’s circulating supply is reported at around 16.6 million tokens, giving it a fully diluted valuation near $5.01 billion at current prices. Over recent sessions, daily trading volumes above $400 million imply meaningful participation from larger market participants, rather than purely retail-driven action. External pricing dashboards show ZEC trading in the $226-$245 band in late March with 24-hour dollar volumes in the $320-$430 million range and a market cap between roughly $3.7 billion and $4.1 billion, supporting the picture of a liquid, actively traded market.
Technical indicators align with this shift in positioning. One multi-metric dashboard places ZEC’s current price around $236 with a 14-day relative strength index near 53, signaling a neutral-to-bullish trend rather than an overbought spike, while also tracking high short-term volatility of around 7.3%. That combination of solid spot volume, rising price, and non-extreme momentum suggests the move has room to develop, but that traders should remain aware of sharp reversals typical for volatile privacy assets.
Beyond price, Zcash’s latest leg higher coincides with a notable organizational and funding shift in its core developer ecosystem. In early 2026, Zcash’s main engineering team exited the Electric Coin Company after a governance dispute with Bootstrap, the nonprofit that had overseen Zcash development, and re-formed as the Zcash Open Development Lab (ZODL). ZODL subsequently raised about $25 million in seed funding led by major crypto venture firms, described as the largest funding round in the project’s history, with funds earmarked for hiring, protocol work, and expansion of its mobile wallet infrastructure. According to coverage of the deal, the Zodl wallet (formerly Zashi) has already driven a more than 400% increase in shielded pool adoption and processed over $600 million in ZEC swaps since October, underscoring practical demand for private transfers rather than purely speculative trading.
The move in ZEC also fits into a broader rotation back into privacy and regulatory-hedge narratives. Market commentary and data aggregators have highlighted growing interest in privacy coins like Zcash and Monero amid tighter European regulations and rising concerns about financial surveillance, with privacy names at times outperforming Bitcoin on a relative basis. That dynamic leaves Zcash positioned as a hybrid: its optional privacy model and ability to support both shielded and transparent flows gives it a different regulatory profile than fully private alternatives, even as it competes directly for the same users seeking stronger confidentiality.
Within this context, the latest price breakout in ZEC looks less like an isolated pump and more like the market repricing a funded, technically mature privacy chain as new capital and a refreshed development structure begin to translate into higher shielded usage and deeper liquidity.

Brown scores 31 as Celtics snap Thunder’s 12-game win streak

It’s here! NASA reveals full livestream schedule for crewed moon mission

Katie Boulter revival powered by ‘unmatched’ love from Alex De Minaur


-
 Crypto World5 days ago
NIO (NIO) Stock Plunges 6.5% as Shelf Registration Sparks Dilution Worries
-

 Fashion5 days ago
Weekend Open Thread: Adidas – Corporette.com
-

 Politics5 days ago
Jenni Murray, Long-Serving Woman’s Hour Presenter, Dies Aged 75
-
 NewsBeat17 hours ago
Manchester United reach agreement with Casemiro over contract clause amid transfer speculation
-

 Crypto World4 days ago
Best Crypto to Buy Now: Strategy Just Spent $1.57 Billion on Bitcoin During Fear While Early Investors Quietly Enter Pepeto for 150x Potential
-

 Crypto World4 days ago
Bitcoin Price News: Bhutan Sells $72 Million in BTC Under Fiscal Pressure, but the Smart Money Entering Pepeto Sees What the Market Does Not
-

 Tech6 days ago
inKONBINI Lets You Spend Summer Days Behind the Register
-

 Sports3 days ago
Remo Stars and Kano Pillars Strengthen Survival Hopes in NPFL
-

 Politics6 days ago
Gender equality discussions at UN face pushbacks and US resistance
-

 Business3 days ago
No Winner in March 21 Drawing as Prize Rolls to $133 Million for Next
-

 Sports3 days ago
Gary Kirsten Accuses Pakistan Cricket Board Of ‘Interference’, Mohsin Naqvi Responds
-

 Tech3 days ago
Give Your Phone a Huge (and Free) Upgrade by Switching to Another Keyboard
-

 Sports5 days ago
2026 Kentucky Derby horses, odds, futures, preview, date: Expert who nailed 12 Derby-Oaks Doubles enters picks
-
Sports7 days ago
Vikings Free Agency Enters Phase 2 with Key Questions
-

 News Videos36 minutes ago
Parliament publishes latest register of MPs’ financial interests
-

 Tech3 days ago
AI enters the chat: New Seattle dating app relies on tech to facilitate meaningful human connections
-
 NewsBeat7 days ago
Val Kilmer to appear posthumously in new film using generative AI
-

 Politics6 days ago
Scotland’s rejection of assisted dying is a victory for humanity
-

 NewsBeat6 days ago
Missile lands next to presenter during live report
-

 Business6 days ago
DLocal: Entering 2026 At Escape Velocity
You must be logged in to post a comment Login