

Crypto World
Can $1.35 hold amid massive 400M barrel oil dump?
The crypto markets witnessed a shift today as oil prices underwent one of their most significant intraday reversals in history. Following an initial surge of nearly 30% that saw Brent crude flirting with $120 per barrel due to the escalating conflict in the Middle East and the effective closure of the Strait of Hormuz, the market plunged back toward the $100 mark.
Summary
- Oil prices reversed sharply after reports that G7 nations may release up to 400 million barrels of crude from reserves, easing inflation concerns.
- XRP is consolidating between $1.34 and $1.40 after rejecting the $1.47 local high earlier this month.
- Technical indicators show neutral momentum and steady accumulation, suggesting selling pressure may be fading near the $1.30 support level.
This sudden correction followed an exclusive report from the Financial Times stating that G7 finance ministers, in coordination with the International Energy Agency (IEA), are weighing the largest-ever emergency intervention: a release of up to 400 million barrels of crude oil from strategic reserves.
For the cryptocurrency sector, and specifically for XRP, this cooling of energy-driven inflation fears has provided a much-needed window of stability.
XRP price analysis
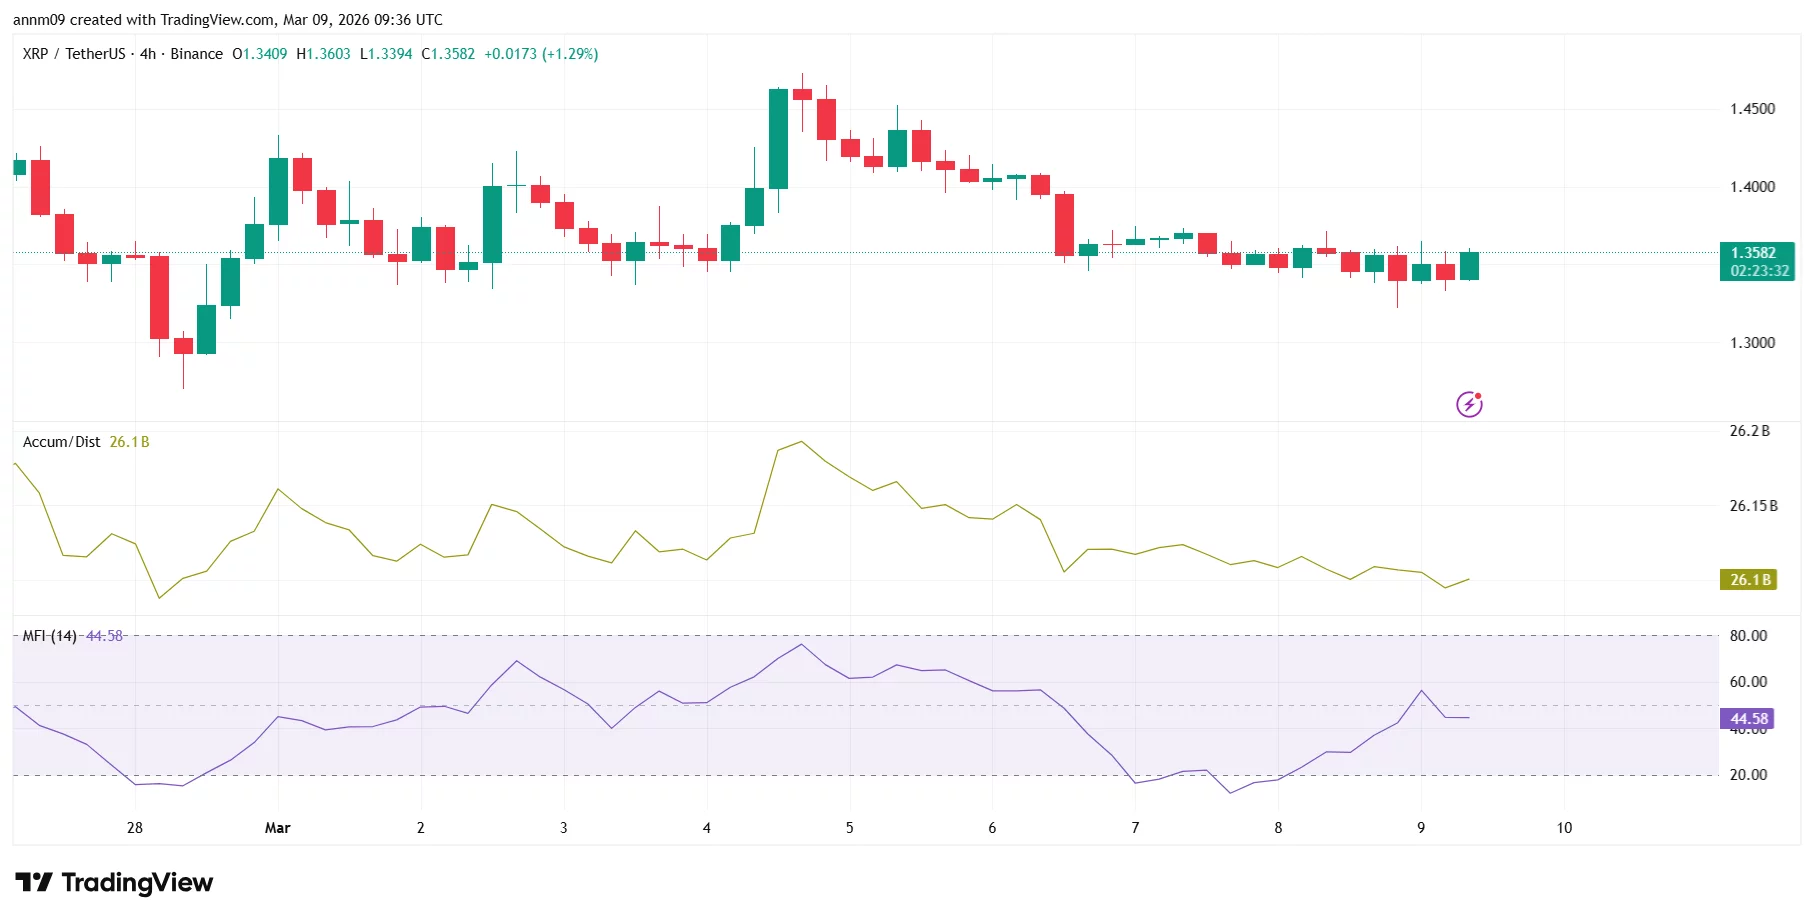
The current price action on the XRP/USDT (XRP) 4-hour chart illustrates a period of high-tension consolidation following a significant rejection from the $1.47 local high.
After peaking on March 4th, the asset entered a steady downtrend characterized by a series of lower highs and lower lows. However, a vital defensive effort by bulls is now visible around the $1.34 to $1.35 range, where price has begun to trade sideways in a narrow cluster.
The most immediate support is firmly established at the $1.30 level, which served as a major floor during the late February sell-off.
Conversely, overhead resistance is concentrated at $1.40, a psychological barrier that has repeatedly stifled recovery attempts. If bulls can successfully leverage the current macro stabilization to push back above $1.40, the next significant resistance target lies at the recent swing high of $1.47.

Technical indicators suggest that while the immediate trend is cautious, the selling pressure may be nearing exhaustion. The Money Flow Index (MFI-14) is currently positioned at 44.58, indicating a neutral momentum that has recovered from an oversold dip below 20 seen on March 7th.
This suggests that capital is slowly re-entering the asset at these lower price points.
Additionally, the Accumulation/Distribution line remains relatively flat at 26.1 billion, showing that despite the price drop from $1.47, there hasn’t been a massive exodus of volume, pointing toward “strong hands” holding through the volatility.
For a definitive bullish reversal, traders are looking for a break out of the current tight range, specifically a close above the $1.36 level seen in the most recent candle.
Failure to defend the $1.34 immediate floor could lead to a retest of the $1.30 primary support, while a breakout could pave the way for a run back toward $1.50 if global energy fears continue to subside.

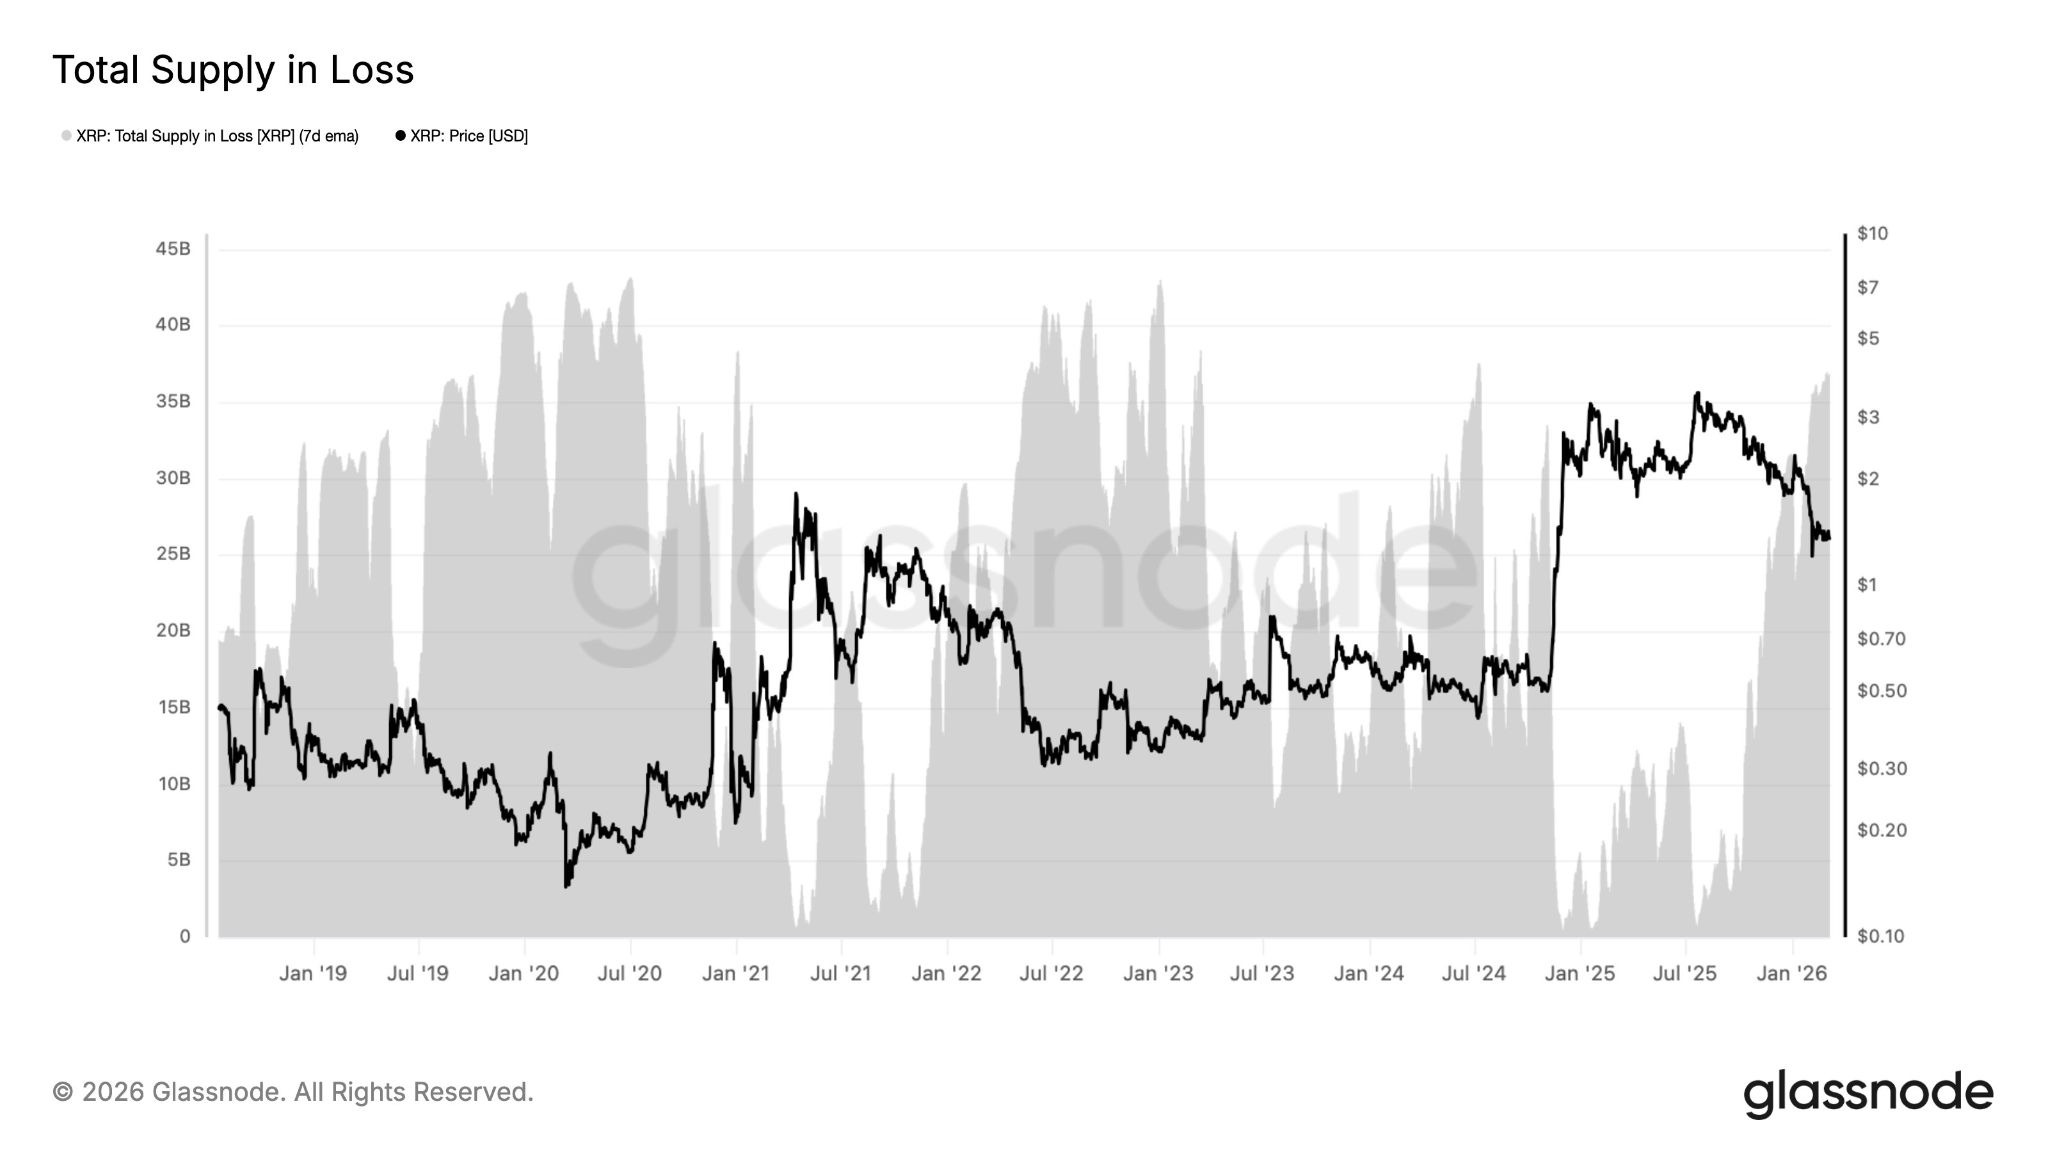
XRP (XRP) traded at $1.35 on Monday, a 63% drawdown from its multi-year high of $3.66 reached in July 2025. As a result, many XRP holders are sitting on significant unrealized losses, underscoring the risks facing crypto investors in bear markets.
Key takeaways:
-
XRP’s 63% drawdown from its $3.66 multi-year high has left holders with over $50 billion in unrealized losses.
-
Key XRP levels to watch in the short term include $1.40, $1.30 and $1.27.
60% of XRP circulating supply now in the red
The XRP/USD pair trades 28% below its yearly open of $1.87, extending losses after it closed 2025 down 11.6%. The prolonged weakness has pushed a significant portion of its supply into the red.
Related: XRP faces $650M sell risk as charts hint at prices below $1
With XRP trading at $1.35 at the time of writing, roughly 36.8 billion XRP are currently held at a loss, representing $50.8 billion in unrealized losses, or more than 60% of the circulating supply, according to data from Glassnode.

XRP’s spot price is also below its aggregate holder cost basis, currently at $1.44, suggesting that long-term holders are increasingly under strain.

Spot XRP ETF investors are also feeling the pressure. Data from SoSoValue shows that these investors are reducing exposure to these investment products, which have recorded outflows for two consecutive days totaling $22.8 million.
More than $16.2 million in net outflows were recorded on Friday, marking the largest redemption since Jan. 29, when spot XRP ETFs saw $93 million in outflows.

The risk-off sentiment is also seen in global XRP investment products, which recorded more than $30 million in net outflows during the week ending March 6.
Key XRP price levels to watch below $1.40
The XRP/USD pair continued to trade within a range, with $140 as resistance and $1.30 a key support level that the bulls must hold to prevent further downside.
The price is now retesting the bottom of the range, as shown in the chart below.
“If buyers step in here, we could see XRP rotate right back toward the top of the range again,” analysts at CryptoPulse said, adding:
“If this level breaks, the range structure starts to shift and price could look for lower levels.”

A key area of interest lies between $1.30 and the local low of $1.27 reached on Feb. 28. If the price loses this level, the next stop could be the Feb. 6 low of $1.13, which is also the 200-week exponential moving average (EMA).

On the upside, bulls are now focused on flipping the 200-week simple moving average (SMA) into support at $1.40.
Glassnode’s UTXO realized price distribution (URPD), which shows the average prices at which ETH holders bought their coins, shows an important level at the 200-week SMA, where investors acquired $1.28 billion in XRP.

As Cointelegraph reported, the XRP price could rally to $1.60 and then $1.95, if the support at $1.40 is reclaimed.
This article does not contain investment advice or recommendations. Every investment and trading move involves risk, and readers should conduct their own research when making a decision. While we strive to provide accurate and timely information, Cointelegraph does not guarantee the accuracy, completeness, or reliability of any information in this article. This article may contain forward-looking statements that are subject to risks and uncertainties. Cointelegraph will not be liable for any loss or damage arising from your reliance on this information.
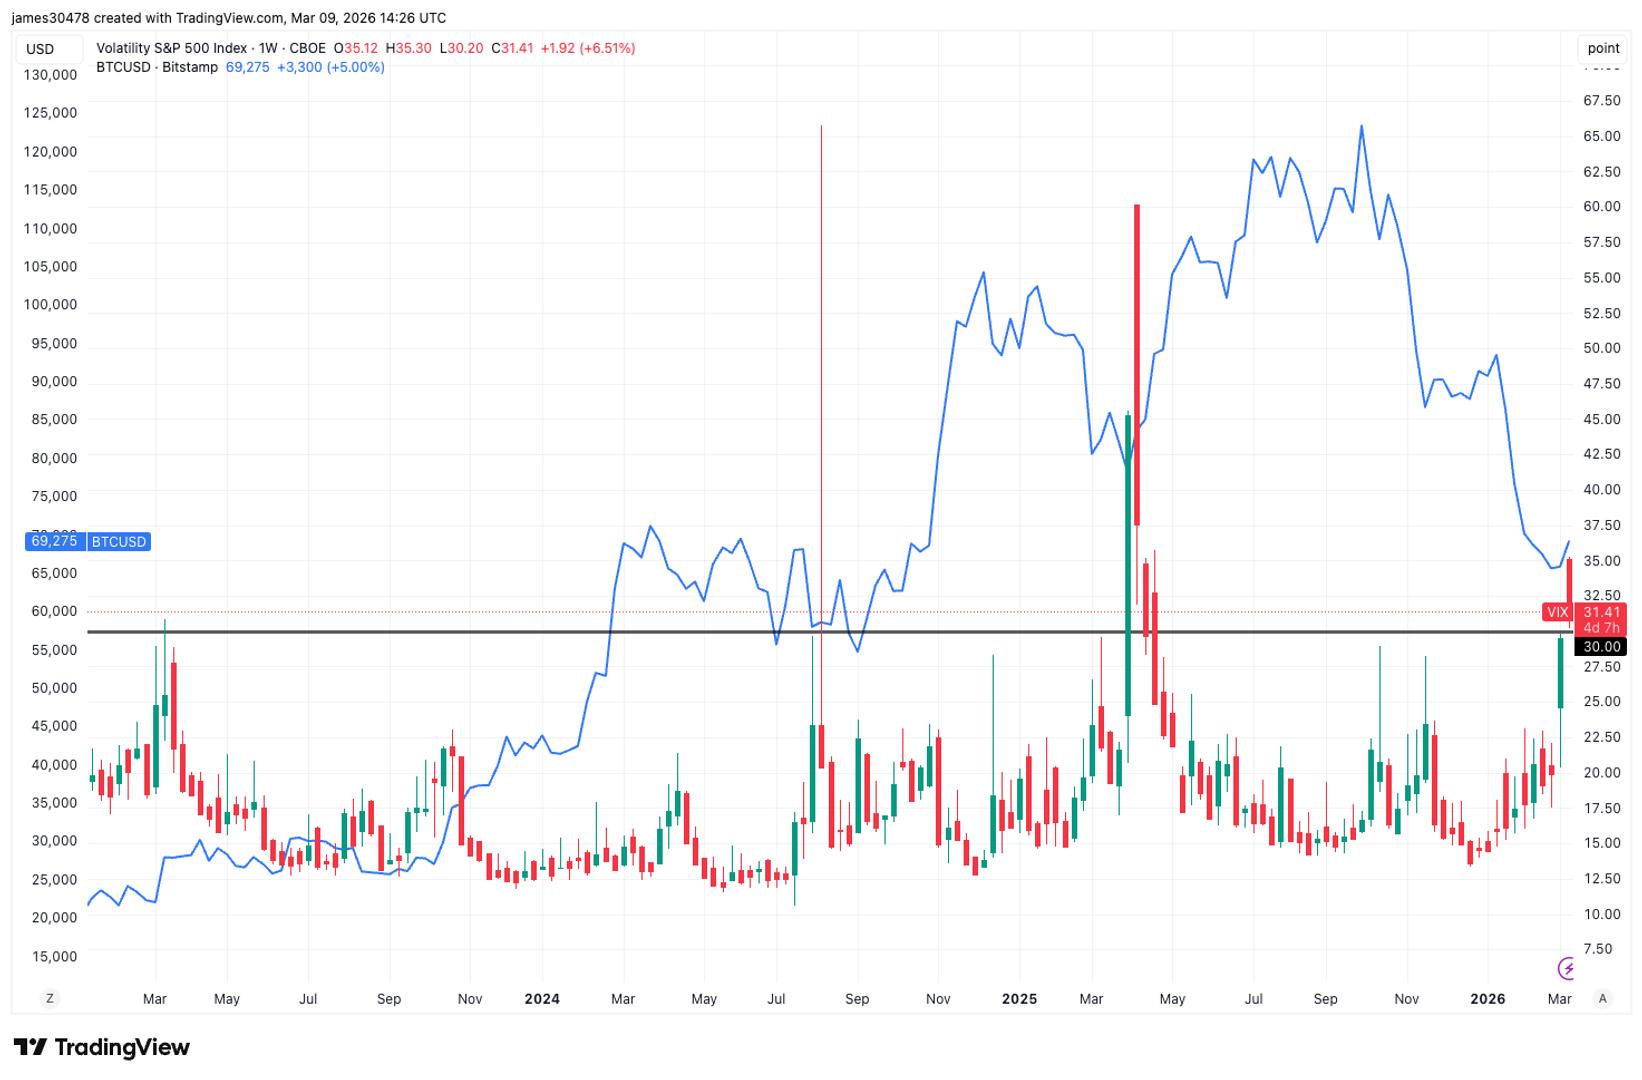

The VIX and bitcoin often move in opposite directions, with sharp spikes in the volatility index frequently coinciding with bitcoin local bottoms.
The CBOE Volatility Index (VIX), which measures expected volatility in the S&P 500 based on options pricing and is widely viewed as Wall Street’s “fear gauge”, jumped to its highest level in nearly a year, rising above 35. The surge signals growing panic across traditional markets.
The move came as global markets reacted to a spike in oil prices. WTI crude briefly surged to around $120 when futures opened Sunday, before retreating toward $100. The volatility has weighed on traditional safe havens and equities alike, with both U.S. stocks and gold falling.
Bitcoin, however, has diverged from that trend. The largest cryptocurrency is up roughly 5% over the past 24 hours and trading above $69,000.
Historically, bitcoin tends to bottom when the VIX spikes. During the tariff-driven market turmoil in April 2025, bitcoin found support near $75,000 as the VIX surged to around 60. In August 2024, the unwind of the yen carry trade pushed the VIX above 64 while bitcoin dropped to roughly $49,000. A similar pattern emerged during the Silicon Valley Bank crisis in March 2023, when the VIX briefly rose above 30 and bitcoin hit a local low near $20,000.
Bitcoin’s own volatility gauge suggests the crypto market has already experienced its panic phase. The Bitcoin Volmex Implied Volatility Index (BVIV), which measures expected price swings derived from bitcoin options pricing, spiked above 96 in early February when bitcoin briefly fell to $60,000, the highest level since the yen carry trade turmoil in August 2024. BVIV is now back just above 60.
That divergence could indicate crypto markets front-ran the stress now hitting traditional finance, though a VIX near 30 suggests volatility in traditional markets may not be finished yet.


Undercover US Homeland agents have reportedly purchased secret microwave weapons, capable of inflicting Havana Syndrome on their victims, one year after Bob Lax claimed his Amazon microwave was frying his brain.
News outlet 60 Minutes disclosed that the weapons were purchased from Russian criminal networks and that agents have been testing them at a military base for the past year on various animals.
The weapon is reportedly concealable, emits a beam of microwaves with rapid pulses, produces no heat, can penetrate walls, and has a range of several hundred feet.
Read more: ‘Microwave’ no longer searchable on X amid Bob Lax rumors
The software used for the weapon is key to its success, and 60 Minutes says vacationing FBI officials have been targeted with the weapon while taking their families out for dinner.
In footage described to the outlet, the family can be seen grabbing their heads in pain after a man with a backpack walks into the room.
Bob Lax said his head was fried by pulsing microwaves
In March 2025, Lax, real name Zachery Stuart, left an odd one-star review for a microwave he bought from Amazon. Stuart is a niche crypto celebrity who’s garnered a cultish following based on his ongoing “lore.”
In mostly incoherent sentences, Stuart described the microwave as a “Cuba weapon” that caused a “hum” in his skull and went “pulse pulse pulse.” On top of this, he claimed the microwave was linked to people watching him.
Oddly enough, the specific search phrase “microwave” couldn’t be loaded on X at the time of Stuart’s Amazon review went viral within crypto circles.
Read more: The ‘dead internet’ theory is getting a rebrand — meet Web 4.0
Stuart’s review is eerily similar to reported symptoms allegedly caused by the miniature weapon reportedly being tested in the US, but there’s also a chance the review may just have been mocking a poor-performing Amazon microwave.
Regardless, X users have been drawing parallels between 60 Minutes’ report and Stuart’s review, suggesting he was right and that he should be freed from jail.
He was imprisoned in August 2025 for battery and aggravated assault with a deadly weapon.
Evidence of microwave weapons builds up
60 Minutes previously reported in 2024 that top staff within the US government were suffering from the psychological illness Havana Syndrome.
Havana Syndrome is an unrecognized disease the symptoms of which include blurred vision, pain in the head, ringing ears, and nausea.
It’s been theorised that energy weapons are one of its causes, but studies have disputed whether or not the disease is the product of a moral panic regarding Russia and Cuba attacking the US.
In 60 Minutes’ 2024 report, US officials believed that they were targeted by Russia with a secret weapon that utilizes high-energy microwaves.
Read more: Bitcoin outperforms gold and oil in first days of US-Iran war
Now, Doctor David Relmond told 60 Minutes that Russian scientists have been perfecting the concept of microwave weapons for decades. He called it the ideal stealth weapon and described how it uses energy in “pulses” to incapacitate its victims.
“When you produce pulses like this, you can actually stimulate electrically active tissue, like brain tissue, and the heart for that matter, mimicking what the brain normally does, but now you’re driving it with your pulses from the outside,” he said.
Another secret weapon was teased by President Donald Trump back in February when the US overthrew Venezuela’s former leader, Nicolas Maduro. Trump called it a “discombobulator” and said that the weapon renders military equipment useless.
Got a tip? Send us an email securely via Protos Leaks. For more informed news and investigations, follow us on X, Bluesky, and Google News, or subscribe to our YouTube channel.

Key Highlights
- BMNR reaches $19.50 per share, powered by $10.3B in cryptocurrency and cash reserves.
- Company accumulates 4.535M ETH, controlling 3.76% of circulating supply.
- Ethereum staking operations yield $174M per year; MAVAN platform set for 2026 debut.
- Portfolio includes Bitcoin positions and high-potential technology ventures.
- Daily trading volume of $1B places BMNR among most liquid US stocks.
Bitmine Immersion Technologies, Inc. (BMNR) climbed to $19.50, gaining 3.20%, following the announcement of its comprehensive asset holdings totaling $10.3 billion in digital currencies and cash. The enterprise now commands 4.535 million Ethereum tokens, 195 Bitcoin units, and equity positions in high-growth technology companies. This substantial treasury establishes Bitmine as one of the world’s premier cryptocurrency asset holders.
Bitmine Immersion Technologies, Inc., BMNR
The company maintains $1.2 billion in liquid cash reserves, bolstering its digital asset portfolio and investment initiatives. A $200 million capital deployment in Beast Industries represents the firm’s largest strategic commitment. Additional positions include minority stakes in companies like Eightco Holdings.
Investor enthusiasm propelled BMNR shares to unprecedented trading levels. Recent five-day average dollar volume hit $1.0 billion daily. This performance establishes the equity among the top 130 most actively traded securities on US exchanges.
Ethereum Position Expands to 4.535 Million Tokens
Bitmine now manages 4,534,563 ETH tokens, accounting for 3.76% of Ethereum’s worldwide circulation. The enterprise accelerated its acquisition strategy with a recent purchase of 60,976 ETH. This expansion moves the company beyond 75% completion of its ambitious goal to control 5% of total ETH supply.
The organization has deployed 3,040,483 ETH into staking protocols, valued at $6.0 billion based on $1,965 per token pricing. Annual returns from staking operations currently exceed $174 million, outperforming most institutional cryptocurrency programs. Management anticipates the MAVAN staking platform rollout in early 2026, which should optimize staking efficiency.
This Ethereum treasury establishes Bitmine as the world’s dominant institutional ETH holder. The company outpaces competitors in crypto net asset value per share growth and trading accessibility. Its position exceeds numerous global institutional Ethereum allocations.
Bitcoin Allocation and High-Growth Technology Bets
Bitmine maintains 195 Bitcoin tokens, providing meaningful diversification across its digital currency holdings. The Bitcoin allocation works synergistically with its Ethereum-focused strategy and extended growth objectives. Together, these cryptocurrency positions amplify BMNR’s total blockchain market participation.
Recent capital deployments include a $200 million stake in Beast Industries and $14 million in Eightco Holdings. These speculative “moonshot” allocations focus on breakthrough technology enterprises. The investments seek to amplify aggregate portfolio performance and enhance competitive positioning.
Bitmine’s methodology combines cryptocurrency accumulation with cash reserves and venture capital stakes. The comprehensive portfolio valuation of $10.3 billion demonstrates substantial market presence. This multifaceted approach establishes the organization as a pioneer in diversified digital asset management.
Trading Liquidity and Market Performance
BMNR exhibits exceptional liquidity across American financial markets. Recent five-day average dollar volume of $1.0 billion positions it ahead of prominent airline and manufacturing stocks. This elevated liquidity ensures optimal investor participation and market effectiveness.
Share price momentum correlates with significant treasury expansion and staking program growth. Elevated trading volumes signal investor confidence in Bitmine’s diversified portfolio framework. The company maintains its status among the most actively traded cryptocurrency-related public equities.
BMNR’s asset base encompasses Ethereum, Bitcoin, cash holdings, and promising venture investments. This balanced composition accelerates both asset appreciation and market engagement. The stock’s trajectory confirms its position as a global leader in cryptocurrency treasury operations.


South Korean cryptocurrency exchange Bithumb has received a preliminary notice of sanctions that could lead to a six-month partial business suspension, local media reports.
The notice came from the Financial Services Commission’s Financial Intelligence Unit (FIU), which oversees anti-money laundering compliance for crypto firms under the Act on Reporting and Using Specified Financial Transaction Information.
Regulators said Bithumb continued transactions with overseas virtual asset businesses that were not registered in South Korea and failed to properly enforce certain Know Your Customer procedures. The FIU proposed a six-month partial suspension and disciplinary action against the exchange’s chief executive.
The restriction would apply only to virtual asset transfers by newly registered users. Existing customers would still be able to deposit and withdraw Korean won and cryptocurrencies and trade on the platform, according to the report.
The decision isn’t final and may change during a review process. The FIU plans to hold a sanctions deliberation committee later this month to determine the final penalty.
The case comes as South Korean regulators tighten oversight of digital asset platforms. LAst year, the FIU imposed a three-month partial suspension and a 35.2 billion won ($23.65 million) fine on Dunamu, the operator of Upbit, for similar compliance failures. Korbit received a similar 2.73 billion won fine and an institutional warning as well.
Founded in 2014, Bithumb is one of South Korea’s largest exchanges and ranks second in domestic trading volume behind Upbit according to CoinGecko data. Together with Coinone and Korbit, these platforms account for the vast majority of the crypto trading activity of exchanges registered in the country.
The sanctions come after last month Bithumb mistakenly distributed billions of dollars worth of bitcoin to users, prompting the country’s financial watchdog to step up oversight of cryptocurrency markets.
CoinDesk has reached out to Bithumb for comment but hasn’t heard back at the time of writing.
Crypto World
Mutuum Finance V1 Protocol crosses $200m TVL milestone with phase 3 of roadmap underway


Disclosure: This article does not represent investment advice. The content and materials featured on this page are for educational purposes only.
Mutuum Finance has surpassed $200m in total value locked on its V1 protocol testnet, marking a major milestone as the project advances through Phase 3 of its development roadmap.
Summary
- The V1 protocol on the Sepolia Testnet has exceeded $200M TVL, demonstrating the system’s capacity to manage large-scale simulated liquidity.
- The protocol uses mtTokens for yield-bearing deposits and Debt Tokens to track loans, enabling transparent decentralized lending.
- With over $20.7M raised and 19,000+ holders, the project plans dual lending markets and a buy-and-distribute staking mechanism for the MUTM token
Mutuum Finance (MUTM) has reached a new technical milestone. The project’s V1 Protocol has officially crossed $200 million in Total Value Locked (TVL) within its testnet environment. This growth comes as the project enters Phase 3 of its development roadmap, focusing on stress-testing its core financial engine before moving toward a full mainnet launch.
Currently, Mutuum Finance has raised over $20.7 million in funding and established a base of more than 19,000 individual holders. With the native MUTM token currently priced at $0.04. By reaching the $200 million TVL mark, the system has demonstrated its ability to manage large-scale liquidity and handle complex interest calculations in a simulated setting.
Mutuum Finance
The V1 Protocol serves as the functional foundation for the entire Mutuum Finance ecosystem. It is designed to allow users to interact with decentralized liquidity pools without the need for traditional intermediaries.
The system is currently being tested on the Sepolia network to ensure that all smart contracts perform accurately under high-volume conditions. By providing a risk-free environment for users to test these mechanics, the team aims to ensure a smooth transition to the live market.
The mtToken and debt token systems
One of the primary features of the V1 Protocol is the mtToken system, which manages how liquidity providers earn returns. When a user deposits an asset like ETH into a pool, they receive mtTokens (such as mtETH) as a digital receipt. These tokens are yield-bearing, meaning they grow in value relative to the original deposit as interest is collected from borrowers. For example, if a lender provides 100 ETH to a pool with a 10% Annual Percentage Yield (APY), their mtETH tokens will eventually be redeemable for 110 ETH.
Alongside yield generation, the protocol uses a Debt Token system to provide a transparent way to track outstanding loans. When a borrower takes out a loan, the system issues Debt Tokens to their account. If a user borrows $5,000 in USDT, their account shows 5,000 Debt-USDT. As interest accrues, this balance grows to reflect the total amount owed.
Automated risk management and one-click features
To maintain the safety of the protocol’s $200 million TVL, Mutuum Finance uses a strict Loan-to-Value (LTV) system. This requires all loans to be over-collateralized, meaning the value of the collateral must be higher than the amount borrowed. For instance, with an LTV of 75%, a borrower providing $10,000 in collateral can borrow up to $7,500. This setup benefits the borrower by giving them access to liquidity without forcing them to sell their digital assets, allowing them to keep their investment active.
The V1 Protocol also features Safe-Mode Borrow Presets, which are “one-click” tools designed to simplify risk management. Users can choose from three predefined risk profiles: Safe, Balanced, and Aggressive. Instead of manually calculating complex collateral ratios, these presets automatically adjust the borrowing capacity to maintain a healthy safety buffer. To prevent insolvency, an Automated Liquidator Bot monitors these positions in real-time, selling a portion of the collateral if its value drops too close to the debt level.
The Mutuum Finance roadmap
With Phase 3 now underway, the Mutuum Finance roadmap is focused on expanding the protocol’s utility and ensuring long-term sustainability. The project has already completed manual code audits with Halborn Security and maintains a 90/100 token scan score from CertiK.
A key part of the future roadmap is the development of a dual-market architecture. This includes a Peer-to-Contract (P2C) market for instant liquidity from automated pools, which is ideal for common assets like ETH or stablecoins.
Additionally, the team is building a Peer-to-Peer (P2P) marketplace where users can negotiate custom loan terms directly. This P2P model is designed for more unique or less liquid assets that require specific agreements like Dogecoin (DOGE) and Shiba Inu (SHIB). By offering both models, the protocol aims to serve everything from small retail loans to large-scale institutional credit lines.
Buy-and-distribute mechanism
To ensure the protocol remains self-sustaining, Mutuum Finance is planning a buy-and-distribute mechanism. Under this model, a portion of the fees generated from platform usage will be used to purchase MUTM tokens from the open market. These tokens are then redistributed to users who participate in staking within the Safety Module.
The Safety Module acts as a decentralized insurance fund that protects the protocol during extreme market volatility. By staking their interest-bearing mtTokens in this module, users provide a financial backstop for the network’s liquidity. In exchange for this support, they receive the MUTM tokens collected through the buy-and-distribute mechanism.
With $20.7 million raised and the V1 Protocol demonstrating the capacity to manage $200 million in total value locked (TVL), the project is entering a later phase of its roadmap. Its design includes automated risk management mechanisms, support for dual-market structures, and a reward model intended to be sustainable.
Disclosure: This content is provided by a third party. Neither crypto.news nor the author of this article endorses any product mentioned on this page. Users should conduct their own research before taking any action related to the company.
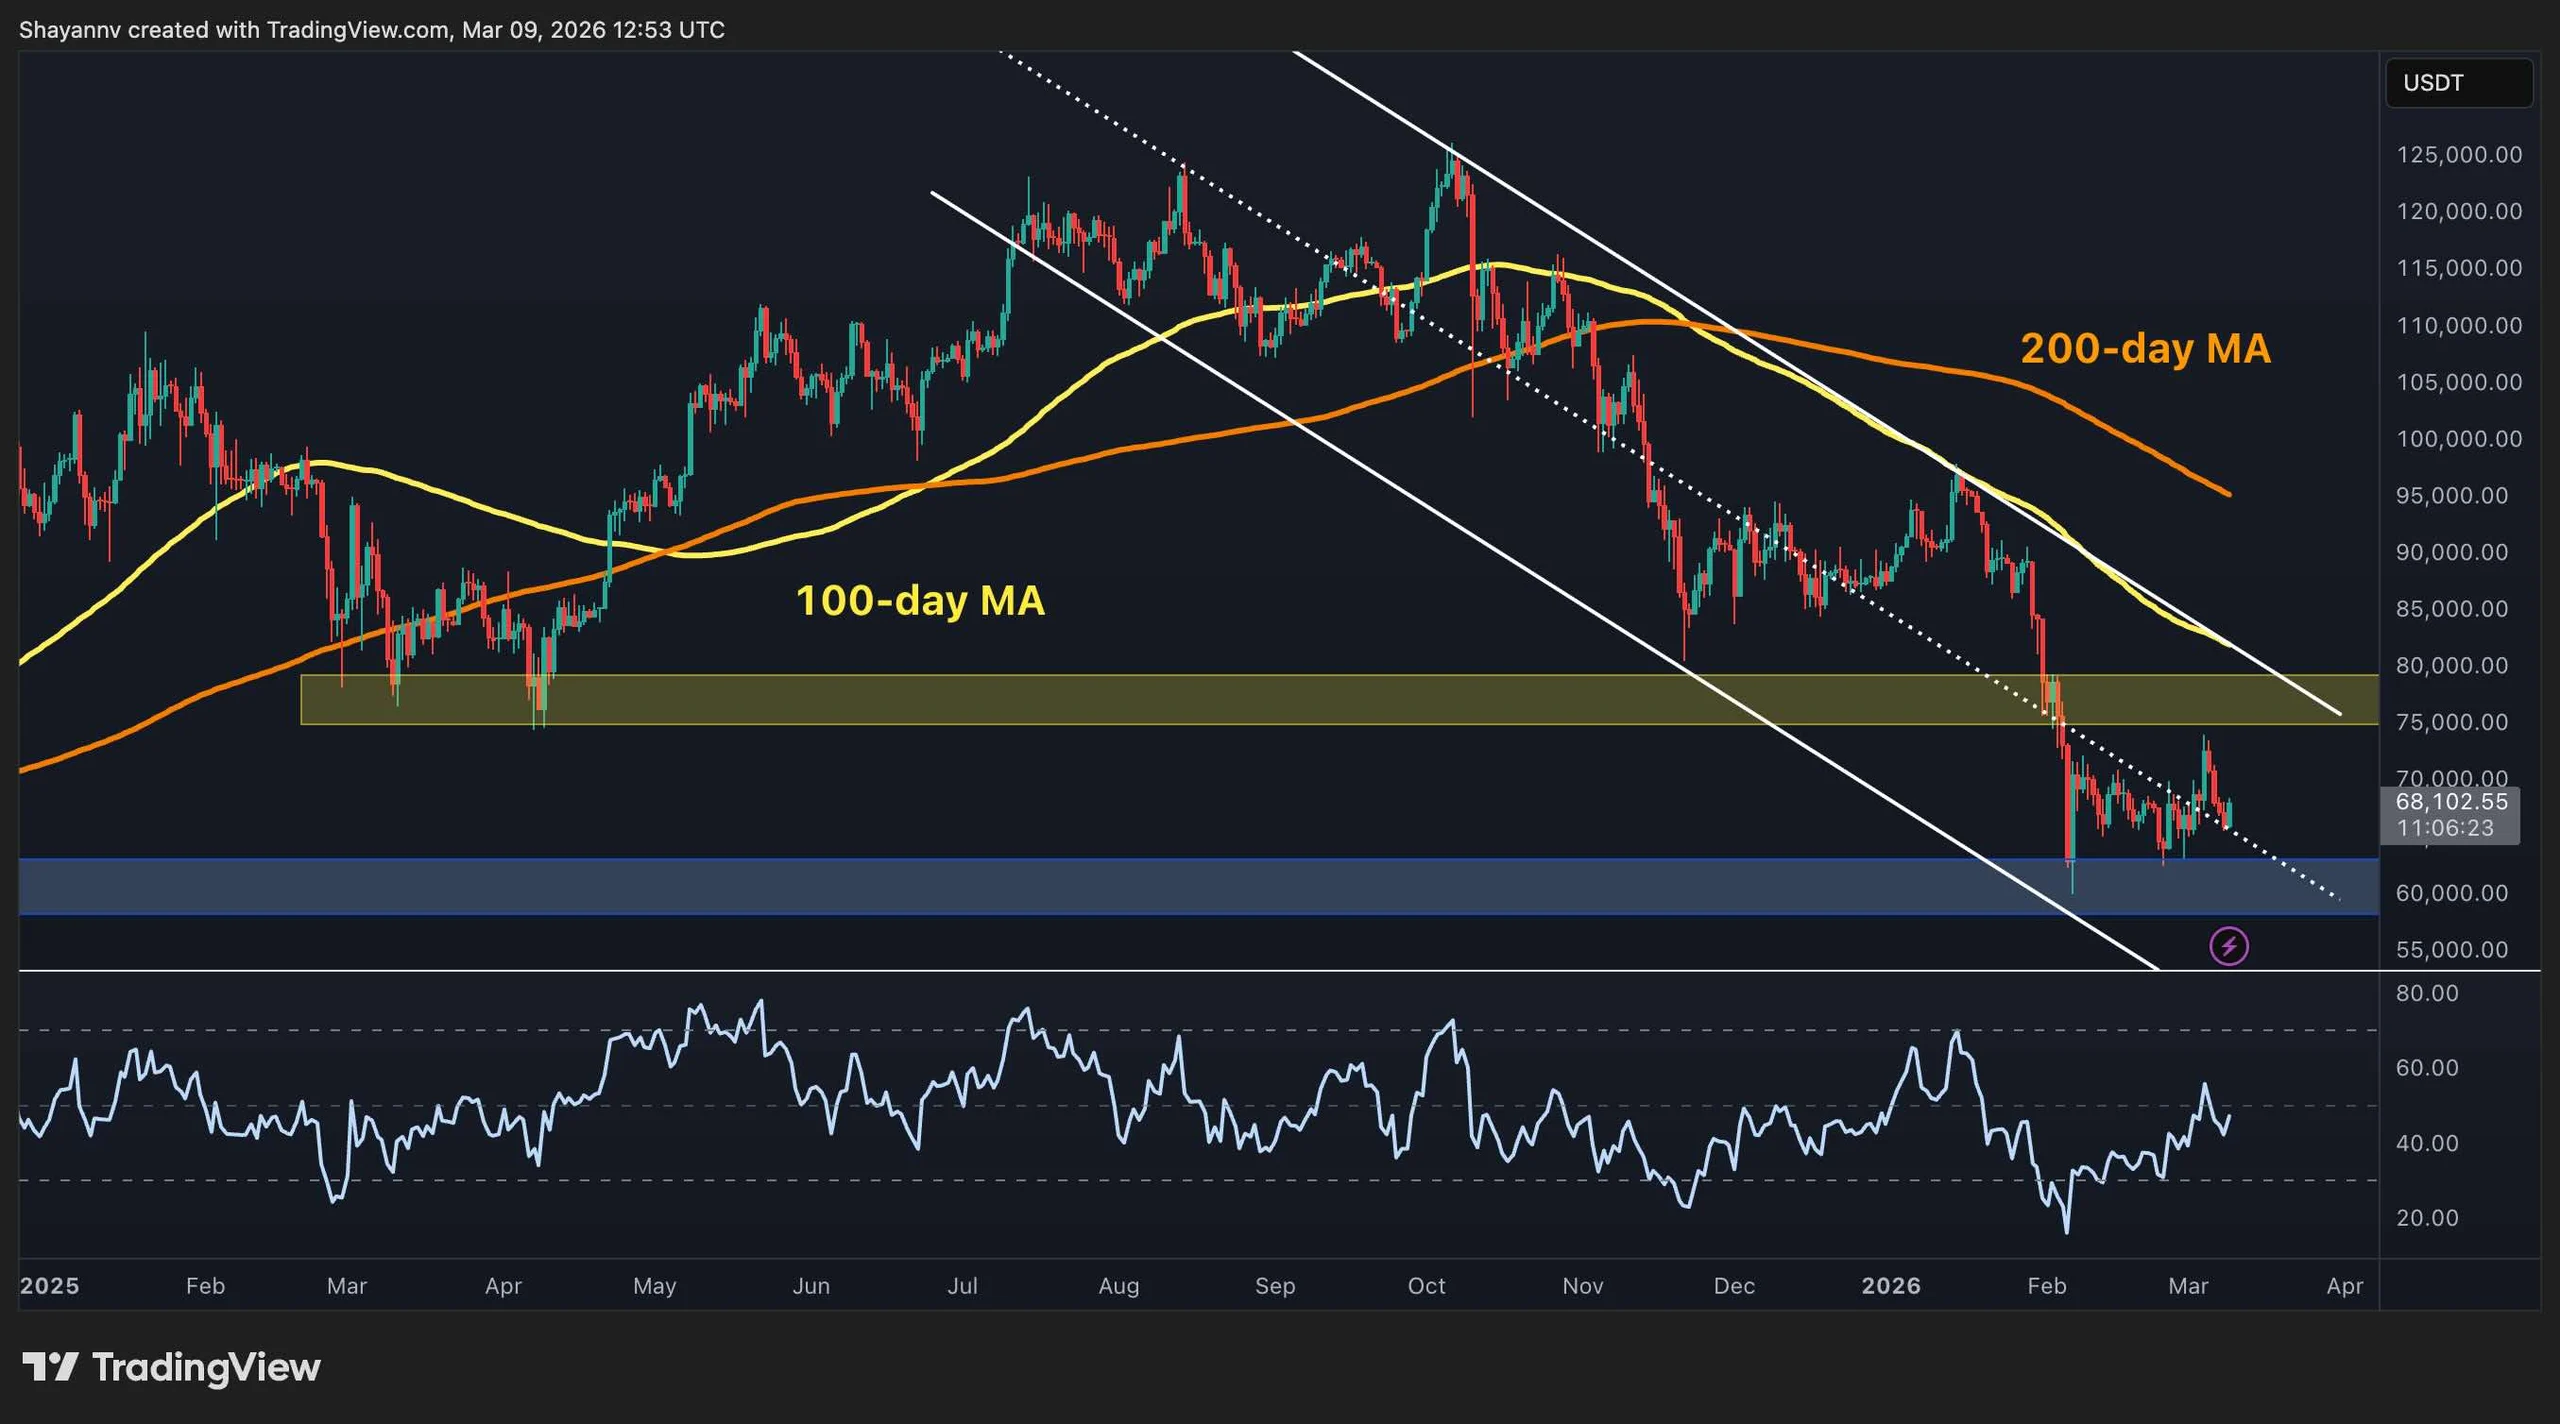
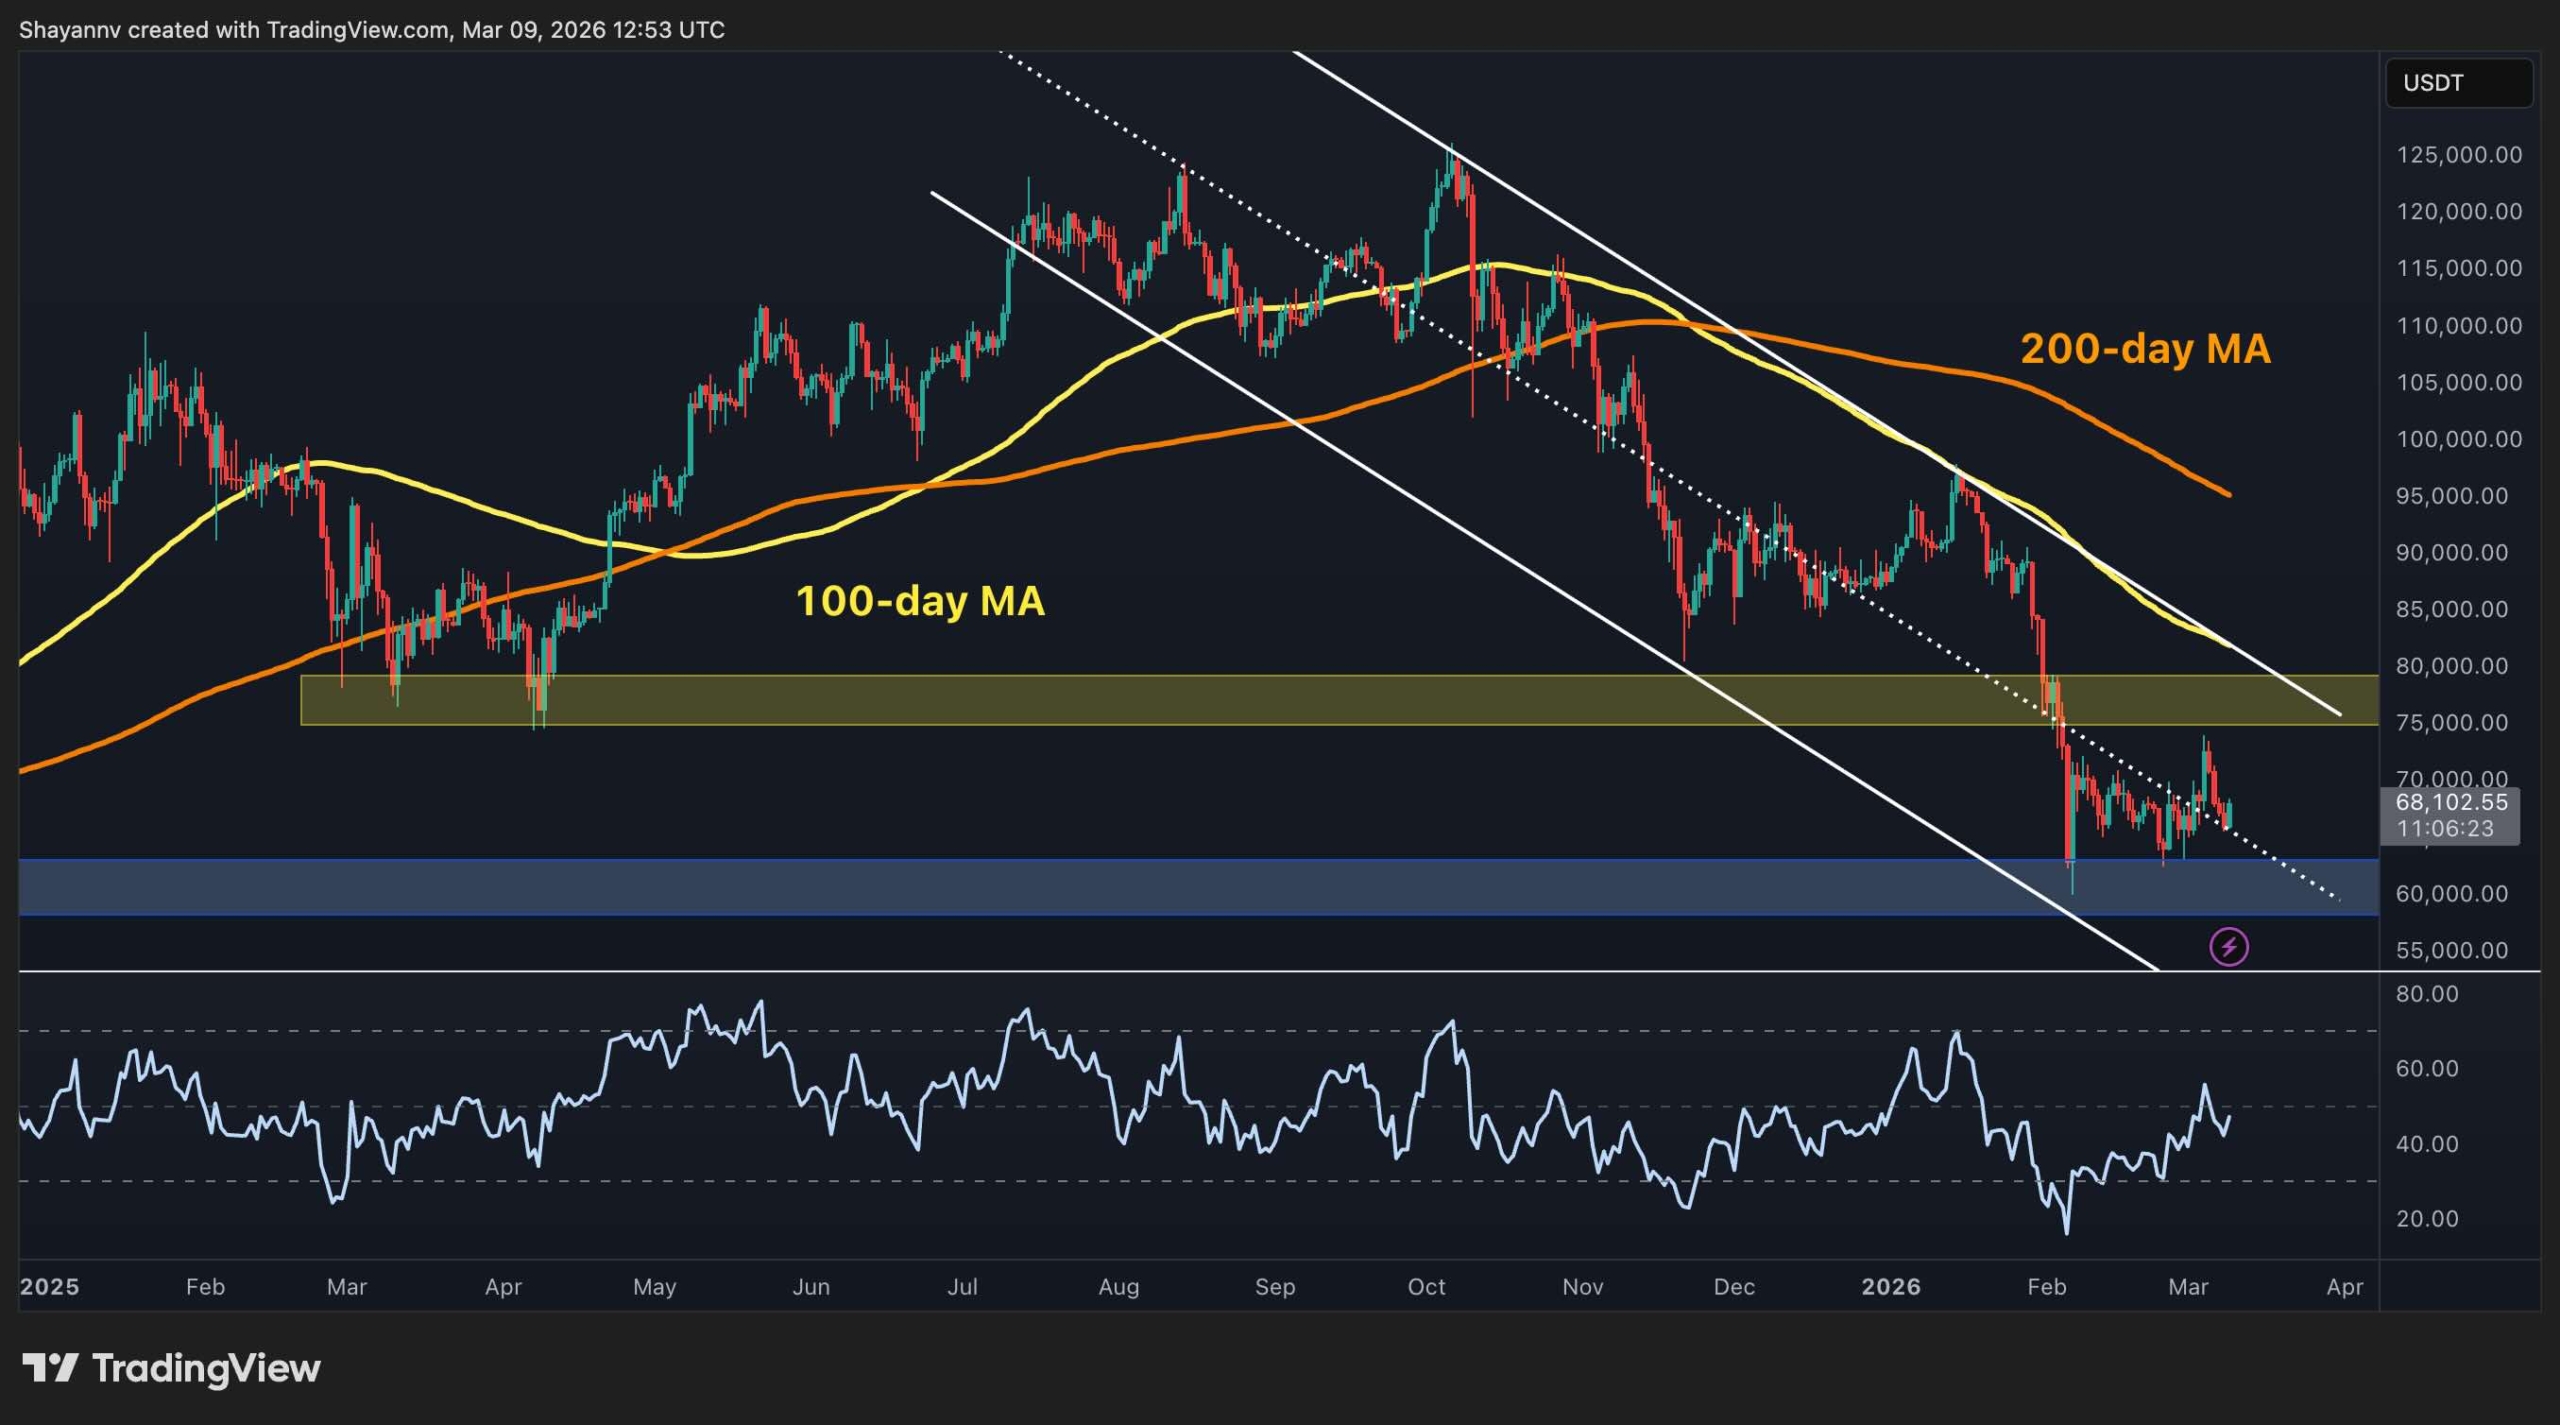
Bitcoin is still stuck in a broader bearish structure, but the latest bounce shows buyers are trying to keep the recent recovery alive above the key $60k area. Even so, the bigger trend remains fragile, with BTC still trading below major resistance levels on the higher timeframes.
Bitcoin Price Analysis: The Daily Chart
On the daily chart, BTC remains below both the 100-day and 200-day moving averages, which keeps the broader bias tilted to the downside. The price is also still trading inside the descending channel, indicating that the market has not yet confirmed a proper trend reversal.
The main support zone remains around $60k to $61k, which has already produced a reaction earlier in February. On the upside, the first major resistance sits around $75k to $80k. As long as BTC stays below that region, rallies are likely to be viewed as corrective rather than impulsive.
BTC/USDT 4-Hour Chart
On the 4-hour timeframe, Bitcoin continues to move inside a large flag pattern, suggesting that the recent advance is still a recovery structure. The asset is now hovering around $69,000 after once again failing to sustain a break above the upper boundary of the pattern near the $73,000 area.
Momentum is neutral for now, with RSI recovering from weaker levels but still not showing a decisive breakout. If buyers defend the $64k to $65k area, which coincides with the lower trendline of the flag, another push toward channel resistance remains possible. A breakdown below the lower boundary, however, could send BTC back toward the $60,000 zone, and potentially lower in the coming weeks.

On-Chain Analysis
From an on-chain perspective, the 30-day exponential moving average of the Exchange Whale Ratio has surged sharply, which usually signals that large holders have become more active in sending coins to exchanges recently. That tends to be a warning sign, as elevated whale inflows often increase the probability of sell-side pressure.
So while price is trying to stabilize in the short term, the on-chain backdrop remains cautious. In other words, the chart structure may still allow for a recovery bounce, but the rise in whale activity suggests that upside could remain capped unless this metric starts cooling off again.

Binance Free $600 (CryptoPotato Exclusive): Use this link to register a new account and receive $600 exclusive welcome offer on Binance (full details).
LIMITED OFFER for CryptoPotato readers at Bybit: Use this link to register and open a $500 FREE position on any coin!
Disclaimer: Information found on CryptoPotato is those of writers quoted. It does not represent the opinions of CryptoPotato on whether to buy, sell, or hold any investments. You are advised to conduct your own research before making any investment decisions. Use provided information at your own risk. See Disclaimer for more information.


The crypto market remains in a bear market, with Bitcoin and most altcoins falling by double digits from the all-time high.
Summary
- The crypto market is stuck in a technical bear market this month.
- Bitcoin has dropped by double digits from its all-time high.
- Donald Trump’s capitulation may trigger a crypto market rally.
Bitcoin (BTC) price is stuck at $67,000, down substantially from the all-time high of $126,300. The Ethereum (ETH) token has dropped to $2,000 from the all-time high of nearly $5,000.
The market capitalization of all tokens has dropped from the all-time high of $4.3 trillion to the current $2.34 trillion.
Still, two main catalysts may trigger the next crypto market rally. First, data shows that the Crypto Fear and Greed Index remains in the fear zone of 21.
In most cases, crypto prices often bounce back whenever this gauge is in the fear zone, as we experienced last year when it dropped to 10 after Trump announced new tariffs.
Crypto market rally to start when Trump capitulates
The other potential catalyst that may trigger a crypto market rally is that Donald Trump may capitulate on his war in Iran.
This capitulation will happen if the stock market continues falling and crude oil prices keep soaring.
Data shows that the Dow Jones Index has dropped by over 7% from its all-time high, and futures point to a 580-point drop.
Similarly, the S&P 500 Index has dropped by 4.9%, while the Nasdaq 100 has dropped by over 5% from its all-time highs.
Trump always pays close attention to the stock market, which he believes is a good gauge for his performance.
Therefore, if the stock market continues falling, he will likely capitulate and hint towards talks or ending the war.
He may also hint at completing his mission of killing Ayatollah Ali Khamenei, dismantling Iran’s nuclear and missile programs.
Trump may also capitulate because of the soaring crude oil prices, with Brent and West Texas Intermediate rising above the key support level at $100. Higher oil prices will push inflation higher this year and make it hard for the Federal Reserve to cut interest rates.
An end to the war will be bullish for the crypto market as we experienced on Wednesday last week when the New York Times reported that Iran had reached out to the United States for talks. Bitcoin and most altcoins jumped after that report and then pulled back after Iran disputed it.
Crypto World
Stablecoin payments platform KAST raises $80 million Series A at $600 million valuation


KAST, a stablecoin-powered financial platform focused on cross-border payments, raised $80 million in Series A funding led by QED Investors and Left Lane Capital, the company announced on Monday.
The company said it plans to use the funding to expand its product, invest in licensing and compliance and grow its team. KAST is building a platform that helps people and businesses move money across borders using stablecoins, allowing users to earn income globally, hold funds digitally, and spend locally through a single system.
Stablecoin activity has surged in recent years, with more than $35 trillion in transactions last year. However, only about 1% represented real-world payments such as remittances or payroll, according to McKinsey and Artemis Analytics, leaving significant room for new payment platforms to grow.
Peak XV Partners, HSG, and DST Global Partners also joined the early-stage funding round, which valued the company at $600 million, according to sources cited by Bloomberg.
In its press release, the company said it has reached more than 1 million users and processes about $5 billion in annualized transaction volume since launching 18 months ago. Revenue has doubled since the end of September 2025, it added.
KAST connects digital dollars with local payout systems in supported markets. The platform aims to reduce the time, cost and number of steps involved in sending money across borders.
“The latest funding reflects the confidence of leading investors in the stablecoin thesis and in KAST’s ability to execute it at global scale,” said Raagulan Pathy, founder and CEO of KAST.
KAST plans to expand across North America, Latin America and the Middle East. The company also plans to roll out KAST Business for payouts, payroll and cross-border spending.
“Stablecoin technology holds the potential to reshape the future of finance. We are thrilled to lead this round at KAST,” said Nigel Morris, co-founder and managing partner at QED Investors.


Bitcoin price has slipped below $70,000 as oil prices surge more than 60% this year amid rising tensions around the Strait of Hormuz, adding macro pressure to risk assets.
Summary
- Bitcoin trades near $69,984 after falling 3.8% in the past 24 hours, though it remains up about 7.8% over the week.
- Oil prices have surged more than 60% this year as tensions around the Strait of Hormuz raise concerns about supply disruptions and inflation.
- Rising short-term volatility suggests the Bitcoin market is entering a repositioning phase that could lead to a larger move in either direction.
Bitcoin (BTC) was trading at $69,984 at press time, down 3.8% over the past 24 hours as risk sentiment across financial markets softened. The pullback comes after a volatile week.
Despite the recent drop, Bitcoin is still up roughly 7.8% for the week and has fluctuated between $63,176 and $73,669 over the last seven days. However, the cryptocurrency is still trading about 44% below its all-time high of $126,080 in October 2025.
The most recent price fluctuations have increased activity in the derivatives market. Open interest rose 1.24% to $44.39 billion, while trading volume increased 57.9% to $67.26 billion, according to CoinGlass data.
The rise indicates that as global market uncertainty increases, traders are actively re-positioning their portfolios.
Oil surge raises macro pressure
A report published on March 9 by CryptoQuant analysts points to rising geopolitical tensions around the Strait of Hormuz as a potential headwind for Bitcoin and other risk assets.
Due to growing worries about supply disruptions, oil prices have risen by more than 60% since the beginning of the year. The Strait of Hormuz is a vital part of the world’s energy markets, accounting for about 20% of daily oil exports and nearly 35% of oil transported by sea.
If this restricted shipping route is disrupted, energy costs could increase significantly. An increase in oil prices, according to analysts, could worsen inflation and put pressure on financial markets, which are already susceptible to supply disruptions.
This kind of macro-environment has historically been difficult for Bitcoin. Sharp increases in oil prices often coincide with later stages of market cycles, when risk appetite starts to decline. Exposure to speculative assets like cryptocurrencies may be discouraged by increased geopolitical tension.
Volatility signals market re-positioning
Bitcoin’s volatility structure has changed noticeably in recent months, according to a separate analysis using data from the Binance BTC Volatility & Range Engine. There have been significant short-term fluctuations.
After rising above 1.5 in February before declining once more, the 7-day volatility measure was recently close to 0.72. These kinds of abrupt spikes typically occur during times of market stress and are frequently connected to significant portfolio adjustments or derivatives liquidations.
Longer-term volatility, however, has stayed relatively stable. The 30-day volatility sits around 0.50, while the 90-day measure is close to 0.57. This suggests that although short-term price swings have increased, the overall market structure has not entered an extreme volatility phase.
The Average True Range indicator currently stands near 0.054, pointing to a moderate trading range compared with past periods of intense market activity.
Taken together, the data suggest Bitcoin is going through a repositioning phase after its earlier rally. Buyers and sellers are still competing for control in the short term, which explains the recent spikes in volatility.
At the same time, longer-term volatility remains contained, indicating that the market has not yet entered a full panic or euphoria phase.

Seventh U.S. service member killed in Iran war identified as soldier, 26, from Kentucky

Synergy Flavors launches dairy flavors line

XRP Price Stays Below $1.40 With 60% of Supply Now in the Red


-

 Politics6 days ago
Alan Cumming Brands Baftas Ceremony A ‘Triggering S**tshow’
-
Business3 days ago
Form 8K Entergy Mississippi LLC For: 6 March
-

 Fashion3 days ago
Weekend Open Thread: Ann Taylor
-

 Tech4 days ago
Bitwarden adds support for passkey login on Windows 11
-
 Sports4 days ago
499 runs and 34 sixes later, India beat England to enter T20 World Cup final | Cricket News
-

 News Videos3 hours ago
10th Algebra | Financial Planning | Question Bank Solution | Board Exam 2026
-

 Sports2 days ago
Three share 2-shot lead entering final round in Hong Kong
-

 Sports1 day ago
Braveheart Lakshya downs Lai in epic battle to enter All England Open final | Other Sports News
-

 Tech7 days ago
Cynus Chess Robot: A Chess Board With A Robotic Arm
-

 Business6 days ago
Guthrie Disappearance Enters Fifth Week as Family Visits Memorial
-

 NewsBeat4 days ago
Piccadilly Circus just unveiled ‘London’s newest tourist attraction’ and it only costs 80p to enter
-

 Business21 hours ago
Search for Nancy Guthrie Enters 37th Day as FBI Probes Wi-Fi Jammer Theory
-

 Entertainment3 days ago
Hailey Bieber Poses For Sexy Selfies In New Luscious Lip Thirst Traps
-

 Politics3 days ago
Top Mamdani aide takes progressive project to the UK
-
 NewsBeat7 days ago
Handcuffed presenter Jonathan Ross’ sweet admission about marriage to wife of 38 years
-
 Sports6 days ago
Jack Grealish posts new injury update as Man City star enters crucial period
-

 Crypto World5 days ago
New Crypto Mutuum Finance (MUTM) Reports V1 Protocol Progress as Roadmap Enters Phase 3
-

 Tech4 days ago
ACIP To Discuss COVID ‘Vaccine Injuries’ Next Month, Despite That Not Being In Its Purview
-
Entertainment5 days ago
Harry Styles Has ‘Struggled’ to Discuss Liam Payne’s Death
-
 NewsBeat4 days ago
Good Morning Britain fans delighted as Welsh presenter returns to host ITV show