Crypto World
Can 2 Weeks of XRP ETF Buying Delay the 18% Price Breakdown?

XRP (XRP) price is setting up for an 18.81% breakdown on the 8-hour chart, but weakening sell-side volume and steady ETF inflows are delaying the move.
The signal comes from a hidden bearish divergence that flashed during the bearish pattern formation, now compounded by long-term holder capitulation. However, a mismatch between retail holders and institutional buyers is keeping the price propped up near key resistance.
Hidden Bearish Divergence Sets the Stage for Downtrend Resumption
XRP (XRP) price traded at $1.41 on April 23, slightly down on the 8-hour timeframe and broadly flat across weekly and monthly windows. The shorter timeframe reveals what the longer ones mask.
Between March 23 and April 22, price made a minor lower high while the Relative Strength Index (RSI), a momentum indicator, which made a higher high. In a broader downtrend, this setup is a hidden bearish divergence. It signals that the corrective bounce is losing momentum even as price pushes higher, suggesting the downtrend is set to resume.
The divergence appeared as XRP sits inside a head-and-shoulders structure, a bearish reversal pattern. The right shoulder topped on April 17. However, the timing of the breakdown depends on whether the selling pressure has enough strength to drive the move immediately, which the next chart addresses.
Sell-side pressure has been fading exactly when the bearish structure needs it most. Between April 12 and April 23, the red volume bars on the 8-hour chart trended lower as XRP price trended higher.

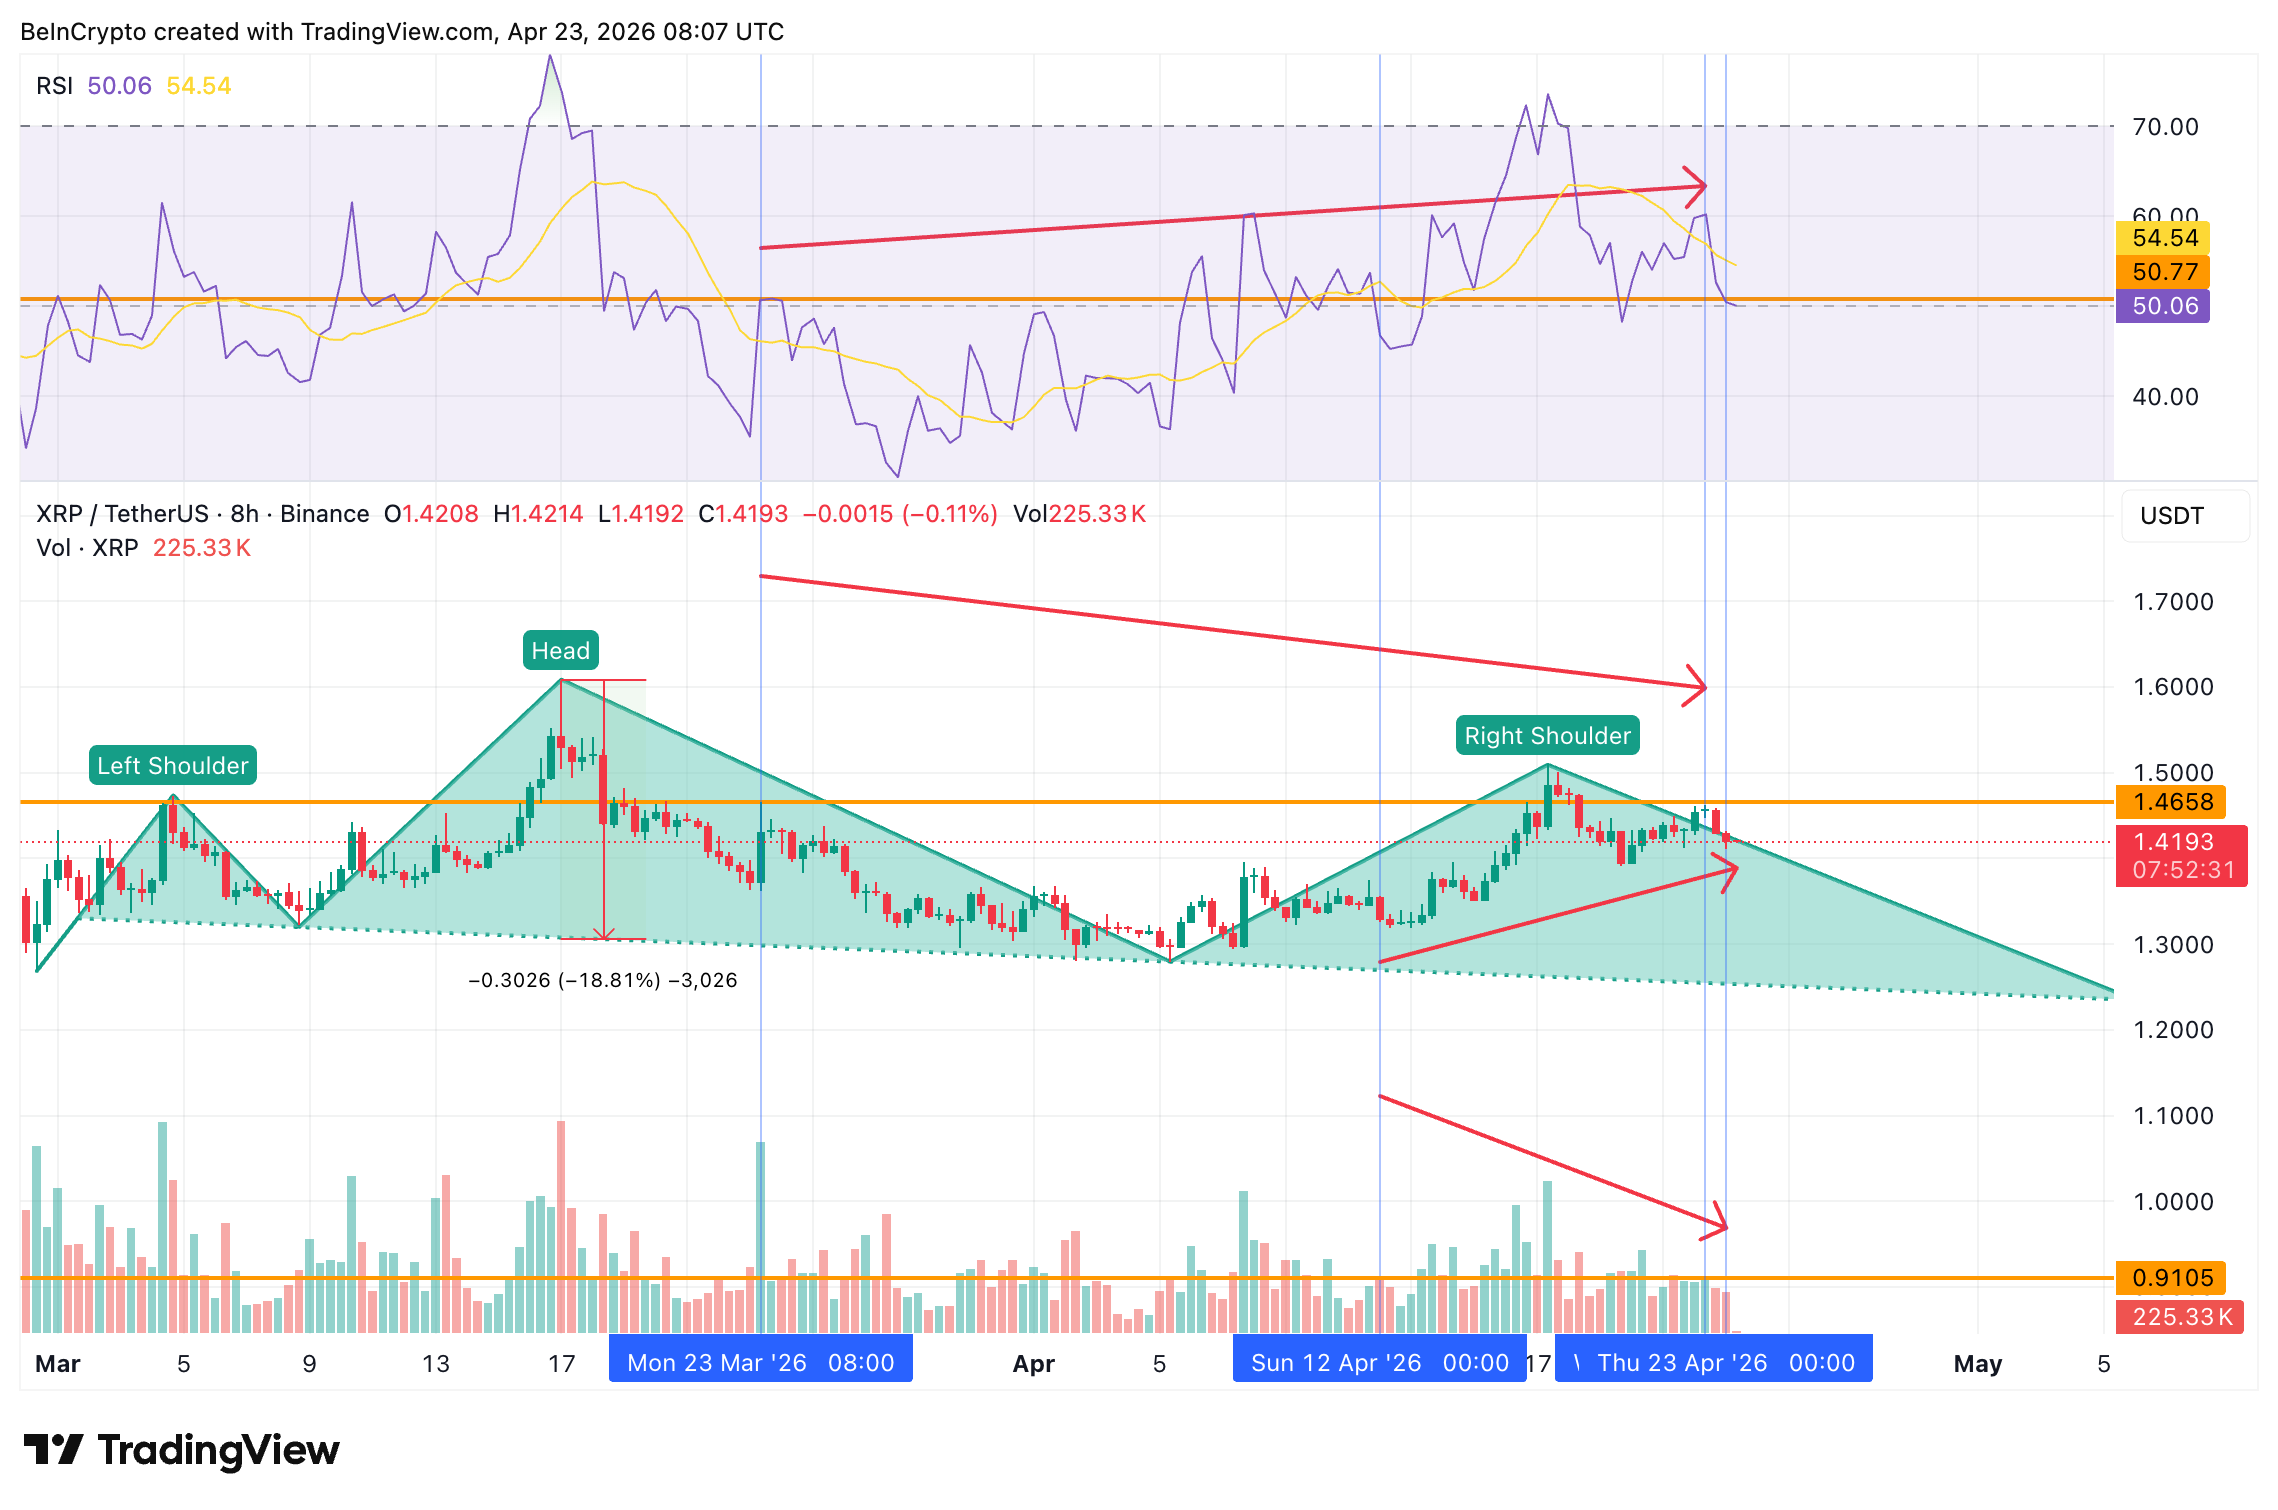
The fading XRP volume on the sell side shows the pullback could be running out of steam yet. The implication is a delayed breakdown rather than an invalidated one. The pattern stays intact, but the 18.81% measured move will have to wait for sell pressure to re-accelerate.
This creates a near-term stalemate. The structural case and momentum divergence both say breakdown, but the volume tape says not right now. Whether hodler and institutional flows confirm or override the volume signal determines the next move.
Long-Term Hodlers Capitulate as ETFs Keep Buying
On-chain data shows a split between XRP hodlers and institutional buyers. According to Glassnode, the hodler net position change sat at 260,176,113 XRP on April 12. By April 22, it had dropped to 149,050,480 XRP. That is a decline of roughly 42.7% in ten days, reflecting long-term holders (155 days or more) trimming positions.
Want more token insights like this? Sign up for Editor Harsh Notariya’s Daily Crypto Newsletter here.

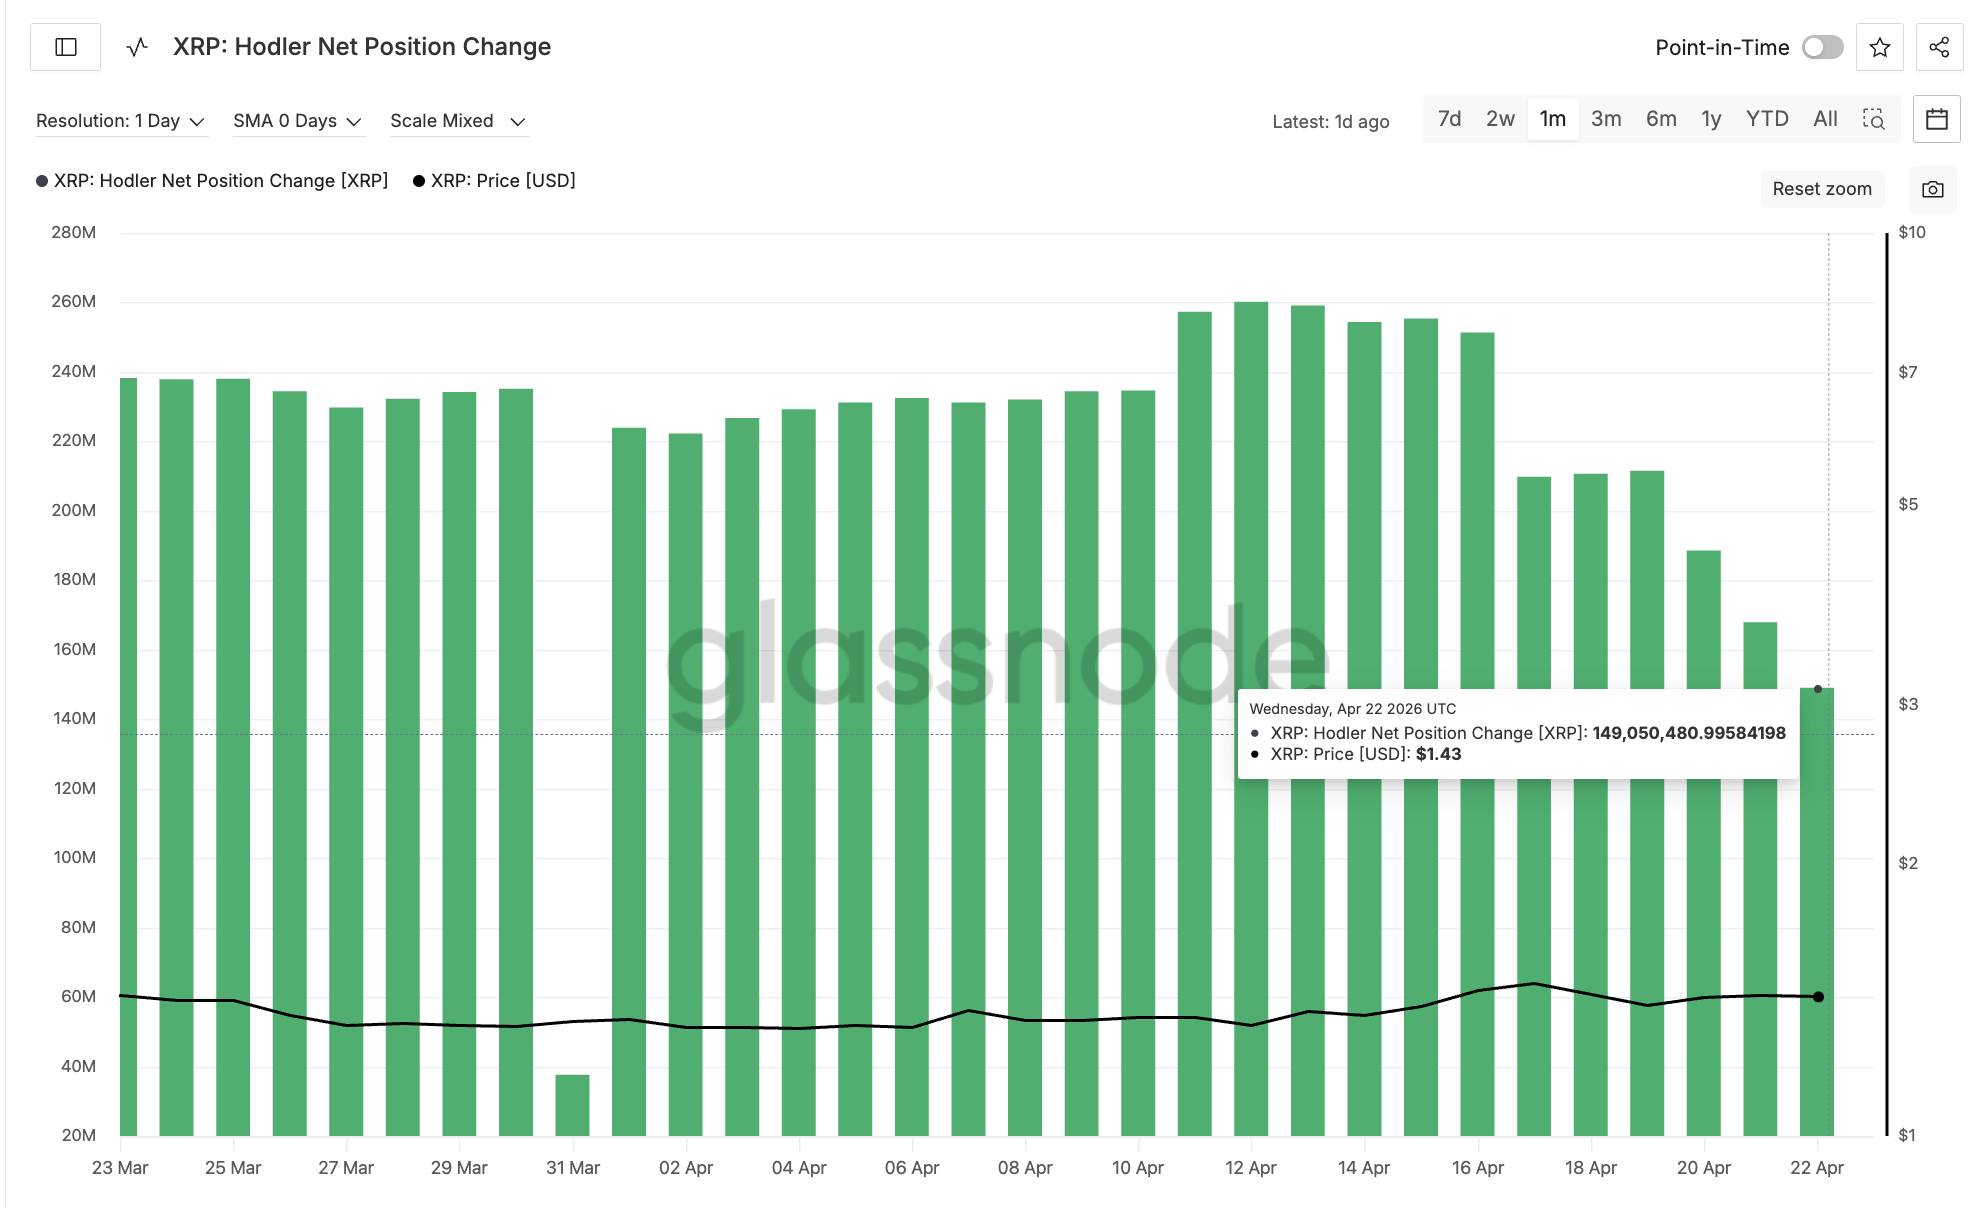
The hodler distribution started before the right shoulder formed on April 17. The timing suggests long-term holders were already losing confidence in the bounce.
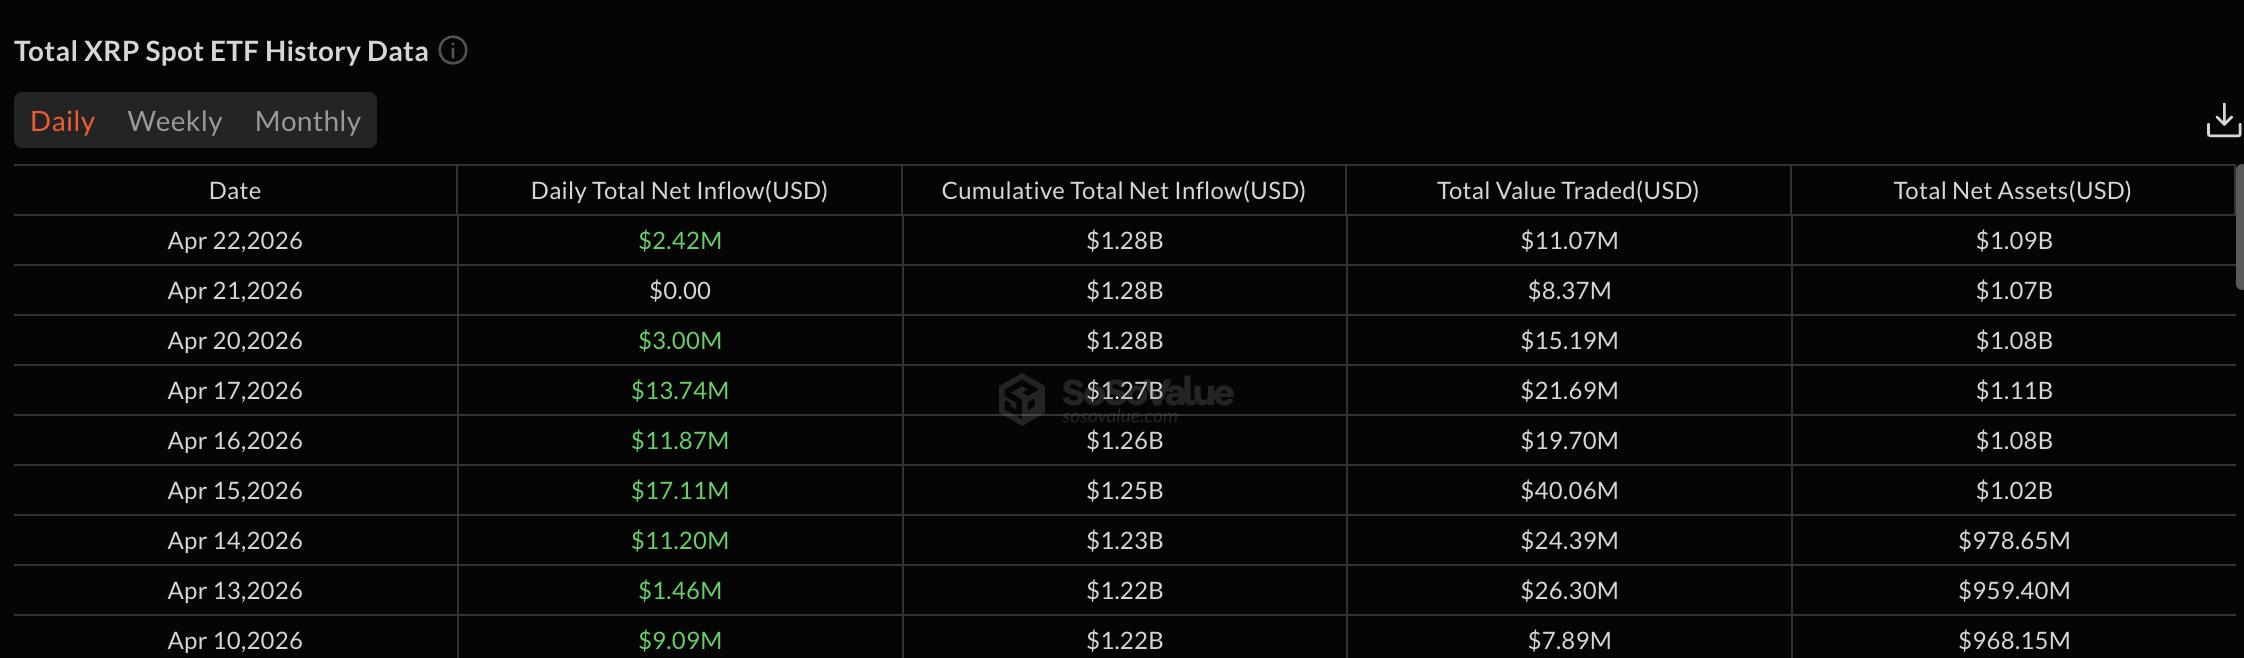
However, institutional buyers saw it differently. US spot XRP ETF products have logged net inflows on 8 of the last 9 trading days, a run that spans nearly two weeks since April 10.
The only exception was a flat session on April 21 with zero net flow, meaning there were no outflows during the entire window. The data suggests steady accumulation through the same period hodlers were distributing. April 17 alone saw $13.74 million in inflows, followed by $3 million on April 20 and $2.42 million on April 22.

The disjoint matters. Retail long-term holders are betting on the pattern breakdown, while institutional flow is betting the bounce extends. The XRP price chart will eventually vindicate one side over the other.
XRP Price Levels That Resolve the Tension
The XRP price chart lays out the full decision zone. XRP has already lost the 0.236 Fibonacci level at $1.43, which served as the immediate bounce cap. Below it, the 0.382 Fib at $1.38 and the 0.5 Fib at $1.34 are the first downside tests.
The key decision level sits at $1.30, the 0.618 Fib. A daily close below this level clears the path toward $1.25 (0.786 Fib) and triggers the measured move projection. The measured move from the right shoulder points to $1.18 initially, with extension to $1.01, representing an 18.81% decline from the breakdown point.
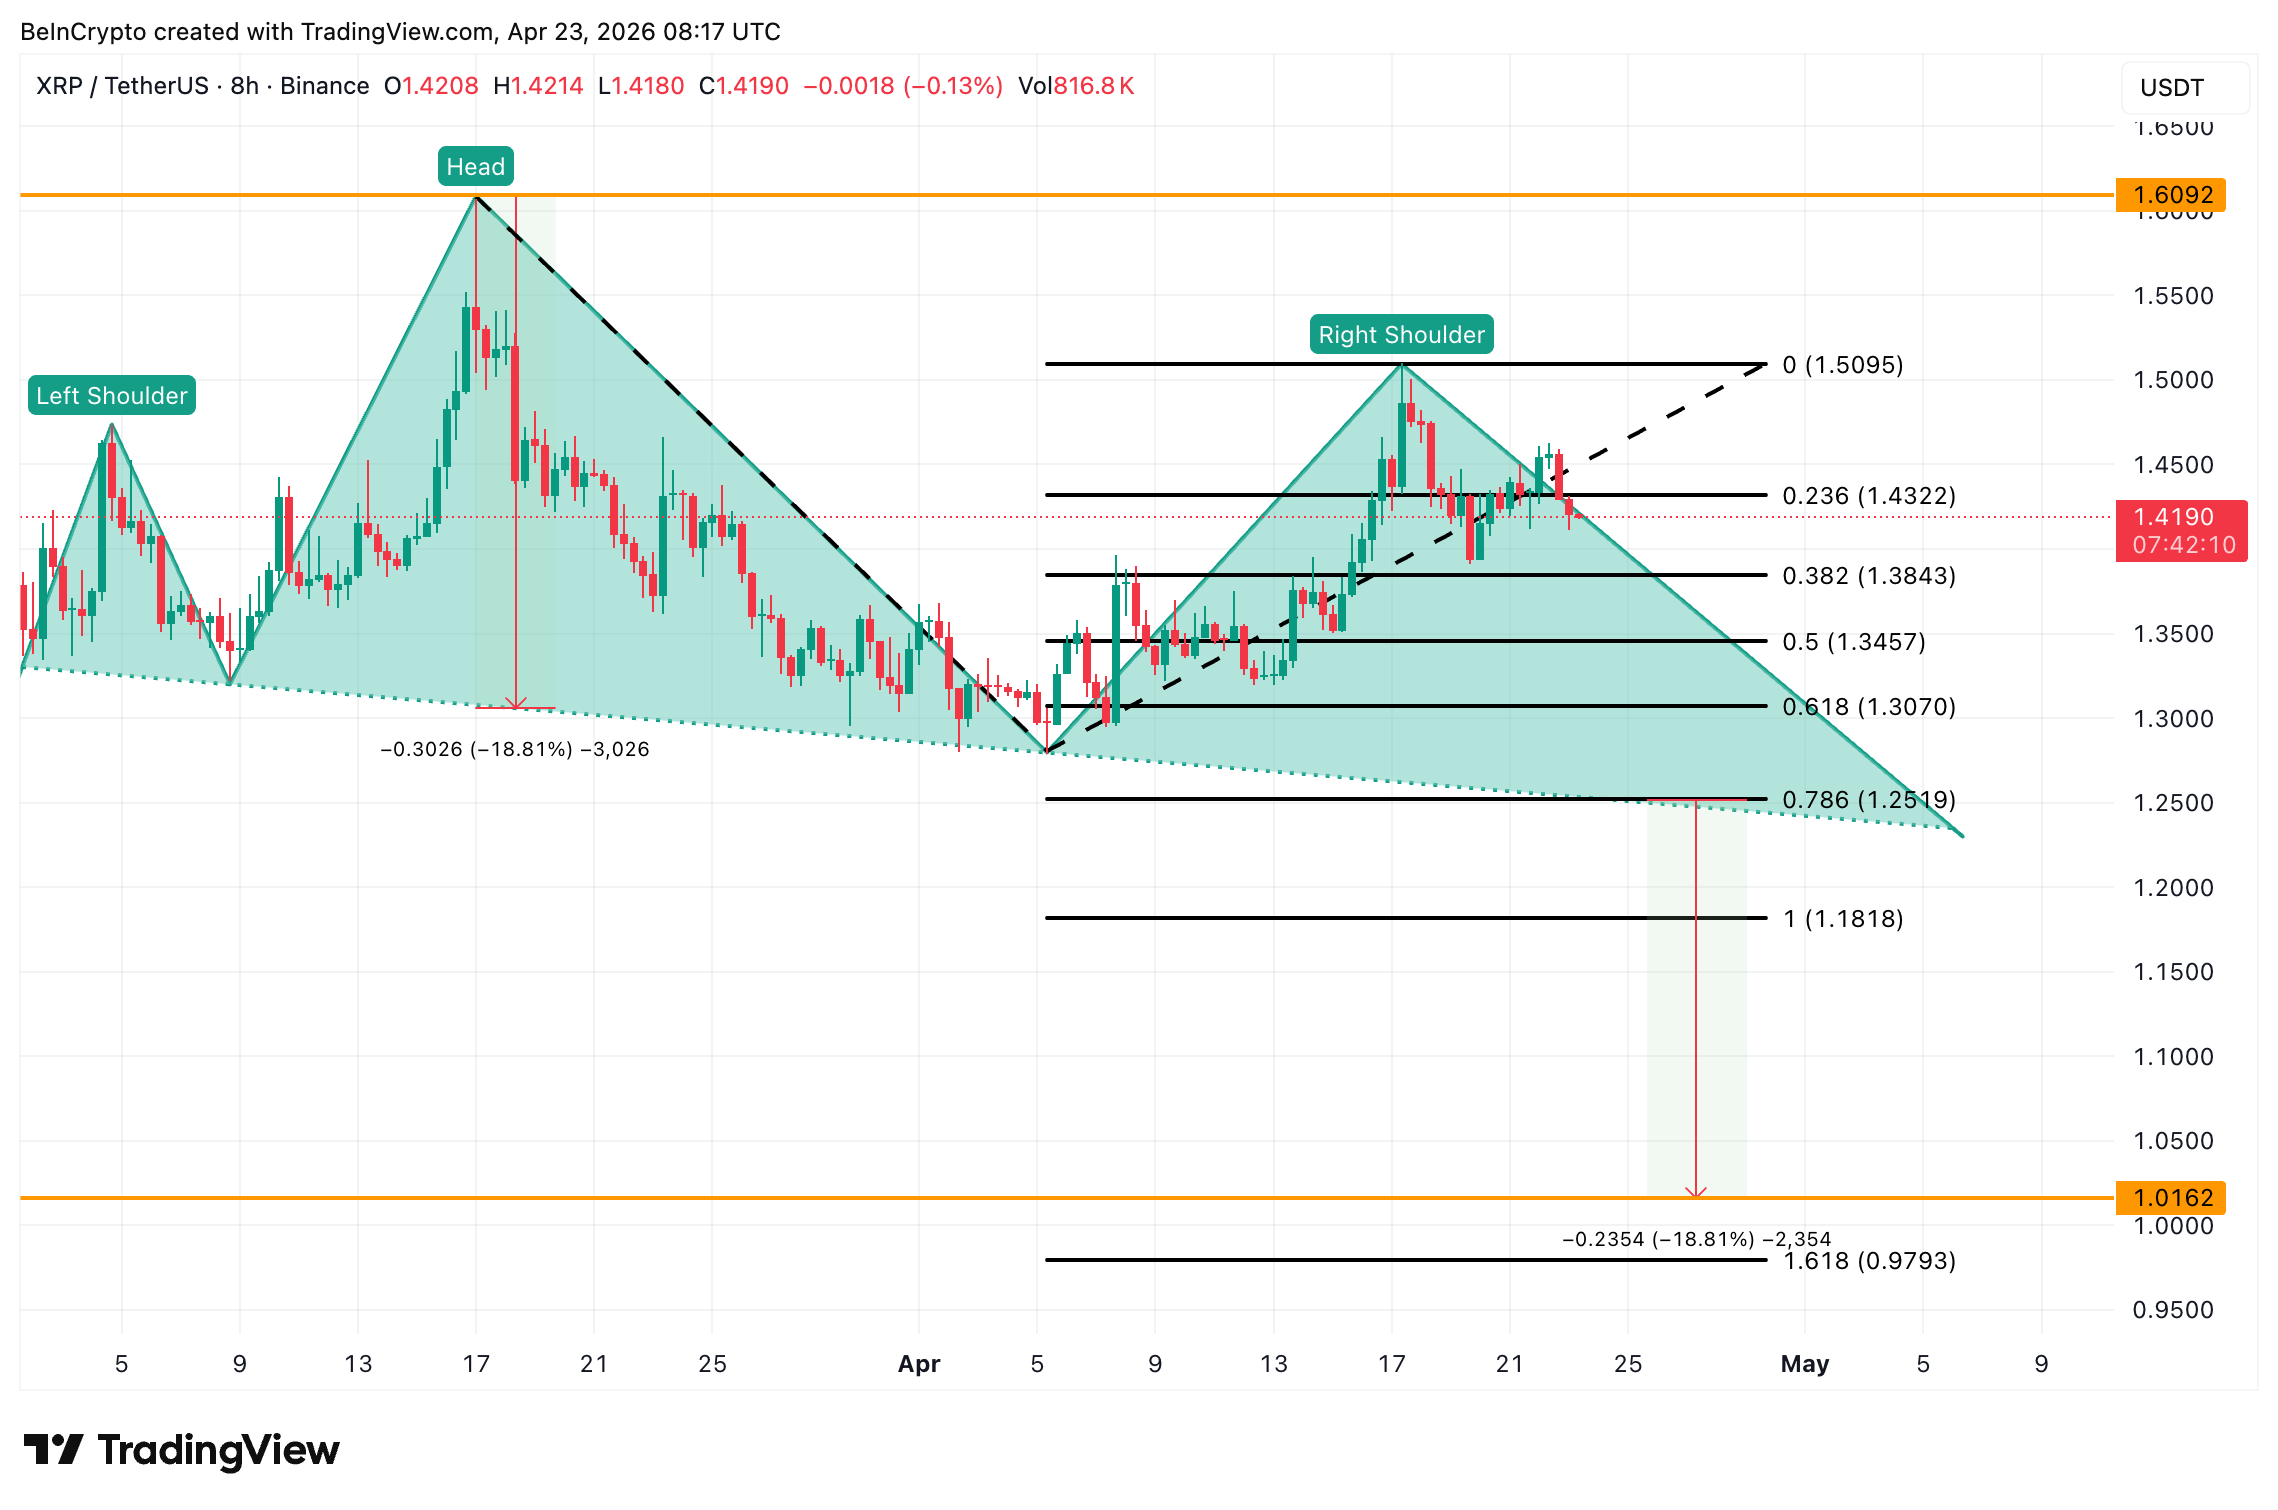
For invalidation, XRP needs to reclaim the right shoulder cap at $1.50 on the 8-hour close. A move above $1.60, the head peak, would fully invalidate the bearish structure and align with the ETF thesis.
The $1.30 level separates a shallow pullback supported by fading sell pressure and ETF demand from a deeper 18.81% flush toward $1.01 if hodler capitulation spreads.
The post Can 2 Weeks of XRP ETF Buying Delay the 18% Price Breakdown? appeared first on BeInCrypto.
You must be logged in to post a comment Login