
Crypto World
Can Ethereum price defend $1,900 as bearish pressure builds?

Ethereum’s correction appears to be accelerating, with price sliding toward the critical $1,900 support level and futures sentiment hitting its most bearish reading in three months.
Summary
- Ethereum price is under pressure across all major timeframes, with structure still tilted to the downside.
- Futures traders are increasingly defensive, as aggressive selling begins to dominate derivatives flows.
- The $1,900 level now stands as a pivotal support; holding it could stabilize price, while a break may accelerate losses.
At press time, Ethereum was changing hands at $1,958, marking a 6.4% drop in the last 24 hours as continued selling dragged prices lower. Over the past week, the coin has fluctuated between $1,907 and $2,129, but it has stayed under pressure across every major timeframe.
In the last seven days, Ethereum (ETH) has slipped 6.3%. The losses deepen when you zoom out. It is down 40% over the past month and 27% compared with a year ago, showing how strong and persistent this correction has been.
Trading activity in the spot market picked up as prices fell. During the sell-off, 24-hour volume jumped 34% to reach $31 billion, suggesting that more traders stepped in while the price tested important support levels.
Derivatives, on the other hand, tells a more cautious story, pointing to a market that remains on edge. As per CoinGlass data, derivatives volume rose 18% to $40 billion while open interest dropped 7% to $23 billion. This combination suggests that traders are closing positions into volatility rather than adding fresh leverage.
Futures sentiment flips extremely bearish
Additional pressure is coming from longer-term derivatives sentiment. A Feb. 15 analysis by CryptoQuant contributor CryptoOnchain revealed a notable shift in futures behavior on Binance. The Ethereum Taker Buy/Sell Ratio (30-day moving average) has dropped to 0.97, its lowest reading since November 2025.
When this ratio drops below 1.00, it shows that aggressive sell orders are outpacing aggressive buys. Using a 30-day average helps filter out daily fluctuations, turning this into a structural signal rather than a short-term reaction.
At the current levels, the data indicate that futures traders have been leaning on the sell side for several weeks, either hedging their exposure or taking a defensive stance as prices weaken.
If spot market demand is unable to absorb the supply close to support, this ongoing imbalance raises the possibility of prolonged consolidation or additional losses, but it does not guarantee that prices will continue to decline right away.
Ethereum price technical analysis
Ethereum is still clearly in a downward trend. Since late December, there have been consistently lower highs and lower lows, suggesting that the correction is still ongoing. Sellers continue to dominate the market, as shown by the price remaining below the 20-day moving average.
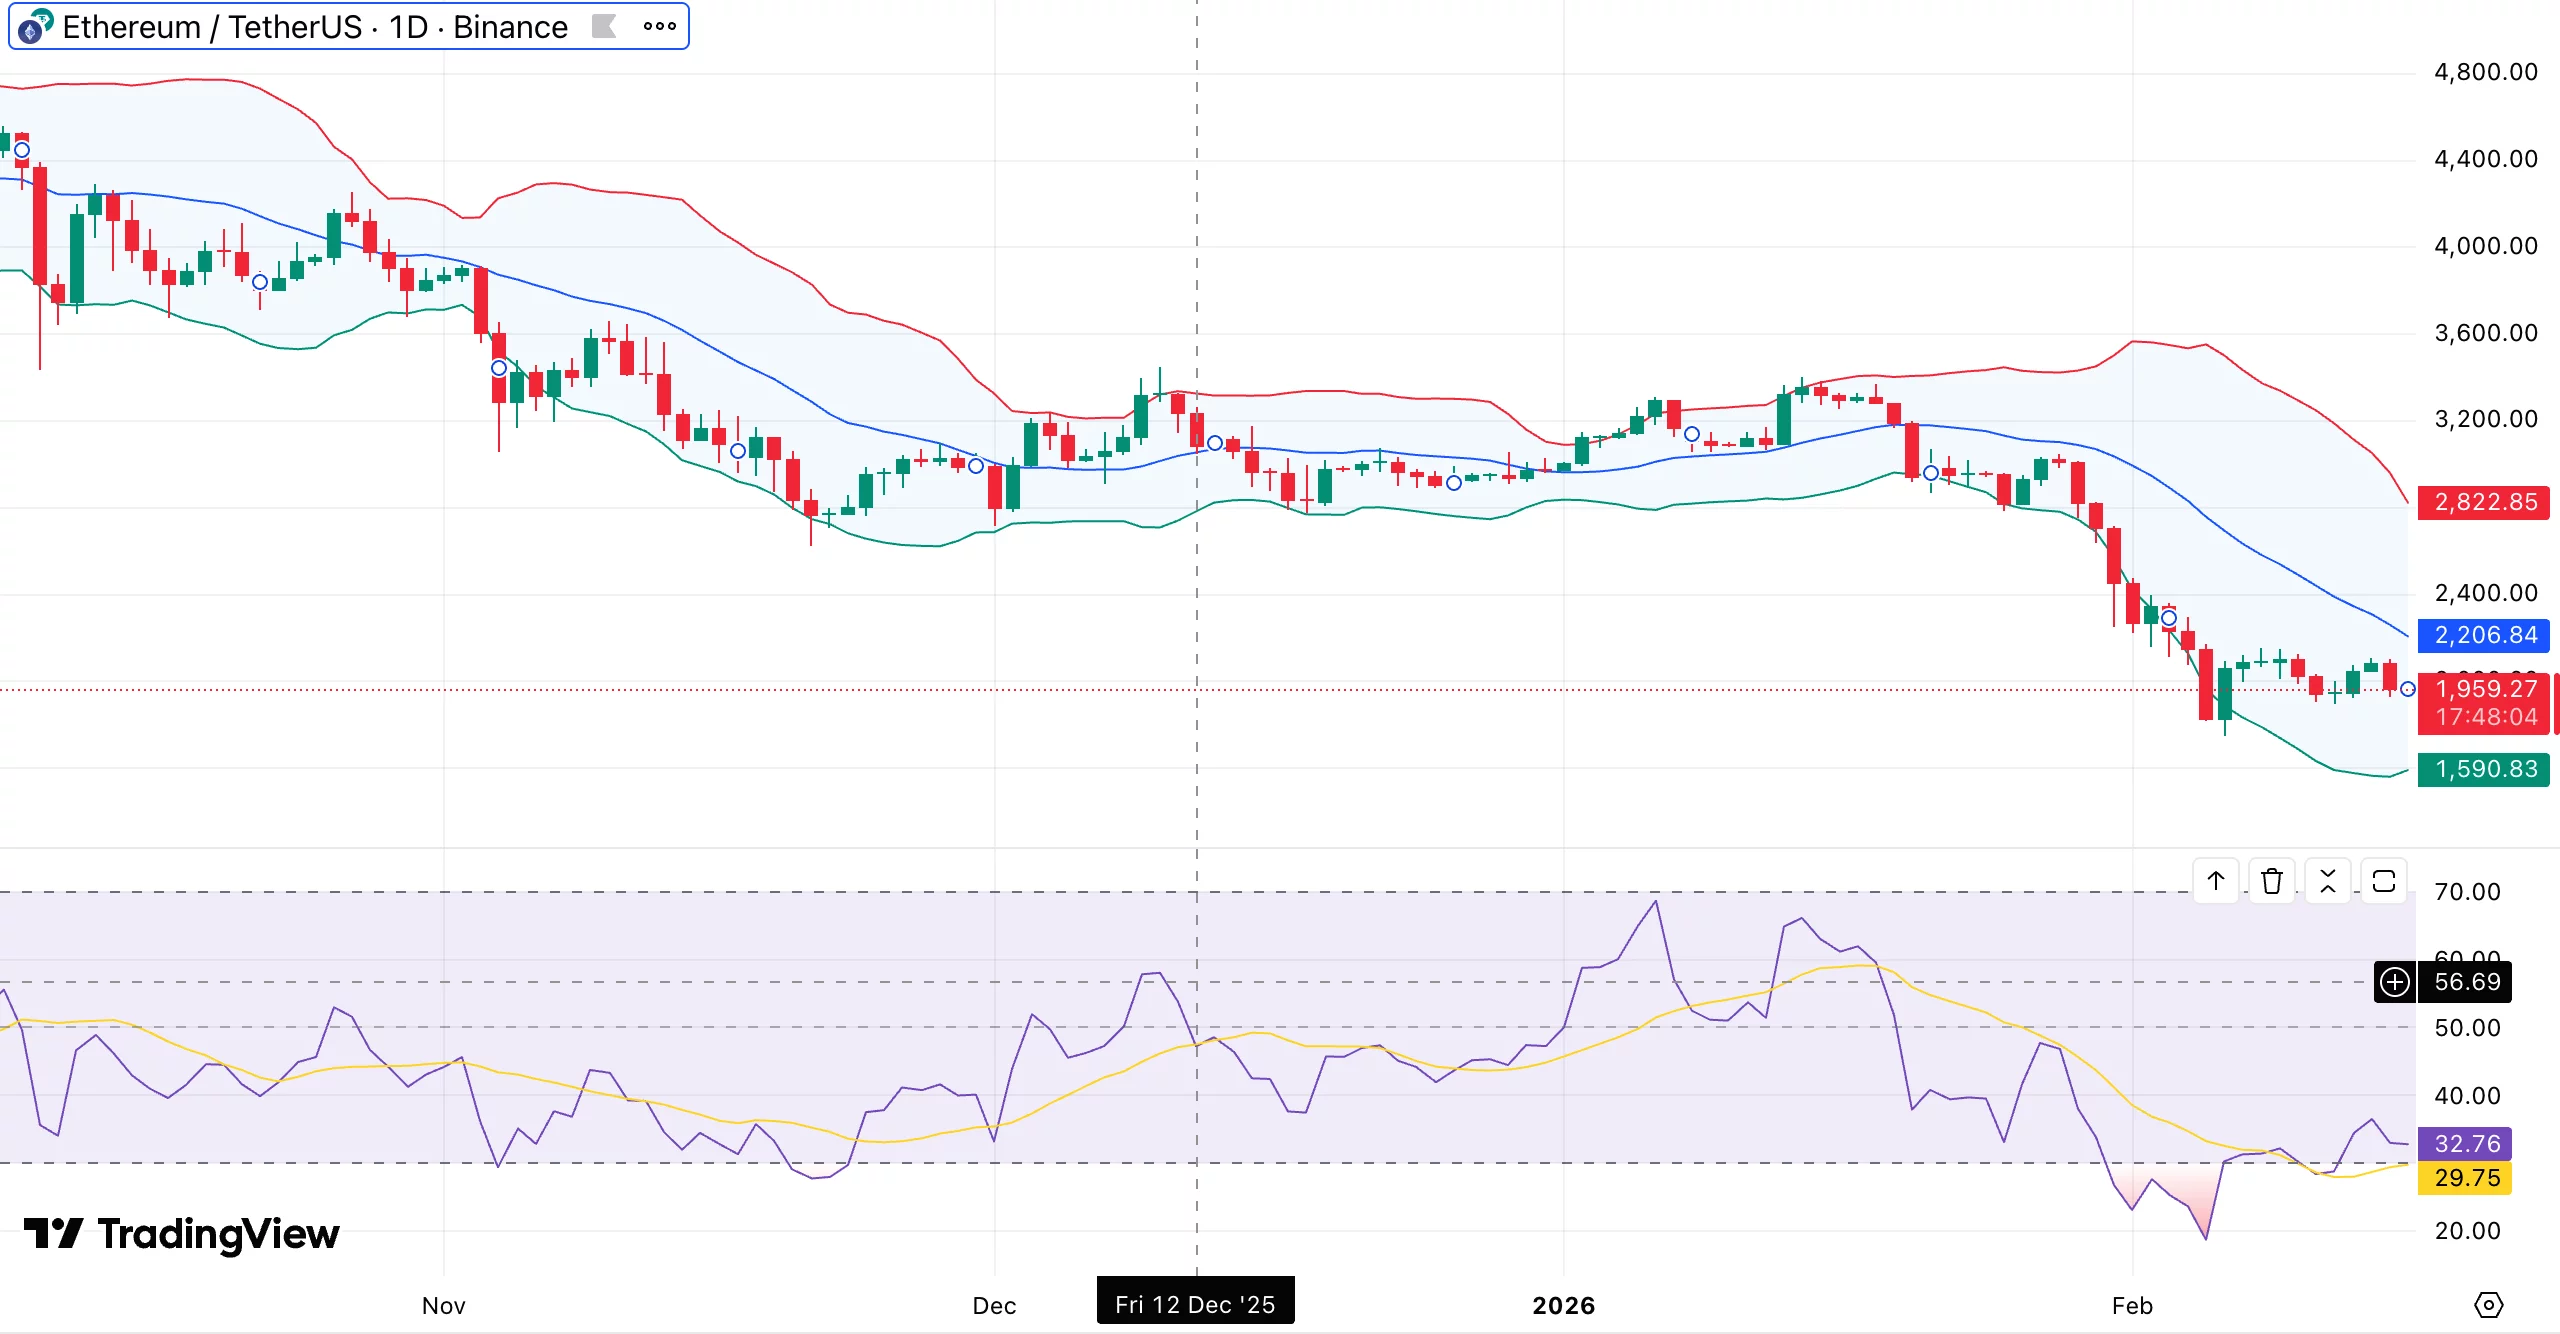
Volatility has spiked sharply. The recent downturn pushed ETH close to the lower Bollinger Band around $1,600, with the bands widening, a classic sign of a strong directional move. Despite a minor recovery from that extreme, the price is still trading close to the lower half of the range, suggesting that selling pressure has lessened but not reversed.
A crucial psychological and technical level is now the $1,900 mark. It lines up with a previous consolidation zone where buyers once tried to stabilize prices. If Ethereum breaks below this level decisively, it could drop toward $1,600–$1,650, near the lower edge of the recent volatility range.
Momentum readings remain weak. The relative strength index sits around 32–33, recently brushing near oversold territory. Such levels sometimes trigger short-term rallies, but no bullish divergence has appeared. Throughout the correction, RSI has failed to climb back above 50, keeping overall momentum firmly in the bearish camp.
For bulls to regain control, a daily close holding above $1,900 and RSI pushing back into the 40–45 range would be necessary. If $1,900 fails, downside risk remains elevated.
A move toward $1,600, and potentially lower, would be consistent with both the current technical structure and further bearish tilt in futures sentiment.

Polymarket removed a market tied to the fate of a missing US service member after mounting backlash, saying the listing violated its “integrity standards.”
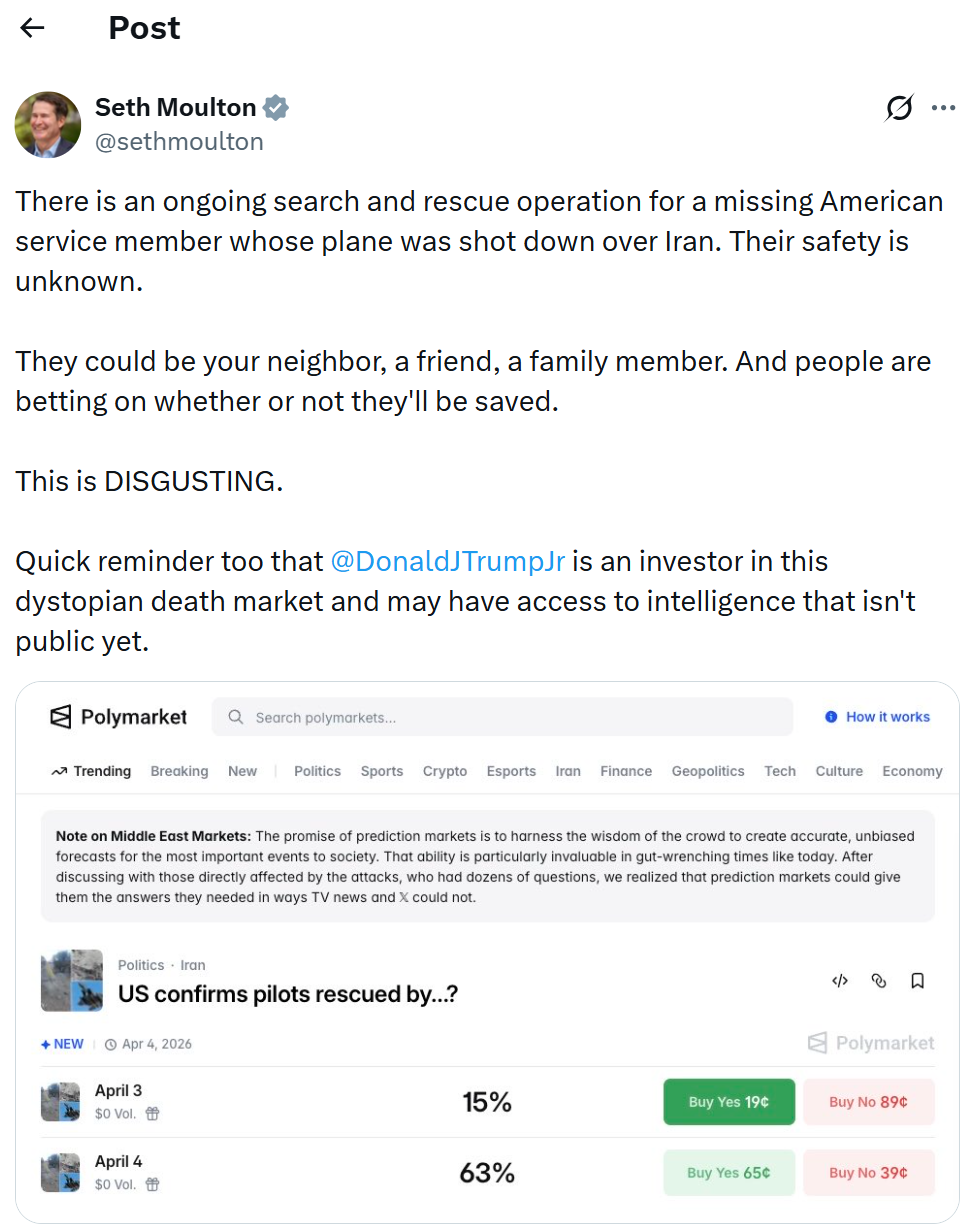
The controversy erupted after a prediction market appeared asking whether US authorities would confirm the rescue of a pilot reportedly shot down over Iran, with most users (over 60%) betting that they wouldn’t be rescued until Saturday.
US Representative Seth Moulton condemned the market, calling it “disgusting” and expressing concerns over people speculating on the fate of a potentially injured service member. “They could be your neighbor, a friend, a family member. And people are betting on whether or not they’ll be saved,” Moulton wrote.

In response, Polymarket said it had taken the market down immediately, adding that it should not have been listed and that the company is reviewing how it passed internal safeguards. The platform did not provide further detail on what specific rule had been breached.
Related: Polymarket expands into equities and commodities with Pyth price feeds
Polymarket under scrutiny over rules
While Polymarket said it took the market down because it did not meet its integrity standards, the platform did not specify which rule had been violated, prompting further scrutiny from users.
“I’m looking at the “Market Integrity” page, and I checked the TOS, and I don’t see which prohibition is relevant here,” Jack Newsham, a correspondent on Business Insider’s national desk, wrote on X.
As Cointelegraph reported, Polymarket has seen a sharp rise in fees and revenue after expanding its fee model on March 30, with daily fees jumping from about $363,000 to over $1 million and revenue nearing $1 million at its peak. The increase follows broader taker fees across categories like finance, politics and tech, as the platform ramps up monetization.
Related: Crypto VC Paradigm is developing a prediction market terminal: Fortune
Insider trading concerns rise on prediction markets
There have also been growing concerns about insider trading on prediction markets. Last month, it was reported that a group of traders made about $1 million by correctly betting on the timing of US strikes on Iran, with some placing trades just hours before the attacks. The activity, which involved newly created wallets focused almost entirely on strike-related bets, raised insider trading suspicions.
To address these concerns, at least 42 Democratic lawmakers have urged the US Commodity Futures Trading Commission and the Office of Government Ethics to warn federal employees against using non-public information to trade on prediction markets.
Big Questions: Is China hoarding gold so yuan becomes global reserve instead of USD?
Crypto World
Brian Armstrong Pledges Personal Oversight to Future-Proof Bitcoin Against Quantum Threats


Brian Armstrong has put himself personally on the line for Bitcoin quantum resistance, pledging direct oversight of Coinbase’s post-quantum cryptography research and implementation efforts at a moment when the threat has moved from theoretical to time-stamped.
The commitment signals that Coinbase is no longer treating quantum risk as a long-range problem for someone else’s roadmap.
The urgency is not manufactured. Google Quantum AI and Caltech research published in late 2025 modeled a hypothetical advanced quantum computer cracking Bitcoin’s encryption in under nine minutes – barely inside the network’s 10-minute block confirmation window.
Armstrong’s personal involvement is a direct institutional response to that narrowing margin.
Key Takeaways:
- Armstrong’s Commitment: Coinbase CEO Brian Armstrong has pledged personal oversight of the exchange’s Bitcoin quantum resistance initiatives, including collaboration with Bitcoin Core developers through a newly formed Quantum Advisory Council.
- The Threat Window: Google Quantum AI research models a cryptographically relevant quantum computer breaking Bitcoin’s encryption in under nine minutes – inside the 10-minute block time – with Google targeting quantum readiness by 2029.
- Protocol Reality: Bitcoin’s decentralized governance requires community consensus via the BIP process for any cryptographic upgrade – making Coinbase’s developer-facing engagement more consequential than a unilateral exchange decision.
- Industry Alignment: MicroStrategy’s Michael Saylor and Coinbase CSO Philip Martin are actively contributing to quantum resistance efforts; BTQ Technologies deployed a quantum-resistant Bitcoin Core testnet in early 2026, with mainnet planned for Q2 2026.
- What to Watch: BTQ Technologies’ Q2 2026 mainnet launch and the Coinbase Quantum Advisory Council’s first published migration standards are the two near-term signals that will indicate whether institutional momentum is translating into protocol-level action.
Discover: The Best Crypto to Get Right Now
The Quantum Threat to Bitcoin Is Specific – and the Clock Is Running
Bitcoin’s cryptographic security rests on the elliptic curve discrete logarithm problem. Google’s quantum research has already prompted other blockchain ecosystems to accelerate post-quantum cryptography transitions, and Bitcoin – the most valuable target – faces the sharpest exposure.
The specific mechanism is Shor’s Algorithm: run on a sufficiently powerful quantum computer, it can derive a private key from an exposed public key, which is precisely what happens when a Bitcoin address transacts on-chain.
Older Pay-to-Public-Key-Hash addresses are most exposed. SegWit and Taproot addresses offer partial cover – the public key isn’t broadcast until spending – but that protection evaporates the moment funds move. NIST finalized its first post-quantum cryptography standards in 2024, establishing lattice-based and hash-based signature schemes as the baseline framework. Bitcoin has not adopted any of them yet.
That gap – between available cryptographic tools and Bitcoin’s actual protocol, is the structural problem Armstrong is positioning Coinbase to help close.
Discover: The Best Crypto Presales Live Right Now
What Armstrong’s Personal Oversight Actually Means – and Why Coinbase’s Institutional Weight Changes the Calculation
Armstrong’s commitment is not a press release pledge. According to reporting on the initiative, Coinbase has established a Quantum Advisory Council that includes Bitcoin Core developers, with the explicit mandate to develop migration standards before cryptographically relevant quantum computers arrive.
Coinbase CSO Philip Martin described the situation as an “urgent problem” requiring industry consensus – and noted that post-quantum cryptography exists, but Bitcoin lags other chains in adopting it.
That distinction matters. This is not Coinbase upgrading its own infrastructure in isolation – a task any well-resourced exchange could accomplish internally.
The Advisory Council structure is designed to feed into the Bitcoin Improvement Proposal process, the community-consensus mechanism through which any protocol-level cryptographic change must pass. Coinbase, through its engineering resources and developer relationships, is positioning itself to draft and test BIPs specifically aimed at post-quantum transitions.
The institutional logic is transparent – and legitimate. Sovereign wealth funds and ultra-long-horizon institutional allocators weigh generational risk differently than retail traders.
Investor Kevin O’Leary has explicitly flagged quantum uncertainty as a factor that could deter institutional Bitcoin allocations.
By addressing a 10-to-20-year risk today, Coinbase is signaling custodial seriousness to exactly the capital it wants to attract. Coinbase’s recent regulatory positioning follows the same pattern: institutional-grade engagement on foundational issues before the pressure becomes acute.
MicroStrategy’s Michael Saylor is contributing to quantum resistance efforts alongside Armstrong – which adds significant Bitcoin treasury credibility to what might otherwise read as an exchange-driven initiative.
Jameson Lopp of Casa, who has tracked this risk closely, has estimated that full network migration to quantum-safe addresses will require years of coordination across wallets, custodians, and users. Armstrong’s involvement compresses none of that timeline on its own.
What it does is add institutional momentum to a process that previously lacked it.
Explore: The best pre-launch token sales with asymmetric upside potential
The post Brian Armstrong Pledges Personal Oversight to Future-Proof Bitcoin Against Quantum Threats appeared first on Cryptonews.

TLDR:
- Cambodia’s parliament passed its first cybercrime law on April 3, 2026, targeting online scam centres directly.
- Convictions carry prison terms of up to 10 years and fines reaching $250,000 for gang-related scam operations.
- Cambodia extradited two high-profile figures to China amid a broader crackdown on senior scam network leaders.
- Britain sanctioned Cambodia’s largest fraud complex and a crypto marketplace used to trade stolen personal data.
Cambodia’s cybercrime law marks a turning point in the country’s fight against online fraud operations. The parliament passed the legislation on Friday, April 3, 2026, making it the first law specifically targeting scam centres.
These centres have cost international victims billions of dollars. The move follows growing global pressure on Southeast Asian governments to act against the illicit operations embedded across the region.
Parliament Approves Strict Penalties for Online Scam Operators
The new law sets out prison terms of two to five years for those convicted of online scams. Fines can reach up to $125,000 for individual offenders.
Gang-related scams or cases involving multiple victims carry heavier sentences of up to 10 years. Fines in such cases can go as high as $250,000.
Justice Minister Keut Rith described the law as a tool to strengthen ongoing enforcement efforts. He stated the law aimed to enhance the “cleaning operation” taking place across the country.
He also stressed that it would ensure the centres do not return after the crackdown. The law will proceed to Cambodia’s king for final signature before taking full effect.
Rith further explained the reach of the problem during his remarks to reporters. He said the issue had also affected the economy, tourism, and investment in Cambodia.
He described the law as being “strict like the fishing net, strict to ensure we don’t have the online scams anymore in Cambodia.” Those words captured the government’s stated intent to pursue a thorough and lasting enforcement effort.
The law also covers penalties for money laundering, data collection on victims, and scammer recruitment. Previously, Cambodia had no dedicated legislation for targeting scam operations.
Authorities had relied on charges such as aggravated fraud and recruitment for exploitation. This new legislation addresses that legal gap directly.
Recent Arrests and Extraditions Signal Broader Crackdown
Cambodia’s enforcement actions have extended beyond legislation in recent months. On Wednesday, the government extradited Li Xiong to China.
Li Xiong was a former leader at a Cambodian financial conglomerate accused of laundering money for criminal organisations. The extradition reflects a shift toward holding senior figures accountable.
In January, Chinese-Cambodian businessman Chen Zhi was arrested in Cambodia and also extradited to China. Chen Zhi faced accusations of running a brutal online scam and money laundering operation.
His arrest marked a dramatic reversal for a once-prominent business figure. The case drew international attention to Cambodia’s ties with transnational crime networks.
On Thursday, Britain sanctioned operators of what it described as Cambodia’s largest fraud complex. The UK also targeted a crypto marketplace used to trade stolen personal data.
Britain called it part of a fast-growing network of scam centres across Southeast Asia. Workers in these compounds are reportedly confined and forced to commit fraud.
Cambodian officials say the current campaign is broader than previous efforts. Hundreds of sites are being closed, and senior figures are being detained.
The government had long played down the existence of these compounds. That position has now clearly changed.

TLDR
- An imposter X account masqueraded as Jonathan the tortoise’s veterinarian to announce a fabricated death
- Major publications including BBC, Daily Mail, and USA Today fell for the deception, which garnered 2 million views
- Cryptocurrency donations were being requested through the fraudulent account
- The governor of Saint Helena personally verified Jonathan was alive during a nighttime check
- Cryptocurrency scam losses reached an unprecedented $17 billion in 2025
An elaborate social media hoax declaring the death of the planet’s oldest living terrestrial animal transformed into a cryptocurrency fraud scheme that managed to deceive numerous prominent international news organizations.
Jonathan the Tortoise is alive and well 🐢
• He’s ~193 years old — the longest-living land animal on Earth
• A suspected crypto scammer went viral on April Fools Day pretending to be his vet
(via @BritishOverseas) pic.twitter.com/YiV4ZNK7i0
— Culture Crave 🍿 (@CultureCrave) April 1, 2026
Jonathan, a Seychelles giant tortoise aged 194 years who resides on Saint Helena island, became the subject of false death reports earlier this week following a deceptive X account that disseminated the fabricated news to millions of users.
The fraudulent profile adopted the name and credentials of Joe Hollins, Jonathan’s actual veterinary doctor. The account expressed being “heartbroken” while announcing that Jonathan had “passed away peacefully.”
Within a short timeframe, the message accumulated two million impressions. Multiple prestigious news organizations, including the BBC, Daily Mail, and USA Today, ran articles declaring Jonathan’s demise based solely on this account’s claims.
The reality: the authentic Joe Hollins maintains no presence on X whatsoever. He verified that the announcement was entirely fraudulent.
“Jonathan the tortoise is very much alive,” Hollins told USA Today. “I believe on X the person purporting to be me is asking for crypto donations… it’s a con.”
Investigation revealed the counterfeit account originated from Brazil rather than Saint Helena.
How the Truth Came Out
Nigel Phillips, Saint Helena’s governor, was preparing to retire for the evening when international messages began pouring in. He personally ventured outside during nighttime hours to inspect the tortoise’s condition firsthand.
Jonathan the Giant Tortoise’s death has been revealed to be a hoax, and the big guy is alive and well at the age of 193.
A crypto scammer created an account impersonating his caretaker and spread misinformation to several media outlets. pic.twitter.com/ybEonk8fDJ
— Pubity (@pubity) April 1, 2026
Phillips discovered Jonathan precisely where expected — resting beneath a tree within his enclosure.
“Jonathan is asleep under a tree in the paddock,” Phillips told The Guardian. He verified the animal was “very much alive.”
The following Thursday morning, Phillips addressed the situation with humor on social platforms. He referenced Mark Twain, stating the “report of my death was an exaggeration.”
The Friends of the British Overseas Territories published an official statement highlighting that the fraudulent account had recently modified its username while actively requesting cryptocurrency contributions.
Guinness World Records acknowledged the news with a relieved “phew.”
Jonathan’s Condition
Notwithstanding the digital commotion, Jonathan maintains excellent health considering his advanced age. While he has experienced vision loss due to cataracts and no longer possesses his olfactory sense, his appetite remains robust and he continues to be physically active.
His residence at Plantation House, which serves as the governor’s official home, is shared with three companion tortoises: Emma, David, and Fredrik.
Throughout his remarkable lifespan, Jonathan has witnessed eight British monarchs, survived two global conflicts, and experienced the complete evolution of the digital era.
News organizations that initially published the death reports have subsequently issued retractions.
This deception represents a broader pattern of cryptocurrency fraud employing impersonation strategies. Blockchain analytics company Chainalysis documented that crypto scam losses achieved a record-breaking $17 billion throughout 2025.
Individual scam payments surged by 253% to an average of $2,764, fueled by artificial intelligence-enhanced impersonation techniques and progressively sophisticated criminal operations.
TLDR:
- Block confirms its Bitcoin faucet launches April 6, allowing users to collect free satoshis online.
- The original Bitcoin faucet, created in 2010, distributed roughly 19,700 BTC before closing in 2012.
- Block cut 40% of its workforce to refocus on Bitcoin, using AI-driven workflows to sustain operations.
- Block’s product line now includes Cash App, Bitkey hardware wallet, and Proto Bitcoin mining systems.
Bitcoin faucet is making a notable comeback, and Jack Dorsey’s Block is driving the effort. The company has confirmed Monday, April 6, as the official launch date.
Users will collect satoshis for free, closely mirroring the original model from 2010. Block currently holds 8,883 BTC, valued at around $594 million, on its balance sheet.
The revival reflects the firm’s continued focus on Bitcoin education and broader adoption.
The Origins and Evolution of Bitcoin Faucets
The original Bitcoin faucet launched in 2010, created by developer Gavin Andresen. His goal was straightforward: educate newcomers and promote adoption of the emerging digital currency.
Each Bitcoin address could claim 5 BTC at the time by solving a basic CAPTCHA. Those coins would be worth more than $330,000 in today’s market, had early recipients held them.
The site ran for about two years before shutting down in 2012. Over that period, it distributed roughly 19,700 BTC to participants around the world.
Block’s Bitcoin-focused account recently confirmed the return of this concept with a brief post: “The bitcoin faucet is back. 04.06.26 From btc.day.” The date in the post corresponds directly to the Monday launch schedule.
Since the original faucet closed, others have continued the model across various platforms. Modern faucets now often support multiple cryptocurrencies beyond Bitcoin alone.
Many rely on advertising revenue and microwallets to deliver small rewards consistently to users. Reputable platforms offer a beginner-friendly path into crypto, though caution around scam faucets remains necessary.
Block’s version stands apart due to its institutional resources and Bitcoin-only focus. The firm’s substantial BTC balance sheet provides a solid foundation for sustaining the program.
Free satoshis lower the entry barrier for newcomers exploring the space for the first time. The launch directly continues the educational mission that Andresen put in motion over 15 years ago.
Block’s Internal Shift and Expanding Bitcoin Products
Block recently restructured by cutting more than 4,000 jobs, approximately 40% of its total workforce. Dorsey described the move as a necessary step to refocus on core Bitcoin initiatives.
The company now relies on AI-driven development workflows to maintain output with leaner teams. Automated agents actively support reduced engineering staff across multiple product lines.
Dorsey and board director Roelof Botha back what they describe as a mini-AGI vision for Block. Their position is that AI can effectively replace several layers of traditional corporate coordination.
Smaller, focused teams can then operate more efficiently than larger conventional organizations. Block sees this internal model as a competitive advantage moving forward.
Block’s product line now extends well beyond Cash App’s peer-to-peer payment features. Bitkey is a self-custody hardware wallet for users who prefer direct control over their own Bitcoin.
Proto offers a range of Bitcoin mining systems for individuals looking to join the network. Together, these products reinforce Block’s position as a full-service Bitcoin company.
The Bitcoin faucet launch ties directly into this expanding product ecosystem. New users who receive free satoshis may later turn to Bitkey for secure storage solutions.
Others could explore Proto as a natural pathway into Bitcoin mining. The April 6 launch connects these offerings through a shared and accessible onboarding strategy.

Bitcoin has traded in a tight, directional lull, stubbornly holding below the $70,000 mark as traders await a decisive catalyst. With price action confined for weeks, analysts argue that the duration of this consolidation could magnify the eventual breakout, whichever direction it takes. Michael van de Poppe, founder of MN Trading Capital, framed the current phase as setting the stage for a potentially powerful move, noting that the longer the range persists, the more pronounced the ensuing breakout could be. He highlighted the key upside threshold of $71,000, a level Bitcoin hasn’t cleared since March 26, as a potential trigger for renewed momentum.
At the time of writing, Bitcoin was hovering around the mid-$60,000s, roughly $66,900, according to CoinMarketCap. That price sits within a broader range established since a February low near $60,000, with resistance near $74,000 forming the upper bound. Over the past 30 days, the largest cryptocurrency has slipped about 8% in value, underscoring a risk-off mood that has dominated the sector even as selective traders look for catalysts to spark a fresh leg higher. The market’s measured pace contrasts with the volatility that preceded the recent cycle, underscoring the need for a clear trigger to ignite a sustainable move.
Key takeaways
- Bitcoin remains trapped in a narrow trading range beneath $70,000, with the upper boundary around $74,000 and a near-term pivot at $71,000.
- Analyst Michael van de Poppe argues that a prolonged, quiet phase increases the potential magnitude of the next breakout, provided BTC can clear $71,000.
- Market sentiment remains deeply negative, with the Crypto Fear & Greed Index clustering in “Extreme Fear” at a score of 11, signaling subdued risk appetite.
- Contrasting views warn of the possibility of a deeper bear scenario driven by macro conditions, while others doubt fresh cycle highs will appear soon, potentially delaying new all-time highs beyond 2026.
Bitcoin’s rangebound reality and the near-term map
Since carving a yearly trough near $60,000 on Feb. 6, Bitcoin has traded within a relatively tight corridor—from roughly $60,000 up to the mid-$70,000s. The current stance around $66,900 illustrates a market that has not committed to a directional breakout, even as macro winds remain uncertain. The lack of a clear break above the late-M-March milestone of $71,000 adds to the sense that participants are waiting for a definitive signal rather than chasing incremental moves. Price action in such environments often punctuates with a single, decisive swing, but the timing and texture of that swing remain highly contingent on evolving macro data and liquidity conditions.
For traders, a close above $71,000 could reframe the near-term setup, potentially inviting renewed buying pressure. Yet the lack of sustained conviction in the broader market has kept traders cautious about extrapolating a rapid ascent. Observers note that while the long-run trend remains uncertain, the risk-reward dynamics during a breakout could be outsized if momentum shifts decisively in BTC’s favor.
Diverse voices: a spectrum of outcomes for Bitcoin
The debate among prominent market observers underpins the current mood. On the optimistic side, Michael van de Poppe argues that a drawn-out consolidation tends to precede a stronger breakout. In a post on X, he emphasized that “the longer it lasts, the heavier the breakout will be,” underscoring the idea that patience in the market could yield a more powerful move once a clear directional bias emerges. He pointed to a potential breakout through $71,000 as a critical inflection point that has lingered out of reach since late March. For traders aiming to capitalize on a shift in momentum, the path of least resistance appears to hinge on clearing that threshold with conviction and a commensurate rise in volume.
Not all voices share the same optimism. Willy Woo, a veteran on-chain analyst, has warned of the possibility of a deeper bear scenario, citing macro conditions that could undermine the secular bull narrative. In a post on X, Woo suggested that a breakdown in the broader macro environment could open the door to further downside pressure, even if a temporary bounce occurs in the short term. The caution reflects a broader concern that macro cycles and liquidity dynamics can override intra-market signals during times of global financial stress.
Another seasoned price commentator, Peter Brandt, recently offered a longer-horizon view that challenges the likelihood of new Bitcoin highs within 2026. Brandt indicated that, based on his assessment of historical cycles and macro considerations, a fresh cycle peak might be more plausible in 2027 rather than this year. His perspective helps contextualize the divergence between near-term price action and longer-term expectations, illustrating how different time horizons can yield contrasting conclusions about Bitcoin’s trajectory.
The juxtaposition of these viewpoints—range-based patience from some, macro-driven caution from others, and longer-horizon skepticism from veteran traders—illustrates that the market awaits a decisive catalyst before committing to a new directional wave. In such environments, liquidity, macro indicators, and regulatory developments often serve as the catalysts that tip the balance.
Sentiment, risk appetite, and what to watch next
The current mood in crypto markets is reflected in sentiment gauges, with the Crypto Fear & Greed Index lingering in the deepest levels of fear. A reading of 11 out of 100 signals a risk-off stance among participants and elevated caution around new allocations to risk assets. This backdrop suggests that even a constructive technical setup could be tempered by a cautious macro stance, as traders seek higher confidence before committing capital to a run of gains.
As the narrative unfolds, traders will likely monitor a handful of near-term triggers. A clean close above $71,000 on strong volume could rekindle upside momentum and draw in short-term momentum players. Conversely, a break decisively below the February low near $60,000 could sharpen downside pressure and renew talk of deeper retracements. Beyond price levels, macro developments—such as shifts in liquidity conditions, inflation data, and policy signals—will shape Bitcoin’s path more than any single technical pattern in the days ahead.
In the broader context, the debate around Bitcoin’s next major move remains unresolved. While some analysts anticipate an imminent uplift, others highlight the weight of macro forces that could extend the bear phase. The coming weeks will be telling as market participants weigh technical cues against macro realities and continue to parse signals from on-chain activity, derivatives positioning, and cross-asset liquidity flows.
For readers and participants, the key takeaway is that the near-term outlook hinges on a catalyst capable of turning a range into a directional move. Whether that catalyst arrives in the form of a sustained break above $71,000, a decisive break below $60,000, or a macro development that reorders risk sentiment, the market’s next leg will likely be driven by a combination of price action, volume, and external factors rather than a single indicator.
As markets monitor these dynamics, investors should stay alert to potential shifts in liquidity and risk appetite that could accelerate Bitcoin’s next chapter. The coming sessions will reveal whether the current consolidation is merely a pause before a new leg higher, or a precursor to a deeper restructuring of the market’s macro regime.


Naoris Protocol has gone live with its quantum-resistant blockchain mainnet, becoming the first Layer 1 network built entirely on post-quantum cryptography approved by the U.S. National Institute of Standards and Technology — a milestone arriving as researchers shorten timelines for a threat that could compromise Bitcoin and Ethereum.
Summary
- Naoris Protocol launched its quantum-resistant mainnet on April 1, 2026, using NIST-approved post-quantum cryptography standards finalized in August 2024
- The testnet phase processed over 106 million post-quantum transactions and mitigated more than 603 million security threats, with over one million security nodes activated globally
- The NAORIS token carries a market cap of approximately $36 million at launch; the network is in an invite-only phase for validator operators
“Mainnet represents the transition from proof-of-concept to production infrastructure. The network has already validated over 100 million transactions using post-quantum cryptography. That is not a roadmap promise; it is measured, operational capacity,” said Nathaniel Szerezla, Chief Growth Officer of Naoris Protocol.
The mainnet runs on NIST’s ML-DSA algorithm — the standardized version of CRYSTALS-Dilithium, published as FIPS 204 — for all transaction signatures. The system enforces an “irreversible security transition”: once a user adopts post-quantum keys, the protocol automatically blocks any subsequent transaction attempts using classical cryptographic methods.
The Quantum Insider confirmed that the launch is directly timed to accelerating regulatory pressure: Google published research in late March 2026 estimating that breaking Bitcoin’s elliptic curve cryptography would require fewer than 500,000 qubits — far below previous estimates — while Ethereum co-founder Vitalik Buterin outlined a quantum migration plan in February 2026.
Why Timing Matters
NIST finalized its post-quantum cryptographic standards in August 2024. The European Commission has mandated member states begin national post-quantum strategies by 2026, with full migration required by 2035. The White House’s National Cybersecurity Strategy in March 2026 accelerated federal adoption of post-quantum cryptography.
Industry analysts have warned that approximately 4.5 million Bitcoin sit in addresses with exposed public keys, potentially vulnerable once quantum capability reaches the necessary threshold. Naoris Protocol’s CEO first outlined this threat model in detail, warning that “harvest now, decrypt later” attacks are already underway — meaning encrypted data is being collected today in anticipation of future decryption capability.
What the Network Offers
Naoris operates as a Sub-Zero Layer — infrastructure positioned beneath traditional L1 and L2 networks, designed to secure validators, wallets, exchanges, DeFi protocols, and cross-chain bridges. Users who move assets to Naoris receive quantum-resistant protection; assets remaining on classical chains stay exposed.
“Assets moved to Naoris become quantum-secure, while assets left on classical chains remain vulnerable. The earlier users migrate, the smaller their exposure window,” Szerezla told Decrypt. In September 2025, Naoris was cited in an SEC research submission as the reference model for the Post-Quantum Financial Infrastructure Framework (PQFIF).

Coinbase has secured conditional approval from the Office of the Comptroller of the Currency for a national trust charter. The decision signals progress toward federal oversight of its custody business and strengthens its position in institutional crypto infrastructure.
Coinbase Moves Toward Federal Custody Framework
Bitcoin traded near $68,000 as markets absorbed regulatory developments in the United States. Meanwhile, Coinbase advanced its institutional strategy with a key approval milestone. The company aims to expand federally supervised custody services.
The OCC granted conditional approval for Coinbase National Trust Company after reviewing its application. The regulator outlined requirements that Coinbase must meet before receiving full authorization. These conditions include compliance systems, governance frameworks, and risk controls.
The approval does not permit deposit-taking or lending activities under the trust structure. Instead, Coinbase will focus on custody, staking, and fiduciary services for institutions. This model aligns with existing trust company frameworks used in financial markets.
Conditions Highlight Compliance and Risk Controls
Coinbase must satisfy several operational and regulatory conditions before launching the trust entity. These include anti-money laundering programs and know-your-customer procedures. The company must also meet capital and liquidity standards set by regulators.
Additionally, Coinbase needs to demonstrate strong governance and internal risk management systems. The OCC requires an operating agreement that defines oversight and reporting obligations. Only after meeting these conditions will the regulator grant full approval.
The timeline for completion remains uncertain, although similar approvals took several months. Coinbase filed its application in October 2025, and the review extended beyond earlier cases. The scale of assets under custody likely influenced the extended review process.
Institutional Demand Drives Charter Strategy
Ethereum traded near $3,400 as institutional participation continued to expand across digital asset markets. Meanwhile, Coinbase reported hundreds of billions in assets under custody. This scale highlights its importance in institutional crypto infrastructure.
The company already serves as custodian for several U.S. spot Bitcoin exchange-traded funds. A federal charter would enhance its credibility among pension funds and asset managers. These clients often require federally regulated counterparties for custody services.
Moreover, the charter enables Coinbase to operate under a unified national regulatory framework. This reduces reliance on state-level licensing systems such as those in New York. It also simplifies compliance across multiple jurisdictions.
Regulatory Context and Industry Competition
Ripple Labs, Circle, and Paxos have also received similar conditional approvals. The OCC has expanded its oversight of crypto-native firms through these charters. Each company must independently meet pre-opening conditions before operating.
At the same time, Binance continues to lead in global trading volumes. However, Coinbase holds a significant share of institutional custody assets. This distinction reinforces its focus on regulated financial infrastructure.
The broader regulatory environment remains complex, with ongoing debates in Congress over digital asset legislation. Coinbase has also engaged in legal actions to defend certain product offerings. These developments reflect evolving oversight across the crypto sector.
Tether is pressuring investors to commit to a fundraising round at a $500 billion valuation within the next two weeks, saying that it may delay the raise if demand falls short.
The El Salvador-based firm has been seeking fresh capital since late last year but has faced resistance from investors wary of the valuation, The Information reported Friday, citing unnamed sources. If commitments fall short of expectations, the company is likely to delay the raise.
The $500 billion target would place Tether among the world’s largest financial firms, exceeding every US bank except JPMorgan Chase. JPMorgan, the largest bank in the world, has a market capitalization of about $794.55 billion, while the second-largest bank in the country, Bank of America, has a market cap of $352.86 billion.
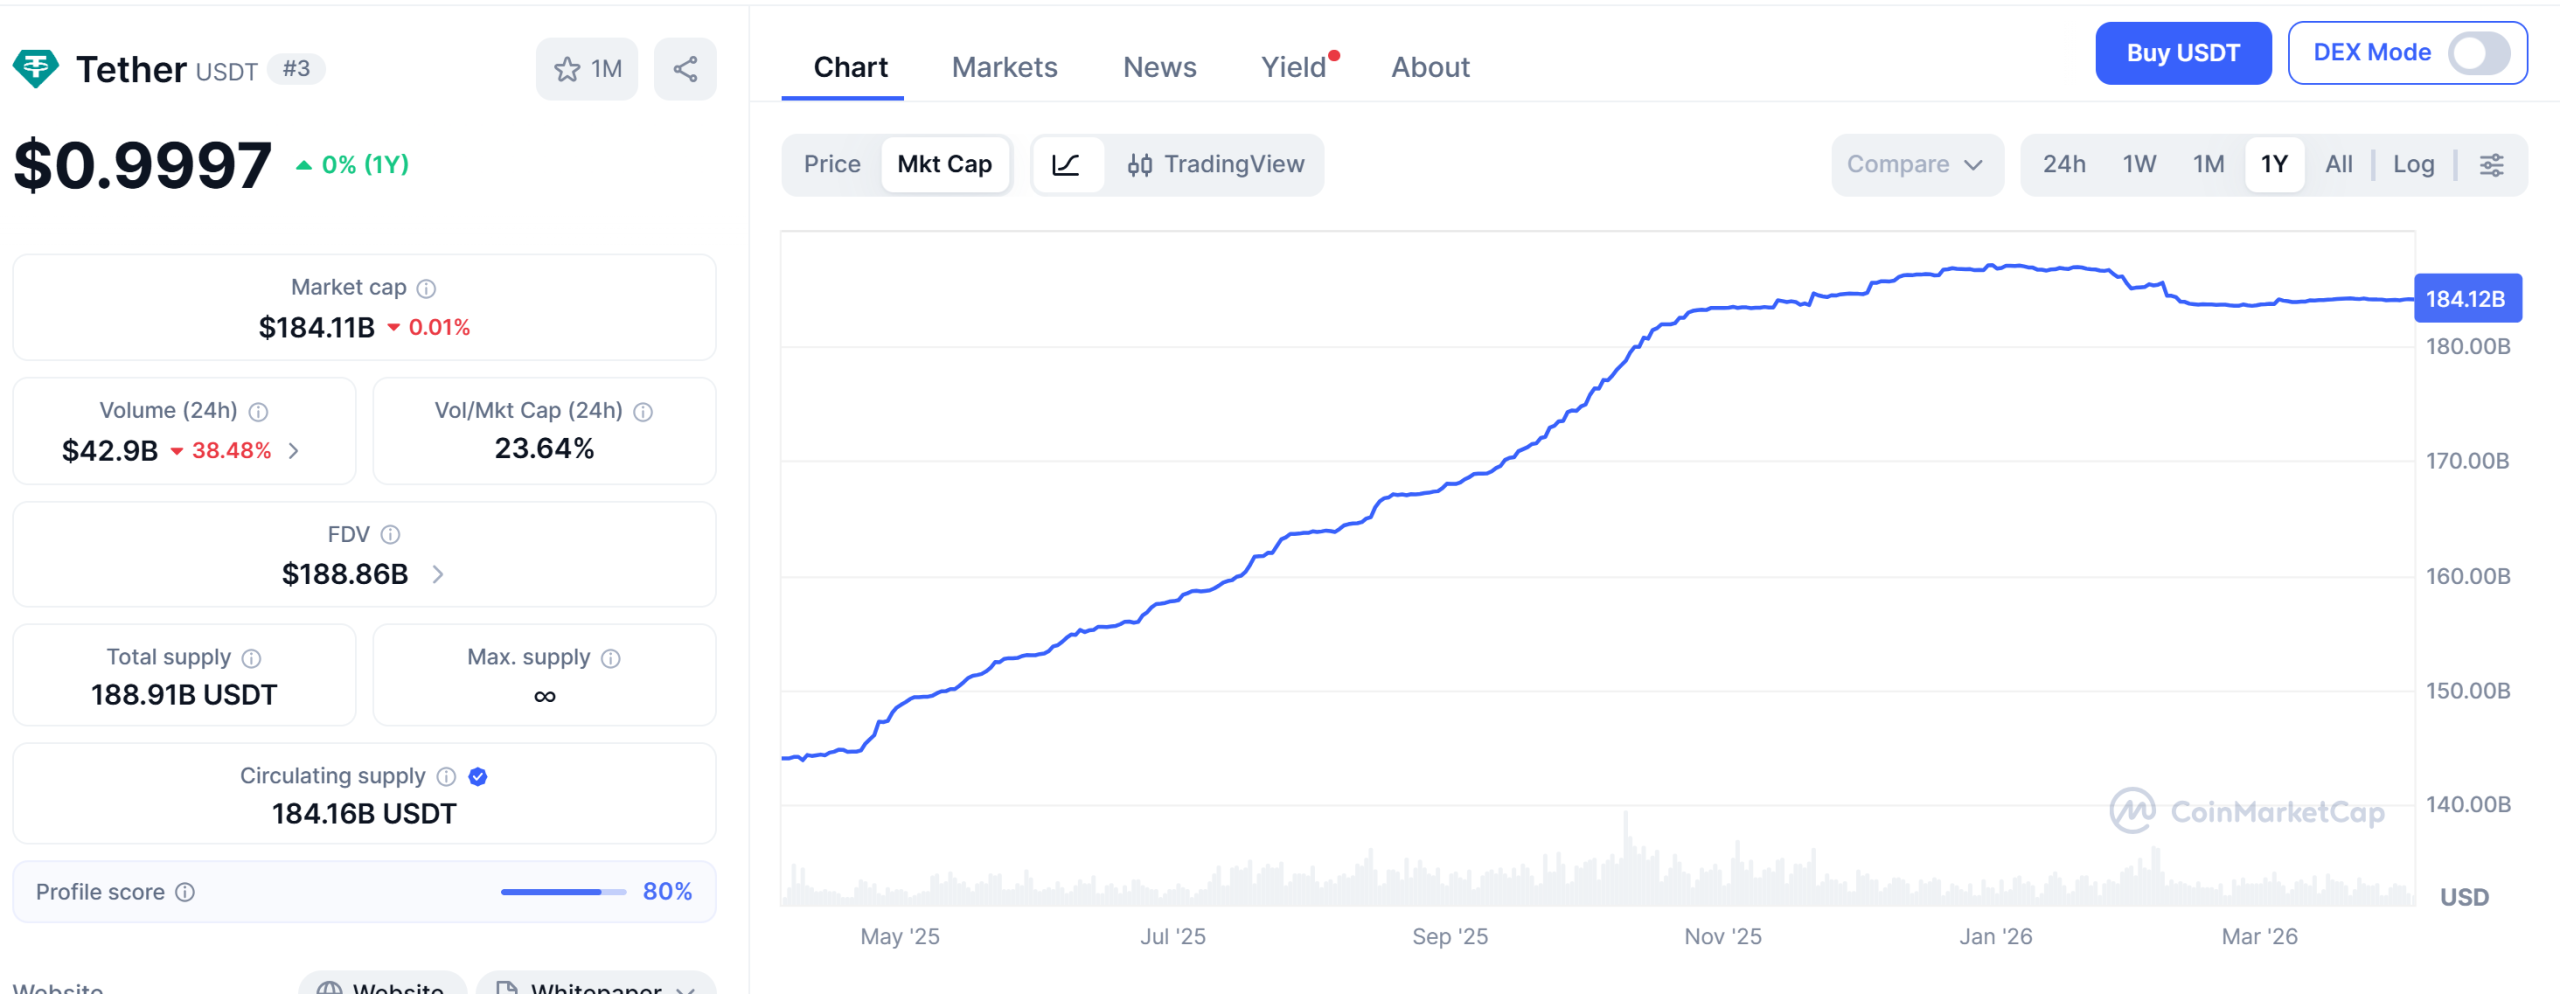
Tether’s USDt (USDT) stablecoin, the world’s largest stablecoin, currently has a market cap of $184 billion. The company’s other top products include Tether Gold (XAUt) and Tether EURt (EURt), pegged to the euro.

Related: Stablecoin supply reaches $315B in Q1 as USDC rises, USDT declines
Tether explores fundraising
In September last year, Bloomberg reported that Tether was exploring a fundraising round of up to $20 billion that could value the company at around $500 billion. The firm was considering raising $15 billion to $20 billion through a private placement for roughly a 3% stake, with Cantor Fitzgerald acting as lead adviser.
Following the report, CEO Paolo Ardoino said on X that the company was exploring a raise from a select group of investors to expand across “existing and new business lines (stablecoins, distribution ubiquity, AI, commodity trading, energy, communications, media) by several orders of magnitude.”
However, in a comment to Cointelegraph in February, Ardoino denied reports that it planned to raise up to $20 billion, saying earlier figures were hypothetical scenarios rather than an active fundraising plan. Still, he defended the $500 billion valuation, comparing the company’s profits to AI platforms such as OpenAI.
Cointelegraph reached out to Tether for comment, but did not get a response by publication.
Related: Tether says ‘Big Four‘ firm to handle first full audit of USDT reserves
Tether taps KPMG for first full audit od USDt
Meanwhile, Tether has reportedly hired KPMG to conduct its first full audit of USDt’s financial statements, with PwC assisting in preparing internal systems, according to the Financial Times. The move follows years of relying on reserve attestations from BDO Italia rather than a comprehensive audit.
A full audit would go beyond reserve snapshots to examine assets, liabilities and internal controls across Tether’s balance sheet.
Magazine: Bitcoin may take 7 years to upgrade to post-quantum — BIP-360 co-author
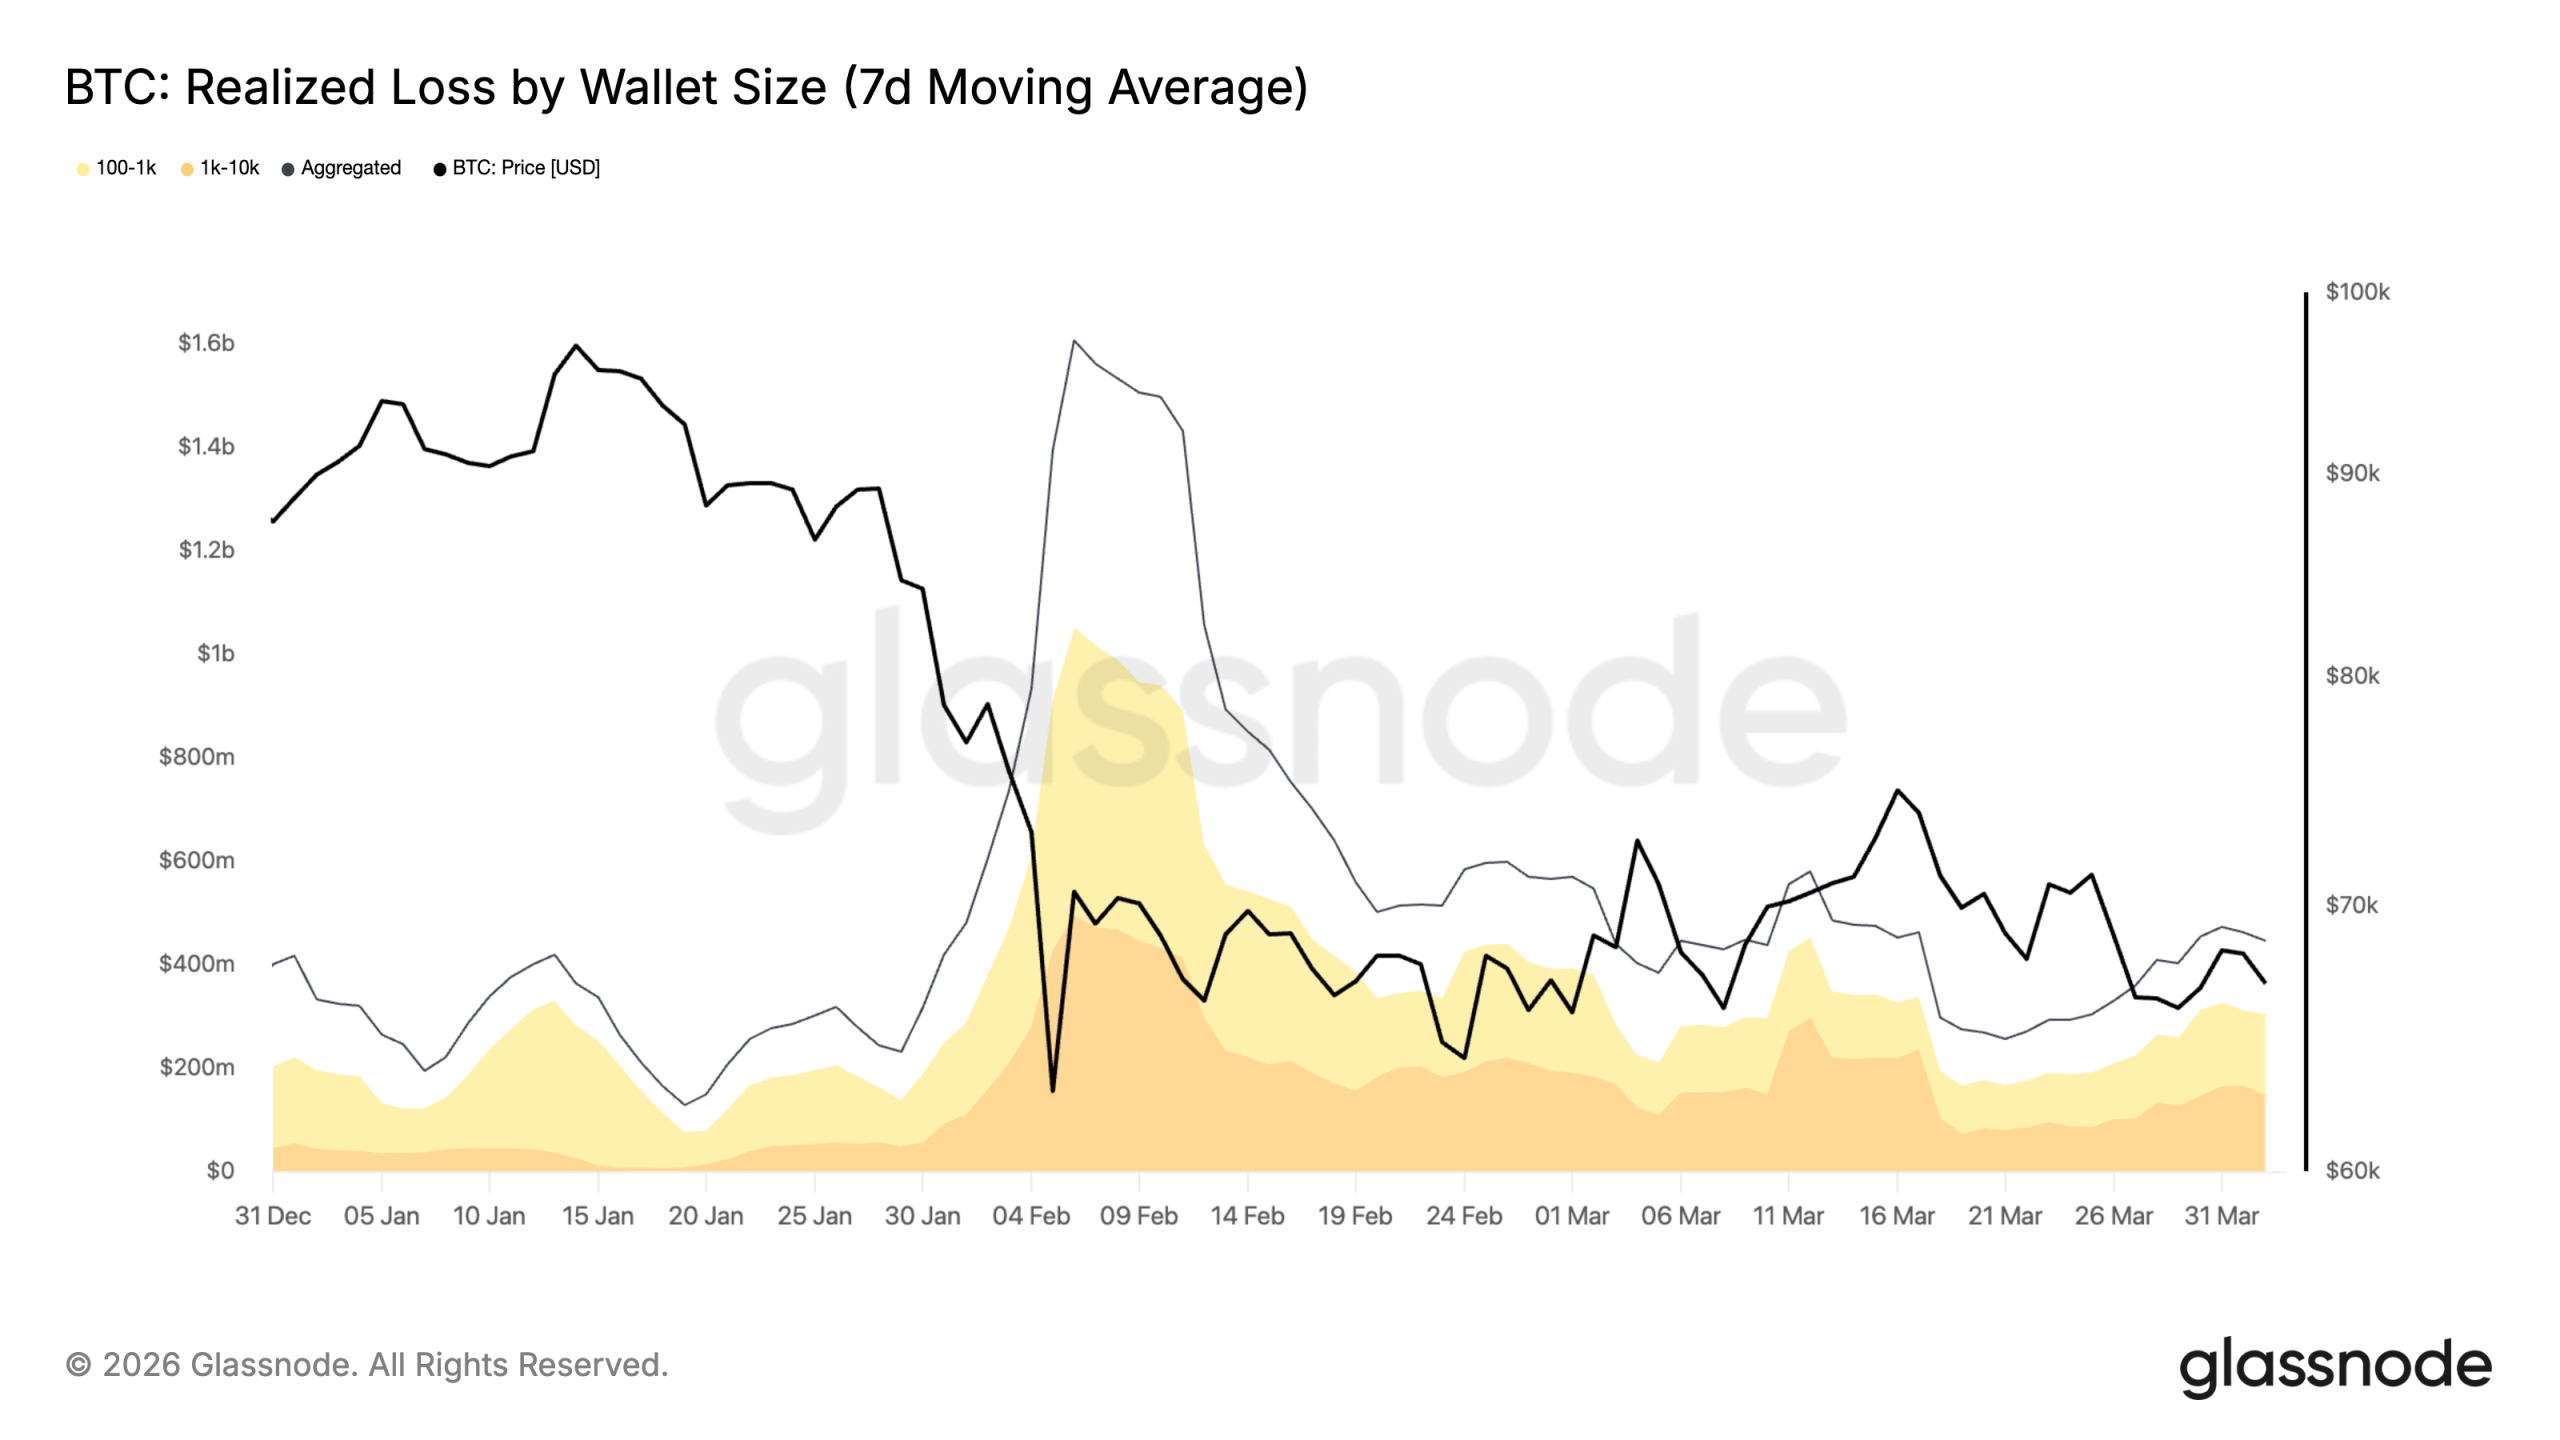
Bitcoin (BTC) traders holding 100–10,000 BTC realized losses at an average of $337 million per day in Q1 2026, the worst quarter since 2022, according to data from Glassnode.
Key takeaways:
-
Bitcoin dropped more than 20% after whales last realized losses at a comparable pace in 2022.
-
Long-term holders are also selling at a loss, indicating capitulation and potentially more downside in price.
BTC whales, sharks realized $30.91 billion loss in 2026
Realized Loss tracks the total dollar value of losses locked in when BTC is sold on-chain below its purchase price. In 2026, two significant wallet cohorts show signs of capitulation.
They are addresses holding 100–1,000 BTC, or “sharks” that often represent mid-sized funds or wealthy investors, and those holding 1,000–10,000 BTC, which are considered whale-sized entities.
In Q1, Bitcoin’s sharks (yellow) realized losses at an average of $188.5 million per day, while whales (orange) comprised another $147.5 million daily.

Combined, these large entities have locked in roughly $30.91 billion in realized losses so far in 2026.
Bitcoin’s realized losses in Q1 2026 for these high-net-worth entities rank among the most severe on record, trailing only Q2 2022’s roughly $396 million daily average.

In Q2 2022, BTC’s price dropped by over 50% and another 20% by the year’s end. It kept falling as the Terra collapse, Celsius freeze, and Three Arrows failure triggered panic across crypto, draining liquidity and confidence.

In 2026, pressure on Bitcoin has come from different sources, including Iran war-driven inflation fears, quantum-security risk, and broader stress in the AI-led risk trade.
Related: Bitcoin supply in profit heads to ‘true bear market’ levels
Therefore, whales and sharks are cutting their losses now because they expect the Bitcoin price to drop further as macro risks mount. This sentiment raises the odds of a 2022-like bear market, with a bottom in Q4 2026.
Bitcoin’s long-term holders add to downside risks
Another sign that Bitcoin’s sell-off may not be over comes from Glassnode’s Long-Term Holder Realized Loss chart, which tracks losses locked in by investors who held coins for more than six months before selling.
That figure remains elevated at around $200 million per day on a 30-day average basis since November 2025.

“A meaningful cooldown toward levels below $25M per day would represent a more compelling signal of exhaustion in selling pressure,” Glassnode analysts said in their weekly report published on Wednesday, adding:
“A prerequisite for the base formation that historically precedes a sustainable bull market transition.”
Together, these headwinds have already fueled calls for a deeper BTC correction, with some analysts pointing to the $40,000–$50,000 range as a possible bottom.
This article is produced in accordance with Cointelegraph’s Editorial Policy and is intended for informational purposes only. It does not constitute investment advice or recommendations. All investments and trades carry risk; readers are encouraged to conduct independent research before making any decisions. Cointelegraph makes no guarantees regarding the accuracy or completeness of the information presented, including forward-looking statements, and will not be liable for any loss or damage arising from reliance on this content.

Polymarket Pulls Missing US Pilot Market, Faces Questions Over Rules

Tasked to work on 2036 Olympic bid, 2030 Commonwealth Games: Leander Paes | Other Sports News

Mercedes brings steer-by-wire to production cars, and it’s a big shift


-

 NewsBeat2 days ago
Steven Gerrard disagrees with Gary Neville over ‘shock’ Chelsea and Arsenal claim | Football
-

 Business1 day ago
No Jackpot Winner and $194 Million Prize Rolls Over
-
Entertainment5 days ago
Fans slam 'heartbreaking' Barbie Dream Fest convention debacle with 'cardboard cutout' experience
-

 Fashion15 hours ago
Weekend Open Thread: Spanx – Corporette.com
-

 Crypto World3 days ago
Gold Price Prediction: Worst Month in 17 Years fo Save Haven Rock
-

 Tech5 days ago
The Pixel 10a doesn’t have a camera bump, and it’s great
-
 Entertainment6 days ago
Lana Del Rey Celebrates Her Husband’s 51st Birthday In New Post
-
Crypto World4 days ago
Dems press CFTC, ethics board on prediction-market insider trades
-

 Tech5 days ago
Avatar Legends: The Fighting Game comes out in July and it looks pretty slick
-

 Sports4 days ago
Tallest college basketball player ever, standing at 7-foot-9, entering transfer portal
-

 Fashion6 days ago
Amazon Sundays: Soft Spring Layers
-

 Tech4 days ago
EE TV is using AI to help you find something to watch
-

 Business2 days ago
Login and Checkout Issues Spark Merchant Frustration
-

 Tech6 days ago
Elon Musk’s last co-founder reportedly leaves xAI
-

 Tech4 days ago
How to back up your iPhone & iPad to your Mac before something goes wrong
-

 Fashion5 days ago
The Best Spring Trends of 2026
-

 Politics5 days ago
Should Trump Be Scared Strait?
-

 Crypto World4 days ago
U.S. rule change may open trillions in 401(k) funds to crypto
-

 Tech5 days ago
Apple will hide your email address from apps and websites, but not cops
-

 Tech4 days ago
Flipsnack and the shift toward motion-first business content with living visuals
You must be logged in to post a comment Login